

Abstract
The p85α regulatory subunit of class IA phosphoinositide 3-kinases (PI3K) is derived from the Pik3r1 gene, which also yields alternatively spliced variants p50α and p55α. It has been proposed that excess monomeric p85 competes with functional PI3K p85-p110 heterodimers. We examined embryonic stem (ES) cells with heterozygous and homozygous disruptions in the Pik3r gene and found that wild type ES cells express virtually no monomeric p85α. Although, IGF-1-stimulated PI3K activity associated with insulin receptor substrates was unaltered in all cell lines, p85α-null ES cells showed diminished protein kinase B activation despite increased PI3K activity associated with the p85β subunit. Furthermore, p85α-null cells demonstrated growth retardation, increased frequency of apoptosis, and altered cell cycle regulation with a G0/G1 cell cycle arrest and up-regulation of p27KIP, whereas signaling through CREB and MAPK was enhanced. These phenotypes were reversed by re-expression of p85α via adenoviral gene transfer. Surprisingly, all ES cell lines could be differentiated into adipocytes. In these differentiated ES cells, however, compensatory p85β signaling was lost in p85α-null cells while increased signaling by CREB and MAPK was still observed. Thus, loss of p85α in ES cells induced alterations in IGF-1 signaling and regulation of apoptosis and cell cycle but no defects in differentiation. However, differentiated ES cells partially lost their ability for compensatory signaling at the level of PI3K, which may explain some of the defects observed in mice with homozygous deletion of the Pik3r1 gene.
Phosphoinositide 3-kinase (PI3K)1 generates phosphorylated phosphoinositides (PI), which serve as crucial second messengers for a wide range of biological functions including mitogenesis, survival, differentiation, and cytoskeletal organization. PI3Ks are divided in three major classes according to substrate specificity, amino acid sequence, and homology of their lipid kinase domains. Class IA PI3K phosphorylates phosphatidylinositol (PtdIns), PtdIns 4-phosphate, and PtdIns 4,5-bisphosphate and are active as heterodimers consisting of regulatory and catalytic subunits. Activation of class 1A PI3K occurs by receptor-tyrosine kinases like the insulin-like growth factor-1 (IGF-1) receptor either by direct binding to tyrosine-phosphorylated pYMXM and pYXXM motifs of the IGF-1 receptor β-chain and insulin receptor substrates (IRS) (1-4).
There are multiple regulatory and catalytic subunits of class 1A PI3K. These regulatory subunits are derived from three different genes and can be classified according to their molecular structure. The full-length regulatory subunits are derived from distinct genes, the Pik3r1 (p85α) and Pikr2 (p85β) genes and are comprised of an NH2-terminal SH3 domain and a BCR homology region flanked by two proline-rich sites (1-4). In addition, the Pik3r1 gene yields smaller splicing variants of p55kDa (p55α; also called AS53) and 50 kDa (p50α) (5-7). Another short regulatory subunit is p55γ; this is structurally similar to p55α but derived from a different gene (8). Both p85α and p85β are ubiquitously expressed, though p85α appears to predominate in most tissues. The shorter regulatory isoforms have a more limited expression indicating cell type-specific roles (5-9).
Recent studies indicate a complex regulation of PI3K activity by regulatory isoforms. In the classical model, p85α serves as an adaptor and activator of heterodimeric PI3K holoenzyme by binding to phosphorylated receptor-tyrosine kinases and IRS proteins (1-4). Recently, we have shown that monomeric regulatory subunits not associated with catalytic subunits may exist and thus act as inhibitors of PI3K activation (10, 11). Thus, a reduction of the amount of either p85α or p85β may result in increased activation of PI3K. The targeted deletion of full-length p85α with preserved expression of p50α and p55α results in increased insulin sensitivity (12). A similar phenotype of increased insulin sensitivity is also observed in mice lacking p85β (13). Likewise, mice with a heterozygous-targeted deletion of all three isoforms of the Pik3r1 gene p85α, p55α, and p50α exhibit improved insulin signaling and protection from the development of diabetes (14, 15). These results suggest an inhibitory action of PI3K regulatory subunits upon PI3K activation, which may be explained by formation of p85α monomers, allosteric inhibition of catalytic isoforms by regulatory subunits, and tyrosine phosphorylation of p85α at tyrosine 688 (16-18).
In summary, current models of PI3K activation suggest a dual role for p85α as a positive and negative regulator of p85α/p110α heterodimeric PI3K depending upon the relation of regulatory and catalytic isoforms in a given cell type. These results prompted us to examine signaling by IGF-1 in embryonal stem (ES) cells with a heterozygous and homozygous deletion in the Pik3r1 gene coding for p85α, p55α, and p50α. We characterized ES cells as a model of low expression of p85α compared with catalytic subunits resulting in the virtual absence of monomeric regulatory isoforms. Loss of p85α in ES cells induced increased PI3K activation associated with p85β, increased apoptosis and alterations in cell cycle, but no defects in differentiation. However, when ES cells with a loss of p85α were differentiated, they partially lost their ability for compensatory signaling at the level of PI3K.
EXPERIMENTAL PROCEDURES
Materials
Silica-gel thin layer chromatography plates were obtained from Merck (Darmstadt, Germany), protein G-agarose was from Santa Cruz Biotechnology (Santa Cruz, CA). Nitrocellulose paper (Optitran BA-S85) was from Schleicher and Schuell (Keene, NH), [γ-32P]ATP was from Amersham Biosciences. Recombinant IGF-1 was from Bachem (Bubendorf, Switzerland). 5-Bromodeoxyuridine (Brd-Urd) incorporation ELISAs were from Roche Molecular Biochemicals. New England Biolabs (Beverly, MA) supplied the phosphospecific antibodies for serine 473 and threonine 308 of protein kinase Bα/Akt1 (PKBα), serine 133 of cAMP responsive element binder (CREB), serine 411 of p70S6K, threonine 421/serine 424 of p70S6K, serine 71 of cdc42, serine 308, threonine 382, threonine 383 of phosphatase and tensin homologue deleted on chromosome ten (PTEN), serine 795 of retinoblastoma protein (Rb), and serine 21/9 of glycogen synthase kinase 3α/β (GSK-3), GSK-3α/β cross-tide protein along with respective control antibodies for non-phosphorylated kinases, the p27KIP and poly(ADP-ribose) polymerase (PARP) antibodies, as well as enhanced chemiluminescence reagents. Antibodies for growth factor bound-2 associated binder-1 (Gab-1), insulin receptor substrate (IRS) IRS-1, IRS-2, p110α, p110β, monoclonal phosphotyrosine (pY), and PKB isoforms α, β, and γ were from Upstate Biotechnology (Lake Placid, NY). For the detection of p85α we applied an antibody raised against the NH2-terminal SH2 of p85α (Upstate Biotechnology), which recognizes p85α, p55α, and p50α in immunoblots and exhibits minimal cross-reaction to p85β in immunoprecipitation experiments. Antibodies for phosphorylated mitogen-activated protein kinases (MAPK; p44/p42) ERK-1, and ERK-2 (pERK Tyr204), control ERK antibodies and p110pan antibodies were from Santa Cruz Biotechnology. The monoclonal antibody for p85β (clone T12) was obtained from DPC (Bad Nauheim, Germany), and the staining kit for β-galactosidase expression was from Invitrogen (Groningen, Netherlands). Reagents for SDS-PAGE were from Bio-Rad (Hercules, CA), cell culture reagents were from Invitrogen (Karlsruhe, Germany), and all other chemicals were from Sigma.
Cell Culture
ES cells lines were grown as previously described (19) in high glucose Dulbecco’s modified Eagle medium (DMEM) supplemented with 10% fetal bovine serum, 10 mm HEPES, 50 μm β-mercaptoethanol, non-essential amino acids, 1000 units/ml leukemia inhibitory factor (LIF), 100 IU/ml penicillin, and 100 μg/ml streptomycin at 37 °C in a humidified (5% CO2, 95% air) atmosphere. Genotypes of wild type (+/+), heterozygous knockout (+/−), and homozygous knockout (−/−) ES cells were verified by PCR with primers for the wild type and mutated alleles (15).
BrdUrd Incorporation
Cells were seeded at a density of 3 × 10³ in 96-well plates, grown for 24 h in regular medium, washed once with 10 mm phosphate-buffered saline (pH 7.4) and subsequently starved for 24 h. They were then stimulated with IGF-1 for 24 h in DMEM medium without serum. During the last 6 h of stimulation, 20 μl of a BrdUrd solution was added, and the ELISA (20) was performed as suggested by the manufacturer.
DNA Fragmentation Assay
To determine the frequency of apoptosis, ES cells were grown for 48 h in 24-well plates, starved for 24 h, and then stimulated for 24 h. Cells were lysed, DNA was precipitated, and 10 μg of DNA were separated on a 1.5% agarose gel.
Northern Blotting
10 μg of total RNA was separated in a 1.5% denaturing agarose gel and transferred to nitrocellulose membranes by capillary transfer. Northern blots were hybridized with 32P-labeled cDNA probes as previously described (21). The membranes were washed in 2× saline sodium citrate (SSC), 0.1% Triton X-100 for 2× 20 min at room temperature, and then in 0.2× SSC, 0.1% Triton X-100 for 2× 10 min at 55 °C. Blots were exposed overnight with intensifier screens. The generation of cDNA probes for PI3K regulatory and catalytic isoforms was as described previously (9, 21).
Cell Cycle Analysis
ES cells were grown to 60% confluence, washed once with 10 mm phosphate-buffered saline, serum-starved overnight and then stimulated with IGF-1 for 24 h. Subsequently, the cells were gently trypsinized and fixed in 70% ethanol for 2 h and then washed in phosphate-buffered saline. DNA was stained by the addition of 0.1% Triton X-100, 200 μg/ml DNase-free RNase, and 20 μg/ml propidium iodide. Cell cycle detection was performed on a Becton Dickinson FACS SCAN cell counter at 488-nm wavelength excitation and 600-nm detection. Data were analyzed with Cell Quest and ModFitLT V2.0 software.
Adipocyte Differentiation
ES cells were grown to 80% confluence, trypsinized, and subsequently grown in normal DMEM with the addition of LIF in bacterial grade dishes with gentle shaking for 48 to achieve the formation of aggregates termed embryoid bodies. Embryoid bodies were then replanted onto cell culture dishes and cultivated in DMEM without LIF and the addition of 2 nm triiodothyronine and 85 nm insulin as previously described (19). After 14 days, cells were harvested or stained with oil red for the detection of adipocytes.
Transreporting system for Elk1 and CREB Phosphorylation
ES cells were grown for 48 h in normal medium in 6-well plates until they reached 60–80% confluency. Cells were then washed twice with phosphate-buffered saline, transfected with luciferase reporter gene (pFR-Luc), and either Elk1 (pFA-2-Elk1) or CREB (pFA2-CREB) transactivator domains (all from Stratagene, La Jolla, CA) by lipid-based transfection (Pfx-6) for 8 h in DMEM without serum. Subsequently, cells were grown in normal DMEM and then stimulated for 16 h in DMEM containing 1% fetal bovine serum and 10 nm IGF-1. Cells were lysed in luciferase assay buffer (Stratagene), and luciferase activity was determined (22).
Immunoprecipitation and Immunoblotting
ES cells were starved for 12 h and were then equilibrated for another 12 h in indicated glucose concentrations. One hour prior to stimulation, the stimulation medium was changed. Cells were lysed after stimulation in ice-cold lysis buffer (1% Triton X-100, 10% glycerol, 50 mm Hepes pH 7.4, 100 mm sodium pyrophosphate, 100 mm sodium fluoride, 10 mm EDTA, 5 mm sodium vanadate, 10 μg/ml aprotinin, 5 μg/ml leupeptin, 1.5 mg/ml benzamidine, and 34 μg/ml phenylmethylsulfonyl fluoride), sonicated for 15 s, and insoluble material was removed by centrifugation at 15,000 rpm in a microcentrifuge for 10 min. For immunoprecipitation, 5 μg of antibodies and 40 μl of a 50% protein G-agarose slurry were added to 500–1000 μg of proteins for 12 h. The washed immunoprecipitates or 50–100 μg of protein lysate were separated by 10% SDS-PAGE, Western-transferred on nitrocellulose membranes, and immunoblotted as previously described (21). Protein bands were visualized with enhanced chemiluminescence and quantified using Gelscan 3D software (BioSciTec, Marburg, Germany; Ref. 22).
PI3K Activity
Immune-complexed PI3K activity was determined as previously described (21, 22). Immune complexes were incubated in a 55-μl reaction mixture containing 440 μm ATP, 5 μCi of [γ-32P]ATP, 10 mm MgCl2, and 5 μg of phosphatidylinositol for 20 min at room temperature. Reactions were stopped by the addition 20 μl of 8 n HCl and 160 μl of CHCl3/methanol (1:1). The organic phase was removed by centrifugation and applied to silica gel thin layer chromatography plates, developed in CHCl3/CH3OH/H2O/NH4OH (60:47:11.3:2), dried, and visualized by autoradiography. The band representing phosphatidylinositol 3-phosphate was quantified as described (21, 22).
Adenoviral Gene Transfer
ES cells were grown in normal ES medium to 60% confluency. Adenovirus at indicated multiplicity of infection (MOI) (10, 23) was added to the cells in medium without serum for 1 h, which was exchanged with normal ES medium for 36 h. The ES cells were then serum-starved for 12 h and subsequently subjected to various assays.
RESULTS
Phenotype of ES Cells with a Disruption of the Pik3r1 Gene
ES cells contain an easily detectable amount of p85α by immunoblotting in wild type (+/+) cells, and this was reduced by 50% in heterozygous knockout (+/−) cells and was undetectable in homozygous knockout (−/−) ES cells (Fig. 1A). The alternatively spliced isoforms p55α and p50α were not detected in wild type and the heterozygous or homozygous p85α knockout ES cells (Fig. 1A). IRS-1, IRS-2, PI3K regulatory subunit p85β (data not shown), all p110 catalytic isoforms p110α, p110β, and p110γ (p110pan; Fig. 1B), and p110β (data not shown) demonstrated no apparent alterations in expression levels between the different cell lines as did CREB, MAPKs p42/p44, PKB, GSK-3, cdc42, and Rb (data not shown). Northern blotting with a cDNA probe specific for mouse p85β (9) revealed a slight decrease of p85β transcripts in (−/−) cells (Fig. 1C).
Fig. 1. Characterization of Pik3r wild-type (+/+), heterozygous (+/−), and homozygous (−/−) knockout stem cells.
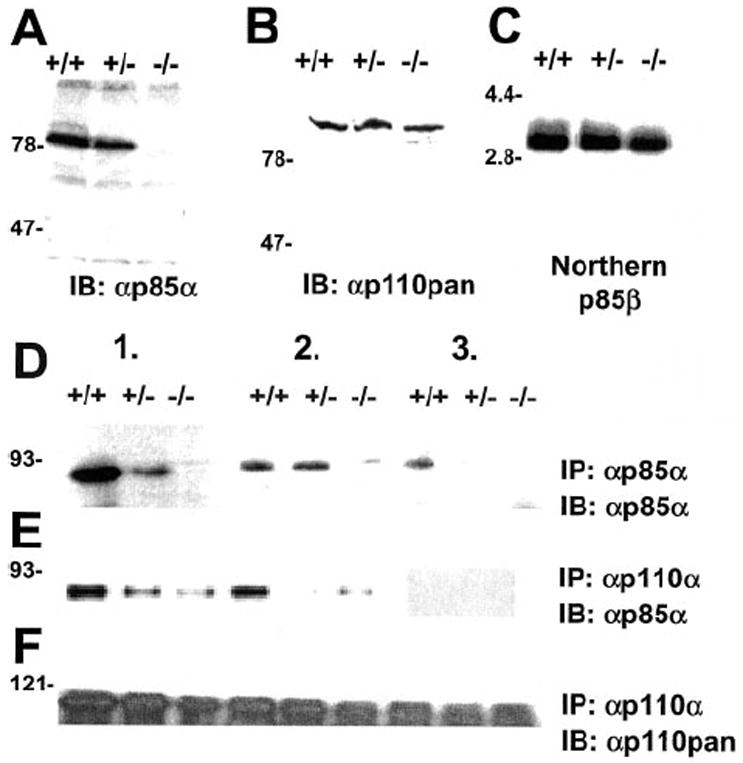
A, expression of p85α in stem cells of each genotype. B, expression of all isoforms of p110 catalytic subunits demonstrated by a pan-p110 antibody. Cell lysates were subjected to immunoblotting with indicated specific antibodies. C, expression of p85β RNA in cells of each genotype. Equal amounts of total RNA was subjected to Northern blotting and hybridized with a cDNA probe specific for p85β. D–F, serial immunodepletion of p85α (D and E) and p110 (F) using antibodies for p85α and p110. ES cells were starved for 12 h and stimulated with 10 nm IGF-1 for 10 min. Equal amounts of cell lysates were subjected to three rounds of immunoprecipitation with antibodies for p85α (D and F) or p110α (E) followed by immunodetection with p85α (D and E) and p110α and p110β (p110pan; F).
The stoichiometric balance of regulatory and catalytic subunits of PI3K influences signaling in a given cell type (10, 11). Therefore, we examined the stoichiometry of regulatory and catalytic isoforms in ES cells stimulated with IGF-1 by serial immunoprecipitations with antibodies to p85α and p110α/β. A serial immunoprecipitation of ES cell lysates with antibodies to p85α resulted in the almost complete depletion of p85α by the third immunoprecipitation round in wild type cells (Fig. 1D), which was accompanied by a concomitant depletion of phosphorylated IRS isoforms (data not shown). Similar results were obtained by serial immunoprecipitations using a mixture of p110α and p110β antibodies depleting completely p85α (Fig. 1E) and phosphorylated IRS proteins (not shown). In contrast, serial immunoprecipitation of p110 was incomplete in the third round (Fig. 1F), suggesting that levels of p110α and p110β exceed the level of p85α, which is low in ES cells with virtual no expression of monomeric p85α and no residual association of p85α with IRS proteins.
Function of Pik3r1 Gene in ES Cells in Signaling to and by PI3K
Activation of PI3K by IGF-1 occurs following phosphorylation of IRS isoforms and association of the PI3K regulatory isoforms with phosphotyrosines residues. We performed immunoblotting with phosphotyrosine antibodies after immunoprecipitation with antibodies for pY, IRS-1, and IRS-2. No alterations were detected in phosphorylated IRS isoforms following stimulation with IGF-1 (Fig. 2A). As expected, in ES cells with a reduction or deletion of p85α, binding of phosphorylated IRS proteins to p85α (Fig. 2B), and also p110α/β catalytic isoforms was reduced (data not shown). These results indicated diminished binding of PI3K heterodimer to phosphorylated IRS proteins in ES cells with a deletion in the Pik3r1 gene. To verify these results, we examined the binding of p85α to IRS proteins and p110 catalytic isoforms by immunoprecipitations with specific antibodies followed by anti-p85α immunoblots (Fig. 2C). In analogy to the previous experiments, we found that a deletion of p85α resulted in reduced binding to tyrosine-phosphorylated proteins, IRS-1, IRS-2, p110α, and p110β (Fig. 2C). These results indicated that phosphorylation of IRS proteins by IGF-1 was unaltered in the different cell lines. However, a reduction in the amount or p85α by heterozygous and homozygous deletion of the Pik3r1 gene resulted in reduced binding of regulatory and catalytic subunits to phosphorylated IRS isoforms.
Fig. 2. Effect of disruption of the Pik3r1 gene on IGF-1-induced IRS phosphorylation and IRS-mediated PI3K activation.
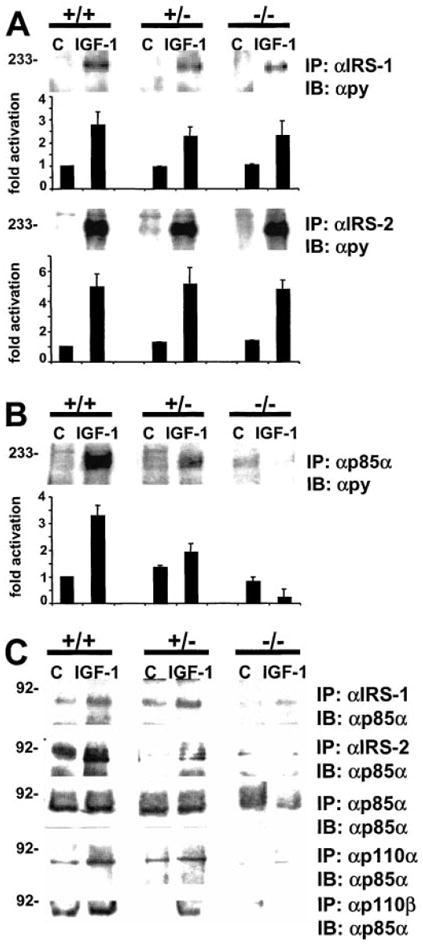
A, phosphorylation of IRS-1 and IRS-2. Cells were starved for 12 h and stimulated with 10 nm IGF-1 for 10 min. Equal amounts of cell lysates were subjected to immunoprecipitation with IRS-1 and IRS-2 antibodies followed by immunodetection with pY antibodies. B, recruitment of phosphorylated IRS-isoforms to p85α. In A and B, top panels show representative blots and in the lower panels, each bar represents the mean ± S.D. of three independent experiments. They are expressed assigning a value of 1 to non-stimulated +/+ cells. C, recruitment of p85α to IRS proteins and catalytic PI3K isoforms. Cells were treated as in A followed by immunoprecipitation with antibodies to p85α and immunodetection with indicated antibodies. Shown are typical blots of n = 3. Abbreviations: +/+, wild-type; +/−, heterozygous p85α knockout; −/−, homozygous p85α knockout.
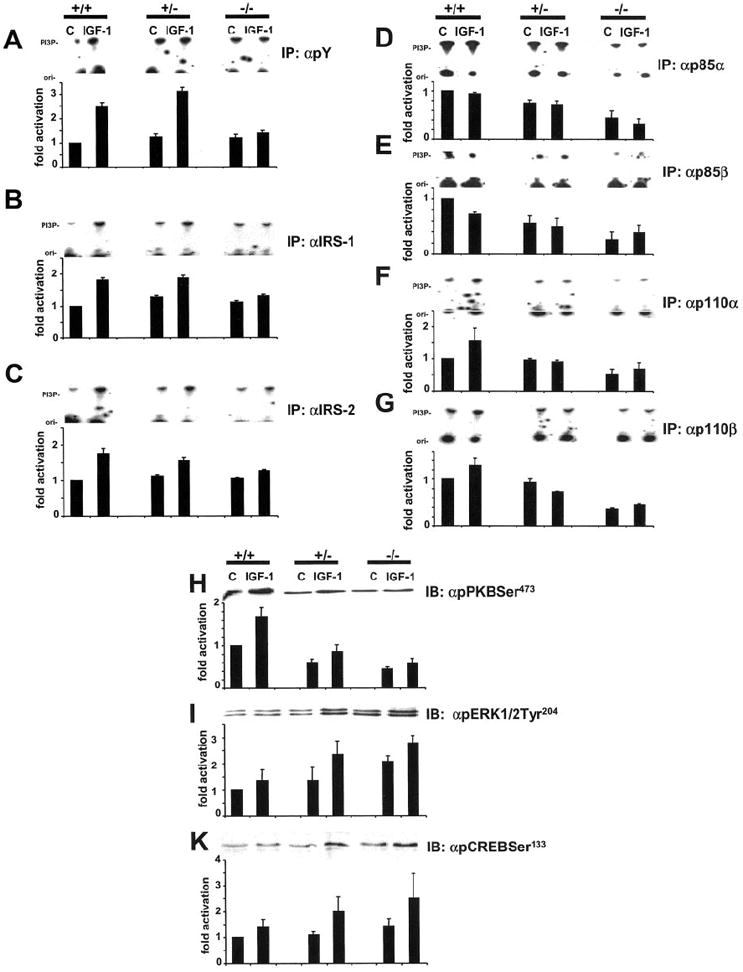
To directly examine the effects of a deletion of the Pik3r1 gene upon PI3K activation by IGF-1, lipid kinase activity associated with pY, IRS proteins, and the various regulatory and catalytic subunits of PI3K was determined. Surprisingly, in all cell lines, basal and IGF-1-stimulated PI3K activity associated with pY, IRS-1, and IRS-2 was not different between wild type, +/− and −/− cell lines (Fig. 3, A–C) while IGF-1 failed to stimulate PI3K activity associated with Gab-1 in all cells (Fig. 3D). As expected, PI3K activity associated with p85α was largely reduced in −/− cells, but a small signal persisted possibly due to minor cross reaction of the p85α antibody with p85β (Fig. 3E). ES cell with a heterozygous deletion in the Pik3r1 gene showed only a modest reduction in PI3K activity associated with p85α. Conversely, PI3K activity associated with the closely related p85β was up-regulated in +/− and −/− cells (Fig. 3F). There were no alterations in lipid kinase activity associated with catalytic subunits p110α and p110β (Fig. 3, G and H). Thus, increased p85β-associated PI3K activity appears to compensate for the deletion of the p85α at the level of PI3K.
Fig. 3. Effect of disruption of the Pik3r1 gene on IGF-1-stimulated PI3K activity.
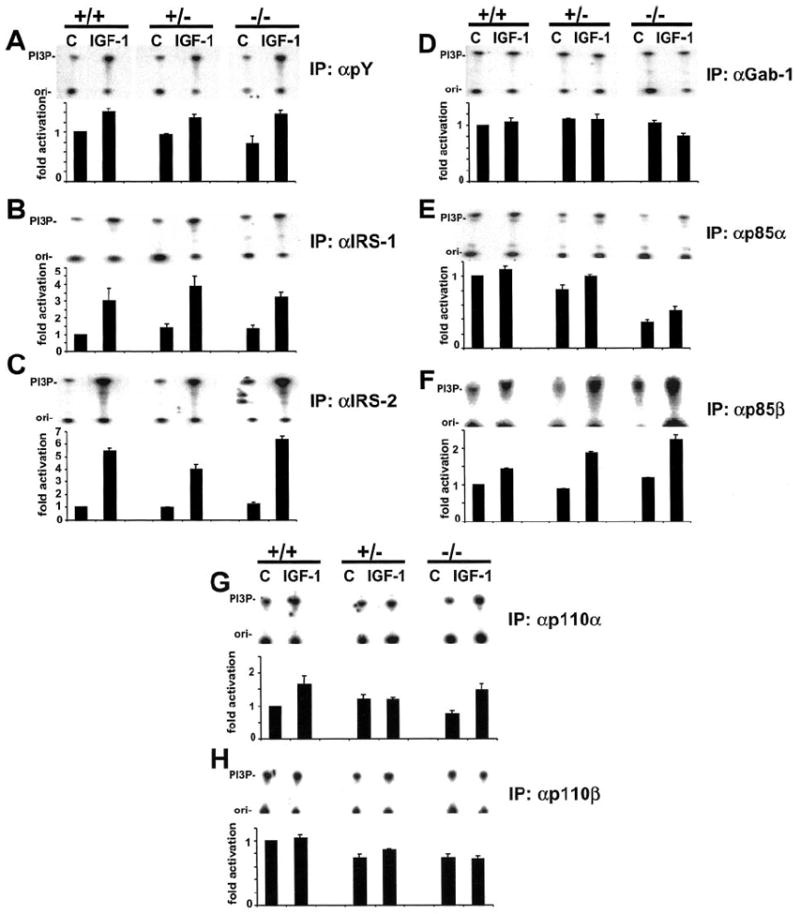
Cells were starved for 12 h and stimulated with 10 nm IGF-1 for 10 min. Equal amounts of cell lysates were subjected to immunoprecipitation with antibodies to pY (A), IRS-1 (B), IRS-2 (C), Gab-1 (D), p85α (E), p85β (F), p110α (G), and p110β (H). 32P incorporation into phosphatidylinositol 3-phosphate was quantified after separation by thin layer chromatography using densitometry. The band shown represents phosphatidylinositol 3-phosphate (PI3P). Top panels show representative blots and in the lower panels, each bar represents the mean ± S.D. of 3–5 independent experiments. They are expressed with assigning a value of 1 to non-stimulated +/+ cells. Abbreviations: +/+, wild-type; +/−, heterozygous p85α knockout; −/−, homozygous p85α knockout.
Function of Pik3r1 Gene in Signaling Downstream and Parallel to PI3K
Phosphorylated PtdIns generated by PI3K have been shown to act as second messengers upon a number of downstream signaling molecules. To elucidate whether a disruption in the Pik3r1 gene induced alterations in downstream signaling by PI3K, phosphorylation of PKB, cdc42, GSK-3, and the transcription factor CREB was examined. Although p85β appeared to compensate for deletion of p85α at the level of PI3-K, phosphorylation of PKB in response to IGF-1 stimulation in +/− and −/− ES cells was reduced at serine 473 and threonine 308 corresponding to activation of the serine-threonine kinase (24) compared with wild type ES cells (Fig. 4, A and B), indicating that p85β was less efficient in stimulating these targets than p85α. In contrast to the phosphorylation pattern of PKB, phosphorylation of its downstream target GSK3α/β by IGF-1 was comparable in all cell types (Fig. 4C). Another target of PKB is the transcription factor CREB, which is activated by phosphorylation at serine 133. Interestingly, both basal and IGF-1 stimulated phosphorylation of CREB was increased in +/− and −/− cells (Fig. 4E). A similar pattern of elevated phosphorylation and activation in knockout cells was also observed at the level of MAP kinases ERK1 and ERK2 (Fig. 4D). The increased activation of CREB and MAP kinases was also elucidated with an increased activation of CREB and Elk-1 in +/− and −/− cells by a luciferase-based transactivation system (Fig. 4G). These results indicate a differential dependence of downstream targets of PI3K by a deletion in the Pik3r1 gene. No difference in expression (Fig. 4F) and phosphorylation of PTEN at serine 308/threonine 382/threonine 383 (data not shown) was observed in all three cell types implying that PTEN is not involved in compensatory signaling in cells with a deletion in the Pik3r1 gene.
Fig. 4. Function of Pik3r gene in signaling downstream and parallel to PI3K.
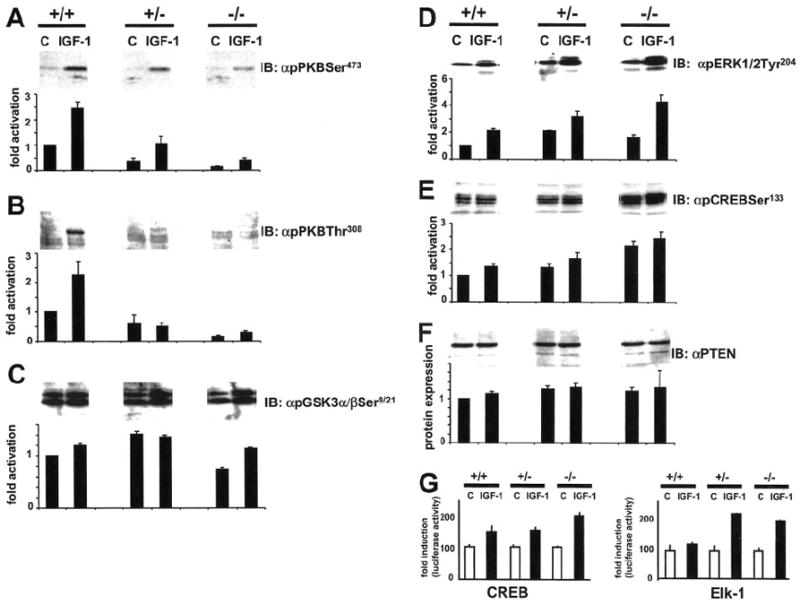
A–F, effect of disruption of the Pik3r1 gene on PI3K-dependent and independent signaling and expression of PTEN. Cells were starved for 12 h and stimulated with 10 nm IGF-1 for 10 min. Equal amounts of cell lysates were subjected to immunoblotting with antibodies for activated PKB (A and B), GSK-3 (C), ERKs1/2 (D), CREB (E) as well as non-activated PTEN (F) and quantified using densitometry. Top panels show representative blots and in the lower panels, each bar represents the mean ± S.D. of three independent experiments. They are expressed assigning a value of 1 to non-stimulated +/+ cells. Abbreviations: +/+, wild-type; +/−, heterozygous p85α knockout; −/−, homozygous p85α knockout. G, activation of transcription factors CREB and Elk-1 by IGF-1 in wild-type and knockout cell lines. ES cell lines were transfected with CREB and Elk-1 transactivator plasmid as described under “Experimental Procedures.” CREB and Elk-1 phosphorylation were determined by the luciferase activity of a cotransfected reporter plasmid. ES cells were stimulated with 10 nm IGF-1 for 16 h. Each bar represents the mean ± S.D. of 4–5 independent experiments.
Function of Pik3r1 Gene in Proliferation, Apoptosis, and Cell Cycle Regulation
Since one of the major functions of PI3K is the regulation of cellular growth and protection from apoptosis, we examined proliferation rate, frequency of apoptosis, and regulation of cell cycle in ES cells with a deletion in the Pik3r1 gene. The deletion of the p85α gene caused a reduction in basal and IGF-1-stimulated rate of DNA synthesis in p85α +/− and −/− cells (Fig. 5A). Conversely, we observed elevated frequency of apoptosis in p85α +/− und −/− ES cells, demonstrated by increased DNA laddering (Fig. 5B) and elevated cleavage of PARP (Fig. 5C). Analysis of basal and IGF-1-stimulated ES cells revealed that these alterations were due to complex changes in cell cycle regulation in the different cell lines. Non-stimulated wild type ES cells are rapidly dividing with ~45% in S-phase. This was increased in +/− cells to 54% and reduced to 39% in −/− cells. In wild type ES cells, 38% of cells were in G0/G1 phase, which was reduced to 33% in p85α +/− and increased to 46% in −/− cells. Thus, ratios of G0/G1 and S-phases were reversed between p85α +/+ and −/− cells (Fig. 5D), and −/− cells appeared to be locked in G0/G1 phase. Stimulation of ES cell lines with IGF-1 prompted a further increase in ratio of S-phase in all cell lines, which was most pronounced in +/− ES cells and blunted in −/− ES cells (Fig. 5D). Cell cycle analysis of sub-G0/G1 cells was applied to estimate the absolute levels of apoptotic cells in the different cell lines. In a typical experiment of n = 3, apoptotic cells constituted 3.4% of all counted cells in non-stimulated +/+ cells, 5.12% in + − cells, and 9.5% in −/− cells. IGF-1 stimulation reduced the percentage of apoptotic cells to 3.17% in +/+ cells, to 3.3% in +/− cells and to 7.06% in −/− cells.
Fig. 5. Effect of disruption of the Pik3r1 gene on regulation of proliferation, apoptosis, and cell cycle regulation.
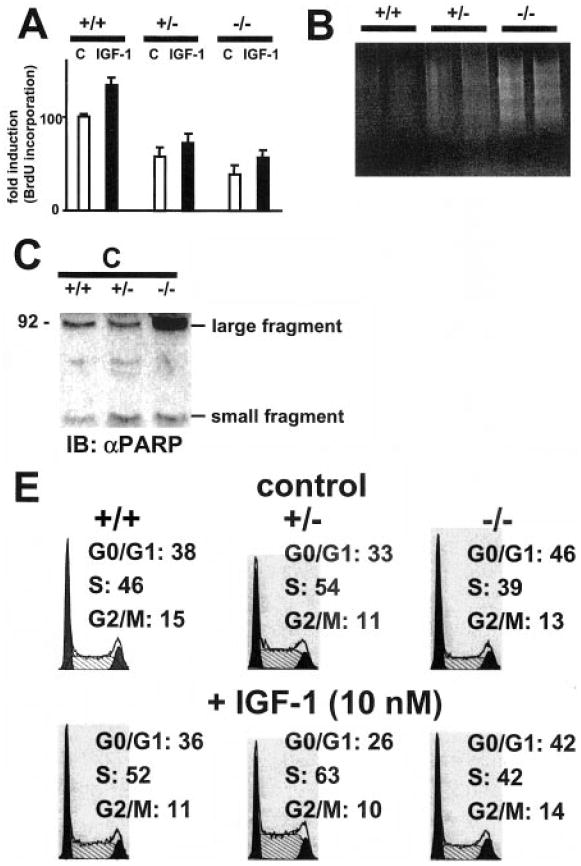
A, proliferation of ES cell lines stimulated with IGF-1. ES cells were starved overnight and stimulated for 24 h with 10 nm IGF-1. DNA synthesis was measured by adding BrdUrd for the last 6 h of the stimulation period and subsequent detection by ELISA. Each bar represents the mean ± S.D. of four independent experiments. B, increased DNA laddering in ES cell lines with a disruption in the Pik3r1 gene. ES cells were starved for 24 h without serum and DNA was isolated and separated by an 1% agarose gel. Shown is a typical result of n = 3. C, increased cleavage of poly (ADP-ribose) polymerase in ES cells with a disruption in the gene for Pik3r1 gene. ES cells were starved overnight, and equal amounts of cell lysates were subjected to immunoblotting with an antibody recognizing cleaved small (24 kDa) and large (89 kDa) fragments of PARP. Shown is a representative blot of n = 3. D, cell cycle regulation in ES cell lines stimulated with IGF-1. ES cells were starved for 24 h and subsequently stimulated for 24 h with IGF-1. Cells were gently trypsinized, fixed in 70% ethanol, stained with propidium iodide and analyzed by FACS. Shown are representative results of n = 3. Abbreviations: +/+, wild-type; +/−, heterozygous p85α knockout; −/−, homozygous p85α knockout.
Signaling and Cell Cycle Regulation by Adenoviral Re-expression of p85α in ES Cells with a Deletion in the Pik3r1 Gene
We applied adenoviral gene transfer (14, 22) to examine whether alterations in signaling and cell cycle regulation in ES cells with a deletion of the Pik3r1 gene could be reversed by re-expression of p85α. Using an adenovirus harboring the β-galactosidase (lacZ) gene and galactosidase staining, an MOI between 10 and 200 was sufficient to infect between 70 and 90% of ES cells. Using an MOI of 20 and 50 of pAdexp85αHA, p85α could be easily overexpressed in p85α +/+ cells and reconstituted or overexpressed in +/− and −/− cells (Fig. 6A). An MOI of 20 was sufficient to reconstitute p85α in +/− ES cells at comparable levels to lacZ infected +/+ ES cells, whereas an MOI of 50 was required in −/− ES cells (Fig. 6A). Overexpression and reconstitution of p85α in the different cells lines resulted in increased PKB phosphorylation (Fig. 6B). Similar levels of PKB phosphorylation was observed in lacZ-transfected +/+ ES cells compared with +/− and −/− cells infected with low and high MOIs of pAdexp85αHA, respectively (Fig. 6B). Interestingly, when an MOI > 50 was used in +/+ and +/− ES cells, overexpression of p85α inhibited PKB phosphorylation (data not shown). Re-expression of p85α reversed up-regulation of cyclin-dependent kinase inhibitor p27KIP in +/− and −/− ES cells (Fig. 6C) and increased phosphorylation of Rb (data not shown). Furthermore, we were able to demonstrate that re-expression of p85α decreased the up-regulated basal (Fig. 6C) and IGF-1-stimulated CREB phosphorylation in p85α +/− and −/− cells, and this was paralleled by reduced phosphorylation of ERKs1/2 (data not shown). Re-expression of p85α also reversed increased PARP cleavage in +/− and −/− cells (Fig. 6D) indicating that increased frequency of apoptosis in +/− and −/− cells was the result of a deletion of the Pik3r1 gene.
Fig. 6. Effect of adenoviral-mediated transient re-expression of p85α in ES cells with a disruption of the Pik3r1 gene upon signaling and regulation of apoptosis and cell cycle.
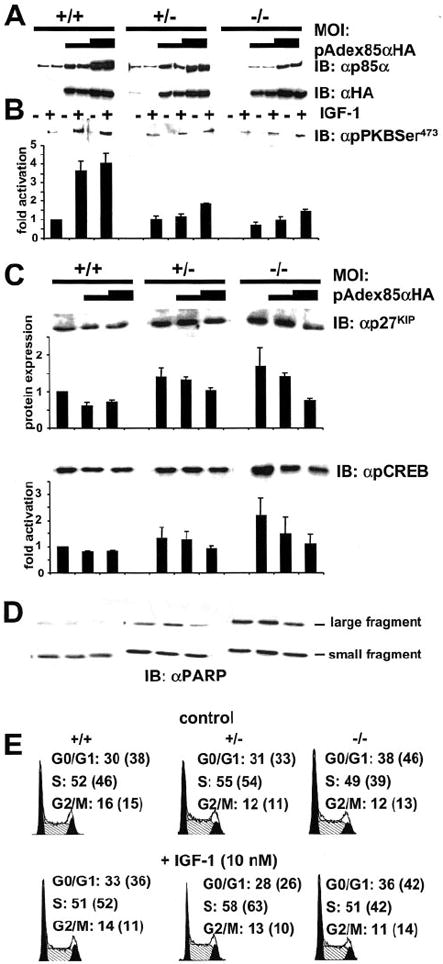
ES cells were infected with low and high multiplicity of infection of adenovirus coding for HA-tagged p85α(pAdex85αHA). ES cells were infected for 1 h, grown for additional 36 h and prepared for immunoblotting and cell cycle analysis as described under “Experimental Procedures.” A, re- and overexpression of p85α in different ES cell lines demonstrated by immunoblotting for p85α and HA tag of adenoviral-expressed p85α. B and C, phosphorylation of PKB in ES cell lines with reconstituted p85α (B). Equal amounts of cell lysates were immunoblotted with the indicated antibody and quantified using densitometry. Top panels show representative blots and in the lower panels, each bar represents the mean ± S.D. of three independent experiments. They are expressed assigning a value of 1 to stimulated +/+ cells. C, expression levels of p27KIP and basal phosphorylation of CREB in ES cell lines with re-expression of p85α. Quantification was performed as in panel B. D, PARP cleavage in ES cells with re-expression of p85α. E, cell cycle regulation of ES cell lines with reconstitution of p85α. ES cells were infected with high multiplicity of infection of pAdex85αHA and subsequently stimulated with IGF-1. Cell cycle analysis was performed as described under “Experimental Procedures.” Numbers in brackets indicated values of non-infected ES cell lines depicted in Fig. 5. Abbreviations: +/+, wild-type; +/−, heterozygous p85α knockout; −/−, homozygous p85α knockout.
The mechanism of alterations in cell cycle of ES cells was examined in +/+ cells by overexpressing p85α via infection of pAdexp85αHA with low MOI. In p85α +/− and −/− ES cells, p85α was reconstituted to similar levels as in native +/+ ES cells p85α by infection with low and high MOIs of pAdexp85αHA, respectively (Fig. 6E). Here, overexpression of p85α in +/+ ES cells induced a small increase in S-phase with a parallel reduction in G0/G1 and no change in G2/M in non-stimulated cells. No further increase in percentage of cells in S-phase was observed in +/+ ES cells stimulated with IGF-1. In p85α +/− cells, reconstitution of p85α caused no alterations in non-stimulated cells, whereas the percentage of ES cells in S-phase following IGF-1 treatment was reduced by re-expression of p85α. Reconstitution of p85α in −/− cells increased the percentage of cells in S-phase by 10% and reduced G0/G1 phase to similar levels as in non-infected +/+ cells (Figs. 5D and 6E) in non-stimulated ES cells. A similar reversal of cell cycle alterations by re-expression of p85α was also observed in −/− cells stimulated with IGF-1, which displayed a similar cell cycle as native +/+ cells stimulated with IGF-1 mainly by reduction of G0/G1-phase and elevation of S-phase (Fig. 6E). Analysis of sub-G0/G1 cells was used to assess alterations of apoptotic cells by over- and re-expression of p85α in the different non-stimulated cell lines compared with non-transfected cells. In a typical experiment of n = 3, overexpression of p85α in +/+ cells reduced the number of apoptotic cells from 3.17 to 2.28%. Reconstitution of p85α in +/− cells reduced the number of apoptotic cells from 5.12 to 3.64% and from 9.5 to 4.76% in −/− cells.
Function of Pik3r1 Gene in Adipocyte Differentiation of ES Cells
A role of PI3K has been implicated in the differentiation of preadipocytes to adipocytes (18, 25). To elucidate whether a deletion of the Pik3r1 gene resulted in altered adipocyte differentiation in vitro, ES cell were transformed to embryoid bodies, which were then cultured in differentiation media without LIF and the addition of T3 and insulin for 10–14 days. Oil red staining revealed that all cell lines could be differentiated into adipocyte-like cells with similar efficiencies of about 20%. The fat cells were concentrated in the embryoid bodies and scarce in outgrowing cells (Fig. 7, A and B) and were functionally active as indicated by expression of the ob gene product leptin (26) (Fig. 7C).
Fig. 7. Effect of disruption of the Pik3r1 gene on differentiation of ES cells into adipocytes.
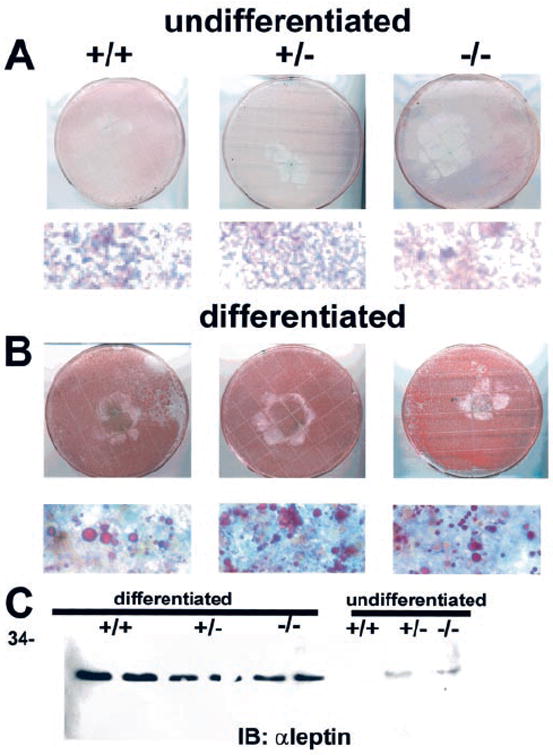
ES cells were differentiated into embryoid bodies and treated with normal medium without LIF (A) or a differentiation medium (B) containing T3 and insulin for 14 days. Cells were fixed and stained with oil red. Lower panels depict stained cells at higher magnification. C, detection of leptin in differentiated and undifferentiated ES cells. Equal amounts of cell lysates were subjected to immunoblotting with monoclonal leptin antibody. Shown is a representative blot. Abbreviations: +/+, wild-type; +/−, heterozygous p85α knockout; −/−, homozygous p85α knockout.
Function of Pik3r1 Gene in Signaling of Differentiated Adipocyte-like Cells
To assess whether a deletion of p85α induced similar defects in signaling in differentiated adipocyte-like cells compared with undifferentiated ES cells, PI3K activation by IGF-1 was examined at the level of IRS proteins and regulatory and catalytic subunits of PI3K (Fig. 8, A–G). In contrast to the unaltered signaling in undifferentiated ES cells (Fig. 3, A–C), PI3K activity association with phosphorylated signaling proteins (Fig. 8A), IRS-1 (Fig. 8B), and IRS-2 (Fig. 8C) was reduced in −/− ES cells, but not in +/− ES cells. These alterations were accompanied by reduced PI3K activity associated with p85α (Fig. 8D) in +/− and −/− ES cells similar to signaling by p85α in undifferentiated ES cells (Fig. 3E). However, in differentiated adipocyte-like ES cells, PI3K activity association with p85β (Fig. 8E) was not increased in +/− and −/− ES cells as it was in undifferentiated ES cells (Fig. 3F). Failure of compensatory signaling by p85β resulted in reduced PI3K activity associated with catalytic subunits p110α and p110β (Fig. 8, F and G). Interestingly, downstream signaling of PI3K was similar in differentiated and undifferentiated ES cells. Phosphorylation of PKB was reduced and phosphorylation of ERK1/2 and CREB by IGF-1 was increased in +/− and −/− ES cells (Fig. 8, H–K).
Fig. 8. Effect of disruption of the Pik3r1 gene on PI3K-dependent and -independent signaling in ES cells differentiated into adipocytes.
Cells were starved for 12 h and stimulated with 10 nm IGF-1 for 10 min. Equal amounts of cell lysates were subjected to immunoprecipitation with antibodies to pY (A), IRS-1 (B), IRS-2 (C), p85α (D), p85β (E), p110α (F), and p110β (G). PI3K assays were performed as described under “Experimental Procedures.” The band shown represents phosphatidylinositol 3-phosphate (PI3P). I–K, phosphorylation of PKB (H), ERK1/2 (I), and CREB (J) by IGF-1 in differentiated ES cells. Equal amounts of cell lysates were subjected to immunoblotting with indicated antibodies. Top panels show representative blots and in the lower panels, each bar represents the mean ± S.D. of 3–5 independent experiments. They are expressed assigning a value of 1 to non-stimulated +/+ cells. Abbreviations: +/+, wild-type; +/−, heterozygous p85α knockout; −/−, homozygous p85α knockout.
DISCUSSION
Signaling by PI3K is essential for a wide range of cellular functions. Recently, it has been shown that the p85 regulatory subunits of PI3K may act as activators or inhibitors of PI3K. Thus, when regulatory subunits are expressed at higher stoichiometric levels than catalytic subunits, the monomeric functionally p85 subunits may inhibit PI3K activation by competing with functionally active p85/p110 heterodimers for binding sites to phosphorylated IRS proteins (14). In line with these observations, a reduction of regulatory subunits by genetic deletion of the Pik3r1 or Pik3r2 genes can result in increased PI3K signaling and insulin sensitivity in mice and fibroblast cell lines, since in most insulin-sensitive tissues, p85α is stoichiometrically overexpressed compared with p110 catalytic subunits (9, 10-14). Here, we demonstrated that ES cells are a unique cellular model in which p85α is not overexpressed compared with p110 catalytic subunits. This stoichiometric imbalance prevents increased PI3K activation in ES cells with a heterozygous depletion of the Pik3r1 gene, because generation of functionally active p85α/p110 heterodimers is limited by the expression of p85α. Thus, interaction of p85α and p110 is almost saturated in ES cells and reduced in heterozygous and homozygous Pik3r1 gene knockout ES cells according to the deletion of the p85α gene. Furthermore, this phenotype prevents the binding of monomeric p85α to phosphorylated IRS-isoforms in IGF-1 stimulated ES cells as demonstrated by similar depletion kinetics using antibodies for p85α and catalytic p110 subunits. The special stoichiometry of excess p110 compared with p85α may also explain why we do not observe a marked reduction in p110 levels by the reduction of regulatory isoforms as described in other cell types with an excess of p85α (12). Since it not likely that free p110 monomers exist due to thermal instability (16), p85β may serve to stabilize p110 in ES cells.
The reduced formation of p85α/p110 heterodimers in heterozygous and homozygous Pik3r1 gene knockout cells explains decreased binding to phosphorylated IRS proteins following IGF-1 stimulation. Surprisingly, PI3K activity associated with IRS-1 and IRS-2 is not decreased in ES cells with a heterozygous or homozygous deletion in the Pik3r1 gene. Likewise, PI3K activity associated with p110α and p110β is approximately equal in all three cell lines. This experimental paradox may be partially explained by increased recruitment of p85β in cells with a reduction in p85α protein levels. Binding of phosphorylated IRS proteins to catalytic p110 subunits was decreased in +/− and −/− cells concomitantly to the reduction of p85α possibly reflecting the less efficient binding of p85β to IRS proteins. Interestingly, when ES cells were differentiated to adipocytes, PI3K activity associated with IRS and p110 proteins was reduced in homozygous Pik3r1 gene knockout cells. This phenomenon was associated with a decrease of p85β-associated PI3K activity in ES cells with a deletion in p85α. These results indicate that undifferentiated ES cells are able to compensate decreased p85α signaling by increase in PI3K activity of p85β, which is not preserved in differentiated ES cells.
Unaltered PI3K activation at the level of IRS and p110 catalytic isoforms in ES cells with a deletion in the Pik3r1 gene did not prevent a reduction in the phosphorylation of PKB, a major downstream target of PI3K. In contrast, GSK-3, which is activated by PI3K and also independently of PI3K by PKA (27), was equally phosphorylated by IGF-1 in all three cell lines. Whereas these results indicate a differential dependence of PKB and GSK-3 upon signaling by p85α-associated PI3K, we demonstrated that a reduction or loss of p85α induced up-regulation in the stimulation of the Ras-Raf-MAPK and the cAMP-dependent protein kinase (PKA)/CREB pathway. Thus, undifferentiated ES cells possess an enormous flexibility to compensate for the reduction of signaling by p85α, which is partially lost by differentiation. We were able to exclude alteration in the expression levels of PIP3 phosphatase PTEN (28, 29) as a possible mechanism of compensation for the loss of p85α.
Undifferentiated ES cells are rapidly growing cells with an about 50% S-phase even at starvation. The percentage of cells in S-phase was only decreased modestly by addition of PI3K inhibitor wortmannin to wild-type ES cells.2 In line with these observations, the growth rate of ES cells with a deletion in the Pik3r1 gene was modestly decreased, which indicates that the contribution of PI3K to proliferation of ES cell is only minor. This minor contribution may however change to a major dependence upon PI3K in embryonic and postnatal development of somatic cells as shown by embryonic and perinatal lethality of mice with a targeted disruption of the Pik3ca gene encoding p110α and the Pik3r1 gene encoding p85α, p55α and p50α, respectively (13, 30). We demonstrated reduced percentage of cells in S-phase and an increase in G0/G1 phase in p85α −/− cells under basal conditions and after stimulation with IGF-1 indicating that a deletion of the Pik3r1 gene induced a partial G0/G1 block, possibly by up-regulation of p27KIP1, a major inhibitor of G1 cyclin-dependent kinases (28, 31). Increased levels of p27KIP1 in Pik3r1 gene knockout cells may be explained by direct transcriptional regulation of the p27KIP1 gene by forkhead transcription factors, which are negatively regulated by the PI3K/PKB pathway (32). Unexpectedly, we demonstrated increased percentage of cells in S-phase in non-stimulated and IGF-1-stimulated ES cells with a partial reduction of p85α by a heterozygous deletion of the Pi3kr1 gene. Under normal conditions, an increased percentage of cells in S-phase should lead to increased BrdUrd incorporation. This, however was not observed in +/− ES cells possibly to increased frequency of apoptosis, which may reverse increased proliferation of cells by premature cell death. Increased frequency of apoptosis in +/− and −/− ES cells correlated with decreased PKB activation. Conversely, PKBα has been shown to be the major effector of a model of increased PI3K activity, the PTEN knockout ES cells (29). Thus, decreased PKB activation in Pik3r1 gene knockout ES cells may affect regulation of apoptosis by altering activation of PKB effectors such as BAD and FKHR (29, 33).
PI3K has been implicated in adipogenic and myogenic differentiation (34-36). Here, we demonstrated unaltered differentiation of wild-type and Pik3r1 gene-deleted ES cell lines to adipocytes by in vitro differentiation. Mice with a homozygous deletion of the Pik3r1 gene may survive for several weeks in an outbred background and show no morphological alterations implying that the Pik3r1 gene is not essential for adipocyte differentiation, which is in line with recent studies showing that brown adipocytes from Pik3r1 gene knockout animals are viable.3 We also noted in initial experiments that a fraction of ES cells with a deletion in the Pik3r1 gene differentiated spontaneously in myocytes depicting synchronized mechanical activity reminiscent of cardiac muscle cells2 indicating that p85α is not essential for myogenic differentiation.
Re-expression of p85α by adenoviral gene transfer was used to examine whether the phenotype of ES cells with a heterozygous and homozygous deletion in the Pik3r1 gene was caused by clonal variation or by the reduction or loss of p85α itself. Since we demonstrated that re-expression of p85α at similar levels as in wild-type cells was able to reverse the phenotype of +/− and −/− ES cells, clonal selection appears unlikely. Interestingly, we noted in pilot experiments that p85α could be easily overexpressed in all cell lines by adenoviral gene transfer using high MOIs between 100 and 200. When p85α was overexpressed in ES cells of all genotypes, it acted as a negative regulator of PKB activity in analogy to experiments performed in fibroblasts and L6 myotubes (12, 14). Thus, ES cells are an ideal cellular model to study the balance of different combinations of regulatory and catalytic subunits, which may provide further information upon the cellular complexity and physiology of signaling by class 1A PI3K.
Acknowledgments
We thank H. Schmidt for technical support.
Footnotes
This research was supported by Grant Ho 1762/2–1 from the Deutsche Forschungsgemeinschaft (to D. H.) and National Institutes of Health Grant GM41890 (to L. C. C.). Parts of this study are contained in the medical thesis of D. Hallmann.
The abbreviations used are: PI3K, phosphoinositide 3-kinase; BrdUrd, 5-bromodeoxyuridine; CREB, cAMP responsive element-binding protein; ES, embryonic stem; Gab-1, growth factor bound-2-associated binder-1; GSK-3, glycogen synthase kinase 3; IGF-1, insulin-like growth factor-1; IRS, insulin receptor substrate; LIF, leukemia inhibitory factor; MAPK, mitogen-activated protein kinase; MOI, multiplicity of infection; PARP, poly(ADP-ribose) polymerase; PI, phosphoinositides; PKB, protein kinase B/Akt; PtdIns, phosphatidylinositol; PTEN, phosphatase and tensin homologue deleted on chromosome ten; pY, phosphotyrosine; Rb, retinoblastoma protein; SSC, saline sodium citrate; HA, hemagglutinin; DMEM, Dulbecco’s modified Eagle’s medium; ELISA, enzyme-linked immunosorbent assay.
D. Hallmann and D. Hörsch, unpublished observations.
K. Ueki, unpublished results.
References
- 1.Fruman DA, Meyers RE, Cantley LC. Annu Rev Biochem. 1998;67:481–507. doi: 10.1146/annurev.biochem.67.1.481. [DOI] [PubMed] [Google Scholar]
- 2.Virkamaki A, Ueki K, Kahn CR. J Clin Investig. 1999;103:931–943. doi: 10.1172/JCI6609. [DOI] [PMC free article] [PubMed] [Google Scholar]
- 3.Katso R, Okkenhaug K, Ahmadi K, White S, Timms J, Waterfield MD. Annu Rev Cell Dev Biol. 2001;17:615–675. doi: 10.1146/annurev.cellbio.17.1.615. [DOI] [PubMed] [Google Scholar]
- 4.Fruman DA, Cantley LC. Semin Immunol. 2002;14:7–18. doi: 10.1006/smim.2001.0337. [DOI] [PubMed] [Google Scholar]
- 5.Fruman DA, Cantley LC, Carpenter CL. Genomics. 1996;37:113–121. doi: 10.1006/geno.1996.0527. [DOI] [PubMed] [Google Scholar]
- 6.Inukai K, Anai M, Van Breda E, Hosaka T, Katagiri H, Funaki M, Fukushima Y, Ogihara T, Yazaki Y, Kikuchi M, Oka Y, Asano T. J Biol Chem. 1996;271:5317–5320. doi: 10.1074/jbc.271.10.5317. [DOI] [PubMed] [Google Scholar]
- 7.Antonetti DA, Algenstaedt P, Kahn CR. Mol Cell Biol. 1996;16:2195–2203. doi: 10.1128/mcb.16.5.2195. [DOI] [PMC free article] [PubMed] [Google Scholar]
- 8.Pons S, Asano T, Glasheen E, Miralpeix E, Zhang Y, Fisher TL, Myers MG, Jr, Sun XJ, White MF. Mol Cell Biol. 1995;15:4453–4465. doi: 10.1128/mcb.15.8.4453. [DOI] [PMC free article] [PubMed] [Google Scholar]
- 9.Hörsch D, Kahn CR. J Comp Neurol. 1999;415:105–120. [PubMed] [Google Scholar]
- 10.Ueki K, Algenstaedt P, Mauvais-Jarvis F, Kahn CR. Mol Cell Biol. 2000;20:8035–8046. doi: 10.1128/mcb.20.21.8035-8046.2000. [DOI] [PMC free article] [PubMed] [Google Scholar]
- 11.Ueki K, Fruman DA, Brachmann SM, Tseng YH, Cantley LC, Kahn CR. Mol Cell Biol. 2002;22:965–977. doi: 10.1128/MCB.22.3.965-977.2002. [DOI] [PMC free article] [PubMed] [Google Scholar]
- 12.Terauchi Y, Tsuji Y, Satoh S, Minoura H, Murakami K, Okuno A, Inukai K, Asano T, Kaburagi Y, Ueki K, Nakajima H, Hanafusa T, Matsuzawa Y, Sekihara H, Yin Y, Barrett JC, Oda H, Ishikawa T, Akanuma Y, Komuro I, Suzuki M, Yamamura K, Kodama T, Suzuki H, Koyasu S, Aizawa S, Tobe K, Fukui Y, Yazaki Y, Kadowaki T. Nat Genet. 1999;21:230–235. doi: 10.1038/6023. [DOI] [PubMed] [Google Scholar]
- 13.Ueki K, Yballe CM, Brachmann SM, Vicent D, Watt JM, Kahn CR, Cantley LC. Proc Natl Acad Sci U S A. 2002;99:419–424. doi: 10.1073/pnas.012581799. [DOI] [PMC free article] [PubMed] [Google Scholar]
- 14.Mauvais-Jarvis F, Ueki K, Fruman DA, Hirshman MF, Sakamoto K, Goodyear LJ, Iannacone M, Accili D, Cantley LC, Kahn CR. J Clin Invest. 2002;109:141–149. doi: 10.1172/JCI13305. [DOI] [PMC free article] [PubMed] [Google Scholar]
- 15.Fruman DA, Snapper SB, Yballe CM, Davidson L, Yu JF, Alt FW, Cantley LC. Science. 1999;283:393–397. doi: 10.1126/science.283.5400.393. [DOI] [PubMed] [Google Scholar]
- 16.Yu J, Zhang Y, McIlroy J, Rordorf-Nikolic T, Orr GA, Backer JM. Mol Cell Biol. 1998;18:1379–1387. doi: 10.1128/mcb.18.3.1379. [DOI] [PMC free article] [PubMed] [Google Scholar]
- 17.Cuevas BD, Lu Y, Mao M, Zhang J, LaPushin R, Siminovitch K, Mills GB. J Biol Chem. 2001;276:27455–27461. doi: 10.1074/jbc.M100556200. [DOI] [PubMed] [Google Scholar]
- 18.Chan TO, Rodeck U, Chan AM, Kimmelman AC, Rittenhouse SE, Panayotu G, Tsichlis PN. Cancer Cell. 2002;1:181–191. doi: 10.1016/s1535-6108(02)00033-8. [DOI] [PubMed] [Google Scholar]
- 19.Dani C, Smith AG, Dessolini S, Leroy P, Staccini L, Villageois P, Darimont C, Ailhaud G. J Cell Sci. 1997;110:1279–1285. doi: 10.1242/jcs.110.11.1279. [DOI] [PubMed] [Google Scholar]
- 20.Huong PL, Kolk AH, Eggelte TA, Verstijnen CP, Gilis H, Hendriks JT. J Immunol Methods. 1991;140:243–248. doi: 10.1016/0022-1759(91)90377-r. [DOI] [PubMed] [Google Scholar]
- 21.Kerouz NJ, Hörsch D, Pons S, Kahn CR. J Clin Investig. 1997;100:3164–3172. doi: 10.1172/JCI119872. [DOI] [PMC free article] [PubMed] [Google Scholar]
- 22.Trümper A, Trümper K, Trusheim H, Arnold R, Göke B, Hörsch D. Mol Endocrinol. 2001;15:1559–1570. doi: 10.1210/mend.15.9.0688. [DOI] [PubMed] [Google Scholar]
- 23.Miyake S, Makimura M, Kanegae Y, Harada S, Sato S, Takamori K, Tokuda C, Saito I. Proc Natl Acad Sci U S A. 1996;93:1320–1324. doi: 10.1073/pnas.93.3.1320. [DOI] [PMC free article] [PubMed] [Google Scholar]
- 24.Brazil DP, Hemmings BA. Trends Biochem Sci. 2001;26:657–664. doi: 10.1016/s0968-0004(01)01958-2. [DOI] [PubMed] [Google Scholar]
- 25.Uehara T, Tokumitsu Y, Nomura Y. Biochem Biophys Res Commun. 1995;210:574–580. doi: 10.1006/bbrc.1995.1698. [DOI] [PubMed] [Google Scholar]
- 26.Hwang CS, Loftus TM, Mandrup S, Lane MD. Annu Rev Cell Dev Biol. 1997;13:231–259. doi: 10.1146/annurev.cellbio.13.1.231. [DOI] [PubMed] [Google Scholar]
- 27.Fang X, Yu SX, Lu Y, Bast RC, Jr, Woodgett JR, Mills GB. Proc Natl Acad Sci U S A. 2000;97:11960–11965. doi: 10.1073/pnas.220413597. [DOI] [PMC free article] [PubMed] [Google Scholar]
- 28.Sun S, Lesche R, Li DM, Liliental J, Zhang H, Gao J, Gavrilova N, Mueller B, Liu X, Wu H. Proc Natl Acad Sci U S A. 1999;96:6199–6204. doi: 10.1073/pnas.96.11.6199. [DOI] [PMC free article] [PubMed] [Google Scholar]
- 29.Stiles B, Gilman V, Khanzenzon N, Lesche R, Li A, Qiao R, Liu X, Wu H. Mol Cell Biol. 2002;22:3842–3851. doi: 10.1128/MCB.22.11.3842-3851.2002. [DOI] [PMC free article] [PubMed] [Google Scholar]
- 30.Bi L, Okabe I, Bernard DJ, Wynshaw-Boris A, Nussbaum RL. J Biol Chem. 1999;274:10963–10968. doi: 10.1074/jbc.274.16.10963. [DOI] [PubMed] [Google Scholar]
- 31.Collado M, Medemam RH, Garcia-Caom I, Dubuissonm MLN, Barradas M, Glassford J, Rivas C, Burgering BMT, Serrano M, Lam EWF. J Biol Chem. 2000;275:21960–21968. doi: 10.1074/jbc.M000759200. [DOI] [PubMed] [Google Scholar]
- 32.Stahl M, Dijkers PF, Kops GJ, Lens SM, Coffer PJ, Burgering BM, Medema RH. J Immunol. 2002;168:5024–5031. doi: 10.4049/jimmunol.168.10.5024. [DOI] [PubMed] [Google Scholar]
- 33.Kops GJ, Medema RH, Glassford J, Essers MA, Dijkers PF, Coffer PJ, Lam EW, Burgering BM. Mol Cell Biol. 2002;22:2025–2036. doi: 10.1128/MCB.22.7.2025-2036.2002. [DOI] [PMC free article] [PubMed] [Google Scholar]
- 34.Kaliman P, Vinals F, Testar X, Palacin M, Zorzano A. J Biol Chem. 1996;271:19146–19151. doi: 10.1074/jbc.271.32.19146. [DOI] [PubMed] [Google Scholar]
- 35.Sakaue H, Ogawa W, Matsumoto M, Kuroda S, Takata M, Sugimoto T, Spiegelman BM, Kasuga M. J Biol Chem. 1998;273:28945–28952. doi: 10.1074/jbc.273.44.28945. [DOI] [PubMed] [Google Scholar]
- 36.Tamir Y, Bengal E. J Biol Chem. 2000;275:34424–34432. doi: 10.1074/jbc.M005815200. [DOI] [PubMed] [Google Scholar]