

Abstract
The fidelity of excitation-contraction (EC) coupling in ventricular myocytes is remarkable, with each action potential evoking a [Ca2+]i transient. The prevalent model is that the consistency in EC coupling in ventricular myocytes is due to the formation of fixed, tight junctions between the sarcoplasmic reticulum (SR) and the sarcolemma where Ca2+ release is activated. Here, we tested the hypothesis that the SR is a structurally inert organelle in ventricular myocytes. Our data suggest that rather than being static, the SR undergoes frequent dynamic structural changes. SR boutons expressing functional ryanodine receptors moved throughout the cell, approaching or moving away from the sarcolemma of ventricular myocytes. These changes in SR structure occurred in the absence of changes in [Ca2+]i during EC coupling. Microtubules and the molecular motors dynein and kinesin 1(Kif5b) were important regulators of SR motility. These findings support a model in which the SR is a motile organelle capable of molecular motor protein-driven structural changes.
1. Introduction
The sarcoplasmic reticulum (SR) is an intracellular organelle that forms an intricate tubular network throughout ventricular myocytes. A critical function of the SR is to store and release Ca2+. The SR is a structurally diverse organelle that consists of junctional, corbular, and network SR. The network SR is formed by a series of interconnected tubules that span the region between the transverse-tubules (T-tubules). The junctional SR is where this organelle forms specialized junctions with the sarcolemmal T-tubules, which result in the close juxtaposition (≈15 nm) of ryanodine-sensitive Ca2+ channels (RyRs) in the SR and sarcolemmal voltage-gated L-type Ca2+ channels [1, 2]. Corbular SR is a protrusion from the SR network that expresses RyRs but does not make junctions with the sarcolemma.
During excitation-contraction (EC) coupling, membrane depolarization opens L-type Ca2+ channels near the junctional SR. This allows a small amount of Ca2+ to enter the small cytosolic volume that separates the SR and the T-tubule sarcolemma, rising local [Ca2+]i beyond a threshold for RyRs activation via the mechanism of Ca2+-induced Ca2+ release (CICR) [3]. Local [Ca2+]i elevations resulting from the activation of a small cluster of RyRs are called “Ca2+ sparks” [4]. Synchronous activation of multiple Ca2+ sparks by L-type Ca2+ channels produces a global rise in [Ca2+]i that initiates myocardial contraction. The coupling strength between L-type Ca2+ channels and RyRs is critically dependent on the proximity and stability of the T-tubule/sarcolemmal-SR junction [5, 6].
EC coupling in ventricular myocytes is remarkably reliable. That is, an action potential invariably evokes a whole-cell [Ca2+]i transient that results in contraction. Under steady-state conditions, the amplitude of the whole-cell [Ca2+]i transient and contraction remains virtually unchanged for long periods of time. A recent study examined the biophysical basis for the fidelity of action potential-evoked [Ca2+]i transient and contraction [7]. This study suggested that the probability of Ca2+ spark activation (Ps) by nearby L-type Ca2+ channels is very high (≈1) during the plateau of the ventricular action potential. Because the Ps during EC coupling is dependent on the separation between L-type Ca2+ channels and RyRs, these findings suggest that the T-tubule sarcolemma-SR junction is a functionally stable structure at least over relatively short periods of time (i.e., minutes). At present, however, the SR structural dynamics in living ventricular myocytes have not been examined.
In this study, we used electron, confocal, and total internal reflection fluorescence (TIRF) microscopy to address this fundamental issue. Our data suggest that the SR in neonatal and adult cardiac myocytes forms a vast, yet dynamic network with mobile SR elements that contain functional RyRs. The microtubule network and the molecular motors dynein and kinesin 1(referred as Kif5b) regulate SR motility. Interestingly, rearrangements in SR structure were more pronounced in neonatal than in adult myocytes. These findings support a model in which the SR is a motile organelle capable of undergoing rapid microtubule-associated molecular motor protein-driven structural reorganization.
2. Methods
2.1. Isolation of Ventricular Myocytes
Animals were handled according to the guidelines of the University of Washington Institutional Animal Care and Use Committee. Hearts were obtained from adult male Sprague Dawley rats or neonatal mice (<72 hours postpartum) euthanized by a lethal intraperitoneal injection of pentobarbital or decapitation, respectively. Single adult and neonatal ventricular myocytes were enzymatically isolated and kept in short-term culture as previously described [8–10].
2.2. Plasmid Construction and Production of Adenovirus Expressing tRFP-SR and Kif5b
The tagged red fluorescent protein (tRFP) was genetically modified to contain av N-terminal calreticulin signal sequence and a C-terminal ER retention signal, KDEL [11]. A cartoon of our tRFP-SR construct is presented in Figure 2(a). Human Kif5b was a generous gift of Dr. Ronald Vale (University of San Francisco, CA, USA). We constructed a dominant version of Kif5b as previously described [12] and fused blue fluorescent protein (BFP) to the N-terminus of Kif5b-WT and Kif5b-DN. Adenoviruses expressing tRFP-SR, Kif5b-WT, and Kif5b-DN were generated using the ViraPower Adenoviral Expression System kit in accordance with manufacturer's instructions (Invitrogen, Carlsbad, CA, USA). Isolated neonatal and adult cardiac ventricular myocytes were infected with tRFP-SR, Kif5b-WT, or Kif5b-DN, and experiments were conducted 48 hours postinfection unless otherwise indicated.
Figure 2.
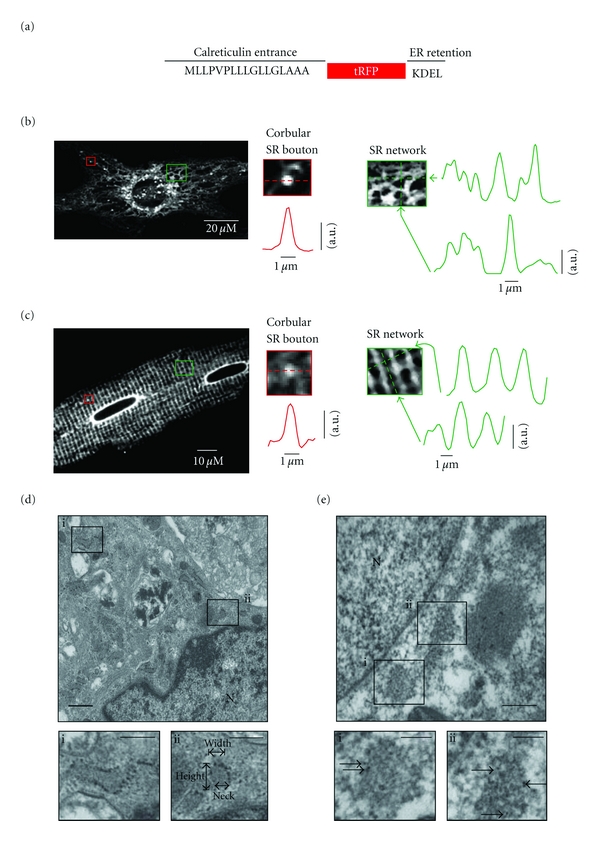
Imaging of network, junctional, and corbular SR boutons in living and fixed ventricular myocytes. (a) A cartoon of the tRFP-SR construct. (b) Confocal image of representative living neonatal ventricular myocyte expressing tRFP-SR. (c) Confocal images of representative living adult ventricular myocyte. Insets show zooms of a corbular SR bouton (red box) and SR network (green box) in these cells. Graphs show fluorescence intensity profile in the region in the image marked by arrows. (d) Electron microscopy image of non-permeabilized neonatal ventricular myocytes infected with tRFP-SR (scale bar = 1 μm; N = nucleus). Insets depict invaginations of the endoplasmic/sarcoplasmic reticulum (scale bar = 100 nm). Panel Dii shows an example of how the dimensions of SR boutons were made. (e) Immunogold labeling of tRFP-SR (arrows of insets) from a permeabilized neonatal ventricular myocyte infected with tRFP-SR depicting invaginations of the endoplasmic/sarcoplasmic reticulum (scale bar = 500 nm and 100 nm (insets); N = nucleus).
2.3. Confocal, Total Internal Reflection Fluorescence Imaging and Analysis
For all experiments, cells were perfused with a physiological saline solution containing in mM: KCl 5, NaCl 140, MgCl2 1, Glucose 10, HEPES, 10 and CaCl2 2, pH 7.4 with NaOH. All experiments were performed at room temperature (22–25°C). Images were acquired using a confocal or total internal reflection fluorescence (TIRF) microscope. Confocal imaging was performed using a BioRad Radiance 2000, Nikon Swept Field, or Nikon A1R-S1 confocal microscopes with a Nikon 60× oil immersion lens (NA = 1.4). The TIRF microscope has a PlanApo (60×; NA = 1.45) oil immersion lens, an Andor iXON CCD camera, and a TILL photonics TIRF illuminator. Images were collected every 10 seconds, unless otherwise indicated. The potential for focus drift during time-lapse microscopy was minimized using Nikon's Perfect Focus System, which provides continuous, real-time focus drift correction caused by thermal and mechanical conditions. Analysis was performed on cells that showed no signs of focus drift.
Confocal and TIRF images were quantitatively analyzed using National Institutes of Health ImageJ software. Corbular SR bouton distances, velocities, and trajectory mapping were performed using the Manualtracking plug-in. To measure change in tRFP-SR fluorescence, we identified prominent peaks using a top-hat filter with a 5×5 pixel window. Thresholds for the top-hat filter were determined per image to generate a full cell profile. A site was counted as having changed if at least one of the frames of a trace exceeded 3 standard deviations (SD) above or below the mean. To measure SR structural change of adult ventricular myocytes, we used an analysis for quantifying change in transverse-tubule structure [13]. Briefly, tRFP-SR myocytes were processed using fast Fourier transform (FFT) to convert two-dimensional images into frequency domain and its corresponding power spectrum (Figure 7(b)) allowing us to determine the spatial regularity of SR structure and the absolute value of the magnitude of the first harmonic (SRPower) via Gaussian fitting with pCLAMP 10 software (Axon Instruments). The graphs shown in Figure 7(c) were fit with either a single Gaussian or sum of two Gaussian functions using Graphpad Prism v5.0a (GraphPad, La Jolla, CA, USA).
Figure 7.
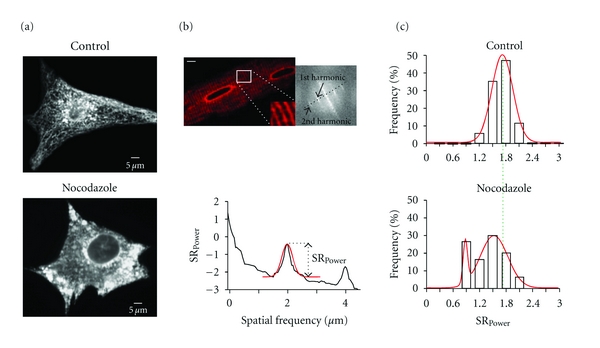
Microtubules regulate SR structure in neonatal and adult ventricular myocytes. (a) Confocal images of a neonatal ventricular myocyte expressing tRFP-SR in the absence (top; control) or presence of 10 μM nocodazole (bottom). (b) Confocal image of an adult ventricular myocyte expressing tRFP-SR. The inset shows a zoomed-in region of the cell delineated by the white box. The image to the left is a 2D Fourier transformation of the confocal image. (c) Histograms of SRPower values in control and nocodazole-treated adult ventricular myocytes. Dashed green line shows global shift in SRPower distributions in nocodazole-treated myocytes from the center (1.7 μm) of control myocytes. Solid red lines represent fits to the data with single (control; center = 1.7 μm) and dual (nocodazole; center peak 1 = 0.88 μm, center peak 2 = 1.53 μm) Gaussian functions.
To measure changes in [Ca2+]i, ventricular myocytes were loaded with the free-acid or AM form of the fluorescent Ca2+ indicator Fluo-4 as previously described [4]. [Ca2+]i signals were imaged using confocal or TIRF microscopy. For the experiments in which a TIRF microscope was used, the perforated patch-clamp technique was used to control membrane potential. The patch pipette solution was composed in mM: amphotericin B (30 μg/mL), penta-potassium form of fluo-4 (100 μM), CsCl 20, Aspartic acid 110, MgCl2 1, HEPES 10, MgATP5, CaCl2 2.94, EGTA 10, and pH 7.2 with CsOH. TIRF images were acquired at 30–60 Hz using TILL Image software. Confocal images were acquired using a Nikon swept field or Olympus FV1000 confocal microscope.
TIRF and confocal images were analyzed with custom software written in IDL language (Research Systems, Boulder, CO, USA). Briefly, background-subtracted fluorescence signals were normalized by dividing the fluorescence (F) intensity at each time point by the resting fluorescence (F0) intensity. Fluorescent signals were calibrated using the “pseudo-ratio” equation [4]:
| (1) |
where F is the fluorescence intensity, F0 is the resting fluorescence, Kd is the dissociation constant of Fluo4 (1100 nM), and [Ca2+]i, rest is resting Ca2+ concentration (150 nM).
2.4. Ryanodine Labeling
Live-cell labeling of ryanodine receptors was accomplished by incubating neonatal myocytes with 100 nM BODIPY-FL-X ryanodine (Inivtrogen) for 10 minutes at room temperature in Hanks Balanced Salt Solution (HBSS; Invitrogen). Excess BODIPY-FL-X ryanodine was removed by washing cells 3 times, 10 minutes each, with HBSS prior to imaging. For adult ventricular myocytes, the concentration of BODIPY-FL-X-ryanodine was reduced to 50 nM, and the incubation period was reduced to 5 minutes at room temperature.
2.4.1. Electron Microscopy and Immunogold Labeling
Neonatal ventricular myocytes infected with tRFP-SR were fixed with 2.5% glutaraldehyde in PBS (10 mM phosphate buffer/150 mM NaCl, pH 7.4) for 30 minutes followed with 0.1% NaBH4 in 0.1 M PB (phosphate buffer, pH 7.4) for 15 minutes to inactivate aldehydes. Cells were then fixed with 0.5% osmium tetroxide in PB for 15 minutes, subjected to graded dehydration and flat embedded in a mixture off Spur resin and Eponate 12 resin (Ted Pella, Redding, CA, USA). Ultrathin sections (70 nm) were poststained in 4% uranyl acetate and lead citrate. The samples were viewed on a JEOL JSM 6300F scanning electron microscope with digital image capture. Immunogold labeling of tRFP-SR was performed on tRFP-SR-infected neonatal mouse myocytes grown on coverslips using silver enhancement as previously described [14, 15] and prepared for electron microscopy as described above. The primary antibody, rabbit anti-tRFP (Evrogen, Joint Stock, Russia), was used in 1 : 5000 dilution and the secondary antibody, ultrasmall gold-conjugated F (ab)'2 fragment of goat anti-rabbit IgG (Aurion, Electron Microscopy Services, Hatfield, PA, USA) was used in a 1 : 100 dilution.
2.4.2. Statistics
Statistical significance was assessed by ANOVA analysis of all data points with pairwise comparisons completed as a posttest, with significance defined as P value less than 0.05. Data are presented as mean ± SEM. The asterisk (*) symbol is used in the figures to illustrate a significant difference between groups.
3. Results
3.1. SR Ca2+ Release Is the Principal Contributor to [Ca2+]i Variance during EC Coupling
We imaged action potential-evoked [Ca2+]i transients in adult and neonatal ventricular myocytes loaded with the fluorescent indicator fluo-4 AM (Figure 1). Action potentials were evoked via field stimulation at a frequency of 1 Hz. The mean [Ca2+]i transient amplitude was 508 ± 28 and 705 ± 67 nM in adult (n = 9) and neonatal (n = 12) ventricular myocytes, respectively. The amplitude of these [Ca2+]i transients did not change over a 5-minute period (Figure 1(a), left panel). Indeed, the coefficient of variation (i.e., standard deviation ÷ mean) of the [Ca2+]i transient peak amplitude over this period of time was 0.12 ± 0.2 and 0.18 ± 0.03 in adult and neonatal ventricular myocytes, respectively (P < 0.05) (Figure 1(a), right panel).
Figure 1.
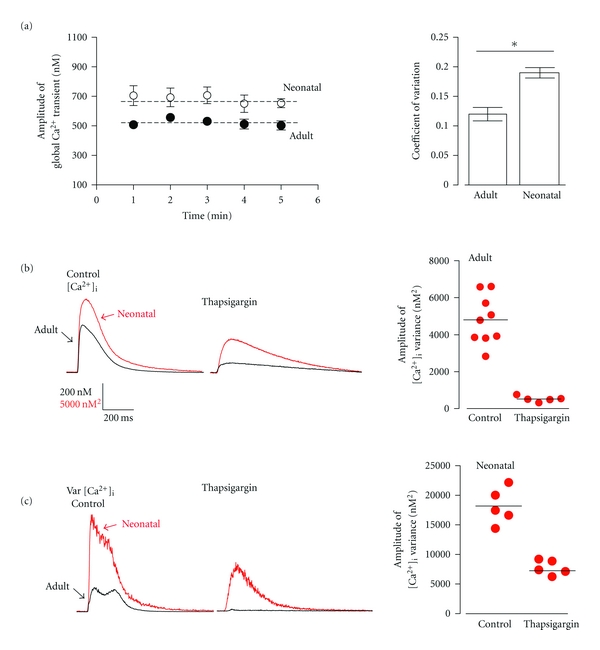
Beat-to-beat fidelity of EC coupling in ventricular myocytes. (a) Average peak amplitude of action potential evoked (1 Hz) global Ca2+ transients (nM) from adult (closed circles) and neonatal (open circles) ventricular myocytes measured at 1 minute interval for five minutes and corresponding coefficient of variation among the adult and neonatal myocyte population. Dashed line represents average peak [Ca2+]i signal over 5 minutes. (b) Representative [Ca2+]i transient of adult and neonatal myocytes. (c) Representative [Ca2+]i signal variance of adult and neonatal ventricular myocytes and the distribution of peak amplitude [Ca2+]i variance (nM2) of adult ventricular myocytes in the presence and absence of the SR Ca2+ pump inhibitor thapsigargin (1 μM).
To determine the time course and origin of beat-to-beat variations in [Ca2+]i, we generated signal-averaged [Ca2+]i records (Figure 1(b)) and their associated variance (σ2) (Figure 1(c)) from neonatal and adult ventricular myocytes before and after the application of the SERCA pump inhibitor thapsigargin (1 μM). The variance of the [Ca2+]i transient under control conditions (σ2transient) is defined by the following equation:
| (2) |
where σ2SR and σ2influx are the variance of SR Ca2+ release and Ca2+ influx, respectively. σ2transient and σ2influx can be experimentally determined from the [Ca2+]i transients before and after application of thapsigargin. Thus, σ2SR = σ2transient − σ2influx. Our analysis indicate that σ2transient increased during the onset of the [Ca2+]i transient. Consistent with the coefficient of variation data above, peak σ2transient was larger in neonatal (20,111 ± 234 nM2) than in adult (5066 ± 74 nM2) ventricular myocytes. Thapsigargin significantly reduced mean peak [Ca2+]i transient amplitude to 225 ± 9 and 420 ± 39 nM of adult and neonatal ventricular myocytes. Furthermore, σ2influx was 8963 ± 39 nM2 and 509 ± 9.01 nM2 in neonatal and adult ventricular myocytes. Thus, σ2SR is 4557 nM2 in adult myocytes and 11148 nM2 in neonatal myocytes. These data suggest that the majority of the σ2transient in adult (≈90%) and neonatal myocytes (≈55%) originates from variations in Ca2+ release from the SR.
3.2. Network, Junctional, and SR Boutons in Living Ventricular Myocytes
Changes in the spatial organization of the SR could be a potential contributor to variations in Ca2+ release from this organelle during EC coupling. To investigate this issue, we infected ventricular myocytes with an adenoviral vector expressing the tag red fluorescent protein (tRFP-SR) [16] with a calreticulin entrance sequence in its N-terminal and a four-amino-acid sequence (KDEL) in its C-terminal that signals its retention in the SR lumen [11] (Figure 2(a)).
Confocal imaging revealed that tRFP-SR fluorescence was confined to the nuclear envelope and a vast, seemingly interconnected tubular SR network that extended throughout neonatal and adult ventricular myocytes (Figures 2(b)-2(c)). In neonatal ventricular myocytes, the width of these SR tubules at 50% fluorescence amplitude ranged from 0.6 to 3 μm with a mean of 0.8 ± 0.1 μm (n = 120 sites) (Figure 2(b), green). In contrast, adult ventricular myocytes expressing tRFP-SR did not show the convoluted, irregular reticular pattern observed in neonatal myocytes (Figures 2(b)-2(c)). Instead, as previously reported by others [1, 17], the SR forms terminals (i.e., junctional SR) with a periodic distribution of about 1.8 μm along the longitudinal axis of the cell. The diameter of these terminals ranged from 0.8 to 1.2 μM (Figure 2(c), green). The junctional SR at opposite ends of each sarcomere was interconnected by “network” SR.
We observed multiple bright structures protruding from the SR network of neonatal and adult ventricular myocytes (Figures 2(b)-2(c)). We refer to these structures as corbular SR boutons [1, 18]. Corbular SR boutons varied in length from 1 to 2 μm (mean = 1.2 ± 0.1 μm; n = 79) and from 0.5 to 0.7 μm in width (mean = 0.63 ± 0.07 μm, n = 79). The spatial distribution of tRFP-SR and structure of corbular SR boutons was examined with ultrahigh resolution, using conventional and immunogold electron microscopy (EM) (Figures 2(d)-2(e)). The SR/ER was identified in EM images using two generally accepted criteria. First, it is an intracellular membranous organelle that forms a cell-wide network that is continuous with the nuclear membrane. Second, it has multiple electron-dense particles (likely ribosomes and RyRs) embedded in its membrane.
Consistent with our confocal data, EM images showed multiple Ω-shaped boutons within the SR and rough ER of non-permeabilized myocytes (boxes in Figure 2(d)). tRFP-SR-associated immunogold particles were also found to be broadly distributed through the perinuclear, network, and junctional, corbular SR of permeabilized myocytes (Figure 2(e) inset; arrows indicate immunogold particles). Analysis of these EM images indicated that corbular SR had a height and maximum width of 25 ± 5 nm and 1.1 ± 0.1 μm (n = 50), respectively. The diameter at the “neck” of the corbular SR, where they connect to the SR network, was 156 ± 5 nm. Figure 2(d)ii shows the location of these structures in an electron micrograph from a representative myocyte.
3.3. The SR of Ventricular Myocytes Is Motile
Having found a strategy to monitor SR ultrastructure in living ventricular myocytes, we tested the hypothesis that the SR of neonatal and adult ventricular myocytes is a structurally inert organelle. To do this, time-lapse confocal microscopy was performed using neonatal and adult ventricular myocytes expressing tRFP-SR (Figures 3 and 4). Contrary to our hypothesis, we found a significant level of mobility and reorganization within the SR of ventricular myocytes. Corbular SR boutons moved frequently and for relatively long distances (see Movie 1 in Supplementary Material available online at doi: 10.1155/2011/382586).
Figure 3.
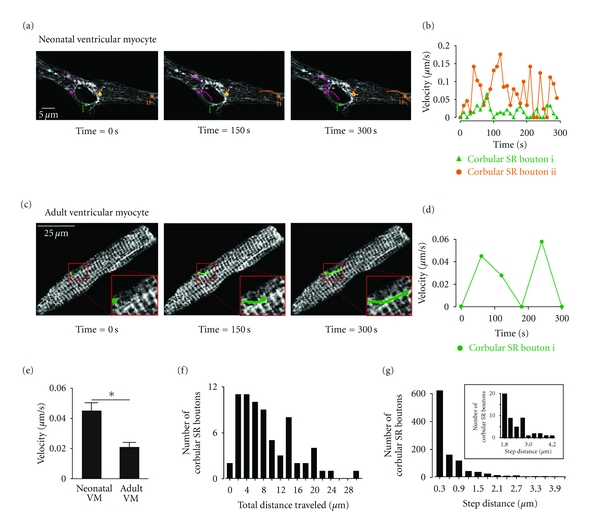
Motile corbular SR boutons in neonatal and adult ventricular myocytes. (a) Time-lapse confocal images of a neonatal ventricular myocytes expressing tRFP-SR. Images shown were obtained 0, 150, and 300 seconds after the initiation of the experiment. Motile corbular SR boutons are labeled with colored circles. (b) Plot of the velocity of corbular SR boutons i and ii as a function of time. (c) Time-course of corbular SR bouton motility in a representative adult ventricular myocyte expressing tRFP-SR. The insets in the lower right corner of each image show an expansion of the region in the cell marked by the red box. (d) Plot of velocity of this corbular SR bouton as a function of time. (e) Bar plot of the mean velocity of corbular SR boutons in neonatal and adult ventricular myocytes (*P < 0.05). (f) Histogram of the total distance traveled over a period of 300 seconds of 79 corbular SR boutons in adult and neonatal ventricular myocytes. (g) Histogram of the step distance traveled by corbular SR boutons. The inset shows an expanded view of the region of the histogram from 1.8 to 4.2 μm.
Figure 4.
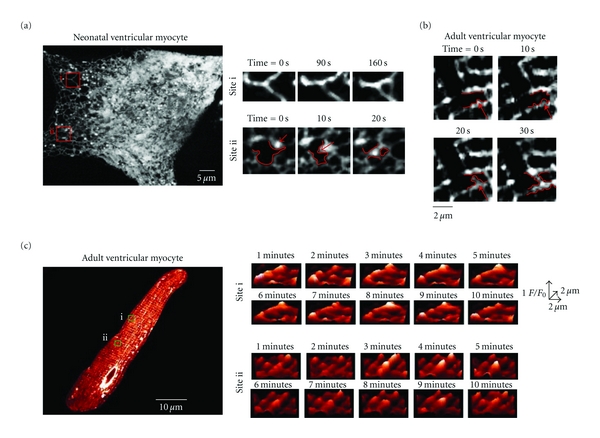
Dynamic remodeling of the SR network of neonatal and adult ventricular myocyte. (a) Confocal image of a neonatal ventricular myocytes expressing tRFP-SR. Images to the left show expanded views of sites i and ii at various time points. The red arrow in site ii marks a corbular SR bouton. Redlines delineate a portion of the SR network and shows elongation and subsequent fusion of this SR bouton to an adjacent SR tubule. (b) Time-lapse confocal imaging of a region of an adult ventricular myocyte expressing tRFP-SR. Redlines delineate a portion of the SR network and shows elongation and subsequent fusion of SR tubule to an adjacent SR tubule. (c) Confocal image of an adult ventricular myocyte. Surface plots at multiple time points of sites i and ii are shown to the right of this image.
Figures 3(a)–3(d) shows two-dimensional confocal images from representative neonatal and adult ventricular myocytes expressing tRFP-SR at various time points after the beginning of imaging. Motile corbular SR boutons are identified in each image with circles of varied colors. We tracked the position of the epicenter of each corbular SR bouton over time. The lines connected to each circle illustrate the trajectories of each of the corbular SR boutons in these images. We found that corbular SR boutons moved exclusively within the SR network of neonatal and adult ventricular myocytes. Furthermore, our analysis suggests that the trajectories and velocities of corbular SR boutons were highly variable. Accordingly, individual corbular SR boutons did not move at a constant speed, with periods of rapid mobility often followed by periods of slowed movements or even stasis (Figures 3(b)–3(d)). For example, while the corbular SR bouton i (green) in the neonatal myocyte in Figures 3(a)-3(b) only moved 0.8 μm at a maximum velocity of 0.06 μm/s, corbular SR bouton ii (orange) in the same cell moved a total of ≈10 μm at a maximum velocity of 0.18 μm/s over a period of 300 seconds.
Motile corbular SR boutons were also observed in the SR of adult ventricular myocytes, albeit with a lower frequency than in neonatal myocytes (Figures 3(c)-3(d)). An example of a motile corbular SR bouton in an adult myocyte is shown in Figure 3(c). The green line shows the trajectory of this specific corbular SR bouton. Like neonatal corbular SR boutons, the velocity and distance traveled by this adult corbular SR bouton was variable. It moved with a maximum velocity of 0.06 μm/s and traveled ≈8 μm over a period of 300 seconds (Figure 3(d)).
Motile corbular SR boutons moved faster in neonatal (0.045 ± 0.01 μm/s, n = 250) than in adult ventricular myocytes (0.020 ± 0.004 μm/s, n = 50; P < 0.05) (Figure 3(e)). The maximum velocity reached by corbular SR boutons was 0.6 μm/s. Neonatal and adult neonatal SR boutons traveled distances of up to 30 μm in a period of 300 seconds (Figure 3(f)). The distance traveled for a corbular SR bouton in a continuous movement event (called “step distance”) in adult and neonatal myocytes ranged from 0.3 to 4.2 μm (Figure 3(g)).
We found that changes in SR structure were not limited to motile SR boutons but included changes in the structure of the SR network of neonatal and ventricular myocytes. An example of this is shown in Figures 4(a)-4(b) and Movie 2 in Supplemental Material. Site i in Figure 4(a) is an area of the SR network of a neonatal ventricular myocyte, where an SR tubule bifurcates into two branches. Time-lapse confocal microscopy of this site showed the formation of a new connection between two adjacent SR branches. In site ii, we were able to capture the sequence of events that likely lead to the formation of these SR connections. The corbular SR bouton marked by the red arrow elongated finally fusing with a neighboring section of SR network. Figure 4(b) shows a similar set of events, but in an adult ventricular myocyte.
We also detected fluctuations of tRFP-SR fluorescence presumably resulting from changes in SR structure in these cells. An example of this type of phenomenon is shown in Figure 4(c) (see also Movie 3 in Supplementary Material). Surface plots of sites i and ii in this adult ventricular myocyte revealed dynamic fluctuations in tRFP-SR fluorescent suggesting structural changes in the junctional SR.
We used TIRF microscopy to resolve subtle changes in SR morphology within the subsarcolemmal space of neonatal and adult ventricular myocytes (Figure 5). In our TIRF microscope, excitation is limited to an evanescent field of about 100 nm from the coverslip. Thus, the axial resolution of the TIRF microscope (≈0.1 μm) is nearly an order of magnitude higher than our confocal microscope (≈1.1 μm). In neonatal myocytes, we observed multiple motile SR projections into the subsarcolemmal space per cell (Figure 5(a); see also Movie 4 in Supplementary Material). Interestingly, these SR structures moved laterally as well as in and out of the evanescent field, suggesting that in neonatal myocytes the SR is forming and dissolving SR-sarcolemma junctions on a regular basis. A similar observation was made using adult ventricular myocytes (Figure 5(b)). Collectively, these confocal and TIRF data suggest that the SR is a dynamic organelle that frequently forms and dissolves SR-sarcolemmal junctions in neonatal and adult ventricular myocytes.
Figure 5.
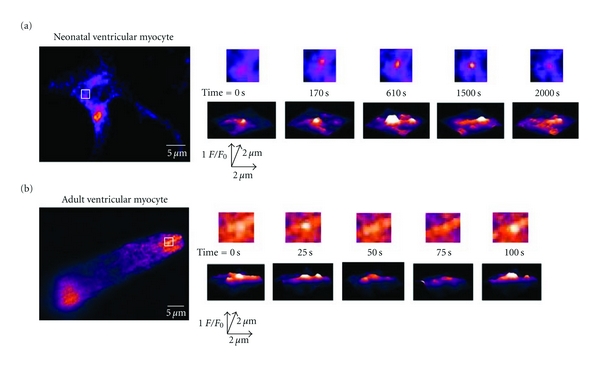
TIRF imaging of submembrane SR motility in neonatal and adult ventricular myocytes. (a) TIRF images of representative neonatal ventricular myocyte expressing tRFP-SR. (b) TIRF image of representative adult ventricular myocyte expressing tRFP-SR. Images to the right are two dimensional images (top row) and surface plots of the region delineated by the white.
3.4. Motile Corbular SR Boutons Express Functional Ryanodine Receptors
We investigated whether the corbular SR boutons and junctional SR observed with confocal and TIRF microscopy contained functional RyRs (Figure 6). To do this, we labeled living neonatal and adult ventricular myocytes expressing tRFP-SR with BODIPY-Ryanodine (100 nM neonatal, 50 nM adult) (Figures 6(a) and 6(c)). The Pearson's coefficient between tRFP-SR with BODIPY-Ryanodine signals in neonatal and adult ventricular myocytes was 0.69 and 0.80, respectively. We preformed simultaneous time-lapse confocal microscopy imaging of our neonatal ventricular myocytes labeled with BODIPY-RyR. The representative two-dimensional confocal images of the cell presented in Figure 6(a) are shown at various time points (Figure 6(b), see also Movie 5 in Supplementary Material). We found that BODIPY-RyR labeled structures moved with corbular SR boutons and along the tracks of the tRFP-SR labeled SR network at varying speeds over time. As described previously, we tracked the position and distance traveled of the epicenter of each corbular SR bouton labeled with BODIPY-RyR and compared them to unlabeled control cells. Labeled and unlabeled SR boutons traveled similar distances over a period of 300 seconds. These data suggest that tRFP-SR with BODIPY-Ryanodine colocalize in neonatal and adult ventricular myocytes and ryanodine receptors are expressed in diverse structures (i.e., network, junctional, and boutons) and are mobile within the SR of ventricular myocytes.
Figure 6.
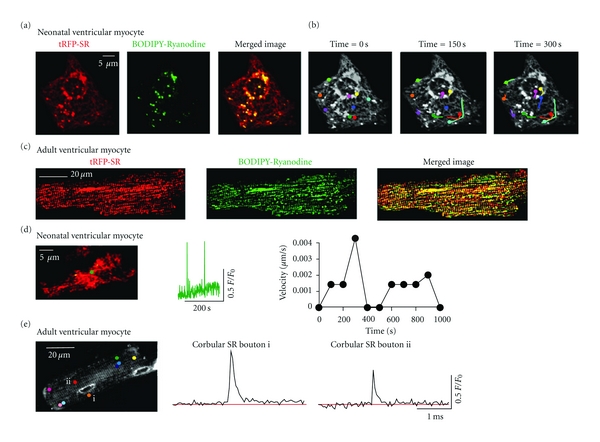
Expression of functional ryanodine receptors in motile corbular SR boutons. (a) Confocal image of a neonatal ventricular myocyte expressing tRFP-SR (left), labeled with BODIPY FL-X Ryanodine (center) and merged image (right). (b) Time-lapse confocal images of neonatal ventricular myocyte from panel A expressing tRFP-SR and labeled with BODIPY FL-X Ryanodine. Images shown were obtained 0, 150, and 300 seconds after the initiation of the experiment. Motile corbular SR boutons are labeled with colored circles. (c) Confocal image of adult ventricular myocyte expressing tRFP-SR (left), labeled with BODIPY FL-X Ryanodine (center) and merged image (right). (d) TIRF image (left) of a representative neonatal myocyte expressing tRFP-SR loaded with fluo-4. Green dot represents corbular SR bouton of interest. The plot in the center shows the time course of Ca2+ spark activity in this corbular SR bouton. The plot to the left shows the velocity of the corbular SR bouton marked by the green dot as a function of time. (e) Confocal image (left) of a representative adult ventricular myocyte expressing tRFP-SR loaded with fluo-4 AM. Colored dots mark corbular SR boutons in this cell. The two plots in this panel show the time-course of spontaneous Ca2+ sparks in corbular SR boutons i and ii.
Next, we tested the hypothesis that motile SR boutons express functional RyRs. Consistent with this, we recorded spontaneous Ca2+ sparks from motile SR boutons (Figures 6(d)-6(e)). For example, the corbular SR bouton marked with a green dot in Figure 6(d) moved at a velocity of up to 0.004 μm/s and multiple Ca2+ sparks were recorded from this site. As shown in Figure 6(e), Ca2+ sparks were also recorded from corbular SR boutons in adult myocytes. In combination with the data above, these findings suggest that mobile corbular SR boutons express functional ryanodine receptors in ventricular myocytes.
3.5. The Microtubule Network and Microtubule-Associated Motors Dynein and Kif5b Regulate SR Motility in Ventricular Myocytes
We investigated the mechanisms underlying SR motility in ventricular myocytes. Previous studies have implicated the microtubule network and the molecular motor dynein in the regulation of ER structure and motility in nonmuscle cells [19–22]. Thus, we examined the effects of the microtubule disruptor nocodazole (10 μM) on the SR of neonatal and adult ventricular myocytes expressing tRFP-SR. We found that incubation with 10 μM nocodazole for 2 hours induced significant SR fragmentation in neonatal ventricular myocytes (Figure 7(a)).
Nocodazole also seemed to alter SR organization in adult ventricular myocytes (Figures 7(b) and 7(c)). To quantify changes in SR-structure in adult ventricular myocytes, where the SR is organized in a well-defined periodic pattern, we implemented an analysis similar to the one used by Wei et al. [13], to monitor transverse tubule periodicity in ventricular myocytes. Briefly, this analysis involves a Fast Fourier Transform (FFT) analysis of tRFP-SR images, which are converted into a frequency domain that quantifies periodicity. The first harmonic, which centers at 1.7 μm, is the strongest periodicity of the SR-network based upon the spacing between each harmonic (Figure 7(b)). The magnitude of the 1st harmonic, or SRPower, provides a quantitative index for SR structural periodicity. In this analysis, a decrease in SRpower would represent a decrease in SR periodicity and hence its structural integrity. We found that under control conditions the histogram of SRPower values could be fit with a single Gaussian function with a center at 1.70 μm (n = 17). However, in nocodazole-treated cells the SRPower was shifted towards lower SRPower values than under control conditions. Indeed, the SRPower of nocodazole treated cells could be fit with the sum of two Gaussian functions with centers at 0.88 and 1.53 μm (n = 30) (Figure 7(c)). These data suggest that microtubules play a critical role in the maintenance of the structural integrity of the SR network in ventricular myocytes.
Next, we tested the hypothesis that inhibition of the microtubule-associated molecular motor proteins dynein and Kif5b would decrease SR motility. We investigated whether inhibition of the retrograde molecular motor, dynein with erythro-9-(2-hydroxy-3-nonyl) adenine (EHNA) [23] would decrease SR motility in neonatal ventricular myocytes (Figures 8(a) and 8(c)). Confocal images were collected at various time points over a period of 120 minutes in the presence or absence of 30 μM EHNA. Figure 8(a) shows a representative neonatal myocytes before (control) and after the application of EHNA. We mapped the trajectories of corbular SR boutons under control conditions and in the presence of EHNA with colored lines. Note that although corbular SR boutons were observed after incubation with EHNA, motility was significantly reduced (Figure 8(a)). Indeed, EHNA significantly decreased the total distance traveled by neonatal corbular SR boutons by ≈57% from 6.27 ± 0.44 μm (control, n = 6) to 2.69 ± 0.34 μm (EHNA, n = 16) (P < 0.05) (Figure 8(c)).
Figure 8.
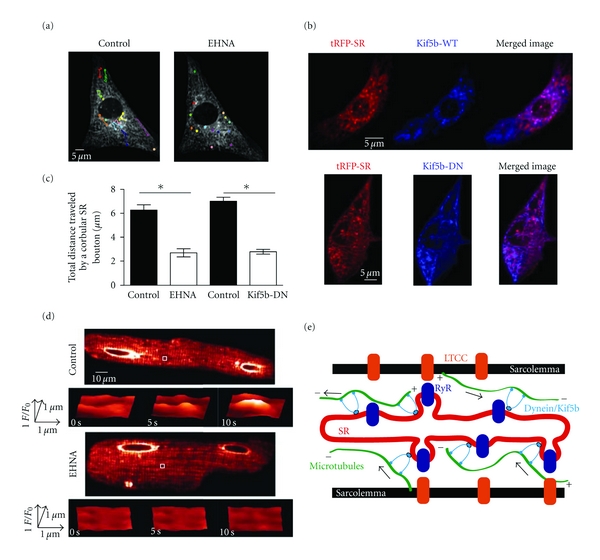
The microtubule-associated motors dynein and Kif5b regulate SR motility in ventricular myocytes. (a) Confocal image of neonatal ventricular myocyte expressing tRFP-SR under control conditions and after 120 minutes of 30 μM EHNA perfusion. Corbular SR boutons are identified with colored circles. (b) Confocal images of neonatal ventricular myocyte expressing tRFP-SR (left) and Kif5b-WT-BFP (top/center) or Kif5b-DN-BFP (bottom/center). The images to the right were generated by merging the tRFP-SR and Kif5b-BFP images. (c) Bar plot of the mean total distance traveled by corbular SR boutons before and after EHNA perfusion and myocytes infected with tRFP-SR (control) and myocytes infected with tRFP-SR and Kif5B-DN-BFP. (d) Confocal images showing tRFP-SR fluorescence of adult ventricular myocytes under control conditions (top) and incubated in the presence of 30 μM EHNA (bottom). Surface plots show the time-course of fluorescence intensity in the region delineated by the white box. (e) Cartoon depicting a hypothetical model for the regulation of SR structure and motility in ventricular myocytes (LTCC = L-type Ca2+ channel; RyR = ryanodine receptor).
To examine whether the anterograde microtubule-associated molecular motor protein Kif5b alters SR dynamics, we generated two adenovirus constructs of wild type and a dominant-negative form of Kif5b lacking the motor domain [12] fused to BFP at the N-terminus (Kif5b-WT and Kif5b-DN) and infected ventricular myocytes simultaneously with Kif5b-BFP and tRPF-SR adenoviruses (Figure 8(b)). The Pearson's coefficient between tRFP-SR and Kif5b-WT-BFP or Kif5b-DN-BFP was 0.82 and 0.81, respectively (Figure 8(b)). These data suggest that the molecular motor Kif5b associates with the diverse structures of the SR network (i.e., network, junctional, and boutons) in ventricular myocytes. Importantly, we found that expression of Kif5b-DN-BFP significantly decreased the total distance traveled by neonatal corbular SR boutons by ≈60% from 7.01 + 0.31 μm (control, n = 6) to 2.78 + 0.2 μm (Kif5b-DN-BFP, n = 6) (P < 0.05) (Figure 8(c)).
Finally, we investigated the effects of the dynein inhibitor EHNA on junctional SR in adult ventricular myocytes (Figure 8(d)). We focused on the junctional SR and not on SR boutons because, as noted above, the latter are less frequently observed in adult than in neonatal myocytes. For this analysis, we calculated the percent of junctional SR sites throughout the cell that, over time, underwent fluorescence fluctuations that exceeded 3 standard deviations above or below the mean local tRFP-SR fluorescence. Junctional SR sites were identified automatically with the use of a 5 × 5 top-hat detection filter. Using this analysis, we found that, under control conditions, 4.7 ± 0.2% (n = 20,000 sites from 6 cells) of isolated sites experienced change in tRFP-SR fluorescence in the junctional SR that exceeded the detection threshold. Consistent with the neonatal data above, application of 30 μM EHNA decreased the number of fluctuating junctional SR sites by 45 ± 0.1% (P < 0.05). Collectively, these data suggest that the microtubule network and the molecular motors dynein and Kif5b play a critical role in SR motility of ventricular myocytes.
4. Discussion
This study provides the first characterization of SR structure in living neonatal and adult ventricular myocytes. The main findings of this study were fourfold. First, the SR forms a vast network that is structurally diverse and dynamic. Second, we discovered that corbular SR boutons move throughout the cell and express functional RyR. Third, by simultaneously imaging [Ca2+]i and tRFP-SR, we discovered that the amplitude of the evoked whole-cell [Ca2+]i transient remains unchanged even though the SR is undergoing significant remodeling. These data suggest that a static SR network is not required for stable EC coupling in ventricular myocytes. Fourth, SR structure and motility are dependent on an intact microtubule network and the retrograde and anterograde microtubule-associated motors dynein and Kif5b.
Electron microscopy and immunoflourescence approaches have been extensively employed to study SR structure in cardiac muscle [1, 24–26]. These studies have led to the formulation of a model of the SR and its involvement in EC coupling. In this model, the SR is comprised of interconnected longitudinal tubules that terminate in dilated sacs that come into close apposition (≈15 nm) to the sarcolemma. RyRs are expressed in this junctional SR. Together, the junctional SR, RyRs, and nearby sarcolemmal L-type Ca2+ channel form a signaling unit called a “couplon”. The formation of SR-sarcolemmal junctions that underlies the couplon is proposed to be a multistep process [27, 28]. The first event in development of the junctional SR is the “docking” of the SR membrane to the sarcolemma via the protein junctophilin 2. Following the establishment of the SR-sarcolemmal junctions in embryonic myocytes, the proteins calsequestrin, junction, and triadin are targeted and organized within the SR. The arrival of the RyRs and L-type Ca2+ channels and final organization of the macromolecular complex that comprises a Ca2+ release unit within the junctional SR lead to a couplon.
Our data suggest that these SR structures are highly dynamic. This is analogous to what has been described for the endoplasmic reticulum (ER) in nonmuscle cells [20, 29]. The SR is considered to be a specialized derivation of the endoplasmic reticulum (ER) that is dedicated to Ca2+ storage and release for the regulation of muscle contraction and EC coupling. The ER of nonmuscle cells is known to have a convoluted structure that is continually reorganizing its structure and moving toward and away from the plasma membrane over time in a variety of living nonmuscle cell models [20, 29]. Our data suggest that like the ER, the SR has the capacity to remodel.
Our results demonstrate that the mean [Ca2+]i transient amplitude achieves high fidelity yet also displays beat-to-beat variation in [Ca2+]i. Interestingly, the variance of the [Ca2+]i attributable to SR Ca2+ release was nearly 4-fold larger than adult myocytes. This coincides with a higher degree of SR motility in neonatal than in adult myocytes. Although the exact sources for [Ca2+]i variance during EC coupling are unclear, it is intriguing to speculate that variations in SR motility of neonatal and adult ventricular myocytes could be a contributing factor.
Similar to studies of the regulation of ER motility [19–22, 29], we demonstrate that the microtubule network regulates SR motility. Although a direct interaction between the microtubule network and the SR has not been shown, it has been postulated to be necessary to mechanically regulate the SR and T-tubule sarcolemma for proper regulation of Ca2+ spark activation and termination [30]. Indeed, perturbation of the microtubule network has been shown to alter L-type Ca2+ current, [Ca2+]i transients [30], Ca2+ sparks [31], and action potential waveform [32]. Our results suggest intact microtubules are necessary for maintenance of SR ultrastructure.
Kif5b has been implicated in ER motility in nonmuscle cells [29] and in the trafficking of Kv1.5 channels in heterologous cells and rat ventricular myocytes [12]. Likewise, the retrograde motor protein, dynein, has been previously shown to affect the trafficking of Kv1.5 channels in heterologous cells and rat cardiac myocytes [33, 34] and ClC-2 chloride channel in hippocampus [35]. Interestingly, we found that expression of a dominant-negative Kif5b and inhibition of dynein decreased. At present, however, the specific role of Kif5b and dynein in SR motility, couplon formation, and EC coupling is unknown. Future studies should examine the role of microtubules and molecular motor proteins in these important issues.
On the basis of these findings, we propose a new model for the role and regulation of SR structure and motility in EC coupling in ventricular myocytes (Figure 8(e)). In this model, the SR forms a vast interconnected network with distinct microdomains (i.e., junctional domains, corbular domains) throughout the ventricular myocyte. The position of SR structures likely depends on the relative activities of microtubule-associated Kif5b (anterograde motor), and dynein (retrograde motor) regulate SR structure and motility. We propose that the function of these structural rearrangements would include formation of new interconnections with neighboring SR network, formation of new junctions between SR and sarcolemma (i.e., couplons), and possibly regulation of trafficking of important EC coupling proteins through the SR bouton. An important implication of this model is that the exquisite fidelity of the [Ca2+]i transient in ventricular myocytes is not likely produced by the activation of Ca2+ release from a permanently static SR structure. Rather, it may result from the activation of a temporally averaged number of SR Ca2+ release units from the formation and dissolution of SR-sarcolemmal junctions that are sensitive to perturbations in the microtubule network such as those observed in cardiac pathology.
5. Limitations
All studies that use cultured ventricular myocytes and pharmacological agents should be interpreted cautiously. For example, cultured adult ventricular myocytes undergo deterioration of their T-tubules and experience electrophysiological changes [36, 37]. Furthermore, it is important to note that although EHNA is known to disrupt the ATPase activity of dynein [23, 35, 38], it also inhibits phosphodiesterases in cardiac myocytes [39]. Thus, we cannot rule out the possibility that a nondynein molecular motor that is modulated by cAMP levels is involved in SR motility. In spite of these limitations, we contend that novel insights into the bases of SR structure in ventricular myocytes have been obtained in the present experiments. These insights should form the bases of new hypotheses that can be best tested in appropriate animal models.
6. Summary and Conclusions
The present study suggests that normal cardiovascular function is accomplished via complex regulation of SR ultrastructure, [Ca2+]i, and contraction. Our study offers a novel conceptual model on the regulation of SR dynamics in ventricular myocytes. Based on this model, we propose that the fidelity of the [Ca2+]i transient is not likely produced by the activation of Ca2+ release from a permanently static SR but rather may result from the activation of temporally averaged number of SR Ca2+ release units forming and dissolving SR-sarcolemmal junctions that are sensitive to perturbations of the microtubule network. Our results and proposal merit further investigation.
Supplementary Material
Acknowledgments
The authors thank Mr. Edward Cheng and Drs. Rose Dixon, Carmen A. Ufret-Vincenty, Manuel F. Navedo, and Madeline Nieves-Cintrón for reading this paper. Ms. Stephanie Lara helped with electron microscopy. The study was supported by Grants from NIH (HL85686 and T32-HL07828) and the AHA (0840094N).
References
- 1.Franzini-Armstrong C, Protasi F, Ramesh V. Shape, size, and distribution of Ca2+ release units and couplons in skeletal and cardiac muscles. Biophysical Journal. 1999;77(3):1528–1539. doi: 10.1016/S0006-3495(99)77000-1. [DOI] [PMC free article] [PubMed] [Google Scholar]
- 2.Franzini-Armstrong C, Protasi F. Ryanodine receptors of striated muscles: a complex channel capable of multiple interactions. Physiological Reviews. 1997;77(3):699–729. doi: 10.1152/physrev.1997.77.3.699. [DOI] [PubMed] [Google Scholar]
- 3.Fabiato A. Calcium-induced release of calcium from the cardiac sarcoplasmic reticulum. American journal of physiology. 1983;245(1):C1–C14. doi: 10.1152/ajpcell.1983.245.1.C1. [DOI] [PubMed] [Google Scholar]
- 4.Cheng H, Lederer WJ, Cannell MB. Calcium sparks: elementary events underlying excitation-contraction coupling in heart muscle. Science. 1993;262(5134):740–744. doi: 10.1126/science.8235594. [DOI] [PubMed] [Google Scholar]
- 5.Gómez AM, Valdivia HH, Cheng H, et al. Defective excitation-contraction coupling in experimental cardiac hypertrophy and heart failure. Science. 1997;276(5313):800–806. doi: 10.1126/science.276.5313.800. [DOI] [PubMed] [Google Scholar]
- 6.Soeller C, Cannell MB. Numerical simulation of local calcium movements during L-type calcium channel gating in the cardiac diad. Biophysical Journal. 1997;73(1):97–111. doi: 10.1016/S0006-3495(97)78051-2. [DOI] [PMC free article] [PubMed] [Google Scholar]
- 7.Inoue M, Bridge JHB. Ca2+ sparks in rabbit ventricular myocytes evoked by action potentials: involvement of clusters of L-type Ca2+ channels. Circulation Research. 2003;92(5):532–538. doi: 10.1161/01.RES.0000064175.70693.EC. [DOI] [PubMed] [Google Scholar]
- 8.Devic E, Xiang Y, Gould D, Kobilka B. β-Adrenergic receptor subtype-specific signaling in cardiac myocytes from β1 and β2 adrenoceptor knockout mice. Molecular Pharmacology. 2001;60(3):577–583. [PubMed] [Google Scholar]
- 9.Shioya T. A simple technique for isolating healthy heart cells from mouse models. Journal of Physiological Sciences. 2007;57(6):327–335. doi: 10.2170/physiolsci.RP010107. [DOI] [PubMed] [Google Scholar]
- 10.Zhou YY, Wang SQ, Zhu WZ, et al. Culture and adenoviral infection of adult mouse cardiac myocytes: methods for cellular genetic physiology. American Journal of Physiology—Heart and Circulatory Physiology. 2000;279(1):H429–H436. doi: 10.1152/ajpheart.2000.279.1.H429. [DOI] [PubMed] [Google Scholar]
- 11.Fliegel L, Burns K, MacLennan DH, Reithmeier RAF, Michalak M. Molecular cloning of the high affinity calcium-binding protein (calreticulin) of skeletal muscle sarcoplasmic reticulum. Journal of Biological Chemistry. 1989;264(36):21522–21528. [PubMed] [Google Scholar]
- 12.Zadeh AD, Cheng Y, Xu H, et al. Kif5b is an essential forward trafficking motor for the Kv1.5 cardiac potassium channel. Journal of Physiology. 2009;587(19):4565–4574. doi: 10.1113/jphysiol.2009.178442. [DOI] [PMC free article] [PubMed] [Google Scholar]
- 13.Wei S, Guo A, Chen B, et al. T-tubule remodeling during transition from hypertrophy to heart failure. Circulation Research. 2010;107(4):520–531. doi: 10.1161/CIRCRESAHA.109.212324. [DOI] [PMC free article] [PubMed] [Google Scholar]
- 14.Balijepalli RC, Foell JD, Hall DD, Hell JW, Kamp TJ. Localization of cardiac L-type Ca2+ channels to a caveolar macromolecular signaling complex is required for β2-adrenergic regulation. Proceedings of the National Academy of Sciences of the United States of America. 2006;103(19):7500–7505. doi: 10.1073/pnas.0503465103. [DOI] [PMC free article] [PubMed] [Google Scholar]
- 15.Yi H, Leunissen JLM, Shi GM, Gutekunst CA, Hersch SM. A novel procedure for pre-embedding double immunogold-silver labeling at the ultrastructural level. Journal of Histochemistry and Cytochemistry. 2001;49(3):279–284. doi: 10.1177/002215540104900301. [DOI] [PubMed] [Google Scholar]
- 16.Merzlyak EM, Goedhart J, Shcherbo D, et al. Bright monomeric red fluorescent protein with an extended fluorescence lifetime. Nature Methods. 2007;4(7):555–557. doi: 10.1038/nmeth1062. [DOI] [PubMed] [Google Scholar]
- 17.Asghari P, Schulson M, Scriven DRL, Martens G, Moore EDW. Axial tubules of rat ventricular myocytes form multiple junctions with the sarcoplasmic reticulum. Biophysical Journal. 2009;96(11):4651–4660. doi: 10.1016/j.bpj.2009.02.058. [DOI] [PMC free article] [PubMed] [Google Scholar]
- 18.Forbes MS, Sperelakis N. The membrane systems and cytoskeletal elements of mammalian myocardial cells. Cell and Muscle Motility. 1983;3:89–155. doi: 10.1007/978-1-4615-9296-9_5. [DOI] [PubMed] [Google Scholar]
- 19.Waterman-Storer CM, Salmon ED. Endoplasmic reticulum membrane tubules are distributed by microtubules in living cells using three distinct mechanisms. Current Biology. 1998;8(14):798–806. doi: 10.1016/s0960-9822(98)70321-5. [DOI] [PubMed] [Google Scholar]
- 20.Lee C, Chen LB. Dynamic behavior of endoplasmic reticulum in living cells. Cell. 1988;54(1):37–46. doi: 10.1016/0092-8674(88)90177-8. [DOI] [PubMed] [Google Scholar]
- 21.Terasaki M, Chen LB, Fujiwara K. Microtubules and the endoplasmic reticulum are highly interdependent structures. Journal of Cell Biology. 1986;103(4):1557–1568. doi: 10.1083/jcb.103.4.1557. [DOI] [PMC free article] [PubMed] [Google Scholar]
- 22.Woźniak MJ, Bola B, Brownhill K, Yang YC, Levakova V, Allan VJ. Role of kinesin-1 and cytoplasmic dynein in endoplasmic reticulum movement in VERO cells. Journal of Cell Science. 2009;122(12):1979–1989. doi: 10.1242/jcs.041962. [DOI] [PMC free article] [PubMed] [Google Scholar]
- 23.Bouchard P, Penningroth SM, Cheung A, Gagnon C, Bardin CW. Erythro-9-[3-(2-hydroxynonyl)]adenine is an inhibitor of sperm motility that blocks dynein ATPase and protein carboxylmethylase activities. Proceedings of the National Academy of Sciences of the United States of America. 1981;78(2):1033–1036. doi: 10.1073/pnas.78.2.1033. [DOI] [PMC free article] [PubMed] [Google Scholar]
- 24.Flucher BE, Franzini-Armstrong C. Formation of junctions involved in excitation-contraction coupling in skeletal and cardiac muscle. Proceedings of the National Academy of Sciences of the United States of America. 1996;93(15):8101–8106. doi: 10.1073/pnas.93.15.8101. [DOI] [PMC free article] [PubMed] [Google Scholar]
- 25.Scriven DRL, Dan P, Moore EDW. Distribution of proteins implicated in excitation-contraction coupling in rat ventricular myocytes. Biophysical Journal. 2000;79(5):2682–2691. doi: 10.1016/S0006-3495(00)76506-4. [DOI] [PMC free article] [PubMed] [Google Scholar]
- 26.Jayasinghe ID, Cannell MB, Soeller C. Organization of ryanodine receptors, transverse tubules, and sodium-calcium exchanger in rat myocytes. Biophysical Journal. 2009;97(10):2664–2673. doi: 10.1016/j.bpj.2009.08.036. [DOI] [PMC free article] [PubMed] [Google Scholar]
- 27.Chopra N, Yang T, Asghari P, et al. Ablation of triadin causes loss of cardiac Ca2+ release units, impaired excitation-contraction coupling, and cardiac arrhythmias. Proceedings of the National Academy of Sciences of the United States of America. 2009;106(18):7636–7641. doi: 10.1073/pnas.0902919106. [DOI] [PMC free article] [PubMed] [Google Scholar]
- 28.Franzini-Armstrong C, Protasi F, Tijskens P. The assembly of calcium release units in cardiac muscle. Annals of the New York Academy of Sciences. 2005;1047:76–85. doi: 10.1196/annals.1341.007. [DOI] [PubMed] [Google Scholar]
- 29.Bola B, Allan V. How and why does the endosplasmic reticulum move? Biochemical Society Transactions. 2009;37(5):961–965. doi: 10.1042/BST0370961. [DOI] [PubMed] [Google Scholar]
- 30.Gómez AM, Kerfant BG, Vassort G. Microtubule disruption modulates Ca2+ signaling in rat cardiac myocytes. Circulation Research. 2000;86(1):30–36. doi: 10.1161/01.res.86.1.30. [DOI] [PubMed] [Google Scholar]
- 31.Iribe G, Ward CW, Camelliti P, et al. Axial stretch of rat single ventricular cardiomyocytes causes an acute and transient increase in Ca2+ spark rate. Circulation Research. 2009;104(6):787–795. doi: 10.1161/CIRCRESAHA.108.193334. [DOI] [PMC free article] [PubMed] [Google Scholar]
- 32.Kerfant BG, Vassort G, Gómez AM. Microtubule disruption by colchicine reversibly enhances calcium signaling in intact rat cardiac myocytes. Circulation Research. 2001;88(7):E59–E65. doi: 10.1161/hh0701.090462. [DOI] [PubMed] [Google Scholar]
- 33.Loewen ME, Wang Z, Eldstrom J, et al. Shared requirement for dynein function and intact microtubule cytoskeleton for normal surface expression of cardiac potassium channels. American Journal of Physiology—Heart and Circulatory Physiology. 2009;296(1):H71–H83. doi: 10.1152/ajpheart.00260.2008. [DOI] [PubMed] [Google Scholar]
- 34.Choi WS, Khurana A, Mathur R, Viswanathan V, Steele DF, Fedida D. Kv1.5 surface expression is modulated by retrograde trafficking of newly endocytosed channels by the dynein motor. Circulation Research. 2005;97(4):363–371. doi: 10.1161/01.RES.0000179535.06458.f8. [DOI] [PubMed] [Google Scholar]
- 35.Dhani SU, Mohammad-Panah R, Ahmed N, Ackerley C, Ramjeesingh M, Bear CE. Evidence for a functional interaction between the ClC-2 chloride channel and the retrograde motor dynein complex. Journal of Biological Chemistry. 2003;278(18):16262–16270. doi: 10.1074/jbc.M209828200. [DOI] [PubMed] [Google Scholar]
- 36.Mitcheson JS, Hancox JC, Levi AJ. Cultured adult cardiac myocytes: future applications, culture methods, morphological and electrophysiological properties. Cardiovascular Research. 1998;39(2):280–300. doi: 10.1016/s0008-6363(98)00128-x. [DOI] [PubMed] [Google Scholar]
- 37.Leach RN, Desai JC, Orchard CH. Effect of cytoskeleton disruptors on L-type Ca channel distribution in rat ventricular myocytes. Cell Calcium. 2005;38(5):515–526. doi: 10.1016/j.ceca.2005.07.006. [DOI] [PubMed] [Google Scholar]
- 38.Penningroth SM. Erythro-9-[3-(2-hydroxynonyl)]adenine and Vanadate as probes for microtubule-based cytoskeletal mechanochemistry. Methods in Enzymology. 1986;134:477–487. doi: 10.1016/0076-6879(86)34114-4. [DOI] [PubMed] [Google Scholar]
- 39.Mery PF, Pavoine C, Pecker F, Fischmeister R. Erythro-9-(2-hydroxy-3-nonyl)adenine inhibits cyclic GMP-stimulated phosphodiesterase in isolated cardiac myocytes. Molecular Pharmacology. 1995;48(1):121–130. [PubMed] [Google Scholar]
Associated Data
This section collects any data citations, data availability statements, or supplementary materials included in this article.