

Abstract
Cronartium quercuum f. sp. fusiforme is the causative agent of fusiform rust disease of southern pines in the United States. This disease is characterized by the formation of woody branch and stem galls. Differential display was used to identify pine genes whose expression is altered by C. quercuum f. sp. fusiforme infection and to identify C. quercuum f. sp. fusiforme genes that are expressed in fusiform rust galls. Six pine cDNAs that appeared to be differentially expressed in galled and healthy stems and 13 C. quercuum f. sp. fusiforme cDNAs expressed in galled tissues were identified. A probe that hybridizes specifically to C. quercuum f. sp. fusiforme 18S rRNA was used to estimate that 14% of the total RNA in fusiform rust galls was from C. quercuum f. sp. fusiforme. This finding was used to calibrate gene expression levels in galls when comparing them to expression levels in uninfected pines or in isolated C. quercuum f. sp. fusiforme cultures. According to Northern analysis and reverse transcriptase PCR analysis, all six of the pine clones were expressed at lower levels in galls than in healthy tissues. Seven of the nine C. quercuum f. sp. fusiforme clones that were assayed were expressed at higher levels in galls than in axenic culture. A number of the cDNAs encode proteins that are similar to those that play roles in plant development, plant defense, or fungal stress responses.
Fusiform rust disease is characterized by the formation of woody galls on pine stems and branches. The galls increase mortality, reduce wood quality, and cause significant economic losses in the southeastern United States, particularly on loblolly pine (Pinus taeda) and slash pine (Pinus elliottii var. elliottii) (6, 14). The xylem within fusiform rust galls proliferates extensively and lacks the annual ring structure typical of pine wood. Although these macroscopic manifestations of the disease are striking and suggest a severe dysregulation of normal growth, microscopic examination indicates that the affected tissues remain relatively well organized and contain the typical xylem and phloem cell types (40, 41). The proportion of cell types and their sizes, however, are abnormal in the galls. Most notably, the number of ray parenchyma cells within galls is approximately fourfold greater than in healthy xylem, and the number of resin ducts is almost twofold greater in galls (40, 41). In addition, the ray parenchyma cells in galls are wider and longer (41) and the tracheids are shorter and less tapered than those in normal wood (40, 41). The individual cells of the phloem are also larger than those in uninfected tissues (40).
These characteristic effects suggest that the fungus causing fusiform rust, Cronartium quercuum (Berk.) Miyabe ex. f. sp. fusiforme, alters normal wood growth by influencing cellular differentiation and cellular development at the vascular cambium. Gall symptoms and hyphae of C. quercuum f. sp. fusiforme are not seen in tissue formed prior to infection, indicating that once it establishes itself at the vascular cambium the fungus only grows outward as the host tissues grow (41). It is also capable of vertical growth, thus causing a gradual elongation of the gall. Increased cytokinin activity and auxin-like activity are both associated with gall development (64, 67), but beyond this nothing is known about how C. quercuum f. sp. fusiforme induces the changes in growth and development that lead to fusiform rust gall formation. An improved understanding of how pine gene expression is altered by this disease interaction would aid efforts to understand the basic biology of gall formation while simultaneously elucidating the molecular components essential for normal pine stem formation.
Within fusiform rust galls, C. quercuum f. sp. fusiforme is found primarily in the parenchyma cells of the xylem rays, phloem rays, and resin ducts (40, 41). Like other biotrophic fungi, C. quercuum f. sp. fusiforme produces haustoria in these living cells (28). Haustoria are likely sites for pathogen nutrient acquisition as well as sites for signal exchange between the host and pathogen (32, 81). Because C. quercuum f. sp. fusiforme establishes perennial, biotrophic infections on pine, the ability to withstand or circumvent host defenses for extended periods of time is a prerequisite for successful gall induction. A growing body of evidence supports the theory that biotrophic microorganisms enable their symbiotic or parasitic relationships with plants by suppressing host defenses (18, 35, 45, 48, 49, 63, 69, 73, 86). The rust fungus Uromyces vignae suppresses defenses by decreasing the adhesion between the host plant cell wall and its plasma membrane (57), but in general the mechanisms underlying host defense suppression by biotrophs are not well understood.
C. quercuum f. sp. fusiforme is an obligate pathogen that must grow in oak leaves as well as in pine wood to complete its life cycle. Although it has no free-living form in nature, C. quercuum f. sp. fusiforme's basidiospores can be induced to establish slow-growing axenic cultures (5, 34, 36, 37, 38). These cultures do not sporulate or go through any other developmental changes, but they are an experimentally valuable source of pure C. quercuum f. sp. fusiforme DNA and RNA.
The complicated biology of this pathogen combined with the long life cycles of its host plants makes fusiform rust unsuitable for forward genetic analysis. We chose, therefore, to compare gene expression in galled and healthy pine samples as a way to identify candidate genes involved in wood development, biotrophic growth, and pine defense responses. An improved understanding of such genes will contribute to breeding or genetic engineering projects designed to improve wood quality or disease resistance. Using differential display (51), we isolated several differentially expressed pine genes and several C. quercuum f. sp. fusiforme genes expressed in galls. After the average amount of C. quercuum f. sp. fusiforme RNA in galls was determined, the expression levels of each gene in galled pine, healthy pine, and axenic C. quercuum f. sp. fusiforme were measured. Eight of the cloned gene fragments have significant sequence homology to known genes. Possible functions for these differentially expressed genes in wood development, biotrophic growth, or defense are discussed.
MATERIALS AND METHODS
Plant and pathogen propagation.
Bulk seed lots from slash pine (UFSS-2 and UFRSC-4) and loblolly pine (10-8 and 10-5) were planted at the USDA Forest Service Resistance Screening Center near Asheville, N.C. All C. quercuum f. sp. fusiforme inoculations were performed by personnel at the Resistance Screening Center using standard center procedures (76). Trees were sacrificed at approximately 1.5 years of age during daylight hours between May and October. Tissues were flash frozen in liquid nitrogen and stored at −80°C. A single basidiospore culture of C. quercuum f. sp. fusiforme (no. 2-74-2-3; provided by P. Spaine, USDA Forestry Sciences Laboratory, Athens, Ga.) was maintained on 0.1% peptone-0.5% glucose-0.1% yeast extract-5% agar (PGY). Cultures were transferred every 3 to 5 weeks to maintain active growth. To reduce the amount of agar present during C. quercuum f. sp. fusiforme RNA and DNA extractions, 4 mm3 of C. quercuum f. sp. fusiforme growing on PGY was transferred to sterile dialysis membranes (12- to 14-kDa molecular mass cutoff; Spectrum Medical Industries, Inc., Houston, Tex.) on fresh PGY. After 2 to 3 weeks, the cultures were lifted from the membranes, immediately ground under liquid nitrogen, and stored at −80°C.
Isolation of nucleic acids.
Total RNA for differential display was extracted from individual pine trees by the method of Chang et al. (12). Pine RNA for all other experiments was extracted from pooled pine samples by using a protocol posted at the Dendrome website (http://dendrome.ucdavis.edu/Protocols/rna_from_needles.html) and cleaned with the RNeasy kit (Qiagen, Santa Clarita, Calif.). Pine DNA was extracted by the method of Wagner et al. (83). C. quercuum f. sp. fusiforme RNA was extracted by the technique described by Wendland et al. (87) and further purified with the RNeasy kit (Qiagen). C. quercuum f. sp. fusiforme DNA was isolated from ground mycelia with the DNeasy kit (Qiagen). RNA quality was assessed on a denaturing formaldehyde gel, and its concentration was determined by spectrophotometry (for differential-display reactions) or with the RiboGreen RNA quantitation kit (Molecular Probes, Eugene, Oreg.; for all other experiments with RNA). DNA concentrations were determined with the PicoGreen quantitation kit (Molecular Probes). The RiboGreen and PicoGreen assays were run in triplicate for each sample. These assays are highly sensitive and are not affected by the presence of proteins or free nucleotides (44, 70). Furthermore, PicoGreen's high fluorescence enhancement upon binding to double-stranded DNA (dsDNA) makes it possible to quantitate dsDNA in the presence of equimolar amounts of single-stranded DNA, RNA, or proteins (70).
Differential-display experiments.
Total RNA from healthy stem tissue and galled stem tissue (Fig. 1) was reverse transcribed with an oligo(dT) primer. The Delta differential-display kit (Clontech, Palo Alto, Calif.) was used to amplify subsets of each cDNA sample with pairs of arbitrary primers (25- or 26-mers) or with one arbitrary primer and one anchored oligo(dT) primer (30-mer). To optimize the protocol for our experimental system and increase the number of visible bands, the number of high-stringency cycles was increased from 25 to 35. Two concentrations of cDNA template were amplified for each cDNA sample. The higher-concentration reaction mixture contained four times as much cDNA template as did the lower. Amplified products were analyzed by polyacrylamide gel electrophoresis and autoradiography. All displays were replicated four times. Only those cDNAs exhibiting the same pattern in three or more displays were cloned by cutting them from the gel, reamplifying them, and ligating them into the pNoTA/T7 shuttle vector by blunt-end ligation (5 Prime-3 Prime, Boulder, Colo.).
FIG. 1.
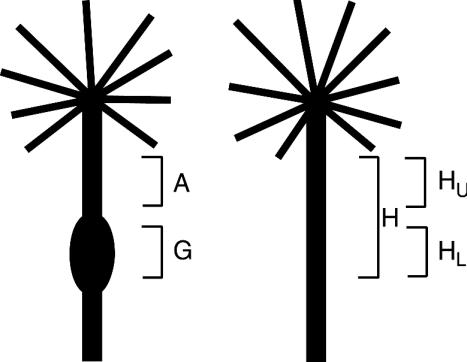
Classification of pine tissues used in this study. H, healthy stem tissue from a tree exposed to C. quercuum f. sp. fusiforme inoculum with no symptoms of infection.
Because more than one cDNA fragment could be present within any single band on the differential-display gel, clones were screened by hybridization to the original differential-display PCR products as described by Vögeli-Lange et al. (82). A single clone with the expression pattern predicted by the differential-display experiments was sequenced and analyzed for homologies to known protein and nucleic acid sequences with the blastx, blastn, and tblastx programs (4). Alignments considered insignificant in this study had BLAST E values greater than 1e-3.
Determining clones' genomes of origin.
PCR primer pairs specific to each of the 19 clones were designed with Lasergene PRIMERSELECT software (DNASTAR Inc., Madison, Wis.) (Table 1).
TABLE 1.
PCR primers used to determine the genome of origin for each differential-display clone
| Clone | Sequence of gene-specific primer
|
Sizea (bp) | |
|---|---|---|---|
| 1 | 2 | ||
| DD1 | TGACTGGCAGGCGAACAATAGAT | AGCATATCAACCACCCGTCTCATT | 223 |
| DD5 | CCGGTAACGTTCAAAGGGGTAGG | CGCGTCGAAAAGAAGTGTGAGC | 414 |
| DD6 | TCGAAAAGAAAAGAAACGGGAGAG | TATTGTCATCATCATTTCGCTGTCATTAT | 103 |
| DD55 | AAAGTCATGGCCTGCTGAGTTC | ATGAATTTAGCCCATTTCTGC | 83 |
| DD62 | CCCCATAGATACCTTCCTGAATTTGAACA | GTTGCTGGTGTCCGGGTATAAAACATT | 185 |
| DD63 | GACAACAAGCTGAATAGGGTAAGAGAT | CCATTTGAAGGAGGACCAGATTGAGTA | 103 |
| DD103 | CAAGACATTTCAAAGACGGACACA | ATTCATATTTCATTTCATTGGCATCTT | 132 |
| DD104 | GTTATACTCAATTGCGCTCGACGGCATTTT | CAACGGGTCCCAATTCTTTATCACCACTGT | 274 |
| DD106 | CGAAAGCTTATGGTTGGAGATTAGT | ATCAACAAGACCGAGCACGTAACTCT | 109 |
| DD110 | AAGAAAATGGGGACGTAACGATA | CATAAAATGTTGTACCCAAGGTTT | 151 |
| DD112 | ACCCATGTATGCCCCGTTTTC | CTTGTTTCCATTGTCCAGTGAT | 81 |
| DD115 | GTTGATATCTTAAACCGCTATTTTTCAGA | GAATCCCTTTATTGCTCGAGTATCAGAGAC | 110 |
| DD118 | TGGCAGAATCAACAACGGTCCTACG | CTGGTGGTGGGGGTCGATTGAGTGAA | 215 |
| DD120 | TAAAATGTCCGAATATAAAAGAATG | GAAGAGGCAGGGGTTACAGGTCAGA | 265 |
| DD125 | AAAACACGAAATATCATTGTAGAT | ATTTGGGACATGGGTTGGTTTT | 129 |
| DD128 | TAGCCATTATATCCAGTACTTCGGTTTC | TTTTTCCCTTCCCACTTTCACTATTG | 221 |
| DD133 | AAGAAGCAAAAGTAAGATGCAAAGATTT | AAGGCAGAAAAGTTGGGTAGGTATTAC | 191 |
| DD135 | AGCACCAGCTAGAACAGGCAGACT | CAGTACTAAATATGCGTAACCCTGGTATG | 116 |
| DD136 | ATTCGGTGGCCATTTCGCTCAG | AATACGGTTGTTGTTGTTGTTGTGGTTG | 191 |
Predicted size of the PCR product amplified from cDNA with these primers.
Measurement of fungal RNA in galls.
Oligonucleotide Cro-Ribo I (TCGATTGAAGTTCACCAAGAGGTAAGCTTCCAACAAACCA) is complementary to the C. quercuum f. sp. fusiforme 18S rRNA, but its sequence is only 38% identical to that of the 18S rRNA in P. elliottii. Oligonucleotide Univ-Ribo (GCTATTGGAGCTGGAATTACCGCGGCTGCTGGCACCAGAC) matches both the C. quercuum f. sp. fusiforme (accession no. L76494) and P. elliottii (accession no. D38245) 18S rRNA sequences perfectly. These oligonucleotides were 5′ end labeled with polynucleotide kinase and [γ-32P]ATP (54). RNA from galled pine, healthy pine, and C. quercuum f. sp. fusiforme tissue was dissolved in 18% formaldehyde-50% formamide-2× MOPS (morpholinepropanesulfonic acid). Twofold serial dilutions were made in the same formamide-formaldehyde solution, placed at 55°C for 15 min, and slot blotted onto duplicate Hybond-N membranes (Amersham, Buckinghamshire, England). The RNA was UV cross-linked to the membranes after air drying. Filters were hybridized with the rRNA probes as described by Thompson and Meagher (77). The membranes were exposed to a storage phosphor screen, and the signals were analyzed by a Storm phosphorimager and ImageQuant software (Amersham Pharmacia Biotech). This experiment was repeated four times with four different pairs of RNA samples, one from loblolly pine and three from slash pine.
Quantification of gene expression with RNA gel blots.
RNA from four types of pine tissue was analyzed: galled tissue from a tree infected by C. quercuum f. sp. fusiforme (G), asymptomatic stem tissue from a galled tree (A), stem tissue from the lower portion of a healthy tree, corresponding to the position of the gall on an infected tree of the same age (HL), and stem tissue from the upper portion of a healthy tree, corresponding to the position of the asymptomatic tissue on an infected tree of the same age (HU) (Fig. 1). The transcript level of each clone was tested in two to four trials, and the RNA for each trial was extracted from six healthy trees and six galled trees of the same species, size, age (approximately 18 months old), and sacrifice date. Fifteen micrograms of total RNA from each tissue type was resolved on a 1% agarose-0.66 M formaldehyde gel, blotted onto nylon (7), and UV cross-linked to the membrane. Probes for each clone were prepared with the Strip-EZ DNA labeling kit (Ambion) and hybridized to the RNA blots in 10 ml of ULTRAhyb (Ambion). After each hybridization, the RNA blots were stripped with reagents from the Strip-EZ DNA labeling kit. Each blot was reprobed with a transcript-specific probe four or five times. After all clone-specific hybridizations were completed, the blots were stripped a final time and probed with the 32P-end-labeled Univ-Ribo oligonucleotide as described above. Results were measured with a phosphorimager.
The hybridization signals were corrected for background hybridization, amount of fungal RNA in galls, and total RNA loading before the relative levels of gene expression were calculated. To correct for nonspecific background hybridization, the signal from a portion of the blot to which the probe did not hybridize specifically was subtracted from the signal generated by a specifically bound region of equal area. This adjustment prevented an underestimation of gene expression differences between samples when the transcript-specific signal was not high. Signals from C. quercuum f. sp. fusiforme transcripts expressed in galls were also multiplied by 7 because only one-seventh (∼14%) of the gall RNA loaded on the blots came from C. quercuum f. sp. fusiforme (see Results). Conversely, signals from pine transcripts in galls were multiplied by 1.16 to account for the dilution of pine RNA by C. quercuum f. sp. fusiforme RNA in these samples. To correct for unequal loading between lanes, the corrected transcript-specific signals were multiplied by the ratio of Univ-Ribo counts from the two tissues being compared (e.g., G versus C. quercuum f. sp. fusiforme culture for fungal transcripts or G versus HL for pine transcripts). Finally, to determine the relative steady-state level of each transcript, either its corrected G signal was divided by its corrected signal in C. quercuum f. sp. fusiforme culture (for C. quercuum f. sp. fusiforme genes) or its corrected HL signal was divided by its corrected G signal (for pine genes). The differences calculated for each transcript were averaged over two to four trials.
Quantification of pine gene expression by relative RT-PCR.
One microgram of total RNA from galled or healthy pine stems was reverse transcribed with the SMART PCR cDNA synthesis kit (Clontech). Equivalent amplification of all transcripts was accomplished with 17 cycles of PCR using a universal primer for the SMART adaptor. Final cDNA concentrations were determined with the high-range PicoGreen DNA quantitation assay (Molecular Probes). The number of cycles required to produce a product within the linear amplification range was determined for each transcript-specific primer pair by adding 1 ng of cDNA from either G or HL tissue to each of 10 identical 25-μl PCR mixtures (1.5 mM MgCl, 200 μM deoxynucleoside triphosphates, 400 nM [each] gene-specific primer, 0.625 U of Taq DNA polymerase, 5 nM [α-33P]dATP) and cycling at 94°C for 1 min, followed by 33 cycles of 94°C for 30 s, 55°C for 30 s, and 72°C for 30 s. One reaction mixture was removed and placed on ice after every odd cycle from 15 to 33 cycles. The ten reactions were run on a denaturing 5% polyacrylamide gel, and the signal intensity produced by each PCR product was measured with a phosphorimager. A cycle number in the middle of the linear amplification range was used in subsequent reverse transcriptase PCR (RT-PCR) experiments for the respective primer pair.
Serial dilutions of G or HL cDNA were amplified and quantified in the RT-PCR experiments as described above for the linear-range experiments. Signals for G and HL samples were compared to determine differences in transcript levels. All relative RT-PCR experiments were performed three or four times. Each trial used RNA extracted from six galled and six healthy trees that were harvested on the same day, but different sets of trees and thus different RNA samples were used for each trial. The average difference between G and HL transcript levels over all RT-PCR trials for each tested transcript is reported.
All cDNA samples used for relative RT-PCR were checked for genomic DNA contamination. Primers which flank a 134-bp intron in a pine actin gene (accession no. M36171; from Pinus contorta) were designed. The primer flanking the 5′ side of the intron was AGGAAGTACAGTGTTTGGATCGGAGGTT, and the primer flanking its 3′ side was AAAGGCCAATCATAAAGCATAATCAATAGA. These primers were used to amplify each cDNA template, with template dilutions and experimental conditions similar to those for the RT-PCR experiments.
Nucleotide sequence accession numbers.
The nucleotide sequence data appear in the GenBank expressed sequence tag (EST) database under the following accession numbers: DD1, BE656687; DD55, BE656689; DD110, BE656690; DD120, BE656691; DD125, BE656693; DD128, BE656694; DD5, BE656695; DD6, BE656696; DD62 BE656697; DD63, BE656698; DD103, BE656699; DD104, BE656700; DD106, BE656701; DD112, BE656702; DD115, BE656703; DD118, BE656704; DD133, BE656705; DD135, BE656706; DD136, BE656707.
RESULTS
Isolation of differentially expressed transcripts.
Differential display was used to identify cDNAs that were present at different levels in galled and healthy tissues of pine. This was done to identify pine genes whose expression patterns in these tissues differed and to identify C. quercuum f. sp. fusiforme genes expressed in galls. In total, 52 primer pairs were used to amplify each of four sets of RNA samples from galled and healthy tissue. Only cDNA fragments displayed in the same differential pattern in at least three of the four sets of samples were considered differentially displayed. Forty differentially displayed cDNA fragments ranging in size from 56 to 909 bp, not including primer sequences, were cloned and sequenced. Fifteen of these were homologous to ribosomal sequences found in the National Center for Biotechnology Information database (data not shown). Three others of less than 100 bp were discarded. The remaining 19 clones were analyzed further. Thus, approximately 0.4 differentially expressed transcripts were identified per primer pair combination.
Determining the genome from which each cDNA originated.
Fusiform rust galls contain both pine and C. quercuum f. sp. fusiforme RNA; thus it was necessary to determine if each cDNA clone originated in the pine or C. quercuum f. sp. fusiforme genome. The origin of each cDNA was assessed by PCR with gene-specific primers (Table 1). Southern blots were used to confirm that each amplified band corresponded to the intended gene. Figure 2 presents the results from two of these experiments as examples. Of the 19 clones under investigation, 6 came from the pine genome and 13 came from the C. quercuum f. sp. fusiforme genome (Tables 2 and 3). The primer pairs specific to DD5 and DD136 produced bands that were larger than the sizes predicted from their cDNA sequences (data not shown). Thus, the genes corresponding to these two clones appear to contain at least one intron within the region amplified by their primers.
FIG. 2.
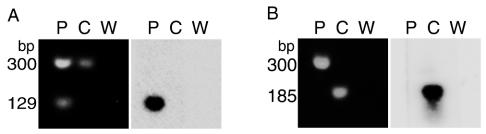
Examples of experiments determining the genome from which each differential-display clone originated. Primers specific to each DNA clone (Table 1) were used in PCR mixtures containing pine genomic DNA (P), C. quercuum f. sp. fusiforme genomic DNA (C), or water (W) as the template. 18S ribosomal DNA primers in each reaction produced a band of approximately 300 bp, which served as a positive control. All PCR products were resolved on agarose gels, blotted onto nylon membranes, and probed with the fragment from which the clone-specific primers had been designed. In each panel, agarose gels stained with SYBR I (Molecular Probes) are on the left and the corresponding Southern blots are on the right. (A) Results from DD125-specific primers. (B) Results from DD62-specific primers.
TABLE 2.
Differentially displayed cDNA clones from pine
| Clone namea | Clone size (bp) | Homologous sequence (NCBI accession no.) | Amino acid similarity (%) | BLAST E value(s) | Transcript size (bp)b | Suppression in gallsc (fold) |
|---|---|---|---|---|---|---|
| DD1 | 235 | RLK gene (AC010155) | 78 | 9e-23 | ND | 2.2 |
| DD55 | 139 | None | ND | 3.4 | ||
| DD110 | 213 | 3′ UTR of pine EST (AA556243) encoding an LTP | 61 | 8e-94, 4e-20d | 750 | 1.4 |
| DD120 | 301 | None | 1,150 | 2.0 | ||
| DD125 | 160 | 3′ UTR of pine EST (AI812707) encoding α-tubulin | 99 | 8e-86, 4e-39d | 1,600 | 2.7 |
| DD128 | 261 | None | 1,300 | 2.5 |
Accession numbers for these clones appear in the GenBank EST database as follows: DD1, BE656687; DD55, BE656689; DD110, BE656690; DD120, BE656691; DD125, BE656693; DD128, BE656694.
Predicted size of full-length transcript, as estimated from Northern blots. ND, not determined.
Average amount of steady-state mRNA suppression in galled tissue relative to healthy tissue. For DD1 and DD55, relative steady-state mRNA levels for the transcripts were determined by relative RT-PCR. All others were determined by Northern blotting.
First value refers to the comparison between the clone and a pine EST; second value refers to the comparison between the translated pine EST and a protein with predicted or known function in the NCBI database.
TABLE 3.
Differentially displayed cDNA clones from C. quercuum f. sp. fusiforme
| Clone namea | Clone size (bp) | Homologous sequence (NCBI accession no.) | Amino acid similarity (%) | BLAST E value | Transcript size (bp)b | Induction in gallsc (fold) |
|---|---|---|---|---|---|---|
| DD5 | 909 | Serine carboxypeptidase (P52718) | 49 | 8e-34 | 1,900 | 17d |
| DD6 | 265 | None | ND | ND | ||
| DD62 | 186 | None | 650 | 2 | ||
| DD63 | 167 | Heat shock protein (P41887) | 89 | 3e-17 | 900 | 3 |
| DD103 | 180 | None | ND | ND | ||
| DD104 | 328 | Cyclophilin (P21569) | 84 | 2e-22 | 800 | 2 |
| DD106 | 167 | None | 600 | 2 | ||
| DD112 | 155 | None | 950 | 14 | ||
| DD115 | 305 | Cytochrome P450 reductase (BAB21543) | 78 | 1e-30 | ND | ND |
| DD118 | 335 | None | 1,400 | 3 | ||
| DD133 | 276 | None | ND | ND | ||
| DD135 | 164 | Cytochrome c oxidase (NP_540382) | 92 | 2e-18 | 1,900 | None |
| DD136 | 256 | None | 1,250 | None |
Accession numbers for these clones appear in the GenBank EST database as follows: DD5, BE656695; DD6, BE656696; DD62, BE656697; DD63, BE656698; DD103, BE656699; DD104, BE656700; DD106, BE656701; DD112, BE656702; DD115, BE656703; DD118, BE656704; DD133, BE656705; DD135, BE656706; DD136, BE656707.
Predicted size of full-length transcript, as estimated from Northern blots. ND, not determined.
Average amount of steady-state mRNA elevation in galled tissues, relative to C. quercuum f. sp. fusiforme growing in culture.
No DD5 signal above background was ever detected in C. quercuum f. sp. fusiforme RNA. As a consequence, background signals were not subtracted and mRNA difference was calculated relative to background.
Homology of the cDNA clones to previously reported genes.
To learn more about the putative biological functions of the differentially displayed clones, the sequence of each was compared to those of known genes by using several BLAST programs (4). Three of the pine cDNA fragments were homologous to other sequences in the National Center for Biotechnology (NCBI) databases (Table 2). The deduced amino acid sequence from clone DD1 is similar to those of many proteins thought to be receptor-like protein kinases (RLKs), including LRPKm1 from Malus × domestica (46) and HAESA, an RLK from Arabidopsis thaliana (42). The DD1-encoded sequence aligns with the carboxyl ends of these plant RLKs, in the catalytic domain just beyond the most highly conserved regions of the proteins (84) (data not shown). This region contains 2 of 12 conserved protein kinase domains and an invariant arginine residue (33). The nucleotide sequence of clone DD110 is identical to the predicted 3′ untranslated region (UTR) of loblolly pine EST 1CA7H (accession no. AA556243; data not shown). 1CA7H's deduced amino acid sequence is very similar to those of several lipid transfer proteins, including the LTP3 protein from barley (58) (Table 2). The DD125 nucleotide sequence is identical to that of the 3′ UTR of pine EST 18B5 (accession no. AI812707; data not shown). 18B5's deduced amino acid sequence is almost identical to that of an α-tubulin from almonds (75) (Table 2).
Six C. quercuum f. sp. fusiforme clones were homologous to other sequences in NCBI's databases (Table 3). As a consequence, background signals were not subtracted and mRNA difference was calculated relative to background.The protein encoded by DD5 is highly homologous to fungal serine carboxypeptidases, including the PEPF protein of Aspergillus niger (16) (Table 3). The DD5-encoded amino acid sequence includes two putative active-site residues and two potential N-linked glycosylation sites (N-X-T/S) (79). C. quercuum f. sp. fusiforme clone DD63 appears to encode a heat shock protein in the hsp90 family (Table 3). The protein aligns with amino acids 156 to 210 of a heat shock protein from Schizosaccharomyces pombe that plays a role in cell cycle control (3) (data not shown). The amino acid sequence deduced from clone DD104 is similar to those of the 18-kDa cyclophilins from plants, mammals, and fungi (Table 3). The product of DD104 aligns with the C-terminal end of these cyclophilins, and DD104's nucleotide sequence continues for about 113 bp into the 3′ UTR (data not shown). One of the proteins most similar to the protein encoded by DD104 is a cyclophilin that was isolated from a haustorium-specific cDNA library from another rust fungus, Uromyces fabae (31) (Table 3). The DD115 protein has high sequence homology with NADPH cytochrome P450 reductases (Table 3). All of its alignments with BLAST E values of 6.0e-07 or less were with NADPH cytochrome P450 reductases. Above this level (BLAST E > 7.1e-07), it was homologous to closely related sulfite reductase flavoproteins (data not shown). The DD135-encoded protein is most similar to cytochrome c oxidase subunit I (Table 3). DD135 has a UGA codon at a position that typically encodes tryptophan in cytochrome c oxidase subunit I (data not shown).
Quantification of C. quercuum f. sp. fusiforme RNA in pine.
To measure the amount of C. quercuum f. sp. fusiforme RNA in fusiform rust galls, total RNA from galls and total RNA from isolated C. quercuum f. sp. fusiforme cultures were blotted as a twofold dilution series on duplicate membranes. One membrane was probed with Univ-Ribo, an oligonucleotide identical to a conserved region in both the pine and C. quercuum f. sp. fusiforme 18S rRNA sequences. This hybridization determined if equivalent amounts of gall RNA and C. quercuum f. sp. fusiforme RNA were loaded at each point in the dilution series (Fig. 3A and B). The other membrane was probed with Cro-Ribo I, a C. quercuum f. sp. fusiforme-specific oligonucleotide. This hybridization measured the amount of C. quercuum f. sp. fusiforme RNA in the galls (Fig. 3C). The specificity of the Cro-Ribo I oligonucleotide was verified in three independent trials at several concentrations of total RNA. When probed with Cro-Ribo I, no signal above background was detected in healthy RNA in any trial, but gall RNA and C. quercuum f. sp. fusiforme RNA both hybridized readily to this probe (Fig. 4). Blotting the samples as a dilution series made it possible to identify which quantities of gall RNA and C. quercuum f. sp. fusiforme RNA produced hybridization signals that increased evenly, in proportion to the amount of RNA loaded on the blot. The signals from samples containing large amounts of RNA were not detected by the phosphorimager in a concentration-dependent manner. For example, the 20-μg gall sample probed with Univ-Ribo produced much less signal per microgram of RNA than the other dilutions in its series (Fig. 3B). Signals like this one, which were outside the linear detection range of the phosphorimager, were not considered in the final analysis. All of our analyses included at least three values within the linear range of the phosphorimager (data not shown)
FIG. 3.

Quantification of the amount of C. quercuum f. sp. fusiforme total RNA in pine galls. (A and C) Identical membranes were prepared by blotting total RNA from galled tissues (G) and isolated C. quercuum f. sp. fusiforme cultures (C) in a twofold dilution series. The estimated amount of RNA at each dilution point is indicated on the left. (A) Blot probed with Univ-Ribo, which hybridizes to both pine and C. quercuum f. sp. fusiforme 18S rRNA. Diagonal lines connect dilutions with approximately equivalent signal intensities. (B) Results from panel A as quantified by the phosphorimager. (C) Blot probed with Cro-Ribo I, which hybridizes only to C. quercuum f. sp. fusiforme 18S rRNA. (D) Signals from four separate Cro-Ribo I hybridizations. Because the absolute values of the 32P signals varied widely between replicates, the data within each replicate were standardized relative to the highest value in each series, which were arbitrarily assigned a value of 80.
FIG. 4.
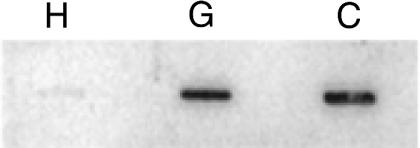
Specificity of the Cro-Ribo I oligonucleotide for C. quercuum f. sp. fusiforme rRNA. Approximately 5 μg of total RNA was applied to each slot and probed with the Cro-Ribo I oligonucleotide. H, healthy pine; G, galled pine; C, C. quercuum f. sp. fusiforme from PGY culture.
Probing with Univ-Ribo typically indicated that the amounts of total RNA at each dilution point were not identical. For example, in one trial the gall sample expected to contain 2.5 μg of RNA contained 1.5 times as much rRNA as the C. quercuum f. sp. fusiforme sample expected to contain 2.5 μg of RNA (Fig. 3A and B). The results from each Univ-Ribo probing, therefore, had to be accounted for when interpreting the data from the corresponding membrane probed with Cro-Ribo I. To calculate the percentage of C. quercuum f. sp. fusiforme RNA in galls, the Cro-Ribo I signal from a gall dilution point was divided by the Cro-Ribo I signal from the corresponding C. quercuum f. sp. fusiforme dilution, after the latter was multiplied by a correction factor to account for the difference in the amount of loaded RNA. In individual trials, the percentage of C. quercuum f. sp. fusiforme RNA in galls ranged from 8 to 18%, while the average value from all four trials was 14%. A summary of the Cro-Ribo I data is presented in Fig. 3D.
Quantification of steady-state transcript levels.
We used two approaches to quantify the relative expression levels of the genes identified in the differential-display screen. First, total RNA gel blots were probed with all 19 cDNA clones. These blots contained RNA from G, A, HU, and HL pine tissues (Fig. 1). The division of the healthy tissue into two samples ensured that the gall RNA samples could be compared to healthy-tissue RNA from a comparable position on the stem (i.e., HL). The RNA gel blots also included total RNA extracted from axenic C. quercuum f. sp. fusiforme cultures, so that the expression levels of the fungal clones during in planta and axenic growth could be compared. Thirteen of the cDNA clones produced detectable signals when hybridized to the RNA gel blots (Fig. 5), making it possible to estimate the full length of each transcript (Tables 2 and 3). Apparently the transcripts corresponding to the other six clones were not present in sufficient quantities to detect without further purification or amplification of the mRNA.
FIG. 5.

Northern analysis of four pine transcripts and nine C. quercuum f. sp. fusiforme transcripts. Equal amounts of total RNA from G, A, HL, and HU slash pine tissues and C. quercuum f. sp. fusiforme (C) growing in axenic culture were resolved on a 1% agarose-formaldehyde gel. The resulting blots were hybridized with fragments from each clone as indicated. Faint bands seen in A, HL, and HU in DD5 and DD136 blots are residual signals from previous hybridizations.
The steady-state mRNA levels of two of these rare transcripts (DD1 and DD55) were analyzed with relative RT-PCR. They were singled out for this analysis because they were pine clones whose expression (as detected by differential display) appeared to be reduced in galls, and thus they could be suppressors of gall development or infection maintenance. The balance of the rare transcripts were fungal clones expressed in galls (DD6, DD103, DD115, and DD133; Table 3). The expression patterns of these four fungal clones were not quantified.
In both the RNA gel blot and relative RT-PCR experiments, the mRNA expression patterns in at least one trial in slash pine and one trial in loblolly pine were analyzed. Differential expression levels of pine mRNAs in G and HL tissues were compared, and expression levels of C. quercuum f. sp. fusiforme mRNAs in G and C. quercuum f. sp. fusiforme tissues were compared. Because the results indicated that there was no difference between species in the expression patterns for any of the tested clones, the results from the slash and loblolly pine quantitation experiments were averaged together (Tables 2 and 3). The individual experiments that produced these data are described in detail below.
Steady-state transcript levels of pine clones.
The expression of DD110, the gene encoding a putative lipid transfer protein in pine, in four RNA gel blots was examined. In three trials, no significant difference between G and HL tissues was seen. In one trial, however, DD110 was present at a higher level in HL tissues than in G tissues (∼2.7-fold higher; Fig. 5). Thus, while the average over all four trials is approximately 1.4-fold higher in HL than in G tissues (Table 2), there was variability between samples collected on different days.
The transcripts of pine clones DD120, DD125, and DD128 were tested in three trials and produced relatively consistent results among all trials. The Northern blots probed with DD128 produced three bands despite stringent washing (Fig. 5). All three bands had the same relative transcript levels between the tissues, and the data derived from all three bands were pooled for the purposes of quantification. The size of the lowest band is reported in Table 2, and the highest band was estimated to be 600 bp larger.
The levels of the DD1 and DD55 transcripts in G and HL tissues were analyzed by relative RT-PCR. In three trials, DD1 levels appeared to be higher in HL than in G stems (Fig. 6A). In a fourth trial, however, no significant difference in DD1 transcript levels between the two tissues was detected. On average, DD1 levels were 2.2-fold higher in HL than in G samples (Table 2). In contrast, when pine clone DD55 was analyzed in three different trials, the level of its associated transcript was consistently higher in HL than in G tissues (Fig. 6B). The average difference for DD55 was 3.4-fold (Table 2). None of the cDNA samples used in the RT-PCR experiments were contaminated with genomic pine DNA (Fig. 6C), so all of the signals measured in the RT-PCR experiments were derived from cDNA templates.
FIG. 6.

Relative RT-PCR analysis of pine clones DD1 and DD55. A twofold dilution series of cDNA amplified from G or HL slash pine RNA was amplified with transcript-specific primers in the presence of 32P and run on a denaturing polyacrylamide gel. (A) Results from one experiment using DD1-specific primers. (B) Results from one experiment using DD55-specific primers. (C) To check for genomic DNA contamination in RT-PCR cDNA samples, primers hybridizing to either side of an intron in a pine actin gene were used. These primers amplify a 299-bp band from genomic DNA and a 165-bp band from cDNA. The upper gel contains the results from a gall cDNA sample, and the lower gel contains the results from a healthy cDNA sample. The amount of cDNA used in nanograms is listed above each lane. Arrowhead, genomic DNA control lanes.
Steady-state transcript level of C. quercuum f. sp. fusiforme clones.
The expression patterns for most of the C. quercuum f. sp. fusiforme clones were compared between G samples and isolated C. quercuum f. sp. fusiforme cultures because clones whose transcripts are present at higher levels in galls than in culture are likely to play a role in gall formation or biotrophic growth. The transcripts corresponding to DD5, DD62, DD63, DD104, DD106, and DD112 were consistently present at higher levels in G tissues than in C. quercuum f. sp. fusiforme, while those from DD135 and DD136 were not significantly different under these conditions (Fig. 5; Table 3). In the DD63 tests, two bands were always observed on the RNA gel blots (Fig. 5). The approximate size of the lower band is reported in Table 3. The DD112 transcript was present in G stems at a high level in all four trials, but its expression in C. quercuum f. sp. fusiforme ranged from low to undetectable. The relative difference reported in Table 3 was calculated from the two trials in which the transcript was detectable in C. quercuum f. sp. fusiforme.
The DD118 transcript appeared to be threefold higher in G samples than in C. quercuum f. sp. fusiforme, but some questions regarding the expression of this clone remain. In two trials, three bands were seen in C. quercuum f. sp. fusiforme and in G tissues (Fig. 5). They were not detectable in the A, HL, or HU lanes in these trials (Fig. 5). However, in two additional trials, bands appeared at similar positions in the A, HL, and HU samples. These bands could represent homologous genes in pine. If so, the hybridization observed in the G lane from the first two trials could be due to detection of a pine homolog, rather than the fungal transcript represented by clone DD118. Because the second set of trials were not interpretable, the results reported in Table 3 are from the trials in which no transcript signal was detected in the A, HL, or HU samples.
DISCUSSION
Differential display was successfully used to identify plant and fungal genes whose expression levels are influenced by fusiform rust infection. Our yield of 0.4 differentially expressed cDNAs per primer combination compares favorably to other studies that have used differential display to analyze plant-fungus interactions. In these cases, yields have ranged from 0.08 to 0.31 cDNAs per tested primer combination (9, 50, 55). Our protocol of replicating each display three or four times before candidate bands were isolated may have contributed to our relatively high confirmation rate.
This study identified a pool of pine genes that are expressed at lower levels in galls than in healthy pine stems, as well as several C. quercuum f. sp. fusiforme genes that are expressed at higher levels in galls than in axenic culture. Normal expression of the suppressed pine genes may be required for healthy stem formation. Alternatively, some of these genes could be suppressed by C. quercuum f. sp. fusiforme to allow for biotrophic growth in the gall. Similarly, C. quercuum f. sp. fusiforme genes expressed at higher levels in galls may stimulate developmental changes in pine leading to gall formation, or they may be required for nutrient acquisition or host defense suppression. The lack of gall-induced pine genes in this clone collection does not necessarily reflect how this host and pathogen interact with each other. Instead, it may reflect the fact that every C. quercuum f. sp. fusiforme gene expressed in galls is novel relative to healthy pine tissue. This abundance of fungal genes may have overwhelmed our ability to detect pine genes in the gall samples. Adding some cDNA from C. quercuum f. sp. fusiforme axenic cultures to the cDNA from galls before setting up the differential-display reactions probably would have reduced this problem. However, this was not done because isolated C. quercuum f. sp. fusiforme cultures were not established in our laboratory when the differential-display reactions were conducted.
Several of the clones identified in the differential-display screen encode proteins that are similar to proteins with known functions. The putative functions suggested by these sequence homologies provide clues about the roles these genes may play in the fusiform rust interaction. The DD1 transcript from pine encodes a protein with significant sequence homology to RLKs. RLKs have been implicated in a number of cellular functions in plants, including self-recognition, floral organ abscission, meristem cell proliferation, and disease resistance (13, 20, 21, 42, 71, 72). Of these functions, meristem proliferation and defense responses appear the most relevant to the fusiform rust disease interaction. The DD1 gene, therefore, might serve as a negative regulator of cell division in the vascular cambium or as a mediator of defense responses. Suppression of either of these functions would conceivably promote gall formation.
Pine clone DD125 appears to encode α-tubulin, which forms microtubules when complexed with β-tubulin (1). As a basic component of the cytoskeleton, microtubules participate in mitosis, cytokinesis, and cell differentiation in plants (15, 27). They may also be critical to the spatial organization of signal transduction (29). The expression of different members of the α-tubulin gene family is associated with specific tissue types or cells during cell differentiation (39, 60, 78). The reduced level of the DD125 transcript in galls, therefore, could reflect a shift in the types of cells being made within the galled tissues.
The pine clone DD110 appears to encode a nonspecific lipid transfer protein (LTP). All plant LTPs that have been tested, including LTPs from monocots, dicots, and a gymnosperm, have antibiotic activity in vitro (23, 65). Furthermore, transgenic expression of LTP2 in tobacco and Arabidopsis leads to enhanced tolerance to pathogens (59). LTPs are also thought to be involved in cutin formation, stress adaptation, and embryo development (65, 89).
DD110's transcript was suppressed in galls in only one out of four RNA gel blots. Each trial used RNA from a different harvest date, so the DD110 gene may be regulated by environmental conditions as well as by C. quercuum f. sp. fusiforme infection. Other studies of LTP expression during pathogen attack indicate that regulation of LTP gene families is complex. In some plant-pathogen interactions LTP levels are elevated; in others LTP transcript levels are suppressed (23, 59). A better understanding of the role of DD110 in pines, therefore, will require tests of its putative antimicrobial properties as well as further study of its expression under carefully controlled environmental conditions.
The putative functions encoded by three of the C. quercuum f. sp. fusiforme cDNA clones (DD63, DD104, and DD115) suggest that a significant proportion of this fungus's resources are dedicated to mitigating negative conditions in the host. These C. quercuum f. sp. fusiforme proteins are similar to proteins that impart stress tolerance in other organisms, and at least two of them are expressed at higher levels in galls than in isolated C. quercuum f. sp. fusiforme cultures (Table 3). DD63 encodes a protein that is similar to Hsp90 proteins, which are associated with the folding of signal-transducing proteins, such as protein kinases and steroid hormone receptors (11). DD104 encodes a protein that is similar to cyclophilins, which are ubiquitous proteins that catalyze cis-trans isomerization of proline peptide bonds and accelerate the folding of certain proteins (22, 66). Some cyclophilins in the 40-kDa cyclophilin family interact with Hsp90 proteins (19, 85). It is probable that cyclophilins, such as heat shock proteins, interfere with the uncontrolled protein folding that occurs under stress (25, 90). DD115 is similar to NADPH cytochrome P450 reductases, which transfer electrons from NADPH to cytochrome P450 monooxygenases. Multiple P450 monooxygenases occur in the endoplasmic reticulum; however, a single form of the reductase, which is anchored to the endoplasmic reticulum, reduces all of the P450 monooxygenases (10, 88). Some P450 monooxygenases are involved in the biosynthesis of secondary metabolites, such as hormones and toxins, but the majority are involved in detoxification (26). For example, pisatin demethylase, from Nectria haematococca, is a P450 monooxygenase that converts a pea phytoalexin to a less toxic compound (24).
When in planta-induced genes were isolated from U. fabae haustoria, three of the nine U. fabae genes with homology to genes in the database encoded proteins that were similar to proteins that impart stress tolerance (30, 31). They included a metallothionein (involved in metal or oxidative-stress tolerance), a cytochrome P450 monooxygenase, and a cyclophilin (31). Our results buttress Hahn and Mendgen's suggestion that rust fungi experience and respond to stresses within the host plant. More generally, this finding is consistent with the theory that successful biotrophs must continually negate adverse plant reactions during colonization of their hosts (35).
C. quercuum f. sp. fusiforme clone DD5 encodes a putative serine carboxypeptidase. Fungal serine carboxypeptidases are enzymes that remove amino acids from the C termini of long peptides (79). Carboxypeptidases and other proteases have been implicated in fungal pathogenesis of both plants and insects (56, 62, 74, 80). They are also thought to supply the fungal pathogens with food and to promote penetration into host tissues (62). Proteinases may be particularly important for growth in woody tissues, because the nitrogen content in wood is low (62). DD5 was the only tested C. quercuum f. sp. fusiforme clone whose expression was never detected in isolated culture. This could be due to the fact that serine carboxypeptidases typically are repressed by glucose (79), a component of the culture medium.
C. quercuum f. sp. fusiforme clone DD135 encodes a protein that is similar to cytochrome c oxidase, the final enzyme in the respiratory electron transport chain. Cytochrome c oxidase is usually encoded by the mitochondrial genome in fungi (61). DD135 was not differentially expressed in galls and in culture conditions, suggesting that it does not play a special metabolic role during biotrophic growth in pine. Analysis of the DD135 sequence indicated that the C. quercuum f. sp. fusiforme mitochondrial DNA may use TGA as a tryptophan codon. Ascomycete mitochondria frequently use the TGA codon for tryptophan rather than as a translational stop codon, and those ascomycetes that use the TGA codon for tryptophan usually prefer it over the TGG codon for this amino acid (47). In contrast, most basidiomycete mitochondrial genomes that have been studied strongly prefer the universal TGG codon for tryptophan (47). It has been hypothesized that TGA tryptophans were introduced independently into the basidiomycetes and ascomycetes during fungal evolution (61). However, basidiomycetes known to use primarily the TGA codon for tryptophan, such as Russula rosacea, are thought to be no more closely related to C. quercuum f. sp. fusiforme than the majority of basidiomycetes whose mitochondrial DNA do not deviate from the universal genetic code (2, 47). If further analysis indicates that the mitochondrial DNA of C. quercuum f. sp. fusiforme does indeed prefer the TGA codon, this finding may be interesting from a phylogenetic perspective.
The coexistence of two or more organisms within the same tissues complicates the quantification of individual transcript levels. This situation is routinely faced in the analysis of steady-state transcript levels in parasitic and symbiotic plant-fungal interactions. In these mixed tissues, the signal detected from a transcript originating from one partner will be diluted by the presence of RNA from the other resident of the tissue (17, 52, 53). The proportion of each member per gram of infected tissue also is likely to vary over the lifetime of the relationship (8). Therefore, if differences in transcript levels are to be accurately quantified, it is essential to determine the relative proportion of RNA from each organism in the tissues that are being compared.
By directly measuring the amount of C. quercuum f. sp. fusiforme rRNA in fusiform rust galls, we were able to estimate the amount of mRNA from each organism in the galls (Fig. 3). In this experiment, probing duplicate membranes with Univ-Ribo, a probe that hybridized to both pine and C. quercuum f. sp. fusiforme rRNA, allowed for the detection and subsequent correction of any variation in RNA loading. Comparing hybridization signals from a pair of dilution series was more reliable than comparing hybridization signals from single-concentration samples (43, 68). This is because large amounts of nucleic acid will be detected in a disproportionate manner if the amount of hybridization signal exceeds the linear range of the detection system (43). Similar assays have been used to estimate the amount of fungal RNA in mycorrhizal plant roots, but the potential for nonlinear detection of radiolabeled reagents does not appear to have been accounted for in these studies (17, 53).
The differentially expressed genes isolated in this study provide initial insight into the molecular environment inside a growing fusiform rust gall. The resulting clone collection is composed of candidate genes with potential roles in wood development, defense responses, or biotrophic interactions. Future experiments will test these hypotheses about gene function more directly.
Acknowledgments
We thank Paula Spaine for providing basidiospore culture 2-74-2-3, Carol Young for providing infected and healthy pine trees, and Richard Meagher for making helpful suggestions.
This work was supported by the State of Georgia's Traditional Industries Program for Pulp and Paper (TIP3) and by NIH training grants in genetics and molecular and cellular mycology.
REFERENCES
- 1.Albert, B., D. Bray, J. Lewis, M. Raff, K. Roberts, and J. D. Watson (ed.). 1994. Molecular biology of the cell, 3rd ed. Garland Publishing Inc., New York, N. Y.
- 2.Alexopoulos, C. J., C. W. Mims, and M. Blackwell (ed.). 1996. Introductory mycology, 4th ed. John Wiley & Sons, Inc., New York, N.Y.
- 3.Aligue, R., H. Akhavanniak, and P. Russell. 1994. A role of Hsp90 in cell cycle control: Wee1 tyrosine kinase activity requires interaction with Hsp90. EMBO J. 13:6099-6106. [DOI] [PMC free article] [PubMed] [Google Scholar]
- 4.Altschul, S. F., T. L. Madden, A. A. Schaffer, J. H. Zhang, Z. Zhang, W. Miller, and D. J. Lipman. 1997. Gapped BLAST and PSI-BLAST: a new generation of protein database search programs. Nucleic Acids Res. 25:3389-3402. [DOI] [PMC free article] [PubMed] [Google Scholar]
- 5.Amerson, H. V., and R. L. Mott. 1972. Technique for axenic production and application of Cronartium fusiforme basidiospores. Phytopathology 68:673-675. [Google Scholar]
- 6.Anderson, R. L., J. P. McClure, N. Cost, and R. J. Uhler. 1986. Estimating fusiform rust losses in five southeast states. South. J. Appl. Forest. 10:237-240. [Google Scholar]
- 7.Ausubel, F. M., R. Brent, R. E. Kingston, D. D. Moore, J. G. Seidman, J. A. Smith, and K. Struhl (ed.). 1998. Current protocols in molecular biology, vol. 1. John Wiley and Sons Inc., New York, N.Y.
- 8.Benito, E. P., A. ten Have, J. W. van't Klooster, and J. A. L. van Kan. 1998. Fungal and plant gene expression during synchronized infection of tomato leaves by Botryis cinerea. Eur. J. Plant Pathol. 104:207-220. [Google Scholar]
- 9.Benito, E. P., T. Prins, and J. A. L. van Kan. 1996. Application of differential display RT-PCR to the analysis of gene expression in a plant-fungus interaction. Plant Mol. Biol. 32:947-957. [DOI] [PubMed] [Google Scholar]
- 10.Black, S. D., and M. J. Coon. 1982. Structural features of liver microsomal NADPH-cytochrome P-450 reductase-hydrophobic domain, hydrophilic domain, and connecting region. J. Biol. Chem. 257:5929-5938. [PubMed] [Google Scholar]
- 11.Caplan, A. J. 1999. Hsp90's secrets unfold: new insights from structural and functional studies. Trends Cell Biol. 9:262-268. [DOI] [PubMed] [Google Scholar]
- 12.Chang, S., J. Puryear, and J. Cairney. 1993. A simple and efficient method for isolating RNA from pine trees. Plant Mol. Biol. Rep. 11:113-116. [Google Scholar]
- 13.Clark, S. E., M. P. Running, and E. M. Meyerowitz. 1993. Clavata 1, a regulator of meristem and flower development in Arabidopsis. Development 119:397-418. [DOI] [PubMed] [Google Scholar]
- 14.Cubbage, F. W., J. M. Pye, T. P. Holmes, and J. E. Wagner. 2000. An economic evaluation of fusiform rust protection research. South. J. Appl. Forest. 24:77-85. [Google Scholar]
- 15.Cyr, R. J. 1994. Microtubules in plant morphogenesis—role of the cortical array. Annu. Rev. Cell Biol. 10:153-180. [DOI] [PubMed] [Google Scholar]
- 16.Dal Degan, F., B. Ribadeau-Dumas, and K. Breddam. 1992. Purification and characterization of two serine carboxypeptidases from Aspergillus niger and their use in C-terminal sequencing of proteins and peptide synthesis. Appl. Environ. Microbiol. 58:2144-2152. [DOI] [PMC free article] [PubMed] [Google Scholar]
- 17.Diaz, E. C., D. Tagu, and F. Martin. 1997. Ribosomal DNA internal transcribed spacers to estimate the proportion of Pisolithus tinctorius and Eucalyptus globulus RNAs in ectomycorrhiza. Appl. Environ. Microbiol. 63:840-843. [DOI] [PMC free article] [PubMed] [Google Scholar]
- 18.Ditt, R. F., E. W. Nester, and L. Comai. 2001. Plant gene expression response to Agrobacterium tumefaciens. Proc. Natl. Acad. Sci. USA 98:10954-10959. [DOI] [PMC free article] [PubMed] [Google Scholar]
- 19.Duina, A. A., J. C. Hui-Chen, J. A. Marsc, S. Lindquist, and R. F. Gaber. 1996. A cyclophilin function in HSP90-dependent signal transduction. Science 274:1713-1715. [DOI] [PubMed] [Google Scholar]
- 20.Feuillet, C., G. Schachermayr, and B. Keller. 1997. Molecular cloning of a new receptor-like kinase gene encoded at the Lr10 disease resistance locus of wheat. Plant J. 11:45-52. [DOI] [PubMed] [Google Scholar]
- 21.Fletcher, J. C., and E. M. Meyerowitz. 2000. Cell signaling within the shoot meristem. Curr. Opin. Plant Biol. 3:23-30. [DOI] [PubMed] [Google Scholar]
- 22.Freskgard, P. O., N. Bergenhem, B. H. Jonsson, M. Svensson, and U. Carlsson. 1992. Isomerase and chaperone activity of prolyl isomerase in the folding of carbonic anhydrase. Science 258:466-468. [DOI] [PubMed] [Google Scholar]
- 23.Garcia-Olmedo, F., A. Molina, A. Segura, and M. Moreno. 1995. The defensive role of nonspecific lipid-transfer proteins in plants. Trends Microbiol. 3:72-74. [DOI] [PubMed] [Google Scholar]
- 24.George, H. L., K. D. Hirschi, and H. D. VanEtten. 1998. Biochemical properties of the products of cytochrome P450 genes (PDA) encoding pisatin demethylase activity in Nectria haematococca. Arch. Microbiol. 170:147-154. [DOI] [PubMed] [Google Scholar]
- 25.Godoy, A. V., A. S. Lazzaro, C. A. Casalongue, and B. San Segundo. 2000. Expression of a Solanum tuberosum cyclophilin gene is regulated by fungal infection and abiotic stress conditions. Plant Sci. 152:123-134. [Google Scholar]
- 26.Gonzalez, F. J., and D. W. Nebert. 1990. Evolution of the P450 gene superfamily—animal plant warfare, molecular drive and human genetic-differences in drug oxidation. Trends Genet. 6:182-186. [DOI] [PubMed] [Google Scholar]
- 27.Goodard, R. H., S. M. Wick, C. D. Silflow, and D. P. Snustad. 1994. Microtubule components of the plant cell cytoskeleton. Plant Physiol. 104:1-6. [DOI] [PMC free article] [PubMed] [Google Scholar]
- 28.Gray, D. J., H. V. Amerson, and C. G. Van Dyke. 1982. An ultrastructural comparison of monokaryotic and dikaryotic haustoria formed by the fusiform rust fungus Cronartium quercuum f. sp. fusiforme. Can. J. Bot. 60:2914-2922. [Google Scholar]
- 29.Gundersen, G. G., and T. A. Cook. 1999. Microtubules and signal transduction. Curr. Opin. Cell Biol. 11:81-94. [DOI] [PubMed] [Google Scholar]
- 30.Hahn, M., and K. Mendgen. 1992. Isolation by ConA binding of haustoria from different rust fungi and comparison of their surface qualities. Protoplasma 170:95-103. [Google Scholar]
- 31.Hahn, M., and K. Mendgen. 1997. Characterization of in planta-induced rust genes isolated from a haustorium-specific cDNA library. Mol Plant Microbe Interact. 10:427-437. [DOI] [PubMed] [Google Scholar]
- 32.Hahn, M., and K. Mendgen. 2001. Signal and nutrient exchange at biotrophic plant-fungus interfaces. Curr. Opin. Plant Biol. 4:322-327. [DOI] [PubMed] [Google Scholar]
- 33.Hanks, S. K., A. M. Quinn, and T. Hunter. 1988. The protein kinase family: conserved features and deduced phylogeny of the catalytic domains. Science 241:40-52. [DOI] [PubMed] [Google Scholar]
- 34.Hare, R. C. 1978. Axenic culture of Cronartium fusiforme from three spore forms. Can. J. Bot. 56:2641-2647. [Google Scholar]
- 35.Heath, M. C. 1997. Signaling between pathogenic rust fungi and resistant or susceptible host plants. Ann. Bot. 80:713-720. [Google Scholar]
- 36.Hollis, C. A., R. A. Schmidt, and J. W. Kimbrough. 1972. Axenic culture of Cronartium fusiforme. Phytopathology 62:1417-1419. [Google Scholar]
- 37.Hu, A., and H. V. Amerson. 1991. Single genotype axenic cultures of Cronartium quercuum f. sp. fusiforme. Phytopathology 81:1294-1297. [Google Scholar]
- 38.Hu, A., H. V. Amerson, and L. J. J. R. Frampton. 1994. Isolation and growth of single genotype axenic cultures of Cronartium quercuum f. sp. fusiforme using hyphal fragments from multi-genotype stock colonies. New Forests 8:299-308. [Google Scholar]
- 39.Hussey, P. J., D. P. Snustad, and C. D. Silflow. 1991. Tubulin gene expression in higher plants, p. 15-27. In C. W. Lloyd (ed.), The cytoskeletal basis of plant growth and form. Academic Press, London, United Kingdom.
- 40.Jackson, L. W. R., and J. N. Parker. 1958. Anatomy of fusiform rust galls on loblolly pine. Phytopathology 48:637-640. [Google Scholar]
- 41.Jewell, F. F., R. P. True, and S. L. Mallett. 1962. Histology of Cronartium in slash pine seedlings. Phytopathology 52:850-858. [Google Scholar]
- 42.Jinn, T.-L., J. M. Stone, and J. C. Walker. 2000. HAESA, an Arabidopsis leucine-rich repeat receptor kinase, controls floral organ abscission. Genes Dev. 14:108-117. [PMC free article] [PubMed] [Google Scholar]
- 43.Johnston, R. F., S. C. Pickett, and D. L. Barker. 1990. Autoradiography using storage phosphor technology. Electrophoresis 11:355-360. [DOI] [PubMed] [Google Scholar]
- 44.Jones, L. J., S. T. Yue, C. Y. Cheung, and V. L. Singer. 1998. RNA quantitation by fluorescence-based solution assay: RiboGreen reagent characterization. Anal. Biochem. 265:368-374. [DOI] [PubMed] [Google Scholar]
- 45.Kapulnik, Y., H. Volpin, H. Itzhaki, D. Ganon, S. Galili, R. David, O. Shaul, Y. Elad, I. Chet, and Y. Okon. 1996. Suppression of defence responses in mycorrhizal alfalfa and tobacco roots. New Phytol. 133:59-64. [Google Scholar]
- 46.Komjanc, M., S. Festi, L. Rizzotti, L. Cattivelli, F. Cervone, and G. De Lorenzo. 1999. A leucine-rich repeat receptor-like protein kinase (LRPKm1) gene induced in Malus × domestica by Venturia inaequalis infection and salicylic acid treatment. Plant Mol. Biol. 40:945-957. [DOI] [PubMed] [Google Scholar]
- 47.Kretzer, A. M., and T. D. Bruns. 1999. Use of atp6 in fungal phylogenetics: an example from the Boletales. Mol. Phylogenet. Evol. 13:483-492. [DOI] [PubMed] [Google Scholar]
- 48.Lambais, M. R., and M. C. Mehdy. 1993. Suppression of endochitinase, beta-1,3-endoglucanase, and chalcone isomerase expression in bean vesicular-arbuscular mycorrhizal roots under different soil phosphate conditions. Mol. Plant-Microbe Interact. 6:75-83. [Google Scholar]
- 49.Lange, J., Z.-P. Xie, W. J. Broughton, R. Vogeli-Lange, and T. Boller. 1999. A gene encoding a receptor-like protein kinase in the roots of common bean is differentially regulated in response to pathogens, symbionts and nodulation factors. Plant Sci. 142:133-145. [Google Scholar]
- 50.Lapopin, L., V. Gianinazzi-Pearson, and P. Franken. 1999. Comparative differential RNA display analysis of arbuscular mycorrhiza in Pisum sativum wild type and a mutant defective in late stage development. Plant Mol. Biol. 41:669-677. [DOI] [PubMed] [Google Scholar]
- 51.Liang, P., L. Averboukh, and A. B. Pardee. 1993. Distribution and cloning of eukaryotic mRNAs by means of differential display: refinements and optimization. Nucleic Acids Res. 21:3269-3275. [DOI] [PMC free article] [PubMed] [Google Scholar]
- 52.Mahe, A., J. Grisvard, and M. Dron. 1992. Fungal- and plant-specific gene markers to follow the bean anthracnose infection process and normalize a bean chitinase mRNA induction. Mol. Plant-Microbe Interact. 5:242-248. [Google Scholar]
- 53.Maldonado-Mendoza, I. E., G. R. Dewbre, M. L. van Buuren, W. K. Versaw, and M. J. Harrison. 2002. Methods to estimate the proportion of plant and fungal RNA in an arbuscular mycorrhiza. Mycorrhiza 12:67-74. [DOI] [PubMed] [Google Scholar]
- 54.Maniatis, T., E. F. Fritsch, and J. Sambrook. 1982. Molecular cloning: a laboratory manual. Cold Spring Harbor Laboratory, Cold Spring Harbor, N.Y.
- 55.Martin-Laurent, F., D. van Tuinen, E. Dumas-Gaudot, V. Gianinazzi-Pearson, S. Gianinazzi, and P. Franken. 1997. Differential display analysis of RNA accumulation in arbuscular mycorrhiza of pea and isolation of a novel symbiosis-regulated plant gene. Mol. Gen. Genet. 256:37-44. [DOI] [PubMed] [Google Scholar]
- 56.McHenry, J. Z., J. T. Christeller, E. A. Slade, and W. A. Laing. 1996. The major extracellular proteinases of the silverleaf fungus, Chondrostereum purpureum, are metalloproteinases. Plant Pathol. 45:552-563. [Google Scholar]
- 57.Mellersh, D. G., and M. C. Heath. 2001. Plasma membrane-cell wall adhesion is required for expression of plant defense responses during fungal penetration. Plant Cell 13:413-424. [DOI] [PMC free article] [PubMed] [Google Scholar]
- 58.Molina, A., and F. Garcia-Olmedo. 1993. Developmental and pathogen-induced expression of three barley genes encoding lipid transfer proteins. Plant J. 4:983-991. [DOI] [PubMed] [Google Scholar]
- 59.Molina, A., and F. Garica-Olmedo. 1997. Enhanced tolerance to bacterial pathogens caused by the transgenic expression of barley lipid transfer protein LTP2. Plant J. 12:669-675. [DOI] [PubMed] [Google Scholar]
- 60.Montoliu, L., J. Rigau, and P. Puigdomenech. 1989. A tandem of alpha-tubulin genes preferentially expressed in radicular tissues from Zea mays. Plant Mol. Biol. 14:1-15. [DOI] [PubMed] [Google Scholar]
- 61.Paquin, B., M.-J. Laforest, L. Forget, I. Roewer, Z. Wang, J. Longcore, and B. F. Lang. 1997. The fungal mitochondrial genome project: evolution of fungal mitochondrial genomes and their gene expression. Curr. Genet. 31:380-395. [DOI] [PubMed] [Google Scholar]
- 62.Pavlukova, E. B., M. A. Belozersky, and Y. E. Dunaevsky. 1998. Extracellular proteolytic enzymes of filamentous fungi. Biochemistry (Moscow) 63:899-928. [PubMed] [Google Scholar]
- 63.Perfect, S. E., R. J. O'Connell, E. F. Green, C. Doering-Saad, and J. R. Green. 1998. Expression of a fungal proline-rich glycoprotein specific to the biotrophic interface formed in the Colletotrichum-bean interaction. Plant J. 15:273-279. [DOI] [PubMed] [Google Scholar]
- 64.Rowan, S. J. 1970. Fusiform rust gall formation and cytokinin of loblolly pine. Phytopathology 60:1225-1226. [Google Scholar]
- 65.Sabala, I., M. Elfstrand, D. Clapham, and S. von Arnold. 2000. Tissue-specific expression of Pa18, a putative lipid transfer protein gene, during embryo development in Norway spruce (Picea abies). Plant Mol. Biol. 42:461-478. [DOI] [PubMed] [Google Scholar]
- 66.Schmid, F. X., L. M. Mayr, M. Mucke, and E. R. Schonbrunner. 1993. Prolyl isomerases: role in protein folding. Adv. Protein Chem. 44:25-66. [DOI] [PubMed] [Google Scholar]
- 67.Seifers, D., V. Ammon, and J. Spencer. 1985. Alteration in auxin levels in selected southern pines inoculated with the fusiform rust fungus. Agric. Ecosys. Environ. 14:131-138. [Google Scholar]
- 68.Shirley, B. W., and R. B. Meagher. 1990. A potential role for RNA turnover in the light regulation of plant gene expression: ribulose-1,5-bisphosphate carboxylase small subunit in soybean. Nucleic Acids Res. 18:3377-3385. [DOI] [PMC free article] [PubMed] [Google Scholar]
- 69.Sikorski, M. M., J. Biesiadka, A. E. Kasperska, J. Kopcinska, B. Lotocka, W. Golinowski, and A. B. Legocki. 1999. Expression of genes encoding PR10 class pathogenesis-related proteins is inhibited in yellow lupine root nodules. Plant Sci. 149:125-137. [Google Scholar]
- 70.Singer, V. L., L. J. Jones, S. T. Yue, and R. P. Haugland. 1997. Characterization of PicoGreen reagent and development of a fluorescence-based solution assay for double-stranded DNA quantitation. Anal. Biochem. 249:228-238. [DOI] [PubMed] [Google Scholar]
- 71.Song, W.-Y., L.-Y. Pi, G.-L. Wang, J. Gardner, T. Hoisten, and P. C. Ronald. 1997. Evolution of the rice Xa21 disease resistance gene family. Plant Cell 9:1279-1287. [DOI] [PMC free article] [PubMed] [Google Scholar]
- 72.Stein, J. C., B. Howlett, D. C. Boyes, M. E. Nasrallah, and J. B. Nasrallah. 1991. Molecular cloning of a putative receptor protein kinase gene encoded at the self-incompatibility locus of Brassica oleracea. Proc. Natl. Acad. Sci. USA 88:8816-8820. [DOI] [PMC free article] [PubMed] [Google Scholar]
- 73.Stephenson, S. A., J. Hatfield, A. G. Rusu, D. J. Maclean, and J. M. Manners. 2000. CgDN3: an essential pathogenicity gene of Colletotrichum gloeosporioides necessary to avert a hypersensitive-like response in the host Stylosanthes guianensis. Mol. Plant-Microbe Interact. 13:929-941. [DOI] [PubMed] [Google Scholar]
- 74.St. Leger, R. J. 1995. The role of cuticle-degrading proteases in fungal pathogenesis of insects. Can. J. Bot. 73:S1119-S1125. [Google Scholar]
- 75.Stocker, M., J. Garcia-Mas, P. Arus, R. Messeguer, and P. Puigdomenech. 1993. A highly conserved alpha-tubulin sequence from Prunus amyedalus. Plant Mol. Biol. 22:913-916. [DOI] [PubMed] [Google Scholar]
- 76.Tainter, F. H., and R. L. Anderson. 1993. Twenty-six new pine hosts of fusiform rusts. Plant Dis. 77:17-20. [Google Scholar]
- 77.Thompson, D. M., and R. B. Meagher. 1990. Transcriptional and post-transcriptional processes regulate expression of RNA encoding the small subunit of ribulose-1,5-biphosphate carboxylase differently in petunia and in soybean. Nucleic Acids Res. 18:3621-3629. [DOI] [PMC free article] [PubMed] [Google Scholar]
- 78.Uribe, X., M. A. Torres, M. Capellades, P. Puigdomenech, and J. Rigau. 1998. Maize alpha-tubulin genes are expressed according to specific patterns of cell differentiation. Plant Mol. Biol. 37:1069-1078. [DOI] [PubMed] [Google Scholar]
- 79.van den Hombergh, J. P. T. W., G. Jarai, F. P. Buxton, and J. Visser. 1994. Cloning, characterization and expression of pepF, a gene coding a serine carboxypeptidase from Aspergillus niger. Gene 151:73-79. [DOI] [PubMed] [Google Scholar]
- 80.Viterbo, A., B. Yagen, and A. M. Mayer. 1993. Cucurbitacins, attack enzymes and laccase in Botrytis cinerea. Phytochemistry 32:61-65. [DOI] [PubMed] [Google Scholar]
- 81.Voegele, R. T., C. Struck, M. Hahn, and K. Mendgen. 2001. The role of haustoria in sugar supply during infection of broad bean by the rust fungus Uromycesfabae. Proc. Natl. Acad. Sci. USA 98:8133-8138. [DOI] [PMC free article] [PubMed] [Google Scholar]
- 82.Vogeli-Lange, R., N. Burckert, T. Boller, and A. Wiemken. 1996. Rapid selection and classification of positive clones generated by mRNA differential display. Nucleic Acids Res. 24:1385-1386. [DOI] [PMC free article] [PubMed] [Google Scholar]
- 83.Wagner, D. B., G. T. Furnier, M. A. Saghai-Maroof, S. M. Williams, B. P. Dancik, and R. W. Allard. 1987. Chloroplast DNA polymorphisms in lodgepole and jack pines and their hybrids. Proc. Natl. Acad. Sci. USA 84:2097-2100. [DOI] [PMC free article] [PubMed] [Google Scholar]
- 84.Walker, J. C. 1993. Receptor-like protein kinase genes of Arabidopsis thaliana. Plant J. 3:451-456. [DOI] [PubMed] [Google Scholar]
- 85.Warth, R., P.-A. Briand, and D. Picard. 1997. Functional analysis of the yeast 40 kDa cyclophilin Cyp40 and its role for viability and steroid receptor regulation. Biol. Chem. 278:381-391. [DOI] [PubMed] [Google Scholar]
- 86.Waspi, U., P. Schweizer, and R. Dudler. 2001. Syringolin reprograms wheat to undergo hypersensitive cell death in a compatible interaction with powdery mildew. Plant Cell 13:153-161. [PMC free article] [PubMed] [Google Scholar]
- 87.Wendland, J., K. B. Lengeler, and E. Kothe. 1996. An instant preparation method for nucleic acids of filamentous fungi. Fungal Genet. News 43:54-55. [Google Scholar]
- 88.Yabusaki, Y., H. Murakami, and H. Ohkawa. 1988. Primary structure of Saccharomyces cerevisiae NADPH-cytochrome P450 reductase deduced from nucleotide sequence of its cloned gene. J. Biochem. 103:1004-1010. [DOI] [PubMed] [Google Scholar]
- 89.Zhang, M. Y., and C. Y. Liang. 2000. Progress in the studies of lipid-transfer protein. Prog. Biochem. Biophys. 27:244-247. [Google Scholar]
- 90.Zugel, U., and S. H. E. Kaufmann. 1999. Role of heat shock proteins in protection from and pathogenesis of infectious diseases. Clin. Microbiol. Rev. 12:19-39. [DOI] [PMC free article] [PubMed] [Google Scholar]