

Abstract
Increased levels of intestinal VEGF are thought to worsen portal hypertension. The cause of the increase in the level of intestinal VEGF found during cirrhosis is not known. The aim of this study is to demonstrate a relationship between portal pressure (PP) and intestinal/ plasma VEGF levels in different stages of fibrosis/cirrhosis. In this experiment, rats were exposed to carbon tetrachloride (CCl4) for 6, 8 and 12 weeks. At the end of exposure, the three groups of rats exhibited three different stages of pathology: non-cirrhotic, early fibrotic and cirrhotic, respectively. For those rats and their age-matched controls, PP and intestinal/plasma VEGF levels were measured. Rats inhaling CCl4 for 12 weeks developed portal hypertension (18.02 ± 1.07 mmHg), while those exposed for 6 weeks (7.26 ± 0.58 mmHg) and for 8 weeks (8.55 ± 0.53 mmHg) did not. The rats exposed for 12 weeks also showed a 40% increase in the level of intestinal VEGF compared to the controls (P < 0.05), while those rats exposed to CCl4 inhalation for 6 and 8 weeks did not. There was a significant positive correlation between PP and intestinal VEGF levels (r2 = 0.4, P < 0.005). Plasma VEGF levels were significantly elevated in those rats exposed to 12 weeks of CCl4 inhalation (63.7 pg/ml, P < 0.01), compared to the controls (8.5 pg/ml). However, no correlation was observed between PP and plasma VEGF levels. It is concluded that portal pressure modulates intestinal VEGF levels during the development of cirrhosis.
Keywords: portal hypertension, eNOS, intestinal microcirculation
Introduction
The development of portal hypertension results in the serious complications observed in patients with chronic liver disease [1]. In recent years, VEGF has been recognized as one of the key molecules involved in the pathophysiology of portal hypertension [2-9]. Experimental studies have shown that intestinal VEGF levels are elevated in cirrhosis [4–6,10]. Increased intestinal VEGF levels can exacerbate portal hypertension at least in two ways: (1) by increasing eNOS-derived nitric oxide production and subsequent vasodilation, thereby increasing the flow of blood to the portal vein and (2) by increasing angiogenesis in the splanchnic circulation, which may also contribute to increased blood flow to the portal vein. Both processes are important for the development of the hyperdynamic circulatory syndrome associated with portal hypertension in cirrhosis [11]. However, it is not known what triggers the up-regulation of intestinal VEGF levels during the development of cirrhosis. We have hypothesized that an increase in portal pressure (PP) during the development of fibrosis/cirrhosis induces an increased level of intestinal VEGF production.
Using an experimental model to induce portal hypertension (i.e. partial portal vein ligation), our group [2] as well as other investigators [4,9] have demonstrated that portal hypertensive rats (without any cirrhotic pathology) show enhanced intestinal VEGF production and levels of eNOS when compared to control rats. Furthermore, VEGF receptor 2 (VEGFR2) inhibitor decreases the level of eNOS in portal hypertensive rats, suggesting that an increase in PP induces the up-regulation of intestinal VEGF and the subsequent increase of the level of eNOS [2]. In addition, a study by Sieghart et al. [12] showed a significant correlation (r = 0.5, P = 0.046) between the hepatic venous pressure gradient (HVPG) and serum VEGF levels in patients with cirrhosis. Therefore, the major aim of this study was to determine whether an increase in PP is associated with increases in intestinal VEGF levels as well as circulating VEGF levels during the development of cirrhosis in which complex factors such as inflammatory cytokines may be involved. To investigate the relationship between PP and intestinal/plasma VEGF levels in cirrhosis, we used a rat model to closely copy different stages of cirrhosis by inhalation of carbon tetrachloride (CCl4) for varying lengths of time.
Materials and methods
Induction of hepatic fibrosis and cirrhosis
Two batches of male Sprague-Dawley rats (Harlan Sprague-Dawley Laboratories, Indianapolis, IN, USA), weighing 100–125 g, were exposed to CCl4 by inhalation. The first batch of 17 rats was divided into three groups based on the duration of CCl4 inhalation: 6 weeks (n = 5, non-cirrhosis), 8 weeks (n = 6, early fibrosis) and 12 weeks (n = 6, cirrhosis). Data from these rats and their age-matched controls were used to determine a correlation between PP and intestinal VEGF levels. The second batch of 13 rats was exposed to CCl4 for 12 weeks. Data from these rats and their age-matched controls (n = 5) were used to measure PP and plasma VEGF.
Phenobarbital (0.35 g/l) was added to the drinking water 3 days prior to exposure to CCl4 to help develop cirrhosis more quickly. Rats were placed in a gas chamber (60 χ 40 χ 20 cm) under a fume hood and exposed to CCl4 gas three times per week. The duration of CCl4 inhalation was 1–2 min. for the first 3 weeks and increased to 3–5 min. afterwards. This protocol produces high-density micro-nodular cirrhosis following 12–16 weeks of CCl4 inhalation [10,13]. CCl4 exposure was stopped 5–7 days before the experiment. Phenobarbital was no longer added to the drinking water at the same time exposure to CCl4 was stopped. Age-matched untreated rats were used as controls.
All procedures were performed in accordance with the ‘Principles of Laboratory Animal Care’ and were approved by the Animal Care and Use Committee at the Veterans Affairs Healthcare System of Connecticut.
Histological analyses
Liver samples were collected from all the rats from the first batch exposed to CCl4 and their respective controls and paraffin sectioned. The 5 μm sections were then stained with haematoxylin and eosin for structural evaluation and with Sirius red for the evaluation of fibrosis. Percent fibrosis was determined by measuring the area positive for Sirius red (i.e. the collagen-positive area) divided by the total area analysed. BIOQUANT Image Analysis software (BIOQUANT Image Analysis Corporation, Nashville, TN, USA) was used for quantitative image analysis of the liver sections. At least 20 images per liver section were taken at random for the analysis.
Portal pressure measurement
Portal pressure measurement was performed through catheterization of the ileocolic vein under anaesthesia using ketamine (100 mg/kg IM) and diazepam (10 mg/kg IM). Portal pressure was measured using a pressure transducer (Hewlett-Packard, Andover, MA, USA), and the data were digitalized for recording on a computer using a PowerLab/MacLab system with Chart 3.6 software (AD Instruments, Colorado Springs, CO, USA) [10,14].
Western blot analysis
A 5-cm portion of the jejunum was harvested from a 15–20 cm length of intestine extending from the cranial part of the duodenum to the cecal part of the large intestine, immediately snap frozen in liquid nitrogen, and kept at −70°C until analysed. Jejunal samples were homogenized in a lysis buffer containing 50 mM Tris–HCl (pH 7.4), 0.1 mM EGTA, 0.1 mM EDTA, 5 mM sodium fluoride, 1 mM sodium pyrophosphate, 1 mM activated sodium vanadate, 1 mM 4-(2-aminoethyl)-benzenesulfonyl fluoride, a protease inhibitor cocktail tablet (Roche Diagnostics, Mannheim, Germany), 1% (v/v) Nonidet P-40, 0.1% SDS and 0.1% deoxycholate. Prior to homogenization, the jejunal samples were lyophilized to promote efficient lysis. The lysates were centrifuged at 14,000 r.p.m. at 4oC for 10 min. The protein concentration of the supernatants was quantified using the Lowry assay. An equal amount of protein (100 μg) from each sample was loaded onto SDS-PAGE gels and transferred to nitrocellulose membranes. Equal loading was ensured by Ponceau S staining as well as through detection of Hsp90 or β-actin housekeeping genes. Membranes were probed with four antibodies recognizing eNOS (1:1000; Transduction Laboratories, Lexington, KY, USA), VEGF (1:500, Santa Cruz Biotechnology, Santa Cruz, CA, USA), Hsp90 (Transduction Laboratories) and β-actin (Sigma-Aldrich, St. Louis, MO, USA). After washing, membranes were incubated with fluorophore-conjugated (either 680 or 800 nm emission) secondary antibodies. Detection and quantification of the bands were performed using the Odyssey Infrared Imaging System (Li-Cor Biotechnology, Lincoln, NE, USA). Hsp90 and β-actin were used for normalization.
Plasma VEGF levels
Thirteen cirrhotic rats, including eight non-ascitic and five ascitic rats from the second batch exposed to CCl4 for a 12-week period, were used along with five age-matched controls. Plasma VEGF levels were measured using a cytokine antibody array kit (Ray-Biotech Inc., Norcross, GA, USA) according to the manufacturer’s instructions. Then, the correlation between PP and plasma VEGF levels was determined.
Immunofluorescence
A small portion of each jejunal sample was stored overnight in 4% paraformaldehyde (PFA) at 4°C, followed by incubation in 30% sucrose/PBS at 4°C, overnight. Next, the sample was oriented in a cryomold containing OCT (Ted Pella, Redding, CA, USA) and frozen on dry ice for sectioning. Sections of 5 μm were cut and mounted on slides. After the OCT compound was dissolved by submersion in PBS, the samples were permeabilized with 0.3% Triton-X 100 in PBS for 15 min. and were blocked for 30 min. with 5% donkey serum/1% BSA in PBS at room temperature. Following the blocking step, primary antibodies were applied, including rabbit anti-VEGF (1:200; Santa Cruz Biotechnology), mouse anti-PECAM (1:100, BD Bioscience Pharmingen, San Jose, CA, USA), rat anti-F4/80 (1:40; eBioscience, Inc., San Diego, CA, USA) and rabbit anti-interleukin-6 (IL-6; 1:100; Abcam, Inc., Cambridge, MA, USA) and incubated overnight at 4°C. The sections were then incubated with secondary antibodies conjugated to Alexa 488 or 568 (1:250) dyes for 1 hr at room temperature. Sections incubated with IgG in place of the primary antibodies or incubated with secondary antibodies alone served as negative controls. 4′,6-diamidino-2-phenylindole (DAPI) was used as a nuclear stain. Images were detected with a Zeiss Axiovert 200 fluorescence microscope (Carl Zeiss MicroImaging, Thornwood, NY, USA) and recorded using Openlab3 software (Improvision, Lexington, MA, USA).
Antibody cytokine array
Intestinal angiogenic cytokine levels were determined in jejunal lysates. The lysates, prepared from three controls and three rats exposed for different lengths of time (6, 8 and 12 weeks) to CCl4 inhalation, were analysed using the Mouse Angiogenesis Antibody Array kit (Panomics, Inc., Fremont, CA, USA). Equal amounts of protein (500 μg) were loaded for analysis. Cytokine values were normalized against a positive control placed on each membrane. Alexa 680 conjugated to streptavidin was used for detection of cytokines. The Odyssey Infrared Imaging System (Li-Cor Biotechnology, Lincoln, NE, USA) was used for detection and quantification of the bands.
Statistical analysis
Results were expressed as a mean ± S.E. Statistical analysis was performed with SPSS 14.0 statistical software (SPSS, Chicago, IL, USA). Results were assessed using one-way ANOVA followed by pre-planned contrast analysis for comparison of each group of CCl4 rats to their corresponding controls. Linear trends were determined using polynomial contrasts. An unpaired t-test or Mann–Whitney test was used for comparing the two groups of rats. A two-tailed P value of <0.05 was considered statistically significant.
Results
Evaluation of rats exposed to CCl4 inhalation for different lengths of time
A summary of the body and spleen weights at the time of haemodynamic measurement and sample collection for the first batch of CCl4-treated rats and their controls is presented in Table 1A. No difference was observed in body weight between these two groups of rats at any stage of treatment. No difference in spleen weight was found in rats exposed for 6 weeks (0.88 ± 0.04 g) and 8 weeks (0.9 ± 0.06 g) to CCl4 inhalation, compared to their age-matched controls (0.84 ± 0.03 g and 0.98 ± 0.08 g, respectively). In contrast, there was a significant increase in spleen weight in the rats that were exposed for 12 weeks (2.24 ± 0.21 g) to CCl4 inhalation compared to their controls (1.27 ± 0.06 g).
Table 1.
Body weight and spleen weight of rats
| CCl4 inhalation (stages) | Body weight (g) | Spleen weight (g) | ||||||
|---|---|---|---|---|---|---|---|---|
| Control | CCl 4 -treated | Control | CCl 4 -treated | |||||
| A. The first batch of CCl4-treated rats and their controls used for the correlation between portal pressure and intestinal VEGF levels | ||||||||
| 6 weeks (non-cirrhotic) | 320 ± 16.8 (n = 5) | 309 ± 9.3 (n = 5) | 0.84 ± 0.03 (n = 5) | 0.88 ± 0.04 (n = 5) | ||||
| 8 weeks (early fibrotic) | 394.5 ± 11.4 (n = 6) | 332 ± 13.1 (n = 6) | 0.98 ± 0.08 (n = 6) | 0.9 ± 0.06 (n = 6) | ||||
| 12 weeks (cirrhotic) | 431.5 ± 4.9 (n = 6) | 383.3 ± 13.2 (n = 6) | 1.27 ± 0.06 (n = 6) | 2.24 ± 0.21* (n = 6) | ||||
| B. The second batch of CCl4 treated rats and their controls used for the correlation between portal pressure and plasma VEGF levels | ||||||||
| Control n = 5 | 450 ± 20.9 | 0.9 ± 0.04 | 4.03 ± 0.92 | |||||
| 12 weeks (non-ascitic) n = 8 | 405 ± 15.1 | 1.5 ± 0.2* | 13.5 ± 1.08* | |||||
| 12 weeks (ascitic) n = 5 | 411.8 ± 22.9 | 2.0 ± 0.2* | 11.5 ± 0.23* | |||||
P < 0.01, compared to control group.
Fibrosis became obvious at exposure for 8 weeks (3% fibrosis) to CCl4 and continued to increase with exposure for 12 weeks (9% fibrosis; micronodular cirrhosis) as evaluated by haematoxylin and eosin and Sirius red staining (Fig. 1A). Rats exposed for 12 weeks additionally developed marked portal hypertension (18.02 ± 1.07 mmHg) while those rats exposed for 6 weeks (7.26 ± 0.58 mmHg) and 8 weeks (8.55 ± 0.53 mmHg) did not (Fig. 1B). Spleen weight showed a significant positive correlation with PP in rats exposed to CCl4 (n = 17, r2 = 0.85, P = 0.000001; Fig. 1C).
Fig 1.
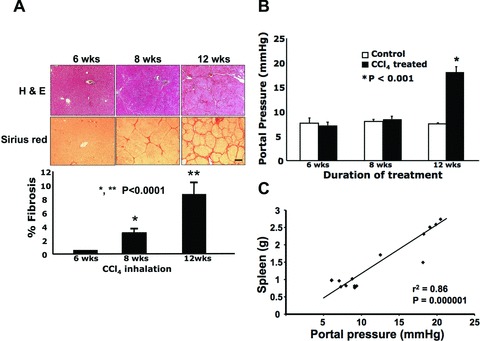
Portal hypertension developed in cirrhotic rats having received 12 weeks of CCl4 by inhalation, while fibrosis became significant after 8 weeks of CCl4 inhalation. To generate different stages of cirrhosis (non-cirrhosis, early fibrosis and cirrhosis), rats were assigned different durations of CCl4 inhalation: 6, 8 and 12 weeks, respectively. (A) Histological evaluation of the liver at different durations of CCl4 inhalation. Representative images are shown. At 8 weeks (n = 6), there was a significant increase in collagen deposition in the liver, which further increased by 12 weeks (n = 6), while at 6 weeks (n = 5) collagen levels were not different from the control group. Collagen levels were determined by Sirius red staining and quantified using BioQuant software. Scale bar = 50 μm. (B) Portal pressure in rats with different durations of CCl4 inhalation compared to that of their age-matched control rats: n = 5 (6 weeks), n = 6 (8 weeks) and n = 6 (12 weeks) for both the control and treatment groups. (C) The correlation between portal pressure and spleen weight was analysed in rats given CCl4 inhalation (n = 17).
Intestinal VEGF levels in cirrhotic rats with portal hypertension
Intestinal VEGF levels increased significantly by 40% in cirrhotic rats exposed for 12 weeks to CCl4via inhalation but did not change in non-cirrhotic rats (6 weeks exposure to CCl4) and early fibrotic rats (8 weeks exposure to CCl4), compared to their respective controls (Fig. 2A).
Fig 2.
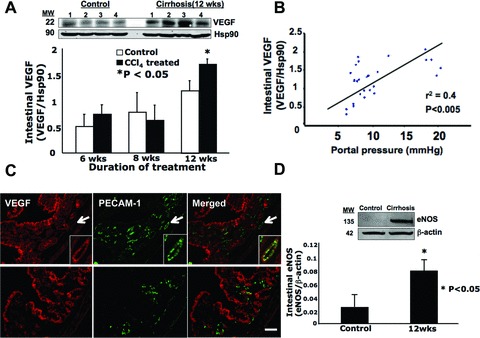
Intestinal VEGF as well as intestinal eNOS levels significantly increased in portal hypertensive rats with cirrhosis (having received 12 weeks of CCl4 by inhalation). (A) Intestinal VEGF levels were determined by Western blot and normalized to Hsp90 for rats with 12 weeks of CCl4 inhalation and control rats. Four representative blots from each group are shown. The graph summarizes densitometric analysis of intestinal VEGF levels at three different durations of CCl4 inhalation. Hsp90 was used as a loading control. n = 5 (6 weeks), n = 6 (8 weeks) and n = 6 (12 weeks) for both the control and treatment groups. (B) Intestinal VEGF levels were positively correlated to portal pressures (PPs). Values from all control rats as well as from all rats given CCl4 inhalation were plotted (n = 34). (C) Immunofluorescence of VEGF (red) with either PECAM-1 (green, an endothelial cell marker) shown in the upper panels, or F4/80 (green, a macrophage marker) shown in the lower panels. Arrows in the upper panels indicate a vessel, which was further magnified and shown in the right lower corner of each panel. Intestines isolated from cirrhotic rats (12 weeks of CCl4 inhalation) were shown. Scale bar = 100 μm. (D) Intestinal eNOS levels at 12 weeks of CCl4 inhalation. Six samples from each group were used for analysis, one pair of which is shown on a representative Western blot. β-Actin was used as a loading control.
A correlation between intestinal VEGF levels and PP
To better understand how PP influences intestinal VEGF levels, their correlation was determined. When data for the CCl4-treated rats from the first batch and their controls were pooled for analysis (Fig. 2B), a significant positive correlation was found between PP and intestinal VEGF levels (r2 = 0.4, P < 0.005).
Intestinal VEGF distribution in cirrhotic rats with portal hypertension
We also determined the cellular localization of VEGF in the jejunum using frozen tissue sections obtained from cirrhotic rats (Fig. 2C). Rabbit IgG was used as a negative control and did not show fluorescence (data not shown). Although immunolabelling showed VEGF to be present throughout the jejunum (Fig. 2C, upper and lower/left panel), the highest levels of VEGF were found in the intestinal epithelium, crypts and vessels using PECAM-1 as a vessel marker (Fig. 2C, upper/centre and right panels). Macrophage distribution was determined using a macrophage marker, F4/80 (Fig. 2C, lower/centre panel), which revealed the presence of macrophages in the intestinal crypts and vessel walls. Although VEGF did not co-localize with F4/80 (i.e. it was not expressed on macrophages), it was found in close proximity to them in the intestinal crypts (Fig. 2C, lower/right panel).
Intestinal eNOS levels in cirrhotic rats with portal hypertension
Besides VEGF, intestinal eNOS levels were also determined in cirrhotic rats with portal hypertension. We found that intestinal eNOS levels increased threefold (P < 0.05) in cirrhotic rats (12-week exposure to CCl4) compared to their controls (Fig. 2D). There was no increase in intestinal eNOS levels in those rats showing no cirrhosis (6-week exposure to CCl4) and early fibrosis (8-week exposure to CCl4) compared to their respective controls (data not shown).
Plasma VEGF levels in cirrhotic rats with portal hypertension
In the second batch of cirrhotic rats (Table 1B), we measured plasma VEGF levels (Fig. 3A) and found they were significantly elevated in cirrhotic rats with ascites (n = 5, 63.7 pg/ml, P < 0.01) compared to control rats (n = 5, 8.5 pg/ml). Although there was a trend of enhanced plasma VEGF levels in those cirrhotic rats without ascites (n = 8, 39.7 pg/ml, P = 0.10), it was not statistically significant.
Fig 3.
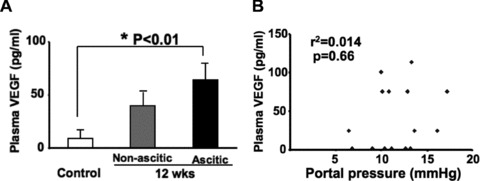
Plasma VEGF levels significantly increased in cirrhotic rats with ascites. (A) Plasma VEGF levels of control (n = 5) versus cirrhotic rats given 12 weeks of CCl4 inhalation in the presence (n = 5) and absence (n = 8) of ascites. (B) There was no significant correlation between portal pressure (PP) and plasma VEGF levels (n = 18).
Portal pressures for control, non-ascitic cirrhotic and ascitic cirrhotic rats were 7.33 ± 0.81 mmHg, 12.9 ± 0.7 mmHg and
13.2 ± 1.3 mmHg, respectively. There was no significant difference in PP between non-ascitic and ascitic cirrhotic rats. In contrast to intestinal VEGF levels, no correlation was found between PP and plasma VEGF levels (r2 = 0.014, P = 0.66; Fig. 3B).
Levels of other angiogenic cytokines in the intestine of cirrhotic rats
Using a cytokine antibody array, we tested whether angiogenic cytokines other than VEGF were up-regulated in the intestine isolated from the first batch of CCl4-treated rats. The results revealed that most of the angiogenic cytokines, including both positive and negative regulators, were up-regulated in cirrhotic rats with a 12-week exposure to CCl4 inhalation although not all increases were significant (Fig. 4A). Non-cirrhotic rats with a 6-week exposure to CCl4 and early fibrotic rats with an 8-week exposure to CCl4, however, did not show any up-regulated angiogenic cytokines (data not shown). Those cytokines that were significantly increased in cirrhotic rats included IL-1α, IL-6 and transforming growth factor-α (TGF-α).
Fig 4.
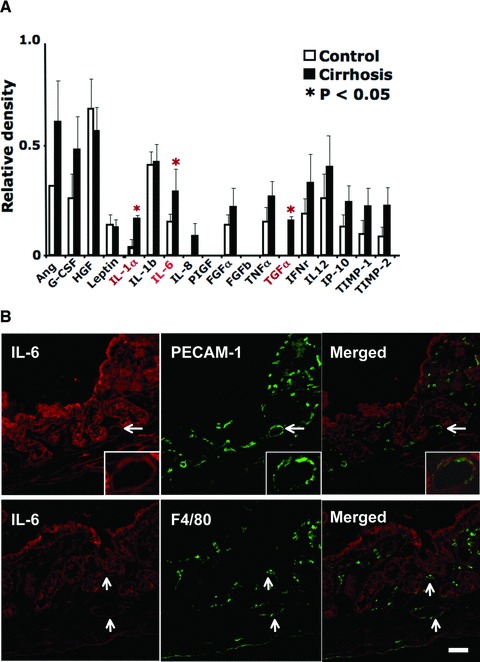
Intestines isolated from portal hypertensive rats with cirrhosis revealed a significant increase in IL-1α, IL-6 and TGF-α protein levels by antibody array at 12 weeks of CCl4 inhalation. (A) Intestinal angiogenic cytokine levels in portal hypertensive rats with cirrhosis. Jejunal lysates, prepared from three control rats and three cirrhotic rats, were individually analysed using the Mouse Angiogenesis Antibody Array kit (Panomics, Inc., Fremont, CA, USA). An equal amount (500 μg) of each protein lysate was loaded for analysis. Cytokine values were normalized against a positive control placed on each membrane. (B) Immunofluorescence showing IL-6 expression (red) and PECAM-1 (green, upper panel) or F4/80 (green, lower panel) in the jejunum isolated from cirrhotic rats (given 12 weeks of CCl4 by inhalation). PECAM-1 was used for an endothelial cell marker, which helps to locate the intestinal microcirculation. F4/80 was used to locate a macrophage population. Arrows indicate representative areas where IL-6 and PECAM-1 or F4/80 are co-localized. In the upper panels, a vessel indicated by an arrow is enlarged and shown in the right bottom corner of each panel. Scale bar = 100 μm.
Among these cytokines, we examined intestinal IL-6 localization in cirrhotic rats because IL-6 has probably been the most studied in cirrhosis accompanied by portal hypertension. A representative immunofluorescent image is shown in Figure 4B. Similar to VEGF, IL-6 was present throughout the jejunum (Fig. 4B) with the highest levels found in the intestinal epithelium, crypts and vessels using PECAM-1 as a vessel marker (Fig. 4B, upper/centre and right panels). Macrophage distribution was also determined using a macrophage marker, F4/80 (Fig. 4B, lower/centre panel) which revealed IL-6’s co-localization with macrophages in the intestinal crypts and vessel walls (Fig. 4B, lower/right panel).
Discussion
VEGF, one of the most potent angiogenic agents [15], has been examined for its possible relationship with liver fibrosis and portal-systemic collateral vessel formation in portal hypertension [4-8]. Studies have demonstrated that blockers of VEGF-signalling reduce fibrosis and portal-systemic collateral vessel formation in cirrhotic rats as well as in non-cirrhotic portal hypertensive (i.e. portal vein ligated) rats [4-13;9,16]. Even more significantly, portal hypertension is ameliorated by the administration of VEGF blockers [8,9]. Growing evidence strongly supports the importance of VEGF for the treatment of portal hypertension in cirrhosis. However, a mechanistic understanding of the regulation of VEGF release is still lacking. Thus, understanding the cause of intestinal VEGF induction in the development of liver cirrhosis and portal hypertension will help to elucidate the mechanisms modulating VEGF release and will advance our knowledge of VEGF’s involvement in the pathogenesis and pathophysiology of portal hypertension.
In this study, we observed that intestinal VEGF levels were significantly elevated in cirrhotic rats with portal hypertension and correlated positively to PP. We also found that intestinal eNOS levels increased threefold in cirrhotic rats with portal hypertension. These results suggest that PP regulates intestinal VEGF levels and subsequently intestinal eNOS levels in cirrhotic rats as our previous study demonstrated in non-cirrhotic portal hypertensive rats [2]. Increased intestinal VEGF levels, triggered by increased PP, promote angiogenesis and the development of portal-systemic collateral vessels thus diverting the stagnant portal blood flow to the systemic circulation. However, along with the progression of portal hypertension, excessive angiogenesis and the formation of collateral vessels actually increase the portal blood flow and exacerbate portal hypertension.
Interestingly, our results may also indicate that intestinal VEGF levels are decreased in advanced portal hypertension. For example, when the data in Figure 2B are divided into two groups at 15 mmHg of PP, intestinal VEGF levels are negatively correlated to a PP > 15 mmHg (r2 = 0.70, P = 0.09), while positively correlated to a PP < 15 mmHg (r2 = 0.30, P < 0.05). Although this negative correlation between PP and intestinal VEGF levels in advanced portal hypertension is not statistically significant and is obtained using a small sample size and a rather arbitrary selection of the cut-off point, it is still an interesting trend. Further studies are needed for a decisive conclusion of this correlation.
Regarding intestinal VEGF localization in cirrhotic rats, our immunofluorescent images showed its enhanced expression in epithelial cells of the villi and crypts, in addition to its well-known sites of vascular endothelial and smooth muscle cells [17,18]. Some stromal cells in the lamina propria of the villi also expressed VEGF. This localization pattern is consistent with previous studies [19,20]. An immunohistochemical study of normal foetal sheep intestine showed that VEGF was expressed in the muscularis and crypts, particularly prominent in the lamina propria and epithelial cells of the villi [20]. In another study using normal mouse intestine, VEGF was expressed mainly in epithelial cells of the crypts and became weaker through the tips of the villi [19]. Our study also revealed strong VEGF expression around F4/80-positive macrophages. Overall, our observations suggest that in cirrhosis, VEGF expression is up-regulated in most cell types of the intestine.
We also found that, similar to intestinal VEGF levels, plasma VEGF levels were significantly elevated in cirrhotic rats with ascites. Increased plasma VEGF levels were also observed in cirrhotic rats without ascites but were not statistically significant. Unlike a previous study of cirrhotic patients [12], our study did not show a correlation of PP with plasma VEGF levels. However, the cirrhotic patients from the earlier study had different pathologic aetiologies including alcohol abuse, hepatitis B and C viral infections, cryptogenic liver cirrhosis, and primary biliary cirrhosis. It is thus difficult to compare that study [12] with our study. Nevertheless, both studies agree that higher PPs are associated with elevated VEGF levels.
In general, circulating VEGF levels are influenced by complex factors in liver disease and their interpretation may not be simple. For example, one study showed plasma VEGF levels increasing with the severity of liver impairment (assessed by the Child-Pugh score and MELD classification) [21]. A different study reported significantly decreased serum VEGF levels in patients with chronic hepatitis and liver cirrhosis [22]. Another study showed that while serum VEGF levels were lower in chronic cirrhotic patients compared to their corresponding controls, the levels were significantly higher in patients with acute hepatitis compared to the control group [23]. Collectively, these observations in liver disease patients may indicate that circulating VEGF levels may change according to the stage and aetiology of liver disease. In addition, sample preparation may also likely influence the measurement of circulating VEGF levels.
Furthermore, the difficulty associated with the interpretation of circulating VEGF levels may also be, at least partly, attributable to the existence of VEGF isoforms. VEGF exists in the form of multiple splice variants, which include VEGF120, VEGF164 and VEGF 188 in rats, corresponding to human VEGF121, VEGF 165 and VEGF189, respectively [24]. VEGF120 is freely diffusible. In contrast, VEGF188 is strongly bound to the cell surface and sequestered in the extracellular matrix. The major VEGF isoform, VEGF164, is somewhat diffusible but is predominantly bound to the extracellular matrix [25,26]. Thus, expression patterns as well as the patterns of release from cells are thought to differ among these isoforms [25,27]. In our study, while intestinal VEGF levels correlated to PP, plasma VEGF levels were not. This observation might be explained, at least in part, by these differences in the properties of the VEGF isoforms. Currently, nothing is known about isoform-specific characteristics in cirrhosis with portal hypertension, including any information as to which isoform is up-regulated/down-regulated. This is an important area to be explored in the future.
Because angiogenesis plays a crucial role in the development of porto-systemic collateral vessels in portal hypertension, we looked at other angiogenic cytokines besides VEGF, which were up-regulated in the intestines of cirrhotic rats. While we found that most of the angiogenic cytokines examined were up-regulated, the levels of interleukin-6 (IL-6), TGF-α and IL-1α were particularly higher by more than twofold in cirrhotic rats, compared to controls. TGF-α is an important angiogenic factor that is highly expressed in neovascularized tumours [19]. IL-1α enhances angiogenesis via up-regulation of secreted VEGF in gastric cancer cell lines [28].
IL-6 has probably been the most studied in cirrhosis with portal hypertension among these. Circulating IL-6 levels were higher in patients with advanced cirrhosis (Child–Pugh score C versus B versus A) [29], as well as in rats with CCl4-induced liver cirrhosis [30] as were plasma IL-6 levels in patients with chronic liver disease [31]. However, the role of IL-6 in acute and chronic liver injury remains controversial with some studies suggesting IL-6 is important for healthy liver maintenance and function. One such study observed that mice with targeted disruption of the IL-6 gene had impaired liver regenerative capacity characterized by liver necrosis and failure [32]. In another study, IL-6-deficient mice exposed to CCl4 showed attenuated liver fibrosis [33]. In terms of the haemodynamic abnormalities seen in patients with cirrhosis, Lee et al. [34] reported a negative correlation between IL-6 levels and systemic vascular resistance suggesting a role for IL-6 in systemic vasodilation. Further, our immunofluorescent imaging shows that IL-6 is localized in similar areas as VEGF. Thus, like VEGF, IL-6 may play a role in the pathogenesis and pathophysiology of portal hypertension.
In conclusion, changes in PP that occur during the development of cirrhosis could be an important factor for the induction of intestinal VEGF production, which, along with other angiogenic/inflammatory cytokines, contributes to the development and maintenance of portal hypertension. Future studies on the role of VEGF isoforms and other angiogenic cytokines, particularly IL-6, in portal hypertension should be particularly revealing and are highly anticipated.
Acknowledgments
This work was supported by National Institutes of Health grants K01 DK067933 and R01 DK082600 and by the Clinical and Translational Science Award to Dr. Iwakiri from the Yale Center for Clinical Investigation (UL1RR024139). We thank Mr. Jay Prendergast, Ms. Teresa Silva and Dr. Sandy Cho for editing the manuscript.
Conflict of interest
The authors confirm that there are no conflicts of interest.
Supporting Information
Additional Supporting Information may be found in the online version of this article.
Co-localization of VEGF with VE-cadherin and VEGFR2 in the intestines of cirrhotic rats.
Please note: Wiley-Blackwell is not responsible for the content or functionality of any supporting materials supplied by the authors. Any queries (other than missing material) should be directed to the corresponding author for the article.
References
- 1.Iwakiri Y, Groszmann RJ. The hyperdynamic circulation of chronic liver diseases: from the patient to the molecule. Hepatology. 2006;43:S121–31. doi: 10.1002/hep.20993. [DOI] [PubMed] [Google Scholar]
- 2.Abraldes JG, Iwakiri Y, Loureiro-Silva M, et al. Mild increases in portal pressure upregulate vascular endothelial growth factor and endothelial nitric oxide synthase in the intestinal microcirculatory bed, leading to a hyperdynamic state. Am J Physiol Gastrointest Liver Physiol. 2006;290:G980–7. doi: 10.1152/ajpgi.00336.2005. [DOI] [PubMed] [Google Scholar]
- 3.Corpechot C, Barbu V, Wendum D, et al. Hypoxia-induced VEGF and collagen I expressions are associated with angiogenesis and fibrogenesis in experimental cirrhosis. Hepatology. 2002;35:1010–21. doi: 10.1053/jhep.2002.32524. [DOI] [PubMed] [Google Scholar]
- 4.Fernandez M, Mejias M, Angermayr B, et al. Inhibition of VEGF receptor-2 decreases the development of hyperdynamic splanchnic circulation and portal-systemic collateral vessels in portal hypertensive rats. J Hepatol. 2005;43:98–103. doi: 10.1016/j.jhep.2005.02.022. [DOI] [PubMed] [Google Scholar]
- 5.Fernandez M, Mejias M, Garcia-Pras E, et al. Reversal of portal hypertension and hyperdynamic splanchnic circulation by combined vascular endothelial growth factor and platelet-derived growth factor blockade in rats. Hepatology. 2007;46:1208–17. doi: 10.1002/hep.21785. [DOI] [PubMed] [Google Scholar]
- 6.Fernandez M, Vizzutti F, Garcia-Pagan JC, et al. Anti-VEGF receptor-2 monoclonal antibody prevents portal-systemic collateral vessel formation in portal hypertensive mice. Gastroenterology. 2004;126:886–94. doi: 10.1053/j.gastro.2003.12.012. [DOI] [PubMed] [Google Scholar]
- 7.Melgar-Lesmes P, Tugues S, Ros J, et al. Vascular endothelial growth factor and angiopoietin-2 play a major role in the pathogenesis of vascular leakage in cirrhotic rats. Gut. 2009;58:285–92. doi: 10.1136/gut.2008.155028. [DOI] [PubMed] [Google Scholar]
- 8.Tugues S, Fernandez-Varo G, Munoz-Luque J, et al. Antiangiogenic treatment with sunitinib ameliorates inflammatory infiltrate, fibrosis, and portal pressure in cirrhotic rats. Hepatology. 2007;46:1919–26. doi: 10.1002/hep.21921. [DOI] [PubMed] [Google Scholar]
- 9.Mejias M, Garcia-Pras E, Tiani C, et al. Beneficial effects of sorafenib on splanchnic, intrahepatic, and portocollateral circulations in portal hypertensive and cirrhotic rats. Hepatology. 2009;49:1245–56. doi: 10.1002/hep.22758. [DOI] [PubMed] [Google Scholar]
- 10.Loureiro-Silva MR, Iwakiri Y, Abraldes JG, et al. Increased phosphodiesterase-5 expression is involved in the decreased vasodilator response to nitric oxide in cirrhotic rat livers. J Hepatol. 2006;44:886–93. doi: 10.1016/j.jhep.2006.01.032. [DOI] [PubMed] [Google Scholar]
- 11.Reiberger T, Angermayr B, Schwabl P, et al. Sorafenib attenuates the portal hypertensive syndrome in partial portal vein ligated rats. J Hepatol. 2009;51:865–73. doi: 10.1016/j.jhep.2009.06.024. [DOI] [PubMed] [Google Scholar]
- 12.Sieghart W, Fellner S, Reiberger T, et al. Differential role of circulating endothelial progenitor cells in cirrhotic patients with or without hepatocellular carcinoma. Dig Liver Dis. 2009;41:902–6. doi: 10.1016/j.dld.2009.04.013. [DOI] [PubMed] [Google Scholar]
- 13.Loureiro-Silva MR, Cadelina GW, Iwakiri Y, et al. A liver-specific nitric oxide donor improves the intra-hepatic vascular response to both portal blood flow increase and methoxamine in cirrhotic rats. J Hepatol. 2003;39:940–6. doi: 10.1016/j.jhep.2003.09.018. [DOI] [PubMed] [Google Scholar]
- 14.Iwakiri Y, Cadelina G, Sessa WC, et al. Mice with targeted deletion of eNOS develop hyperdynamic circulation associated with portal hypertension. Am J Physiol Gastrointest Liver Physiol. 2002;283:G1074–81. doi: 10.1152/ajpgi.00145.2002. [DOI] [PubMed] [Google Scholar]
- 15.Carmeliet P. Mechanisms of angiogenesis and arteriogenesis. Nat Med. 2000;6:389–95. doi: 10.1038/74651. [DOI] [PubMed] [Google Scholar]
- 16.Yoshiji H, Kuriyama S, Yoshii J, et al. Vascular endothelial growth factor and receptor interaction is a prerequisite for murine hepatic fibrogenesis. Gut. 2003;52:1347–54. doi: 10.1136/gut.52.9.1347. [DOI] [PMC free article] [PubMed] [Google Scholar]
- 17.Ferrara N, Winer J, Burton T. Aortic smooth muscle cells express and secrete vascular endothelial growth factor. Growth Factors. 1991;5:141–8. doi: 10.3109/08977199109000278. [DOI] [PubMed] [Google Scholar]
- 18.Ladoux A, Frelin C. Expression of vascular endothelial growth factor by cultured endothelial cells from brain microvessels. Biochem Biophys Res Commun. 1993;194:799–803. doi: 10.1006/bbrc.1993.1892. [DOI] [PubMed] [Google Scholar]
- 19.Gutierrez LS, Suckow M, Lawler J, et al. Thrombospondin 1—a regulator of adenoma growth and carcinoma progression in the APC(Min/+) mouse model. Carcinogenesis. 2003;24:199–207. doi: 10.1093/carcin/24.2.199. [DOI] [PubMed] [Google Scholar]
- 20.Holmes K, Charnock JonesSD, Forhead AJ, et al. Localization and control of expression of VEGF-A and the VEGFR-2 receptor in foetal sheep intestines. Pediatr Res. 2008;63:143–8. doi: 10.1203/PDR.0b013e31815f00e0. [DOI] [PubMed] [Google Scholar]
- 21.Jaroszewicz J, Januszkiewicz M, Flisiak R, et al. Circulating vascular endothelial growth factor and its soluble receptors in patients with liver cirrhosis: possible association with hepatic function impairment. Cytokine. 2008;44:14–7. doi: 10.1016/j.cyto.2008.06.002. [DOI] [PubMed] [Google Scholar]
- 22.Desideri G, Ferri C. Circulating vascular endothelial growth factor levels are decreased in patients with chronic hepatitis and liver cirrhosis depending on the degree of hepatic damage. Clin Sci (Lond) 2000;99:159–60. [PubMed] [Google Scholar]
- 23.Akiyoshi F, Sata M, Suzuki H, et al. Serum vascular endothelial growth factor levels in various liver diseases. Dig Dis Sci. 1998;43:41–5. doi: 10.1023/a:1018863718430. [DOI] [PubMed] [Google Scholar]
- 24.Robinson CJ, Stringer SE. The splice variants of vascular endothelial growth factor (VEGF) and their receptors. J Cell Sci. 2001;114:853–65. doi: 10.1242/jcs.114.5.853. [DOI] [PubMed] [Google Scholar]
- 25.Park JE, Keller GA, Ferrara N. The vascular endothelial growth factor (VEGF) isoforms: differential deposition into the subepithelial extracellular matrix and bioactivity of extracellular matrix-bound VEGF. Mol Biol Cell. 1993;4:1317–26. doi: 10.1091/mbc.4.12.1317. [DOI] [PMC free article] [PubMed] [Google Scholar]
- 26.Ferrara N, Davis-Smyth T. The biology of vascular endothelial growth factor. Endocr Rev. 1997;18:4–25. doi: 10.1210/edrv.18.1.0287. [DOI] [PubMed] [Google Scholar]
- 27.Ng YS, Rohan R, Sunday ME, et al. Differential expression of VEGF isoforms in mouse during development and in the adult. Dev Dyn. 2001;220:112–21. doi: 10.1002/1097-0177(2000)9999:9999<::AID-DVDY1093>3.0.CO;2-D. [DOI] [PubMed] [Google Scholar]
- 28.Ma J, Sawai H, Matsuo Y, et al. Interleukin-1alpha enhances angiogenesis and is associated with liver metastatic potential in human gastric cancer cell lines. J Surg Res. 2008;148:197–204. doi: 10.1016/j.jss.2007.08.014. [DOI] [PubMed] [Google Scholar]
- 29.Giron-Gonzalez JA, Martinez-Sierra C, Rodriguez-Ramos C, et al. Implication of inflammation-related cytokines in the natural history of liver cirrhosis. Liver Int. 2004;24:437–45. doi: 10.1111/j.1478-3231.2004.0951.x. [DOI] [PubMed] [Google Scholar]
- 30.Zhang LJ, Yu JP, Li D, et al. Effects of cytokines on carbon tetrachloride-induced hepatic fibrogenesis in rats. World J Gastroenterol. 2004;10:77–81. doi: 10.3748/wjg.v10.i1.77. [DOI] [PMC free article] [PubMed] [Google Scholar]
- 31.Streetz KL, Tacke F, Leifeld L, et al. Interleukin 6/gp130-dependent pathways are protective during chronic liver diseases. Hepatology. 2003;38:218–29. doi: 10.1053/jhep.2003.50268. [DOI] [PubMed] [Google Scholar]
- 32.Cressman DE, Greenbaum LE, DeAngelis RA, et al. Liver failure and defective hepatocyte regeneration in interleukin-6-deficient mice. Science. 1996;274:1379–83. doi: 10.1126/science.274.5291.1379. [DOI] [PubMed] [Google Scholar]
- 33.Natsume M, Tsuji H, Harada A, et al. Attenuated liver fibrosis and depressed serum albumin levels in carbon tetrachloride-treated IL-6-deficient mice. J Leukoc Biol. 1999;66:601–8. [PubMed] [Google Scholar]
- 34.Lee FY, Lu RH, Tsai YT, et al. Plasma interleukin-6 levels in patients with cirrhosis. Relationship to endotoxemia, tumour necrosis factor-alpha, and hyperdynamic circulation. Scand J Gastroenterol. 1996;31:500–5. doi: 10.3109/00365529609006772. [DOI] [PubMed] [Google Scholar]
Associated Data
This section collects any data citations, data availability statements, or supplementary materials included in this article.
Supplementary Materials
Co-localization of VEGF with VE-cadherin and VEGFR2 in the intestines of cirrhotic rats.