

Abstract
Fast magic angle spinning (MAS) NMR spectroscopy is becoming increasingly important in structural and dynamics studies of biological systems and inorganic materials. Superior spectral resolution due to the efficient averaging of the dipolar couplings can be attained at MAS frequencies of 40 kHz and higher with appropriate decoupling techniques, while proton detection gives rise to significant sensitivity gains, therefore making fast MAS conditions advantageous across the board compared with the conventional slow- and moderate-MAS approaches. At the same time, many of the dipolar recoupling approaches that currently constitute the basis for structural and dynamics studies of solid materials and that are designed for MAS frequencies of 20 kHz and below, fail above 30 kHz. In this report, we present an approach for 1H-13C/1H-15N heteronuclear dipolar recoupling under fast MAS conditions using R-type symmetry sequences, which is suitable even for fully protonated systems. A series of rotor-synchronized R-type symmetry pulse schemes are explored for the determination of structure and dynamics in biological and organic systems. The investigations of the performance of the various RNnv-symmetry sequences at the MAS frequency of 40 kHz experimentally and by numerical simulations on [U-13C,15N]-alanine and [U-13C,15N]-N-acetyl-valine, revealed excellent performance for sequences with high symmetry number ratio (N/2n > 2.5). Further applications of this approach are presented for two proteins, sparsely 13C/uniformly 15N enriched CAP-Gly domain of dynactin and U-13C,15N-Tyr enriched C-terminal domain of HIV-1 CA protein. 2D and 3D R1632-based DIPSHIFT experiments carried out at the MAS frequency of 40 kHz, yielded site-specific 1H-13C/1H-15N heteronuclear dipolar coupling constants for CAP-Gly and CTD CA, reporting on the dynamic behavior of these proteins on time scales of nano- to microseconds. The R-symmetry based dipolar recoupling under fast MAS is expected to find numerous applications in studies of protein assemblies and organic solids by MAS NMR spectroscopy.
Keywords: dipolar recoupling, solid-state NMR, magic angle spinning, R-type symmetry sequences, γ-encoded
INTRODUCTION
Solid-state NMR spectroscopy has emerged as a powerful method for determination of molecular structure and dynamics in biological solids and materials, especially since the advent of magic angle spinning (MAS) in 1950's by Andrew1 and independently by Lowe2. Various anisotropic spin interactions can be averaged out partly or completely by a rapid rotation of a solid sample around the “magic angle” axis, giving rise to greatly enhanced sensitivity and resolution and yielding liquid-like spectra1–3. This suppression of the anisotropic portions of spin interactions, while necessary and advantageous from the resolution and sensitivity standpoints, results in a loss of valuable information about the geometric and electronic structure of the solid under investigation. Therefore, multiple laboratories have focused efforts on development of recoupling methods that permit measurements of the anisotropic interactions under MAS conditions in order to gain structural and dynamics information.4–28 The majority of the currently existing recoupling techniques perform best at moderate MAS frequencies, below 20 kHz.
With the breakthroughs in the MAS probe technology starting in the late 1990's, fast MAS frequencies of the order of 40–70 kHz are now accessible to an NMR spectroscopist.29–30 These fast MAS conditions result in greatly enhanced spectral resolution due to the efficient suppression of homonuclear 1H-1H dipolar interactions at frequencies above 40 kHz.31–33 Moreover, under fast MAS conditions, proton-detected experiments have become a reality in uniformly isotopically enriched proteins. Proton detection provides further benefits due to both several-fold sensitivity increase compared with the heteronucleus detection and the additional information gained by incorporating the 1H dimension into the spectra.32–36 With these advances, detailed structural and dynamics analysis of very large proteins and protein assemblies containing either uniform or dilute isotopic labels is now becoming feasible.37–42 Therefore, development of recoupling protocols that work under fast MAS conditions becomes particularly important at this time. Specifically, measurement of heteronuclear (1H-13C and 1H-15N) dipolar couplings is critical as these couplings provide structural and dynamics information in a broad range of systems, such as proteins, biopolymers and organic solids. To date several recoupling schemes have been established for correlation spectroscopy under fast MAS frequencies;43–52 however, to the best of our knowledge, heteronuclear dipolar recoupling methodology for recording 1H-13C and/or 1H-15N dipolar couplings in fully protonated solids under these conditions is still under development. Recently, a REDOR-based measurement of 1H-15N order parameters in a highly deuterated microcrystalline ubiquitin has been reported,53–54 and this approach requires extensive deuteration of the protein under study because REDOR-based rf field irradiation cannot suppress 1H-1H homonuclear dipolar couplings in highly protonated systems, even under fast MAS conditions.
Recently, Levitt and coworkers presented the generalized symmetry theorems55–56 that are very useful in the design of radio frequency (RF) schemes for selective recoupling and/or decoupling of the various anisotropic spin interactions in MAS NMR spectroscopy.17–18,20,57–63 Such symmetry-based approaches are classified by Levitt as CNnv and RNnv recoupling schemes, where the symbols N, n and v are small integers and are referred to as the symmetry numbers of the pulse sequence, depending on the rotation properties of the spin angular momenta during the rotor-synchronized train of radio frequency (RF) pulses. Comparing these two classes of symmetry-based schemes, the R-type sequences have more restrictive selection rules than the C-type sequences.20,55–57 Our analysis of the Hamiltonians corresponding to the various anisotropic spin interactions suggests that it is possible to selectively reintroduce heteronuclear (1H-13C/1H-15N) dipolar interactions by appropriately designed RNnv symmetry pulse sequences while suppressing homonuclear dipolar couplings, even under fast MAS conditions. Here, we present a series of rotor-synchronized RNnv symmetry pulse schemes, as shown in Table S1 in the Supporting Information, suitable for the determination of heteronuclear dipolar couplings under a wide range of MAS frequencies, including fast MAS conditions. These sequences are highly effective in suppressing 1H-1H homonuclear dipolar couplings, which makes them suitable for dipolar recoupling in fully protonated systems. Dipolar truncation for the different heteronucelar spin pairs suppresses the influence of remote protons and 1H CSA on the spectra. These R-type symmetry sequences are employed in this work for the measurement of 1H-13C and 1H-15N dipolar couplings, which bear crucial structural and dynamics information in biological and organic solids. We first evaluate the performance of these RNnv symmetry sequences experimentally and by numerical simulations at the MAS frequency of 40 kHz in [U-13C,15N]-alanine and [U-15N]-N-acetyl-valine (NAV). We next demonstrate the applications of these sequences in [U-13C/15N]-Tyr labeled C-terminal domain of HIV-1 CA protein and in [sparsely-13C/U-15N]- labeled CAP-Gly domain of dynactin, where we have measured 1H-13Cα dipolar couplings in a site-specific way. The results indicate the high accuracy and precision of the derived heteronuclear dipolar couplings. The approach presented in this report is anticipated to be broadly applicable to determination of heteronuclear dipolar couplings in organic solids and biological systems, such as proteins, protein assemblies, and nucleic acids, under a variety of MAS conditions, including both fast and moderate spinning frequencies.
EXPERIMENTS AND METHODS
Materials
U-13C,15N- labeled L-alanine and U-15N-labeled N-acetyl-valine (NAV) were purchased from Cambridge Isotope Laboratories and used without further purification. Both powder samples were packed into the 1.8 mm MAS rotors for subsequent NMR experiments. The conical assemblies of U-13C, 15N-Tyrosine labeled C-terminal domain (CTD) of HIV-1 CA capsid protein were prepared by controlled precipitation from 50% w/v solution of PEG-4,000 at the ratio of 1:1 (v/v) with the final concentration of 16 mg/mL, followed by incubation at 37 °C for 1 hour, as reported previously.42 CAP-Gly sparsely enriched in 13C and uniformly labeled with 15N was prepared from E. coli, grown in a minimal medium containing 1,3-13C glycerol (Cambridge Isotope Laboratories) as the sole carbon source and 15NH4Cl as the sole nitrogen source. The solid-state NMR sample of CAP-Gly was prepared by controlled precipitation from polyethylene glycol, by slowly adding a solution of 30% PEG-3350 to the solution of 24.3 mg of CAP-Gly (38.5 mg/mL), both dissolved in 10 mM MES buffer (10 mM MgCl2, pH 6.0), as described previously.64
Solid-State NMR Spectroscopy
All NMR experiments were recorded on a Varian InfinityPlus solid-state NMR spectrometer, operating at a Larmor frequency of 599.8 MHz for 1H, 150.8 MHz for 13C, and 60.8 MHz for 15N. A 1.8 mm MAS triple-resonance probe developed in the Samoson laboratory was used (spinning rates up to 50 kHz). All samples were packed into 1.8 mm rotors, and all spectra were recorded at a MAS frequency of 40 kHz, controlled to within ±5 Hz. The typical 90° pulse length was 2.8 μs (1H), 4.1 μs (13C), and 7 μs (15N). The temperature was calibrated at different MAS frequencies using a PbNO3 temperature sensor,65 and the actual temperature at the sample was maintained to within ±0.5 °C throughout the experiments using the Varian temperature controller.
For NMR experiments on Ala and NAV, a 2D DIPSHIFT sequence shown in Figure 1(a) was used. To reduce the sample heating during fast MAS, nitrogen gas was used for cooling, resulting in a final sample temperature of 20 °C for the Ala and NAV samples. TPPM 1H decoupling with a weak rf field strength66 of 11 kHz was used during the acquisition period t2, and CW decoupling with the same rf field strength was applied the duration T-t1. The 1H-13C(15N) cross polarization was performed with a linear amplitude ramp (80–100%) on 13C(15N); the 1H radio frequency field was 55 kHz with the center of ramp Hartmann-Hahn matched to the first spinning sideband. The contact time was 1.5 ms, and the recycle delay was 5.0 s. A series of 2D NMR spectra were recorded with different RNnν symmetry pulse irradiation applied during t1. The basic R element was a π pulse; the rf field strength (N/2n·ωR) and the phase (±ν/N×180°) for each symmetry sequence are determined by its symmetry properties, as shown in Figure S1. The 1H rf field strengths were 112 kHz for R2854, 110 kHz for R2243, 106.7 kHz for R1632, 104 kHz for R2653, 93.3 kHz for R1431, 90.0 kHz for R1841, 88.0 kHz for R2251, 86.7 kHz for R2661, 80.0 kHz for R414, 74.3 kHz for R2671, and 72.0 kHz for R1851 dipolar recoupling period. Each rf field strength (N/2n·ωR) was optimized directly on the detected sample by finding the “zero” point for the fixed-length π pulse (ν*τR/N). 16 scans were accumulated for each t1 increment, and a total of 32 t1 increments were recorded for each spectrum. It is worth noting that despite the high rf field strengths employed during the R-based recoupling period rf heating is not a problem in any of the samples of interest including proteins, due to short irradiation times, the longest recoupling period being 1.2 ms.
Figure 1.
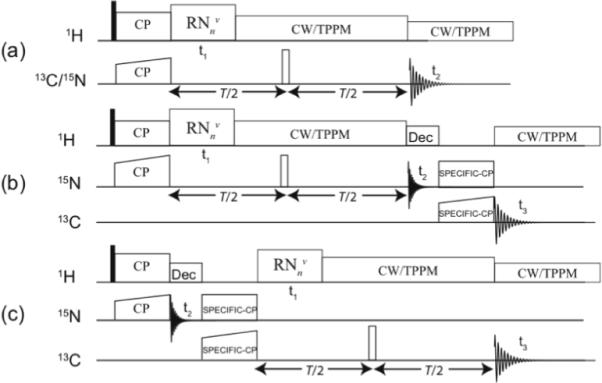
(a) Two-dimensional and (b, c) three-dimensional DIPSHIFT pulse sequences for 1H-13C or 1H-15N heteronuclear dipolar recoupling experiments under fast MAS conditions (frequencies of 40 kHz or above). RF irradiation consisting of RNnν symmetry pulses is applied on proton spins during the t1 time to reintroduce the 1H-15N (b) or 1H-13C (c) dipolar couplings. In (b, c), SPECIFIC-CP is used to establish NCA or NCO chemical shift correlations. CW or TPPM with weak rf irradiation (typically, 10 kHz) is applied for 1H dipolar decoupling under fast MAS.
For U-13C, 15N-Tyr labeled CTD capsid protein, 2D R1632–based DIPSHIFT experiments were performed for the measurement of 1H-15N and 1H-13Cα heteronuclear dipolar couplings. 6144 scans with a pulse delay of 1.0 s were accumulated for each t1 increment (dw = 75 us, corresponding to three rotor periods), and a total of 16 t1 increments were recorded for each spectrum. For sparsely-13C, U-15N enriched CAP-Gly protein sample, a 3D 1H-13C R1632–based DIPSHIFT spectrum was recorded. The pulse sequence is shown in Figure 1(c). TPPM 1H decoupling was used during the acquisition period t3, and CW decoupling was used during t2 and duration T-t1; the decoupling rf field strength was 11 kHz in both cases. During the SPECIFIC-CP period, no 1H decoupling was applied. A total of 20 t1 and 36 t2 increments were used to record the 3D DIPSHIFT spectrum, and 256 scans with a pulse delay of 2.0 s were accumulated for each increment. The total experimental time was 102 h for the 3D DIPSHIFT experiment. For both protein samples, the MAS frequency was set to 40 kHz and was controlled to within ±10 Hz by a Varian MAS controller. To reduce sample heating from fast spinning, nitrogen gas was used for cooling, resulting in a final temperature of −5 °C at the protein sample. 1H rf field irradiation of 106.7 kHz was used to reintroduce 1H-13C dipolar couplings during the R1632-t1 time. A real acquisition mode was used for the t1 dipolar dimension in all DIPSHIFT NMR experiments. All 2D and 3D NMR data were processed in NMRPipe in a Mac environment by zero filling and Fourier transformation. In the 3D DIPSHIFT on CAP-Gly protein, linear prediction was also performed in N15 (t2) dimension. The dipolar lineshapes were extracted along the 13C (15N) isotropic chemical shift dimension.
Numerical Simulations
Numerical simulations of 1H-13C and 1H-15N dipolar spectra were performed using the SIMPSON software package.67 986 ZCW angles (α, β) and 3 γ angles were used to generate a powder average for all γ-encoded R-type symmetry sequences. 986 ZCW angles (α, β) and 64 γ angles were employed for non γ-encoded R414 symmetry sequence. For extracting the best-fit dipolar patterns, the same experimental parameters (i.e., 1H Larmor frequency, MAS frequency, rf field strength, number of t1 points, finite pulse lengths, zero-filling, line broadening, etc.) were used in the simulations for each experiment. SIMPLEX method was followed for the fitting of 1H-15N and 1H-13C dipolar lineshapes, whereas effective χ2 values were calculated following a simplified protocol embedded in SIMPSON-Minuit, assuming that the invidual points of the experimental dipolar lineshape display the same variance. We note that for dipolar spectra this procedure results in higher χ2 values than those generated in the noise-weighted χ2 calculation, because of the over-estimated contributions of the outer (low-intensity) regions of the dipolar spectrum to the overall powder pattern. So, the effective χ2 values presented in this report are higher (errors are over-estimated) than the actual errors. Isolated H-N and H-C spin pairs were used in the simulations, and the effect of 1H chemical shift anisotropy was taken into account as well (δσ = 10.0 ppm and η =1 for the NH proton, δσ = 2.0 ppm and η =1 for the CH proton; the principal element, δzz, was assumed to lie along the dipolar vector). The best fit parameters, including dipolar coupling constant (ωD) and Lorentzian line broadening (LB), were extracted from the simulated dipolar line shape possessing the lowest χ2.
RESULTS AND DISCUSSION
Symmetry-Based Sequences for Heteronuclear Dipolar Recoupling at Fast MAS: General Properties and Numerical Simulations
The generalized pulse sequence for R-symmetry based two-dimensional separated local field (SLF)20–21,68–70 spectroscopy is shown in Figure 1(a). Following the ramped cross-polarization (CP)71 period, the CP-enhanced 13C/15N magnetization evolves for a constant duration T, with a π pulse inserted at T/2 to refocus the 13C/15N isotropic chemical shift. Simultaneously, the MAS-averaged 1H-13C or 1H-15N dipolar couplings are reintroduced during the variable evolution period t1, by a rotor-synchronized RNnν rf pulse train on 1H spins, followed by 1H heteronuclear decoupling applied for the duration T-t1. In order to provide an additional chemical shift dimension, necessary for the applications of this approach to uniformly- or extensively-13C,15N-enriched proteins and protein assemblies, the SPECIFIC-CP sequence72 can be used to establish NCA or NCO correlations either following or preceding the RNnν dipolar and 15N chemical shift evolution periods, as shown in Figure 1(b) and 1(c), respectively. The resulting 3D spectrum contains either 1H-15N (Figure 1b) or 1H-13C (Figure 1c) dipolar lineshapes for each residue along the t1 dimension, and the corresponding 15N and 13C isotropic chemical shifts along the t2 and t3 dimensions. Under fast MAS conditions, no 1H decoupling is necessary during the SPECIFIC-CP period, and the maximum DCP transfer efficiency is achieved.
The R-type symmetry sequences suitable for dipolar recoupling at fast MAS frequencies of 40 kHz or above are summarized in the Supporting Information (see Table S1). These particular schemes are chosen to satisfy the typical NMR hardware requirements and limitations in a modern spectrometer (i.e., the maximum 1H rf field strength achievable in a typical MAS probe, as well as the amplifier rf power limitations), and to yield the optimal (highest possible) scaling factor55,58 for the dipolar recoupling. The symmetry numbers of the sequences listed in Table S1 are limited to the range 10 ≤ N ≤ 30, and the ratios of the symmetry numbers are limited to 1.0 < N/2n ≤ 5.0, to yield rf powers compatible with the available modern hardware. All of the symmetry sequences under discussion except for R414 are γ-encoded, and as shown below, all of them exhibit excellent performance in recoupling heteronuclear dipolar Hamiltonian interactions while suppressing the first-order homonuclear dipolar Hamiltonian to zero, with simultaneous efficient reduction of the recoupled second-order Hamiltonian terms HDD-DD and HDD-CSA. The recoupled heteronuclear dipole-dipole Hamiltonian terms can be characterized by four quantum numbers {l, m, λ, μ}, and the γ-encoded RNnν symmetry sequences can be divided into two categories based on their recoupling properties with respect to particular Hamiltonian terms. The Hamiltonian terms corresponding to {l, m, λ, μ} = {2, 2, 1, −1} and {2, −2, 1, 1} are recoupled by γ-encoded RNnν symmetry sequences with N > 2n, and the Hamiltonian terms with {l, m, λ, μ} = {2, 2, 1, 1} and {2, −2, 1, −1} are recoupled by γ-encoded RNnν symmetry sequences with N < 2n. Each symmetry sequence exhibits different scaling factor for recoupling heteronuclear dipolar interactions, and generally the symmetry sequences with higher N/n ratio have larger scaling factors (as shown in Figure S2 of the Supporting Information). The rf field strength required for the RNnν symmetry sequences consisting of π pulses as basic R elements is dependent on the symmetry numbers and MAS frequency, ω1 = NωR/2n.
In this work, we employed the simplest π pulse as the basic R element for all RNnν-sequences, and the rf field applied on the proton spins equals N/2n times the MAS frequency, as illustrated in Table S1. For the various RNnν symmetry sequences presented in Figure 1, we have simulated the 1H-15N and 1H-13C dipolar patterns for the MAS frequency of 40 kHz, and the resulting lineshapes are illustrated in Figure S3 of the Supporting Information. These simulated spectra suggest that R-type symmetry sequences should work well for heteronuclear dipolar recoupling spectroscopy under fast MAS conditions, and that the dipolar couplings can be extracted from the overall lineshape. In these simulations, we assumed an isolated H-N spin system, and the resulting lineshapes are identical for all RNnν sequences, except being scaled by sequence-specific scaling factors. These scaling factors differ depending on the sequence, and notably, the R414 (rotary resonance, n = 2) sequence displays the highest scaling factor, ca. 0.5, almost 1.6 times as large as the highest scaling factor for other γ-encoded R symmetry sequences that were considered here. A total of six first-order heteronuclear dipole-dipole Hamiltonian terms, {l, m, λ, μ} = {2, ±2, 1, −1}, {2, ±2, 1, 1} and {2, ±2, 1, 0} are reintroduced by R414 symmetry irradiation under fast MAS frequencies, giving rise to a large scaling factor. However, R414 symmetry scheme is not very effective in suppressing higher-order Hamiltonian terms, and especially higher-order homonuclear dipolar interactions that would affect the lineshape of the 1H-15N/1H-13C dipolar patterns.
The simulations also revealed that the dipolar line shapes depend to a greater or lesser extent on other spin interactions and experimental imperfections, which include multiple protons, chemical shift anisotropy of protons, and rf field inhomogeneity. Each R-type symmetry sequence has different sensitivity to these factors, as illustrated in Figures S4–S6 of the Supporting Information, and a brief discussion follows here.
The effect from remote protons in NHx (x > 1) spin system is negligible demonstrating that all RNnν symmetry sequences, even the non-γ encoded R414, can suppress 1H-1H homonuclear dipolar couplings very efficiently (see Figure S4). Therefore, the R-type symmetry sequences under study are suitable for dipolar recoupling in highly protonated spin systems, because for these sequences the recoupled dipolar Hamiltonian terms do not commute with each other for different spin pairs, and the weak heteronuclear dipolar interactions from remote protons are efficiently suppressed in the presence of the strong one-bond dipolar couplings due to the dipolar truncation effect.
Even though the dipolar recoupling RNnν symmetry sequences reintroduce the chemical shifit anisotropy interactions of the irradiated protons, the recoupled 1H CSA interactions only result in a slight increase of the central peak while the dipolar splitting doesn't change at all (see Figure S5). We note that 1H CSA effect could be efficiently suppressed in an alternative approach, by a modified SLF method, the proton-detected local field (PDLF) approach.73
Accurate rf field calibration is required for R-type symmetry sequences due to the repeated “reverse” operations of the individual elements of the R blocks, and the experimental precision would be influenced by the mismatch of the rf field strength (see Figure S6 in the Supporting Information). When the phase shift (2νπ/N) between the pulse pairs is close to 180 degrees, the influence of the rf-field mismatch error is expect to be compensated by the neighboring pairs, which is especially pronounced in sequences with high symmetry number ratio of N/n, making them the least sensitive to experimental imperfections. In practice, the rf field strength is optimized directly on the sample under investigation, by finding the “zero” point when the π pulse duration is set to a fixed value dictated by the particular R-type symmetry, ντR/N.
It is also important to consider the effect of rf field inhomogeneity on dipolar lineshapes. The inverse operation by R-type element usually requires high rf field homogeneity of NMR probe, otherwise rendering the dipolar measurements inaccurate (see Figure S7). The simulations indicate that the rf inhomogeneity has the most pronounced effect on the non-γ-encoded R414 symmetry sequence, which otherwise would be the most advantageous recoupling scheme due to its highest scaling factor for the recoupling of heteronuclear dipolar interaction. The manifestation of the rf field inhomogeneity is an increase in the intensity of the central peak and a broadening of the dipolar spiltting, which become more pronounced with the increasing rf field inhomogeneity. Therefore, R414 symmetry sequence is unsuitable for accurate dipolar coupling measurement in MAS probes possessing low rf field homogeneity (in practice, 85% or lower). The simulations also reveal the fact that for γ-encoded RNnν symmetry sequences, the stronger the rf field (NωR/2n) is, the weaker is the effect from rf field inhomogeneity. In practical terms, the above implies that one has to consider the tradeoff between the scaling factor and the rf field inhomogeneity of a particular probe. Generally, it is most advantageous to select RNnν symmetry sequences with higher N/2n ratio for determining accurately 1H-13C/1H-15N heteronuclear dipolar coupling constants, as long as the required rf field strength (NωR/2n) can be attained in the fast MAS probe available to the experimentalist.
Heteronuclear Dipolar Recoupling by R-Symmetry Sequences at Fast MAS Frequencies: Experiments on Alanine and NAV
Guided by the results of numerical simulations, we conducted R-symmetry based 1H-13C dipolar recoupling experiments on a sample of U-13C, 15N-labeled L-alanine, spun at the MAS frequency of 40 kHz. Figure 2 shows the 1H-13C dipolar lineshapes for CH recorded with (a) R2251, (b) R1841, (c) R2452, (d) R2243, (e) R1431, (f) R2653, (g) R2854, and (h) R1632 symmetry sequences, respectively. The 1H-13C dipolar coupling constansts were extracted from numerical simulations of each lineshape; the simulated lineshapes are displayed as dotted lines in Figure 2. Similarly, 1H-13C dipolar coupling constants for the CH3 group can be extracted by fitting the corresponding dipolar line shapes recoupled by the various RNnν symmetry sequences (see Figure S8 in the Supporting Information). Several important conclusions can be drawn on the basis of the results.
Figure 2.
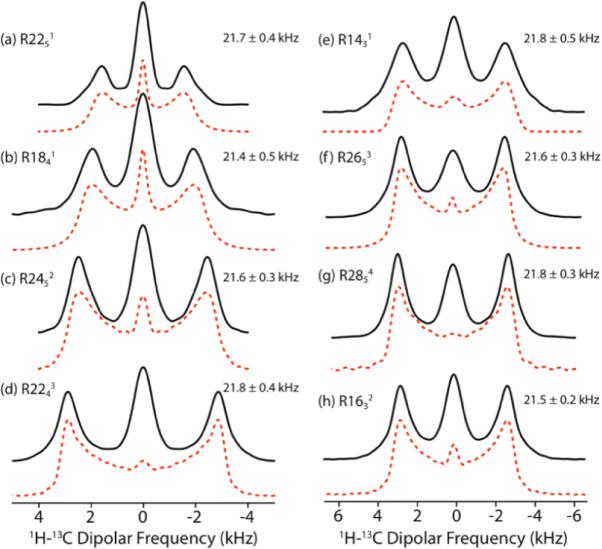
Black solid lines: experimental 1H-13C dipolar lineshapes of the CH groups in U-13C,15N-alanine recorded at the MAS frequency of 40 kHz using (a) R2251, (b) R1841, (c) R2452, (d) R2243, (e) R1431, (f) R2653, (g) R2854, and (h) R1632 symmetry sequences. During the dipolar evolution period t1, the 1H rf field irradiation strength is 88, 90, 96, 110, 93.3, 104, 112, and 106.7 kHz for (a)–(h), respectively. Red dashed lines: simulated best-fit 1H-13C dipolar lineshapes. The dipolar coupling constants extracted from the experimental lineshapes are indicated next to each spectrum.
First, the dipolar coupling constants derived from the different R-symmetry sequences are in excellent agreement within each type of carbon environment, CH and CH3. As anticipated, the dipolar couplings for the CH groups correspond to the rigid limit case, with ωD = 21.7 ± 0.4 kHz and rCH = 1.105 ± 0.007 Å, in excellent agreement with the X-ray structure (rCH = 1.095± 0.004)74.
Second, the dipolar couplings for the CH3 group are smaller (ωD = 7.6 ± 0.2 kHz) due to dynamic averaging caused by a three-site hop exhibited by the methyl group. The reorientation of the H-C dipolar vectors due to fast rotation would result in reduced dipolar coupling, which can be expressed as
| (1) |
where θ denotes the angle between the H-C dipolar vector and the rotational axis. Considering the three-site hopping motion of –CH3, the expression for the H-C-H angle can be readily derived:
| (2) |
According to the motionally averaged H-C dipolar coupling measured in the –CH3 group and assumping the rigid H-C dipolar coupling to be the same as for the –HC group, the calculated H-C-H angle φ is 101.6 ± 2°, which is close to the value of 108.5 ± 0.3° in the reported crystall structure75.
Third, the effective scaling factors observed in each experiment follow those predicted by simulations: generally, for γ-encoded heteronuclear dipolar recoupling using symmetry sequences, the higher the ratio of the rf field to the spinning frequency (ω1H/ωR), the larger the scaling factor. Even though the non-γ-encoded R414 sequence exhibits the highest scaling factor (see Figure S2 in the Supporting Information), there exists an intense central peak in the dipolar line shape, which arises from the rf field inhomogeneity, as discussed above,. Fourth, the simulated spectra for a four-spin model are consistent with the experimental results, recorded with various R symmetry sequences. This indicates that this minimal model is sufficient for capturing the salient spectral features. As discussed above, the central peaks in the experimental dipolar patterns are contributions from rf field inhomogeneity, 1H chemical shift anisotropy, and the relaxation due to the applied rf field irradiation. Such central peaks are commonly seen in dipolar recoupling experiments17,38, and they introduce minor (5–10%) uncertainties in the derived dipolar coupling constants. For all simulations in the current report, the relaxation times were not taken into account.
We also examined the performance of the R-symmetry based sequences for 1H-15N dipolar recoupling under fast MAS conditions (ωr = 40 kHz) using [15N]-N-acetyl-valine (NAV) (see Figure S9 in the Supporting Information). Similar to the 1H-13C dipolar recoupling experiments, each R-type sequence exhibits a different scaling factor, and among these five sequences, the R1632 scheme with rf field strength of 106.7 kHz possesses the highest scaling factor. Unlike the 1H-13C dipolar lineshapes, the 1H-15N dipolar patterns recoupled by R2251 and R1841 sequences show distortions, possibly caused by the large chemical shift anisotropy (CSA) of the amide proton and rf field inhomogeneity. This feature is also evident in the analysis of the higher-order average Hamiltonian terms containing the recoupled hetero- and homonuclear dipole-dipole interactions. These spectral distortions would result in lower precision of the dipolar measurements. Fortunately, these distortions can be suppressed or removed by choosing a suitable RNnν symmetry sequence with a higher N/2n ratio, which, in turn, determines the required ratio of the rf field to the spinning frequency (ω1H/ωR). Indeed, it can be seen that the 1H-15N dipolar patterns recoupled by R1431, R2653 and R1632 symmetry sequences (see Figure S9), suffer much less from distortions caused by rf field inhomogeneity, higher-order Hamiltonian terms and residual 1H-1H homonuclear dipolar couplings. The 1H-15N dipolar coupling constants extracted from these experiments are in the range of 9.9 ± 0.3 kHz, corresponding to rNH = 1.073 ± 0.003 Å, in excellent agreement with the expected static-limit H-N bond length. These results demonstrate that higher precision can be attained for the dipolar measurement when sequences with higher symmetry number ratio of N/n are employed, as long as the required rf field strength NωR/2n is permissible in a particular NMR instrument.
We note that in our current work, we experimentally achieved the highest scaling factor of 0.282 in the R2854 sequence (corresponding to the N/2n ratio of 2.8). This corresponds to the rf field strength of 112 kHz at MAS frequency of 40 kHz, which is almost the maximum permissible rf power in our 1.8 mm triple-resonance MAS probe. To the best of our knowledge, many of the modern commercial fast-MAS probes can tolerate much higher 1H rf field strengths, approximately 200 kHz and possibly even 250 kHz. Under those rf conditions, one can implement other R-symmetry sequences with higher N/2n ratios, including γ-encoded symmetry sequences R1423, R1825, and R1013 that require rf field strengths of 140, 180 and 200 kHz, respectively, when ωR = 40 kHz. R-symmetry sequences with higher N/2n are beneficial not only because they fully suppress spectral distortions arising from rf field inhomogeneity, higher-order Hamiltonian terms and from 1H-1H homonuclear dipolar couplings, but also due to their larger scaling factors, i.e. Ksc (R1423) = 0.295, and Ksc (R1013) = 0.307. Generally, in order to determine accurately 1H-13C/1H-15N heteronuclear dipolar couplings under fast or ultra-fast MAS conditions by γ-encoded R-type symmetry sequences, RNnv schemes with the ratio of N/2n > 2.5 are preferred.
Heteronuclear Dipolar Recoupling by R-Symmetry Sequences at Fast MAS: Applications to Proteins and Protein Assemblies
The fast MAS dipolar recoupling methods described above are particularly advantageous for structural and dynamics characterization of uniformly and sparsely enriched proteins and protein assemblies. We have examined the performance of the R-symmetry based recoupling sequences under fast MAS conditions for the recoupling of 1H-15N and 1H-13C dipolar interactions in U-13C,15N-Tyr enriched C-terminal domain (CTD) of HIV-1 CA capsid protein and sparsely-13C/U-15N labeled 89-residue CAP-Gly domain of dynactin.
The C-terminal domain of HIV-1 CA protein contains three tyrosine residues, Y145, Y164, and Y169. Y164 and Y169 are located in α-helices, while Y145 occupies a pivotal position in the hinge region connecting the C- and N-terminal domains of CA. The hinge region is conformationally flexible,76–77 and this conformational flexibility might in turn determine the intermolecular packing of the full-length CA proteins in the assembled state, dictating their assembly into different morphologies (i.e., conical, tubular, and spherical). It is therefore of interest to address the structure and internal dynamics on different timescales of Y145 in CTD as well as in the full-length assembled CA protein of different morphologies.
In Figure 3(a), a 2D 1H-13C DIPSHIFT spectrum of HIV-1 CTD, recorded at the MAS frequency of 40 kHz, is shown. During the t1 evolution period, R1632 symmetry scheme with a rf field strength of 106.7 kHz was used for reintroducing the 1H-13C dipolar couplings under fast MAS conditions. Y164 and Y169 residues yield two well-resolved 13Cα peaks. The Y145 Cα peak is missing, which can be due to dynamics on micro- to millisecond timescales interfering with either cross polarization or dipolar recoupling. The 13Cα chemical shifts for Y164 (59.0 ppm) and Y169 (63.1 ppm) are in excellent agreement with solution NMR shifts (59.495 ppm and 63.234 ppm for Y164 and Y169, respectively)78. In Figure 3(b), the experimental (solid lines) and best-fit simulated (dashed lines) 1H-13Cα dipolar patterns for Y164 and Y169 are presented. The experimental 1H-13Cα dipolar lineshapes were extracted along the 13C isotropic chemical shift of each residue. Due to the high rf field homogeneity of ~90% in our 1.8 mm triple-resonance MAS probe (see Figure S10 in the Supporting Information), the detected dipolar line shapes were barely affected by rf field inhomogeneity, especially for the R-type symmetry sequences with higher ratio of N/2n (see Figure S7). Therefore, the rf field imperfection was not taken into account for any of the protein line shape fittings. Since the dipolar splitting is determined to the largest extent by the size of the dipolar coupling constants, the best-fit line shape can be readily derived, using the minimal least-square error criterion, χ2, as described in the Experiments and Methods section, or even by visual inspection of the line shapes. Dipolar coupling constant (ωD) and Lorentzian line broadening (LB) are the only two variable parameters. The central part is excluded from the curve fitting when minimizing χ2, due to its complex dependence on multiple factors. The best-fit spectra shown by the dashed curves in Figure 3, correspond to the minimum χ2. The fit parameters as well as the uncertainty errors are derived using the SIMPLEX method, as shown in Figure S11 of the Supporting Information depicting a χ2 contour plot for the 1H-13C dipolar lineshape fitting of Tyr-164, from which the best fit values of ωD = 22.8 ± 0.3 kHz and LB = 573 ± 112 Hz are extracted corresponding to the minimum χ2 of 0.67. As anticipated, Y164 and Y169 exhibit 1H-13Cα dipolar couplings of 22.8 ± 0.3 and 22.5 ± 0.2 kHz, respectively, which is close to the rigid limit value of 22.8 kHz.
Figure 3.
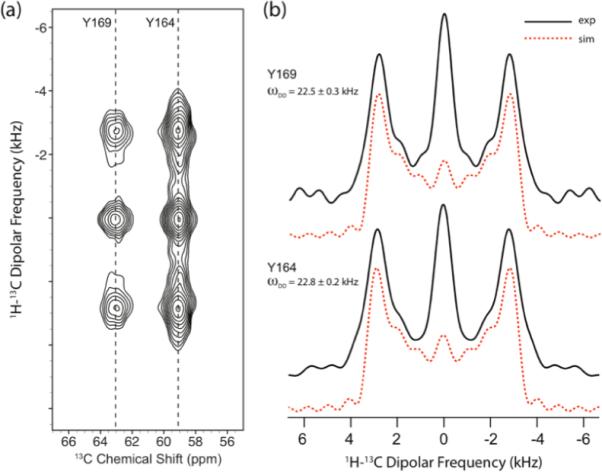
(a) 2D 1H-13C R1632–based DIPSHIFT spectrum of [U-13C, 15N]-Tyr HIV-1 C-terminal domain (CTD) of CA protein recorded at the MAS frequency of 40 kHz. The pulse sequence for this spectrum is shown in Figure 1(a). (b) Solid lines: experimental 1H-13Cα dipolar lineshapes extracted along the ω1 dimension of the 2D DIPSHIFT spectra. Dashed lines: best-fit simulated 1H-13Cα dipolar lineshapes. The experimental and simulated dipolar lineshapes correspond to the two tyrosine residues, Y169 and Y164, and the resulting dipolar coupling constants are 22.5 ± 0.3 kHz, and 22.8 ± 0.2 kHz, respectively.
We have also carried out 1H-15N R1632-based DIPSHIFT measurements in HIV-1 CTD protein, and the results are shown in Figure 4. In this experiment, the peak for Y145 is present, and the 15N chemical shift is 121.1 ppm. The chemical shifts for Y164 (125.2 ppm) and Y169 (118.3 ppm) agree to within ± 1.0 ppm with the corresponding solution NMR shifts (124.243 ppm for Y164 and 117.738 for Y169). This small discrepancy between the 15N solution and solid-state chemical shifts is consistent with multiple previous studies of other proteins.79–81 The 1H-15N dipolar lineshapes were extracted along the 15N isotropic chemical shift of each residue, as shown by the solid lines in Figure 4(b). The best-fit simulated lineshapes are shown by the dashed lines in Figure 4(b). The 1H-15N dipolar couplings obtained from the numerical simulations are 10.1 ± 0.2 kHz for Y145, 10.4 ± 0.2 kHz for Y164, and 10.5 ± 0.2 kHz for Y169. It can be seen that the 1H-15N dipolar couplings for the three tyrosines are close to the rigid-limit value of 11.34 kHz, even though Y145 has a slightly reduced value.
Figure 4.
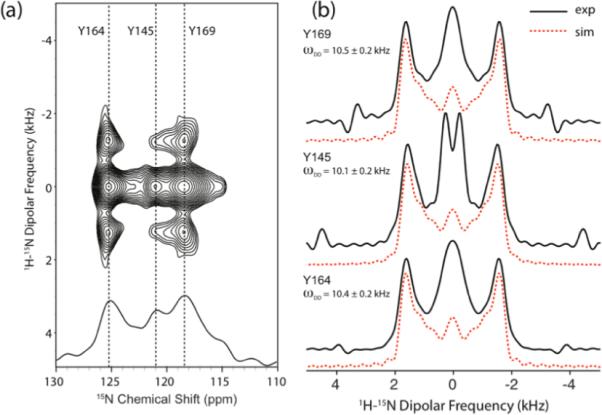
(a) 2D 1H-15N R1632–based DIPSHIFT spectrum of [U-13C, 15N]-Tyr HIV-1 C-terminal domain (CTD) of CA protein recorded at the MAS frequency of 40 kHz. The pulse sequence for this spectrum is shown in Figure 1(a). (b) Solid lines: experimental 1H-15N dipolar lineshapes extracted along the ω1 dimension of the 2D DIPSHIFT spectra. Dashed lines: best-fit simulated 1H-15N dipolar lineshapes. The experimental and simulated dipolar lineshapes correspond to the three tyrosine residues, Y169, Y164, and Y145, and the resulting dipolar couplings are 10.5 ± 0.2 kHz, 10.4 ± 0.2 kHz, and 10.1 ± 0.2 kHz, respectively.
Both 1H-13C and 1H-15N dipolar couplings are sensitive to motions occurring on timescales of 10−9~10−6 s. The 1H-15N DIPSHIFT measurement did not reveal significant averaging of the corresponding dipolar interaction for Y145, indicating that the backbone nitrogen is rigid on the timescales faster than ~10−6 s, and coupled with the observations of the conformational flexibility of the hinge region by X-ray crystallography76–77 our solid-state NMR results suggest that motions if indeed present have to occur on timescales slower than 10−6 s. Detailed dynamics studies of CA protein on multiple timescales are currently in progress in our laboratory.
Figure 5 demonstrates the site-resolved measurement of the 1H-13C dipolar couplings through a 3D DIPSHIFT/SPECIFIC-CP experiment in the sparsely-13C/U-15N labeled 89-residue CAP-Gly domain of dynactin, performed at the MAS frequency of 40 kHz. Resonance assignments for CAP-Gly were reported by us previously64. The pulse sequence for this experiment is shown in Figure 1(c). γ-encoded R1632 symmetry sequence was chosen for 1H-13C dipolar recoupling during the t1 period due to its high scaling factor and low sensitivity to rf field inhomogeneity, as discussed above. Subsequently, SPECIFIC-CP was employed to establish the NCA correlation after dipolar evolution. The first 2D NCA plane of the 3D DIPSHIFT spectrum is shown in Figure 4(a). 1H-13Cα dipolar lineshapes for each residue were extracted along the third dimension, and, with more than 40 peaks resolved in the NCA plane, we obtained a total of 37 dipolar patterns. Examples of 1H-13Cα dipolar lineshapes for six residues, I36, G42, T43, T54, A65, and V89, located in a terminus of a β-strand (one residue), in β-strands (two residues), and in loops (three residues), are shown in Figure 5(b). The dipolar coupling constants extracted from these lineshapes by numerical simulations, yield important dynamics information, assuming that the static-limit H-Cα dipolar couplings are invariant with the secondary structure, ωDD = 22.8 kHz.82 The internal motions with correlation times in the range between 10−9 and 10−6 s result in partial averaging of the anisotropic orientation-dependent dipolar interactions, which manifests itself in the narrowed dipolar lineshapes. For the above six residues, the dipolar couplings vary, correlating with their different mobility.
Figure 5.
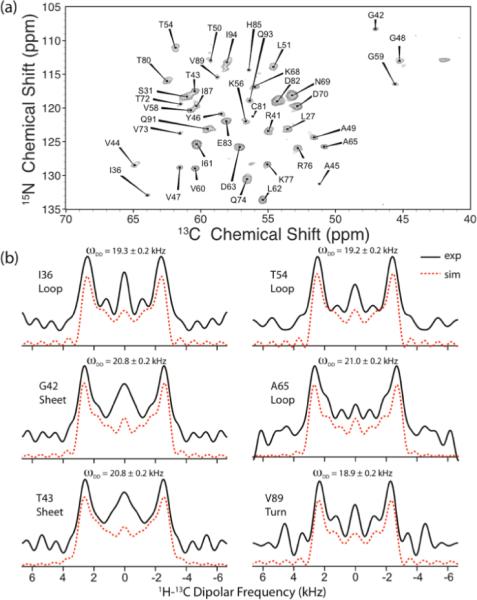
(a) The first 2D NCA plane extracted from the 3D 1H-13C R1632–based DIPSHIFT spectrum of sparsely-13C/U-15N labeled CAP-Gly domain of dynactin. The sample was spun at the MAS frequency of 40 kHz. The pulse sequence for this spectrum is shown in Figure 1(c). (b) Representative 1H-13Cα dipolar lineshapes extracted along the ω1 dimension for the following residues: I36 (loop), G42 (β-strand), T43 (β-strand). T54 (loop), A65 (loop), and V89 (terminus of a β-strand). The best-fit 1H-13Cα dipolar coupling constants are shown above the corresponding dipolar patterns.
Figure 6 shows the 1H-13Cα dipolar order parameters plotted as a function of the residue number (see Table S2 for the ωDD and the minimum χ2 values for each residue extracted from the fits). These order parameters span the range from 0.83 ± 0.01 to 0.93 ± 0.01, and if we treat the internal mobility of the backbone according to the diffusion-in-a-cone model83 described in Equation (1), the diffusion cone angles for the backbone motions of CAP-Gly would be in the range of 12.5–19.7°. The overall average H-Cα dipolar order parameter is 0.92 ± 0.01 for the observed residues in β-sheets, and 0.85 ± 0.01 for the residues in the loops and termini of β-sheets, as shown in Figure 6 with blue and red dotted lines, respectively. The corresponding H-Cα dipolar coupling constants are 21.0 ± 0.3 kHz and 19.5 ± 0.3 kHz, respectively.
Figure 6.
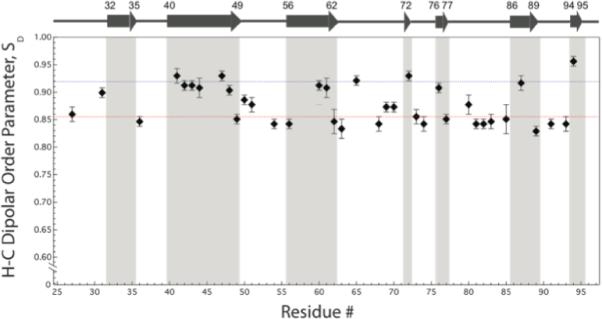
Experimental H-Cα dipolar order parameters plotted as a function of the residue number for the sparsely-13C, U-15N enriched CAP-Gly protein. The dipolar order parameters were calculated according to the static limit H-C dipolar coupling constant of 22.8 kHz. The blue and red dotted lines correspond to the H-Cα dipolar order parameters of 0.919 and 0.854, which are the average order parameters for the residues comprising β-sheets and loops/turns, respectively.
It is important to note that for an overwhelming majority of CAP-Gly residues these dipolar parameters derived from the R1632-based DIPSHIFT experiment conducted at the MAS frequency of 40 kHz are in excellent agreement with the parameters recorded by the well-characterized protocol utilizing the R1817 sequence at the MAS frequency of 10 kHz (see Figure S12 of the Supporting Information), therefore attesting to the accuracy of the R-symmetry based experiments at fast MAS conditions.
The dynamic behavior of the individual residues in CAP-Gly domain of dynactin captured by 1H-13Cα dipolar couplings can be analysed in the context of its secondary structure. As shown in Figure 7, the individual residues comprising β-sheets exhibit higher dipolar order parameters than the residues located in loops or turns, which generally show lower order parameters presumably due to their mobility on the nano- to microsecond timescales. An interesting exception is A65, which is located in a loop but exhibits a β-sheet-like order parameter as observed in both 40- and 10- kHz DIPSHIFT experiments. The origin of a higher dipolar order parameter for this loop residue needs to be explored in the future. The average reduction in the order parameters for the loop and turn regions of CAP-Gly (regions encompassing A49-K56, L62-T72, K77-H85, V89-Q93) is ca. 1,5 kHz compared to the rigid limit values. It should be noted that the average H-Cα dipolar order parameters vary in different protein systems, reflecting the extent of the overall backbone mobility of a particular protein. For instance, Lorieau, Day, and McDermott reported the average H-Cα dipolar order parameter of 0.99 ± 0.04 in the coat protein of Pf1 bacteriophage.83 The lower average order parameter value of 0.89 ± 0.01 for CAP-Gly that we observed in the current study is not surprising in light of the higher content of the loop/turn regions. Future studies of a broader range of proteins would be of interest to pursue in order to gain systematic understanding of the internal backbone mobility as a function of the secondary and tertiary structure.
Figure 7.
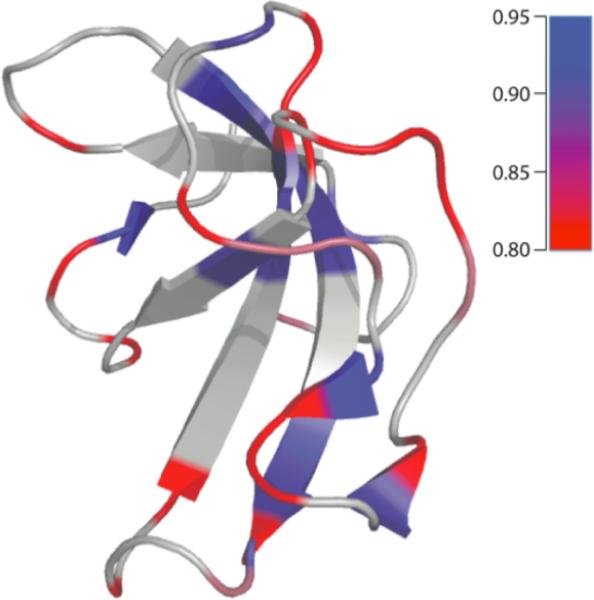
The dynamic behavior of the individual residues in CAP-Gly domain of dynactin on nanosecond- to microsecond timescales mapped onto its tertiary structure, as captured by the experimental 1H-13Cα dipolar order parameters, SD, measured with the R1632 symetry sequence at a fast MAS frequency of 40 kHz. The color scheme is: blue, SD = 0.95, red, SD = 0.80, with continuous interpolation for the values between these limiting order parameters. Shown in grey are residues for which dipolar lineshapes could not be extracted from the spectra due to the congestion of the 2D NCA plane.
CONCLUSIONS
In summary, a series of R-type symmetry sequences have been discussed for the measurements of heteronuclear (1H-15N/1H-13C) dipolar interactions suitable for both fully protonated and deuterated systems under fast MAS frequencies. These symmetry sequences display excellent selectivity for recoupling of the first-order heteronuclear dipolar average Hamiltonian terms while suppressing the homonuclear dipolar Hamiltonian to zero. In order to suppress the distortions in the dipolar patterns arising from additional spin interactions and experimental hardware imperfections, symmetry sequences with N/2n ratio greater than 2.5 should be used, and these sequences were found to yield more reliable dipolar lineshapes and dipolar coupling constants. The high spectral resolution attained in the multidimensional fast-MAS experiments presented in this report, makes this methodology particularly well suited for studies of uniformly, extensively and sparsely enriched proteins and protein assemblies, as we have demonstrated for the CAP-Gly domain of human dynactin and HIV-1 C-terminal domain of CA capsid protein. The measurements revealed that the 1H-15N and 1H-13C dipolar coupling constants for the Tyr residues in the CA protein do not exhibit any significant reduction with respect to rigid limit values, indicating that the backbone of these residues is rigid on timescales faster than a microsecond. On the other hand, the 1H-13C dipolar coupling constants in CAP-Gly vary considerably along the backbone, with residues comprising loops and turns exhibiting reduced dipolar couplings (and dipolar order parameters) and hence higher mobility on timescales of nano- to microseconds than residues located in β-sheets.
We expect that the approach reported here will become indispensible for structural and dynamics characterization of a wide range of systems, from macromolecular systems to organic solids, and will find many interesting applications in chemistry, biology, materials science and other disciplines.
Supplementary Material
SYNOPSIS.
Solid-state NMR approach is presented for heteronuclear dipolar recoupling under fast magic angle spinning (MAS) conditions, by R-type symmetry sequences. The experiments reported are well suited for determination of heteronuclear (1H-13C/1H-15N) dipolar couplings, which contain critical structural and dynamics information in biological and organic systems. Our approach is anticipated to find many interesting applications in chemistry, biology, materials science and other disciplines.
ACKNOWLEDGMENT
This work was supported by the National Institutes of Health (NIH Grants P50GM082251 and R01GM085306-01A1 from NIGMS, and P20RR015588 from NCRR) and is a contribution from the Pittsburgh Center for HIV Protein Interactions. We thank Ago Samoson for the 1.8 mm triple-resonance MAS probe, Malcolm Levitt for the Mathematica package of symmetry sequences, Si Yan for preparing the CAP-Gly protein sample, and Yun Han for preparing the HIV-1 CTD CA capsid protein sample.
Footnotes
SUPPORTING INFORMATION Tables with i) summary of RNnv symmetry sequences suitable for heteronuclear dipolar recoupling under fast or ultra-fast MAS conditions, and ii) 1H-13Cα dipolar coupling constants for each residue in CAP-Gly domain of dynactin, extracted from the 3D R1632 DIPSHIFT experiment conduted at 40 kHz; Figures illustrating i) RNnv symmetry sequences, ii) effective scaling factors for γ-encoded symmetry sequences plotted as a function of the symmetry numbers, iii) simulated H-N and H-C dipolar lineshapes recoupled by various symmetry sequences at fast MAS frequency, iv) simulations of the effect of remote protons on H-N dipolar lineshapes, v) simulations of the effect of the 1H CSA on H-N dipolar lineshapes, vi) simulations of the effect of rf field mismatch on the accuracy of the dipolar measurement, vii) simulations of the effect of rf field inhomogeneity on H-N dipolar lineshapes, viii) experimental 1H-13C dipolar lineshapes of CH3 group of U-13C,15N -alanine recorded by various symmetry sequences at MAS frequency of 40 kHz, ix) 1H-15N dipolar lineshapes of U-13C,15N-N-Acetyl-valine recorded by various symmetry sequences at MAS frequency of 40 kHz, x) the rf field homogeneity profile of our 1.8 mm fast-MAS probe, xi) an example of contour plot for H-C dipolar fitting of Y164 in HIV-1 CA protein, xii) the comparison of H-C dipolar order parameters in CAP-Gly recorded by R1632 sequence at fast MAS frequency of 40 kHz and by R1817 sequence at low MAS frequency of 10 kHz. This material is available free of charge via the Internet at http://pubs.acs.org.
REFERENCES
- (1).Andrew ER, Bradbury A, Eades RG. Nature. 1959;183:1802–1803. [Google Scholar]
- (2).Lowe IJ. Phys. Rev. Lett. 1959;2:285–287. [Google Scholar]
- (3).McDermott AE. Curr. Opin. Struct. Biol. 2004;14:554–561. doi: 10.1016/j.sbi.2004.09.007. [DOI] [PubMed] [Google Scholar]
- (4).Hong M, Gross JD, Griffin RG. J. Phys. Chem. B. 1997;101:5869–5874. [Google Scholar]
- (5).Schmidt-Rohr K, Clauss J, Spiess HW. Macromolecules. 1992;25:3273–3277. [Google Scholar]
- (6).Zumbulyadis N. Phys. Rev. B. 1986;33:6495–6496. doi: 10.1103/physrevb.33.6495. [DOI] [PubMed] [Google Scholar]
- (7).Tekely P, Nicole D, Brondeau J, Delpuech JJ. J. Phys. Chem. 1986;90:5608–5611. [Google Scholar]
- (8).Gullion T, Schaefer J. J. Magn. Reson. 1989;81:196–200. [Google Scholar]
- (9).Tycko R, Dabbagh G. Chem. Phys. Lett. 1990;173:461–465. [Google Scholar]
- (10).Gullion T, Vega S. Chem. Phys. Lett. 1992;194:423–428. [Google Scholar]
- (11).Bennett AE, Ok JH, Griffin RG, Vega S. J. Chem. Phys. 1992;96:8624–8627. [Google Scholar]
- (12).Bennett AE, Weliky DP, Tycko R. J. Am. Chem. Soc. 1998;120:4897–4898. [Google Scholar]
- (13).Verel R, Ernst M, Meier BH. J. Magn. Reson. 2001;150:81–99. doi: 10.1006/jmre.2001.2310. [DOI] [PubMed] [Google Scholar]
- (14).Ernst M, Bush S, Kolbert AC, Pines A. J. Chem. Phys. 1996;105:3387–3397. [Google Scholar]
- (15).Schnell I. Prog. Nucl. Magn. Reson. Spectrosc. 2004;45:145–207. [Google Scholar]
- (16).Nielsen A, Bjerring M, Nielsen J, Nielsen N. J. Chem. Phys. 2009;131:025101. doi: 10.1063/1.3157737. [DOI] [PubMed] [Google Scholar]
- (17).Hou G, Paramasivam S, Byeon IJ, Gronenborn AM, Polenova T. Phys. Chem. Chem. Phys. 2010;12:14873–14883. doi: 10.1039/c0cp00795a. [DOI] [PMC free article] [PubMed] [Google Scholar]
- (18).Chan JCC, Tycko R. J. Chem. Phys. 2003;118:8378–8389. [Google Scholar]
- (19).Duma L, Abergel D, Ferrage F, Pelupessy P, Tekely P, Bodenhausen G. Chem. Phys. Chem. 2008;9:1104–1106. doi: 10.1002/cphc.200800053. [DOI] [PubMed] [Google Scholar]
- (20).Zhao X, Eden M, Levitt MH. Chem. Phys. Lett. 2001;342:353–361. [Google Scholar]
- (21).Levitt MH, Zhao X, Sudmeier JL, Bachovchin WW. J. Am. Chem. Soc. 2001;123:11097–11098. doi: 10.1021/ja016328p. [DOI] [PubMed] [Google Scholar]
- (22).Fu RQ, Smith SA, Bodenhausen G. Chem. Phys. Lett. 1997;272:361–369. [Google Scholar]
- (23).Wei YF, Lee DK, McDermott AE, Ramamoorthy A. J. Magn. Reson. 2002;158:23–35. doi: 10.1016/s1090-7807(02)00056-3. [DOI] [PubMed] [Google Scholar]
- (24).van Rossum BJ, de Groot CP, Ladizhansky V, Vega S, de Groot HJM. J. Am. Chem. Soc. 2000;122:3465–3472. [Google Scholar]
- (25).Bayro M, Ramachandran R, Caporini M, Eddy M, Griffin R. J. Chem. Phys. 2008;128:052321. doi: 10.1063/1.2834736. [DOI] [PubMed] [Google Scholar]
- (26).Chou F, Huang S, Chan JCC. J. Magn. Reson. 2009;197:96–99. doi: 10.1016/j.jmr.2008.11.013. [DOI] [PubMed] [Google Scholar]
- (27).Lewandowski JR, De Paepe G, Eddy M, Griffin R. J. Am. Chem. Soc. 2009;131:5769–5776. doi: 10.1021/ja806578y. [DOI] [PMC free article] [PubMed] [Google Scholar]
- (28).Lewandowski JR, De Paepe G, Griffin R. J. Am. Chem. Soc. 2007;129:728–729. doi: 10.1021/ja0650394. [DOI] [PMC free article] [PubMed] [Google Scholar]
- (29).Samoson A, Tuherm T, Gan Z. Solid State Nucl. Magn. Reson. 2001;20:130–136. doi: 10.1006/snmr.2001.0037. [DOI] [PubMed] [Google Scholar]
- (30).Samoson A, Tuherm T, Past J, Reinhold A, Anupold T, Heinmaa N. New Tech. Solid-State NMR. 2005;246:15–31. doi: 10.1007/b98647. [DOI] [PubMed] [Google Scholar]
- (31).Reif B, Jaroniec CP, Rienstra CM, Hohwy M, Griffin RG. J. Magn. Reson. 2001;151:320–327. doi: 10.1006/jmre.2001.2354. [DOI] [PubMed] [Google Scholar]
- (32).Zhou D, Rienstra C. Angew. Chem. Int. Ed. 2008;47:7328–7331. doi: 10.1002/anie.200802108. [DOI] [PMC free article] [PubMed] [Google Scholar]
- (33).Reif B, Griffin RG. J. Magn. Reson. 2003;160:78–83. doi: 10.1016/s1090-7807(02)00035-6. [DOI] [PubMed] [Google Scholar]
- (34).Ishii Y, Yesinowski JP, Tycko R. J. Am. Chem. Soc. 2001;123:2921–2922. doi: 10.1021/ja015505j. [DOI] [PubMed] [Google Scholar]
- (35).Ishii Y, Tycko R. J. Magn. Reson. 2000;142:199–204. doi: 10.1006/jmre.1999.1976. [DOI] [PubMed] [Google Scholar]
- (36).Zhou DH, Shah G, Mullen C, Sandoz D, Rienstra CM. Angew. Chem. Int. Ed. 2009;48:1253–1256. doi: 10.1002/anie.200801029. [DOI] [PMC free article] [PubMed] [Google Scholar]
- (37).McDermott A, Polenova T. Curr. Opin. Struct. Biol. 2007;17:617–622. doi: 10.1016/j.sbi.2007.10.001. [DOI] [PubMed] [Google Scholar]
- (38).Yang J, Tasayco ML, Polenova T. J. Am. Chem. Soc. 2009;131:13690–13702. doi: 10.1021/ja9037802. [DOI] [PMC free article] [PubMed] [Google Scholar]
- (39).Thiriot DS, Nevzorov AA, Zagyanskiy L, Wu CH, Opella SJ. J. Mol. Biol. 2004;341:869–879. doi: 10.1016/j.jmb.2004.06.038. [DOI] [PubMed] [Google Scholar]
- (40).Tycko R. Prog. Nucl. Mag. Reson. Spectrosc. 2003;42:53–68. [Google Scholar]
- (41).Andronesi OC, Pfeifer JR, Al-Momani L, Ozdirekcan S, Rijkers DT, Angerstein B, Luca S, Koert U, Killian JA, Baldus M. J. Biomol. NMR. 2004;30:253–265. doi: 10.1007/s10858-004-3452-3. [DOI] [PubMed] [Google Scholar]
- (42).Han Y, Ahn J, Concel J, Byeon IJ, Gronenborn AM, Yang J, Polenova T. J. Am. Chem. Soc. 2010;132:1976–1987. doi: 10.1021/ja908687k. [DOI] [PMC free article] [PubMed] [Google Scholar]
- (43).Brinkmann A, Kentgens APM. J. Phys. Chem. B. 2006;110:16089–16101. doi: 10.1021/jp062809p. [DOI] [PubMed] [Google Scholar]
- (44).Hu KN, Tycko R. J. Chem. Phys. 2009;131:045101. doi: 10.1063/1.3176874. [DOI] [PMC free article] [PubMed] [Google Scholar]
- (45).Lewandowski JR, De Paepe G, Eddy MT, Struppe J, Maas W, Griffin RG. J. Phys. Chem. B. 2009;113:9062–9069. doi: 10.1021/jp810280t. [DOI] [PMC free article] [PubMed] [Google Scholar]
- (46).Weingarth M, Demco DE, Bodenhausen G, Tekely P. Chem. Phys. Lett. 2009;469:342–348. [Google Scholar]
- (47).Scholz I, Huber M, Manolikas T, Meier BH, Ernst M. Chem. Phys. Lett. 2008;460:278–283. [Google Scholar]
- (48).Ishii Y. J. Chem. Phys. 2001;114:8473–8483. [Google Scholar]
- (49).Lange A, Scholz I, Manolikas T, Ernst M, Meier BH. Chem. Phys. Lett. 2009;468:100–105. [Google Scholar]
- (50).Hou G, Yan S, Sun SJ, Han Y, Byeon IJ, Ahn J, Concel J, Samoson A, Gronenborn AM, Polenova T. J. Am. Chem. Soc. 2011;133:3943–3953. doi: 10.1021/ja108650x. [DOI] [PMC free article] [PubMed] [Google Scholar]
- (51).De Paepe G, Bayro MJ, Lewandowski J, Griffin RG. J. Am. Chem. Soc. 2006;128:1776–1777. doi: 10.1021/ja0550430. [DOI] [PubMed] [Google Scholar]
- (52).Brinkmann A, Kentgens APM. J. Am. Chem. Soc. 2006;128:14758–14759. doi: 10.1021/ja065415k. [DOI] [PubMed] [Google Scholar]
- (53).Ernst M, Schanda P, Meier BH. J. Magn. Reson. 2011;210:246–259. doi: 10.1016/j.jmr.2011.03.015. [DOI] [PubMed] [Google Scholar]
- (54).Schanda P, Meier BH, Ernst M. J. Am. Chem. Soc. 2010;132:15957–15967. doi: 10.1021/ja100726a. [DOI] [PubMed] [Google Scholar]
- (55).Carravetta M, Eden M, Zhao X, Brinkmann A, Levitt MH. Chem. Phys. Lett. 2000;321:205–215. [Google Scholar]
- (56).Levitt MH. In: Encyclopedia of Nuclear Magnetic Resonance. Grant DMH, K. R, editors. Vol. 9. Wiley; Chichester: 2002. pp. 165–196. [Google Scholar]
- (57).Eden M, Levitt MH. J. Chem. Phys. 1999;111:1511–1519. [Google Scholar]
- (58).Brinkmann A, Levitt MH. J. Chem. Phys. 2001;115:357–384. [Google Scholar]
- (59).Madhu PK, Zhao X, Levitt MH. Chem. Phys. Lett. 2001;346:142–148. [Google Scholar]
- (60).Bjerring M, Nielsen NC. Chem. Phys. Lett. 2003;370:496–503. [Google Scholar]
- (61).Eden M. Chem. Phys. Lett. 2003;378:55–64. [Google Scholar]
- (62).Tycko R. J. Chem. Phys. 2007;126:064506. doi: 10.1063/1.2437194. [DOI] [PubMed] [Google Scholar]
- (63).Eden M, Lo AY. J. Magn. Reson. 2009;200:267–279. doi: 10.1016/j.jmr.2009.07.007. [DOI] [PubMed] [Google Scholar]
- (64).Sun SJ, Siglin A, Williams JC, Polenova T. J. Am. Chem. Soc. 2009;131:10113–10126. doi: 10.1021/ja902003u. [DOI] [PubMed] [Google Scholar]
- (65).Neue G, Dybowski C. Solid State NMR. 1997;7:333–336. doi: 10.1016/s0926-2040(96)01291-x. [DOI] [PubMed] [Google Scholar]
- (66).Ishii Y, Kotecha M, Wickramasinghe NP. Magn. Reson. Chem. 2007;45:S221–S230. doi: 10.1002/mrc.2151. [DOI] [PubMed] [Google Scholar]
- (67).Bak M, Rasmussen JT, Nielsen NC. J. Magn. Reson. 2000;147:296–330. doi: 10.1006/jmre.2000.2179. [DOI] [PubMed] [Google Scholar]
- (68).Deazevedo ER, Saalwachter K, Pascui O, De Souza AA, Bonagamba TJ, Reichert D. J. Chem. Phys. 2008;128:140505. doi: 10.1063/1.2831798. [DOI] [PubMed] [Google Scholar]
- (69).Munowitz MG, Griffin RG, Bodenhausen G, Huang TH. J. Am. Chem. Soc. 1981;103:2529–2533. [Google Scholar]
- (70).Hester RK, Ackerman JL, Neff BL, Waugh JS. Phys. Rev. Lett. 1976;36:1081–1083. [Google Scholar]
- (71).Metz G, Wu XL, Smith SO. J. Magn. Reson. A. 1994;110:219–227. [Google Scholar]
- (72).Baldus M, Petkova AT, Herzfeld J, Griffin RG. Mol. Phys. 1998;95:1197–1207. [Google Scholar]
- (73).Dvinskikh SV, Zimmermann H, Maliniak A, Sandstrom D. J. Magn. Reson. 2004;168:194–201. doi: 10.1016/j.jmr.2004.03.001. [DOI] [PubMed] [Google Scholar]
- (74).Destro R, Marsh RE, Bianchi R. J. Phys. Chem. 1988;92:966–973. [Google Scholar]
- (75).Lehmann MS, Koetzle TF, Hamilton WC. J. Am. Chem. Soc. 1972;94:2657–2660. doi: 10.1021/ja00763a016. [DOI] [PubMed] [Google Scholar]
- (76).Berthet-Colominas C, Monaco S, Novelli A, Sibai G, Mallet F, Cusack S. EMBO J. 1999;18:1124–1136. doi: 10.1093/emboj/18.5.1124. [DOI] [PMC free article] [PubMed] [Google Scholar]
- (77).Ternois F, Sticht J, Duquerroy S, Krausslich HG, Rey FA. Nat. Struct. Mol. Biol. 2005;12:678–682. doi: 10.1038/nsmb967. [DOI] [PubMed] [Google Scholar]
- (78).Jung J, Byeon IJL, Ahn J, Concel J, Gronenborn AM. Biomol. NMR Assign. 2010;4:21–23. doi: 10.1007/s12104-009-9198-9. [DOI] [PMC free article] [PubMed] [Google Scholar]
- (79).Marulanda D, Tasayco ML, McDermott A, Cataldi M, Arriaran V, Polenova T. J. Am. Chem. Soc. 2004;126:16608–16620. doi: 10.1021/ja0464589. [DOI] [PubMed] [Google Scholar]
- (80).Franks WT, Zhou DH, Wylie BJ, Money BG, Graesser DT, Frericks HL, Sahota G, Rienstra CM. J. Am. Chem. Soc. 2005;127:12291–12305. doi: 10.1021/ja044497e. [DOI] [PubMed] [Google Scholar]
- (81).Igumenova TI, Wand AJ, McDermott AE. J. Am. Chem. Soc. 2004;126:5323–5331. doi: 10.1021/ja030546w. [DOI] [PubMed] [Google Scholar]
- (82).Huster D, Schiller J, Arnold K. Magn. Reson. Med. 2002;48:624–632. doi: 10.1002/mrm.10272. [DOI] [PubMed] [Google Scholar]
- (83).Lorieau JL, Day LA, McDermott AE. Proc. Natl. Acad. Sci. U.S.A. 2008;105:10366–10371. doi: 10.1073/pnas.0800405105. [DOI] [PMC free article] [PubMed] [Google Scholar]
Associated Data
This section collects any data citations, data availability statements, or supplementary materials included in this article.