Although the fluctuation of fibroglandular tissue volume and percentage of breast density was slightly higher in the premenopausal group than in the postmenopausal group, the difference was not statistically significant; however, the menstrual cycle–related fluctuations in breast density may vary from woman to woman.
Abstract
Purpose:
To investigate the fluctuation of fibroglandular tissue volume (FV) and percentage of breast density (PD) during the menstrual cycle and compare with postmenopausal women by using three-dimensional magnetic resonance (MR)–based segmentation methods.
Materials and Methods:
This study was approved by the Institutional Review Board and was HIPAA compliant. Written informed consent was obtained. Thirty healthy female subjects, 24 premenopausal and six postmenopausal, were recruited. All subjects underwent MR imaging examination each week for 4 consecutive weeks. The breast volume (BV), FV, and PD were measured by two operators to evaluate interoperator variation. The fluctuation of each parameter measured over the course of the four examinations was evaluated on the basis of the coefficient of variation (CV).
Results:
The results from two operators showed a high Pearson correlation for BV (R2 = 0.99), FV (R2 = 0.98), and PD (R2 = 0.96). The interoperator variation was 3% for BV and around 5%–6% for FV and PD. In the respective premenopausal and postmenopausal groups, the mean CV was 5.0% and 5.6% for BV, 7.6% and 4.2% for FV, and 7.1% and 6.0% for PD. The difference between premenopausal and postmenopausal groups was not significant (all P values > .05).
Conclusion:
The fluctuation of breast density measured at MR imaging during a menstrual cycle was around 7%. The results may help the design and interpretation of future studies by using the change of breast density as a surrogate marker to evaluate the efficacy of hormone-modifying drugs for cancer treatment or cancer prevention.
© RSNA, 2011
Supplemental material: http://radiology.rsna.org/lookup/suppl/doi:10.1148/radiol.11110506/-/DC1
Introduction
Breast tissues are known to respond to hormonal fluctuation and show changes during the menstrual cycle (1). Differences in the histologic characteristics of breast tissues between the follicular and luteal phases have been reported (1–3). The follicular phase is mainly characterized by a dense and cellular stroma without active mammary glandular secretion. The luteal phase shows pronounced stromal edema, as well as extensive basal cell vacuolization, enlargement of ductal lumen with active glandular secretion, and venous congestion (2,3). These histologic differences may account for the changes of perfusion, parenchymal structure, and water content observed in imaging studies.
Mammographic density has been correlated with proliferative activity of breast cells (4). Studies with self-reported dates of menstrual bleeding have suggested that mammographic density is slightly greater in the luteal than the follicular phase of the menstrual cycle (5,6). Mammograms obtained in the luteal phase of the menstrual cycle may appear denser and may lead to a false-negative result at examination in the detection of breast cancer (5,6). However, the evidence is not strong enough to adjust the scheduling of screening mammography on the basis of the menstrual cycle.
In contrast, the effect of breast density on the diagnostic accuracy of magnetic resonance (MR) imaging is more established. It has been shown that the background tissue enhancements are lower in the follicular than in the luteal phase, and screening MR imaging is recommended to be performed during the follicular phase. Several studies have reported changes in breast tissue at MR imaging during a menstrual cycle (7–16), including water and fat content (8), parenchymal enhancement (9,10,13,15), elasticity (11), water diffusion (12), breast volume (BV), and fibroglandular tissue volume (FV) (7,14,16).
It has been suggested that the change of breast density may serve as a surrogate marker for predicting the efficacy of hormone-modifying drugs such as tamoxifen, raloxifene, or aromatase inhibitors (17–20), but further studies are needed to confirm this hypotheses. As the first step, factors that may affect density measurements, such as the timing during a menstrual cycle, need to be investigated. The variation of BV and FV in a menstrual cycle have been measured at MR imaging by using a small number of subjects, but the analyses did not take advantage of a well-established method for quantitative assessment (7,16). The purpose of this study was to investigate the fluctuation of FV and percentage of breast density (PD) during the menstrual cycle and compare with postmenopausal women by using three-dimensional MR-based segmentation methods.
Materials and Methods
Subjects
This study was approved by the Institutional Review Board and was Health Insurance Portability and Accountability Act compliant. Written informed consent was obtained. Thirty healthy, nonsmoking, Asian female subjects were recruited. They included 24 premenopausal (mean age, 29 years; age range, 23–48 years) and six postmenopausal (mean age, 57 years; age range, 51–61 years) women. The postmenopausal women had stopped menstruation for 2–9 years (mean, 5 years). All subjects were Asian women, and most of them were slim; the body mass index for these 30 subjects ranged narrowly from 17.2 to 25.8 kg/m2 (mean, 20.9 kg/m2 ± 2.1 [standard deviation]). All premenopausal women had regular menstrual cycles and were not pregnant at the time of this study. One premenopausal woman had a history of hormonal therapy for a lumpy sensation but had ceased the treatment 6 months prior. Another premenopausal woman had a history of lumpectomy for fibrocystic change. At the time of participation in this study, all subjects were healthy and without symptoms. None were taking contraceptive pills or receiving any hormonal therapy.
MR Imaging Acquisition
All subjects underwent breast MR imaging examination once a week for 4 consecutive weeks, for a total of four acquisitions. Because the postmenopausal women do not have a menstrual cycle, the first MR imaging was noted as MR imaging 1, and the three subsequent MR imaging studies performed weekly were noted as MR imaging 2 to MR imaging 4. For premenopausal women, MR imaging 1 was defined as the examination performed after the start of menstruation as reported by the subject. The examinations performed in the following 3 weeks were then noted in sequence as MR imaging 2, MR imaging 3, and MR imaging 4. MR imaging 1 and MR imaging 2 were more likely in the follicular phase, and MR imaging 3 and MR imaging 4 were in the luteal phase. The breast MR imaging was performed with a 1.5-T MR imager (Somatom; Siemens, Erlangen, Germany) with a four-channel dual-mode breast coil. Because the purpose of this study was only to characterize the change of breast tissue and not to diagnose breast lesions, the MR studies were performed without the injection of contrast agent. All subjects were imaged in the prone position with arms positioned down by their sides. The breasts were not stabilized or compressed during imaging. The T1-weighted images acquired by using a three-dimensional non–fat-suppressed gradient-echo pulse sequence without a parallel imaging technique were used for measurements of BV, FV, and PD. The imaging parameters were as follows: field of view, 350 mm; section thickness, 2 mm; repetition time, 11 msec; echo time, 4.7 msec; flip angle, 20°; and matrix size, 256 × 256.
Breast and Fibroglandular Tissue Segmentation
The segmentation of the breast region and the fibroglandular tissue was performed by using a computer-based algorithm (21,22) by two research assistants (F.J.L. and J.P.W., with radiologic technology and medical imaging backgrounds, both with 1 year of experience in segmenting breast MR images). To ensure consistency, they had to go through a training process by using other test data sets. The operators had to demonstrate that the measurements done on two occasions at least 3 days apart could reach less than 5% variation before they were certified to analyze cases for this study.
The superior and inferior boundaries of the breast (the beginning and ending sections) were determined by comparing the thickness of breast fat with the body fat. Nonbreast subcutaneous fat on the chest typically displays homogeneous thickness across the chest wall, whose fat-air boundary is closely parallel with the chest wall–fat boundary. Because a large area is imaged by using the surface coil, the intensity nonuniformity due to the strong bias field has to be corrected for density segmentation. We used an iterative bias field correction scheme utilizing the combination of nonparametric nonuniform intensity normalization and fuzzy c-means–based algorithms (21).
The steps in the breast segmentation sequence were as follows: (a) Perform an initial horizontal line cutting based on the posterior margin of the sternum to exclude the thoracic region. Depending on the morphology of the breast, the line might be adjusted further posteriorly, up to 2.5 cm. This was to ensure that no fibroglandular tissue was inadequately chopped off. Once a new landmark was chosen, it was used for the four breast MR images in the same subject. (b) Apply fuzzy c-means clustering and B-spline curve fitting to obtain the breast-chest boundary. (c) Perform a vertical line cutting perpendicular to the sternum in the middle to separate between the right and the left breasts. The use of the dedicated breast coil allows a wide separation between the bilateral breasts, and the medial boundary can be easily detected based on edge detection. After the breast was segmented out, the total BV was calculated. (d) Apply dynamic searching to exclude the skin along the breast boundary. (e) Apply nonparametric nonuniform intensity normalization and fuzzy c-means algorithms to correct the intensity nonuniformity for segmentation of fibroglandular tissue and fatty tissue. (f) Apply standard fuzzy c-means algorithm to classify all pixels on the image into six clusters—three as fibroglandular tissues and the other three as fatty tissues. After completing the segmentation from all two-dimensional imaging sections, FV was calculated. PD was calculated as FV/BV × 100%.
Quality Control for the Measurement of Breast Density
After the segmentation, the operators went through the images section by section and visually identified the segmentation errors. In general, several types of segmentation errors, one or in combination, might be found occasionally in a few sections of the whole set of breast MR images. These errors included fatty tissue mistakenly segmented as fibroglandular tissue because of incomplete bias field correction, inclusion of nipple, and incomplete segmentation of fibroglandular tissue because of partial volume effect. If the segmentation quality was not satisfactory, the strategies for error correction included the following: (a) further improve field inhomogeneity correction, (b) resegment breast region by using a different landmark, (c) redo nipple exclusion by using computer algorithms, (d) change local contrast, and (e) change fuzzy c-means cluster setting for segmentation. Manual correction is the very last resort when none of the computer algorithms worked, which occurred infrequently (but was not quantified).
The processing time to analyze the whole set of images for both breasts of a subject, including the corrections, was completed in 45 minutes. Last, a breast radiologist (J.H.C., with 6 years of experience in interpreting breast MR images) verified the segmentation quality case by case by using the original unsegmented images as the reference.
Statistical Analysis
The left and right breasts were analyzed separately. The Pearson correlation coefficient (r) was used to test the interoperator consistency for the measurement of BV, FV, and PD. Coefficient of variation (CV), defined as the standard deviation divided by the mean, was used to analyze the measurement variations (fluctuations) among the four MR imaging studies. A higher CV indicates a higher fluctuation among the four measurements. A two-tailed Student t test was used to test the difference in the CV measurement of BV, FV, and PD between premenopausal and postmenopausal groups and difference of PD acquired at different weeks of the menstrual cycle in premenopausal women and at 4 consecutive weeks in postmenopausal women. The association of the CV measurement with body mass index and the averaged PD was evaluated by using the Pearson correlation (strong correlation, 1 ≥ |r| ≥ 0.7; weak correlation, 0.7 > |r| ≥ 0.3; little or no correlation, |r| < 0.3). For the comparisons that yielded insignificant differences, a post hoc power analysis was performed to determine the case number needed to attain a power of 80%. With a subject allocation ratio of 1:1 between the two groups, to attain a power of 0.8 for CV of BV, FV, and PD, we would need a sample size of 308, 22, and 185 in each group, respectively. The post hoc power analysis for fluctuations with respect to body mass index revealed that the sample size should be 90 for operator 1 and 193 for operator 2.
Results
Interoperator Consistency Test
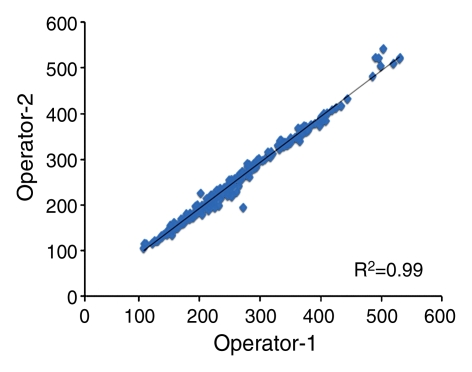
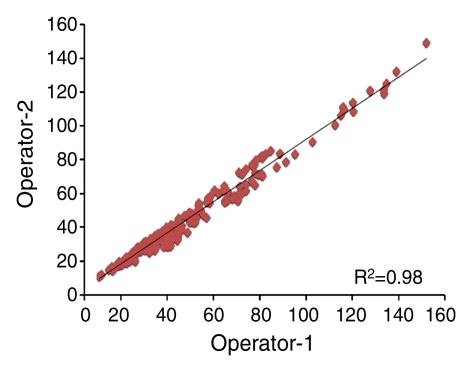
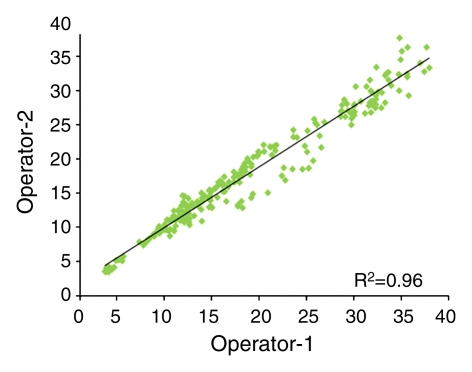
For the interoperator consistency test, each operator analyzed all 240 breasts (30 subjects × four MR imaging examinations × two breasts), and their results were compared. The results between two operators were highly correlated: R2 = 0.99 for BV, R2 = 0.98 for FV, and R2 = 0.96 for PD (Fig 1). Interoperator variation was around 3% for BV and 6% for FV and PD (Table 1). The P values for comparing measured BV, FV, and PD between the two operators were all less than .0001.
Figure 1a:
Graphs show high correlation for (a) BV, (b) FV, and (c) PD as measured by two operators.
Table 1.
Interoperator Measurement Variation between Two Operators

Note.—Data are averaged percentage variation among 60 breasts analyzed from 30 subjects. Variation for each breast was calculated as the standard deviation between the two measurements made by two operators divided by their mean, as a percentage.
Figure 1b:
Graphs show high correlation for (a) BV, (b) FV, and (c) PD as measured by two operators.
Figure 1c:
Graphs show high correlation for (a) BV, (b) FV, and (c) PD as measured by two operators.
Fluctuation of Density Measurements during a Menstrual Cycle
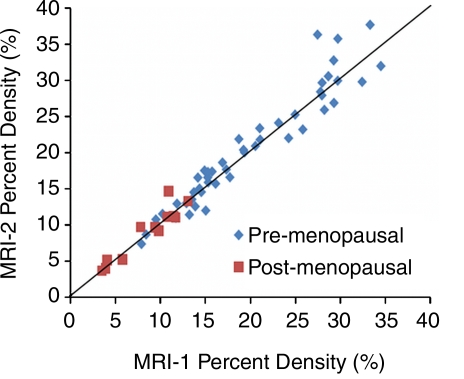
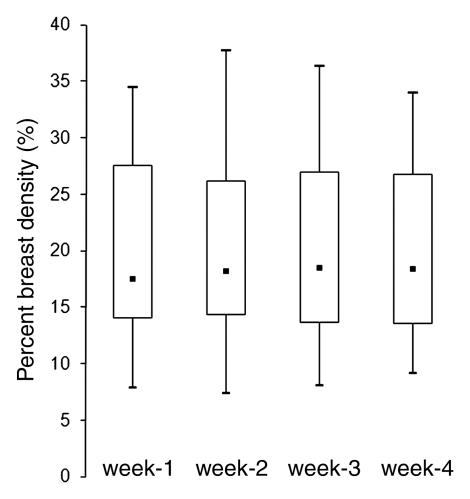
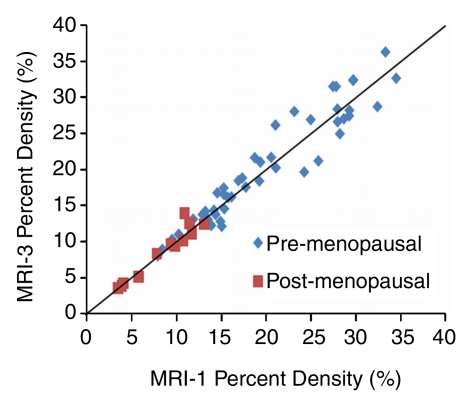
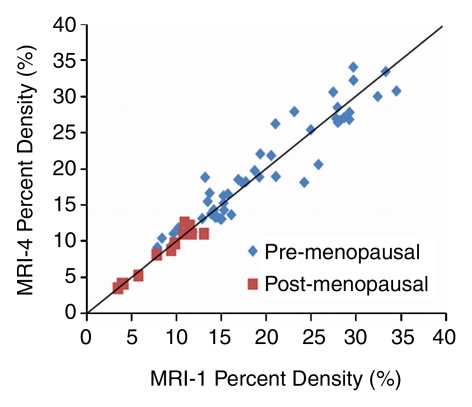
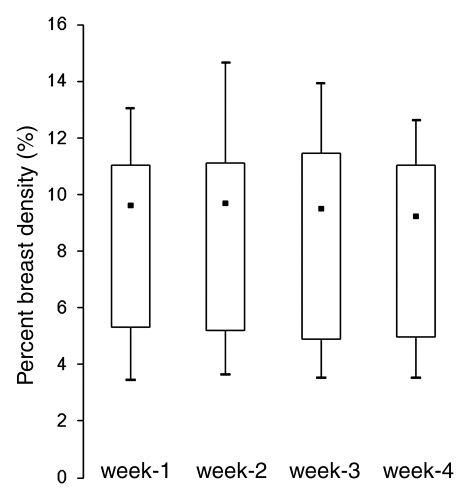
The mean CV in all 30 subjects was 5.1% for BV, 7.1% for FV, and 6.9% for PD. In the respective premenopausal and postmenopausal groups, the mean CV was 5.0% and 5.6% for BV, 7.6% and 4.2% for FV, and 7.1% and 6.0% for PD (Table 2). These fluctuation values were only slightly higher than the interoperator measurement variation. The CV of BV, FV, and PD did not show a significant difference between premenopausal and postmenopausal groups (P = .65, .06, and .40, respectively). Figure 2 shows the measured density from MR imaging 2, MR imaging 3, and MR imaging 4 compared with MR imaging 1. Figure 3 shows box plots comparing breast density acquired from week 1 to week 4 in premenopausal and postmenopausal women. All comparisons (week 1 to week 2, week 1 to week 3, week 1 to week 4) showed no significant difference (P = .67, .83, and .91, respectively, for premenopausal women and P = .74, .90, and .98, respectively, for postmenopausal women).
Table 2.
BV, FV, PD, and the Range and Mean of CV Measured from Four MR Examinations during a Menstrual Cycle
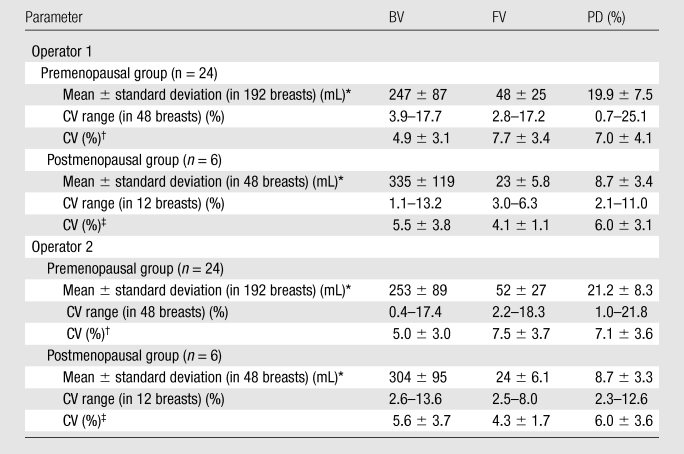
Mean ± standard deviation are calculated on the basis of all analyzed breasts from four MR imaging studies.
Data are means ± standard deviations among 48 breasts.
Data are means ± standard deviations among 12 breasts.
Figure 2a:
Graphs show measured PD from (a) MR imaging 2 (MRI-2), (b) MR imaging 3 (MRI-3), and (c) MR imaging 4 (MRI-4) compared with MR imaging 1 (MRI-1). Data are distributed along the unity line, indicating that there are no discernable systematic differences between MR imaging 2, MR imaging 3, and MR imaging 4 compared with MR imaging 1, but some deviations away from the unity line are clearly visible.
Figure 3a:
(a, b) Box plots show the comparison of PD measured from week 1 to week 4 in (a) premenopausal and (b) postmenopausal women. Bottom and top of the box = 25th and 75th percentiles, respectively. ■ = Median, whiskers = minimum and maximum. The PDs in week 2, 3, and 4 compared with week 1 are not significant (P = .67, .83, and .91, respectively, for premenopausal women and P = .74, .90, and .98, respectively, for postmenopausal women).
Figure 2b:
Graphs show measured PD from (a) MR imaging 2 (MRI-2), (b) MR imaging 3 (MRI-3), and (c) MR imaging 4 (MRI-4) compared with MR imaging 1 (MRI-1). Data are distributed along the unity line, indicating that there are no discernable systematic differences between MR imaging 2, MR imaging 3, and MR imaging 4 compared with MR imaging 1, but some deviations away from the unity line are clearly visible.
Figure 2c:
Graphs show measured PD from (a) MR imaging 2 (MRI-2), (b) MR imaging 3 (MRI-3), and (c) MR imaging 4 (MRI-4) compared with MR imaging 1 (MRI-1). Data are distributed along the unity line, indicating that there are no discernable systematic differences between MR imaging 2, MR imaging 3, and MR imaging 4 compared with MR imaging 1, but some deviations away from the unity line are clearly visible.
Figure 3b:
(a, b) Box plots show the comparison of PD measured from week 1 to week 4 in (a) premenopausal and (b) postmenopausal women. Bottom and top of the box = 25th and 75th percentiles, respectively. ■ = Median, whiskers = minimum and maximum. The PDs in week 2, 3, and 4 compared with week 1 are not significant (P = .67, .83, and .91, respectively, for premenopausal women and P = .74, .90, and .98, respectively, for postmenopausal women).
Association of Density Fluctuation with Density and Body Mass Index
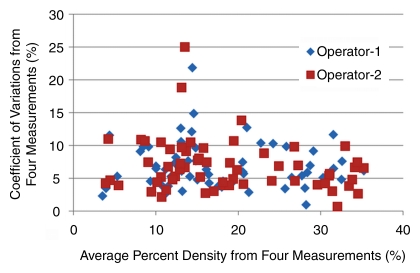
On a per-subject basis (the CVs measured from the left and the right breasts were averaged), a 10% or greater fluctuation of FV and PD was observed in several premenopausal women (seven of 24 and four of 24, respectively, by operator 1 and six of 24 and one of 24, respectively, by operator 2) and in none of the six postmenopausal women. Overall, the fluctuation was not associated with density (|r| < 0.3) (Fig 4) or body mass index (r = −0.3 for operator 1, r = −0.2 for operator 2). One extreme case example showing greater than 20% variation (with greatest amount in the late luteal phase) is illustrated in Figure 5. Figures 5 and 6 and Figures E1–E4 (online) show examples of density changes in premenopausal and postmenopausal women.
Figure 4:
Plot of CVs of the PD measured among the four MR imaging studies in one menstrual cycle with respect to the mean. The results from 60 breasts measured by two operators are shown. One subject has a high variation. The CV of both breasts analyzed by operator 2 and the right breast analyzed by operator 1 is around 20%. This case is illustrated in Figure 5.
Figure 5a:
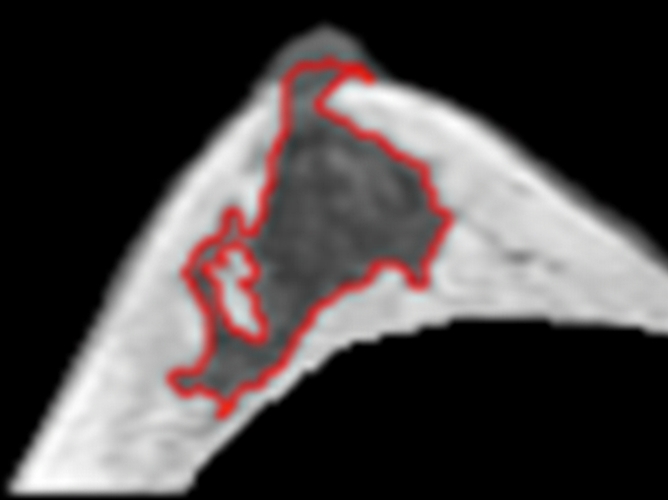
(a–d) Representative MR images from the right breast of 30-year-old subject with about 20% variation in Figure 4. Images are from one corresponding location in four MR imaging studies. FVs from (a) week 1, (b) week 2, (c) week 3 to (d) week 4 are 30, 27, 25, and 36 cm3, respectively. It is apparent that the fibroglandular tissue is increased substantially in week 4, corresponding to her late luteal phase. The corresponding PDs are 12.0%, 12.2%, 11.5%, and 16.8%, respectively. CVs for FV and PD are 16.5% and 18.9%, respectively.
Figure 6a:
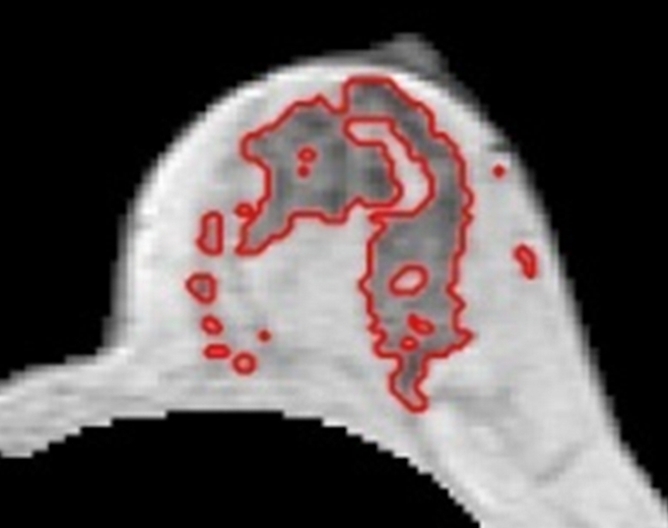
(a–d) Representative MR images in 57-year-old postmenopausal subject. Compared with the premenopausal subject in Figure 5, the breasts are fattier. The measured FVs from (a) week 1, (b) week 2, (c) week 3 to (d) week 4 are 21.0, 21.2, 20.6, and 19.9 cm3, respectively. The corresponding PDs are 9.4%, 9.7%, 9.6%, and 8.7%, respectively. CVs for FV and PD are 2.8% and 4.6%, respectively.
Figure 5b:
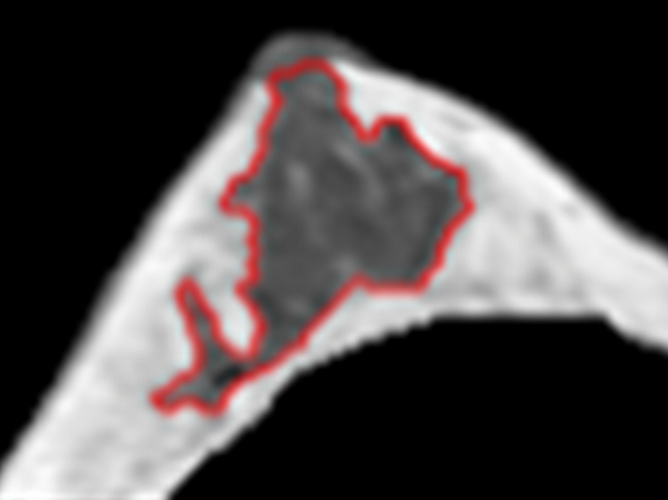
(a–d) Representative MR images from the right breast of 30-year-old subject with about 20% variation in Figure 4. Images are from one corresponding location in four MR imaging studies. FVs from (a) week 1, (b) week 2, (c) week 3 to (d) week 4 are 30, 27, 25, and 36 cm3, respectively. It is apparent that the fibroglandular tissue is increased substantially in week 4, corresponding to her late luteal phase. The corresponding PDs are 12.0%, 12.2%, 11.5%, and 16.8%, respectively. CVs for FV and PD are 16.5% and 18.9%, respectively.
Figure 5c:
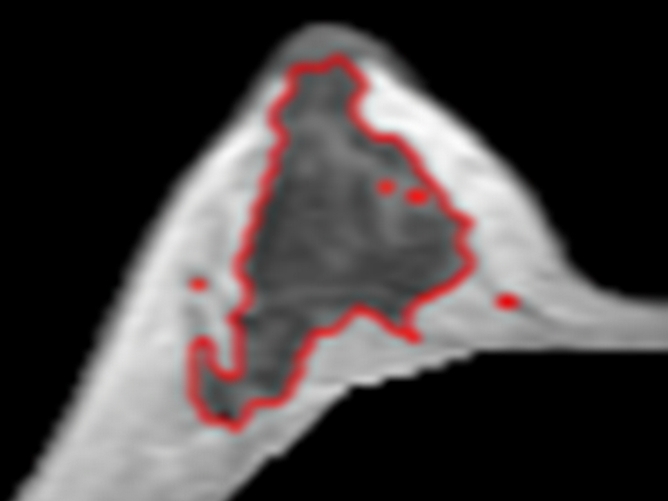
(a–d) Representative MR images from the right breast of 30-year-old subject with about 20% variation in Figure 4. Images are from one corresponding location in four MR imaging studies. FVs from (a) week 1, (b) week 2, (c) week 3 to (d) week 4 are 30, 27, 25, and 36 cm3, respectively. It is apparent that the fibroglandular tissue is increased substantially in week 4, corresponding to her late luteal phase. The corresponding PDs are 12.0%, 12.2%, 11.5%, and 16.8%, respectively. CVs for FV and PD are 16.5% and 18.9%, respectively.
Figure 5d:
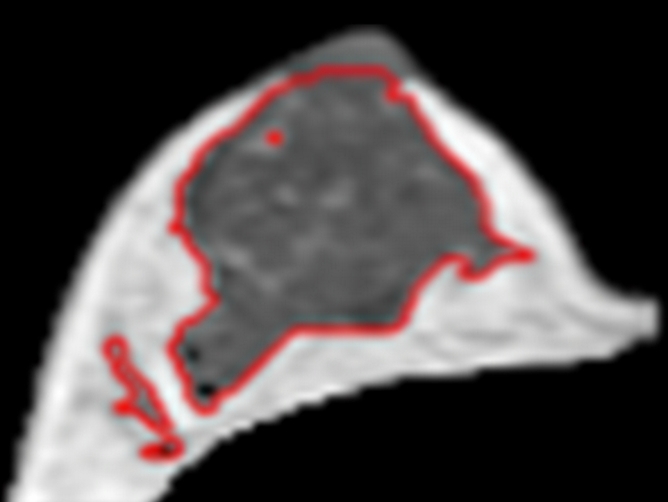
(a–d) Representative MR images from the right breast of 30-year-old subject with about 20% variation in Figure 4. Images are from one corresponding location in four MR imaging studies. FVs from (a) week 1, (b) week 2, (c) week 3 to (d) week 4 are 30, 27, 25, and 36 cm3, respectively. It is apparent that the fibroglandular tissue is increased substantially in week 4, corresponding to her late luteal phase. The corresponding PDs are 12.0%, 12.2%, 11.5%, and 16.8%, respectively. CVs for FV and PD are 16.5% and 18.9%, respectively.
Figure 6b:
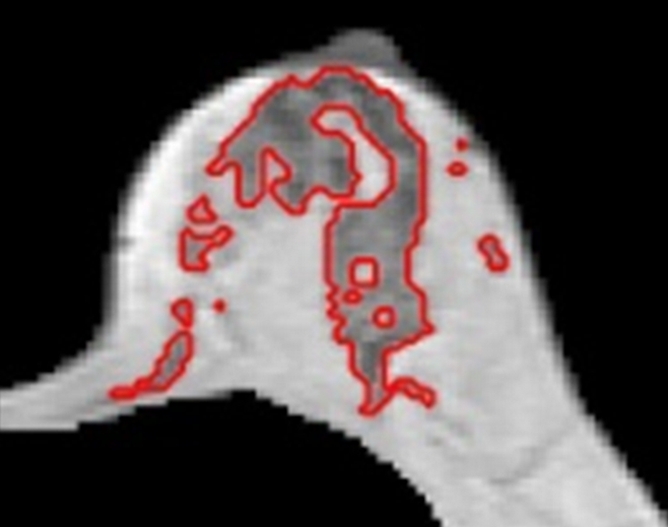
(a–d) Representative MR images in 57-year-old postmenopausal subject. Compared with the premenopausal subject in Figure 5, the breasts are fattier. The measured FVs from (a) week 1, (b) week 2, (c) week 3 to (d) week 4 are 21.0, 21.2, 20.6, and 19.9 cm3, respectively. The corresponding PDs are 9.4%, 9.7%, 9.6%, and 8.7%, respectively. CVs for FV and PD are 2.8% and 4.6%, respectively.
Figure 6c:
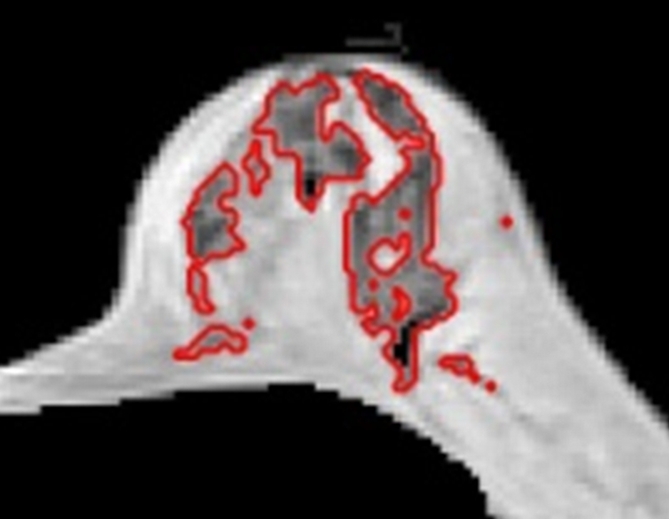
(a–d) Representative MR images in 57-year-old postmenopausal subject. Compared with the premenopausal subject in Figure 5, the breasts are fattier. The measured FVs from (a) week 1, (b) week 2, (c) week 3 to (d) week 4 are 21.0, 21.2, 20.6, and 19.9 cm3, respectively. The corresponding PDs are 9.4%, 9.7%, 9.6%, and 8.7%, respectively. CVs for FV and PD are 2.8% and 4.6%, respectively.
Figure 6d:
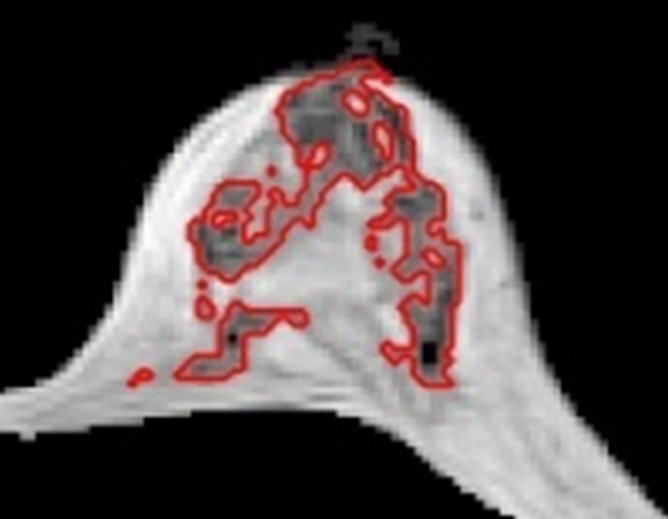
(a–d) Representative MR images in 57-year-old postmenopausal subject. Compared with the premenopausal subject in Figure 5, the breasts are fattier. The measured FVs from (a) week 1, (b) week 2, (c) week 3 to (d) week 4 are 21.0, 21.2, 20.6, and 19.9 cm3, respectively. The corresponding PDs are 9.4%, 9.7%, 9.6%, and 8.7%, respectively. CVs for FV and PD are 2.8% and 4.6%, respectively.
Discussion
Studies examining histologic changes of breast tissue in different phases of a menstrual cycle have demonstrated morphologic changes in the epithelial and stromal components (2,3), and these changes may manifest as variations in breast density. Several studies have shown that mammographic density has a small, but not statistically significant, increase in the luteal phase compared with the follicular phase (23–26).
MR imaging has been used to evaluate the changes of breast tissue and water content within the menstrual cycle (7–16). Most studies have focused on evaluation of the effect of different physiologic phases on parenchymal enhancements (9,10,13,15), which is an important concern for accurate diagnosis of breast lesions. A higher background tissue enhancement, usually occurring in the luteal phase, may obscure the detection of abnormal lesions. Therefore, it is recommended that screening MR imaging should be performed during the follicular phase. Changes in BV and FV have also been studied by using MR imaging (7,14,16). Compared with mammographic density analysis, the three-dimensional MR imaging–based density analysis provides a more accurate method for assessing the volumetric change of breast tissue. Graham et al (7) examined changes of FV in seven women with MR imaging and found four of seven subjects showed unequivocal cyclic variations in FV, consistent with expected histologic changes. In a study of eight women, Fowler et al (16) reported a substantial increase in parenchymal volume in the luteal phase compared with the follicular phase. The total BV and parenchymal volume were the lowest between days 6 and 15. Although interesting, the numbers of subjects in the two studies were small; the segmentation of the breast was not performed based on reliable anatomic landmarks and that could affect the measured volume.
In this study, we used a three-dimensional MR-based semiautomatic method to measure density from the whole breast. Four consecutive weekly MR imaging examinations were performed over 1 month, and MR imaging 1 to MR imaging 4 were assigned on the basis of the self-reported starting date of menstruation, not on the basis of serum hormonal level. Previous studies on the correlation of breast density and hormonal level have been controversial. Several studies showed no significant correlation between breast density and the levels of salivary estradiol and progesterone (25), or blood levels of estrone and estradiol (27,28), and suggested that measurement of hormonal level may have a high variation and does not provide a reliable index for separating follicular and luteal phases. One study, however, showed an association between serum estradiol and PD during the follicular phase (29).
Our computer algorithm–based method could be used to achieve a high segmentation quality. The method requires some operator intervention, and this is the source of interoperator variation. The superior, inferior, and posterior boundaries of the breast need to be defined by the operator, and this may lead to different measurements of BV. The choice of different numbers of fuzzy c-means clusters used in fibroglandular tissue segmentation and the methods used to correct the erroneous segmentation may affect the measured FV. The mean variations between the two operators were relatively small, around 3% for BV and around 6% for FV and PD.
Postmenopausal women do not have functional ovaries, thus, there is no cyclic effect of hormonal fluctuation on the breast tissue. The averaged CVs from six subjects were 5.6% for BV, 4.2% for FV, and 6.0% for PD, which were close to the interoperator measurement variation. The fluctuations measured in premenopausal women were higher than in postmenopausal women (5.0% for BV, 7.6% for FV, and 7.1% for PD), but the difference was not statistically significant. Despite the insignificant difference between the two groups, several premenopausal women (four of 24 by operator 1, one of 24 by operator 2) did show more than 10% CV in the measured density. We also investigated the relationship of this fluctuation with body mass index but found no correlation because of small sample size. A post hoc power analysis revealed that to achieve P less than .05, two-tailed at a power of 0.8, the sample size should reach 90 for operator 1 and 193 for operator 2. We found no trend of association between the CV measurement and the mean density. Therefore, the menstrual cycle–related fluctuation seems to vary from subject to subject, not consistent in all premenopausal women who have regular periods. We found one woman with a 20% increase in fibroglandular tissue.
Our study had several limitations. The number of the study subjects in each group was small, and therefore lack of differences between groups, particularly in the assessment of FV between pre- and postmenopausal subjects (where P = .06), could be because of sample size. The subjects in this study were all slim Asian women with relatively small breast size and dense breast tissue and a narrow body mass index range (17.2–25.8 kg/m2), thus, the results may not be generalizable to other populations. The operators had to go through a training protocol before becoming certified to analyze the cases in this study, and they were encouraged to consult the radiologist whenever they had questions during the analysis process. Therefore, the training, as well as the close supervision and corrections by the senior radiologist, might have contributed to the relatively small interobserver variability in this study. One major source leading to the variation in the segmented fibroglandular tissue may come from the change of T1 and T2 due to the change of water content at different menstrual cycle times, which results in slight differences in the contrast between the fibroglandular tissue and the fatty tissue. However, because we did not measure the T1 and T2 relaxation times, we were not able to obtain more insightful information about the source of variations.
In summary, we have shown that a high segmentation quality of the breast region and the fibroglandular tissue can be achieved by using a sophisticated semiautomatic computer algorithm–based method. Although the fluctuation of FV and PD was slightly higher in the premenopausal group than the postmenopausal group, the difference was not statistically significant. However, the menstrual cycle–related fluctuations in breast density may vary from woman to woman; a high variation was found in several premenopausal women. The results suggest that when the change of breast density is used as a surrogate marker to evaluate the effect of hormonal treatments, menstrual cycle–related variations need to be taken into consideration.
Advances in Knowledge.
• Breast volume (BV) and fibroglandular tissue volume (FV) at different time points of a menstrual cycle can be consistently measured by two different operators, achieving the interoperator variation of 3% for BV and 5%–6% for FV and percentage of density (PD).
• The coefficient of variation for BV, FV, and PD measured over the course of four MR imaging examinations performed weekly was used to evaluate menstrual cycle–related fluctuation, which is in the order of 7%, only slightly higher than the interoperator variation.
• Overall, the menstrual cycle–related fluctuation was not significantly different between premenopausal and postmenopausal women (all P values > .05); however, a greater than 10% variation was seen in several premenopausal women, while none was observed in postmenopausal women.
Implication for Patient Care.
• The density fluctuations studied in this work with semiautomatic algorithms can measure BV and PD with highly repeatable accuracy; the results may provide important information for the design of longitudinal studies to evaluate the changes in density during drug interventions.
Disclosures of Potential Conflicts of Interest: S.C. No potential conflicts of interest to disclose. M.Y.L.S. No potential conflicts of interest to disclose. F.J.L. No potential conflicts of interest to disclose. J.P.W. No potential conflicts of interest to disclose. M.L. No potential conflicts of interest to disclose. O.N. No potential conflicts of interest to disclose. S.A.F. No potential conflicts of interest to disclose. J.H.C. No potential conflicts of interest to disclose.
Supplementary Material
Received March 9, 2011; revision requested May 1; revision received May 23; accepted June 13; final version accepted June 23.
Supported in part by California Breast Cancer Research Program grant no. 14GB-0148 and 16GB-0056.
Funding: This research was supported by the National Institutes of Health (grants R01 CA127927 and R03 CA136071).
Abbreviations:
- BV
- breast volume
- CV
- coefficient of variation
- FV
- fibroglandular tissue volume
- PD
- percentage of breast density
References
- 1.Ramakrishnan R, Khan SA, Badve S. Morphological changes in breast tissue with menstrual cycle. Mod Pathol 2002;15(12):1348–1356 [DOI] [PubMed] [Google Scholar]
- 2.Vogel PM, Georgiade NG, Fetter BF, Vogel FS, McCarty KS., Jr The correlation of histologic changes in the human breast with the menstrual cycle. Am J Pathol 1981;104(1):23–34 [PMC free article] [PubMed] [Google Scholar]
- 3.Longacre TA, Bartow SA. A correlative morphologic study of human breast and endometrium in the menstrual cycle. Am J Surg Pathol 1986;10(6):382–393 [DOI] [PubMed] [Google Scholar]
- 4.Pike MC, Spicer DV, Dahmoush L, Press MF. Estrogens, progestogens, normal breast cell proliferation, and breast cancer risk. Epidemiol Rev 1993;15(1):17–35 [DOI] [PubMed] [Google Scholar]
- 5.Baines CJ, Vidmar M, McKeown-Eyssen G, Tibshirani R. Impact of menstrual phase on false-negative mammograms in the Canadian National Breast Screening Study. Cancer 1997;80(4):720–724 [PubMed] [Google Scholar]
- 6.White E, Velentgas P, Mandelson MT, et al. Variation in mammographic breast density by time in menstrual cycle among women aged 40-49 years. J Natl Cancer Inst 1998;90(12):906–910 [DOI] [PubMed] [Google Scholar]
- 7.Graham SJ, Stanchev PL, Lloyd-Smith JO, Bronskill MJ, Plewes DB. Changes in fibroglandular volume and water content of breast tissue during the menstrual cycle observed by MR imaging at 1.5 T. J Magn Reson Imaging 1995;5(6):695–701 [DOI] [PubMed] [Google Scholar]
- 8.Sharma U, Kumar M, Sah RG, Jagannathan NR. Study of normal breast tissue by in vivo volume localized proton MR spectroscopy: variation of water-fat ratio in relation to the heterogeneity of the breast and the menstrual cycle. Magn Reson Imaging 2009;27(6):785–791 [DOI] [PubMed] [Google Scholar]
- 9.Delille JP, Slanetz PJ, Yeh ED, Kopans DB, Garrido L. Physiologic changes in breast magnetic resonance imaging during the menstrual cycle: perfusion imaging, signal enhancement, and influence of the T1 relaxation time of breast tissue. Breast J 2005;11(4):236–241 [DOI] [PubMed] [Google Scholar]
- 10.Lorenzen J, Welger J, Lisboa BW, Krupski G, Adam G. [MR-imaging of the breast at 0.5 Tesla: menstrual-cycle dependency of parenchymal contrast enhancement in healthy volunteers with oral contraceptive use?]. Rofo 2003;175(4):502–506 [DOI] [PubMed] [Google Scholar]
- 11.Lorenzen J, Sinkus R, Biesterfeldt M, Adam G. Menstrual-cycle dependence of breast parenchyma elasticity: estimation with magnetic resonance elastography of breast tissue during the menstrual cycle. Invest Radiol 2003;38(4):236–240 [DOI] [PubMed] [Google Scholar]
- 12.Partridge SC, McKinnon GC, Henry RG, Hylton NM. Menstrual cycle variation of apparent diffusion coefficients measured in the normal breast using MRI. J Magn Reson Imaging 2001;14(4):433–438 [DOI] [PubMed] [Google Scholar]
- 13.Rieber A, Nüssle K, Merkle E, Kreienberg R, Tomczak R, Brambs HJ. MR mammography: influence of menstrual cycle on the dynamic contrast enhancement of fibrocystic disease. Eur Radiol 1999;9(6):1107–1112 [DOI] [PubMed] [Google Scholar]
- 14.Hussain Z, Roberts N, Whitehouse GH, García-Fiñana M, Percy D. Estimation of breast volume and its variation during the menstrual cycle using MRI and stereology. Br J Radiol 1999;72(855):236–245 [DOI] [PubMed] [Google Scholar]
- 15.Müller-Schimpfle M, Ohmenhaüser K, Stoll P, Dietz K, Claussen CD. Menstrual cycle and age: influence on parenchymal contrast medium enhancement in MR imaging of the breast. Radiology 1997;203(1):145–149 [DOI] [PubMed] [Google Scholar]
- 16.Fowler PA, Casey CE, Cameron GG, Foster MA, Knight CH. Cyclic changes in composition and volume of the breast during the menstrual cycle, measured by magnetic resonance imaging. Br J Obstet Gynaecol 1990;97(7):595–602 [DOI] [PubMed] [Google Scholar]
- 17.Cuzick J, Warwick J, Pinney E, Warren RM, Duffy SW. Tamoxifen and breast density in women at increased risk of breast cancer. J Natl Cancer Inst 2004;96(8):621–628 [DOI] [PubMed] [Google Scholar]
- 18.Eng-Wong J, Orzano-Birgani J, Chow CK, et al. Effect of raloxifene on mammographic density and breast magnetic resonance imaging in premenopausal women at increased risk for breast cancer. Cancer Epidemiol Biomarkers Prev 2008;17(7):1696–1701 [DOI] [PMC free article] [PubMed] [Google Scholar]
- 19.Mousa NA, Crystal P, Wolfman WL, Bedaiwy MA, Casper RF. Aromatase inhibitors and mammographic breast density in postmenopausal women receiving hormone therapy. Menopause 2008;15(5):875–884 [DOI] [PubMed] [Google Scholar]
- 20.Vachon CM, Ingle JN, Suman VJ, et al. Pilot study of the impact of letrozole vs. placebo on breast density in women completing 5 years of tamoxifen. Breast 2007;16(2):204–210 [DOI] [PubMed] [Google Scholar]
- 21.Lin M, Chan S, Chen JH, et al. A new bias field correction method combining N3 and FCM for improved segmentation of breast density on MRI. Med Phys 2011;38(1):5–14 [DOI] [PMC free article] [PubMed] [Google Scholar]
- 22.Nie K, Chen JH, Chan S, et al. Development of a quantitative method for analysis of breast density based on three-dimensional breast MRI. Med Phys 2008;35(12):5253–5262 [DOI] [PMC free article] [PubMed] [Google Scholar]
- 23.Ursin G, Parisky YR, Pike MC, Spicer DV. Mammographic density changes during the menstrual cycle. Cancer Epidemiol Biomarkers Prev 2001;10(2):141–142 [PubMed] [Google Scholar]
- 24.Buist DSM, Aiello EJ, Miglioretti DL, White E. Mammographic breast density, dense area, and breast area differences by phase in the menstrual cycle. Cancer Epidemiol Biomarkers Prev 2006;15(11):2303–2306 [DOI] [PubMed] [Google Scholar]
- 25.Morrow M, Chatterton RT, Jr, Rademaker AW, et al. A prospective study of variability in mammographic density during the menstrual cycle. Breast Cancer Res Treat 2010;121(3):565–574 [DOI] [PubMed] [Google Scholar]
- 26.Hovhannisyan G, Chow L, Schlosser A, Yaffe MJ, Boyd NF, Martin LJ. Differences in measured mammographic density in the menstrual cycle. Cancer Epidemiol Biomarkers Prev 2009;18(7):1993–1999 [DOI] [PubMed] [Google Scholar]
- 27.Boyd NF, Stone J, Martin LJ, et al. The association of breast mitogens with mammographic densities. Br J Cancer 2002;87(8):876–882 [DOI] [PMC free article] [PubMed] [Google Scholar]
- 28.Noh JJ, Maskarinec G, Pagano I, Cheung LW, Stanczyk FZ. Mammographic densities and circulating hormones: a cross-sectional study in premenopausal women. Breast 2006;15(1):20–28 [DOI] [PubMed] [Google Scholar]
- 29.Yong M, Atkinson C, Newton KM, et al. Associations between endogenous sex hormone levels and mammographic and bone densities in premenopausal women. Cancer Causes Control 2009;20(7):1039–1053 [DOI] [PMC free article] [PubMed] [Google Scholar]
Associated Data
This section collects any data citations, data availability statements, or supplementary materials included in this article.


