Abstract
Human 5′-methylthioadenosine phosphorylase (MTAP) links the polyamine biosynthetic and S-adenosyl-L-methionine salvage pathways and is a target for anticancer drugs. p-Cl-PhT-DADMe-ImmA is a 10 pM, slow-onset tight-binding transition state analogue inhibitor of the enzyme. Titration of homotrimeric MTAP with this inhibitor established equivalent binding and independent catalytic function of the three catalytic sites. Thermodynamic analysis of MTAP with tight-binding inhibitors revealed entropic-driven interactions with small enthalpic penalties. A large negative heat capacity change of −600 cal/mol•K upon inhibitor binding to MTAP is consistent with the loss of hydrophobic interactions and release of water. Crystal structures of apo MTAP and MTAP in complex with p-Cl-PhT-DADMe-ImmA were determined at 1.9 A and 2.0 A resolution, respectively. Inhibitor binding caused condensation of the enzyme active site, reorganization at the trimer interfaces, the release of water from the active sites and subunit interfaces, and compaction of the trimeric structure. These structural changes cause the entropy-favored binding of transition state analogues. Homotrimeric human MTAP is contrasted to the structurally related homotrimeric human purine nucleoside phosphorylase. p-Cl-PhT-DADMe- ImmA binding to MTAP involves a favorable entropy term of −17.6 kcal/mol with unfavorable enthalpy of 2.6 kcal/mol. In contrast, binding of an 8.5 pM transition state analogue to human PNP has been shown to exhibit the opposite behavior, with an unfavorable entropy term of 3.5 kcal/mol and a favorable enthalpy of −18.6 kcal/mol. Transition state analogue interactions reflect protein architecture near the transition state and the profound thermodynamic differences for MTAP and PNP suggest dramatic differences in contributions to catalysis from protein architecture.
5′-Methylthioadenosine (MTA) is produced from decarboxy-SAM by spermidine and spermine synthases, sequential enzymes in the polyamine biosynthesis pathway (1). In humans, the metabolism of MTA relies solely on MTA phosphorylase (MTAP) to catalyze the phosphorolysis of MTA to adenine and 5-methylthio-α-D-ribose 1-phosphate (MTR-1-P) (2, 3). These products can be utilized for SAM resynthesis. Thus, MTAP links polyamine biosynthesis and SAM salvage. Polyamine biosynthesis is required for rapid cell proliferation (4). The accumulation of MTA can cause feedback inhibition of polyamine production and recycling of MTA to SAM. These features suggested MTAP inhibition as an approach for the development of anticancer drugs (5, 6). The inhibition of MTAP may also affect SAM-related protein and DNA methylations and thus enhance the antiproliferative activities of cancer cells (6).
Human MTAP is a structural homologue of human purine nucleoside phosphorylase (PNP) but PNP prefers 6-oxo-purine nucleoside substrates. Although these enzymes share only 27% sequence identity, they share similar active sites and overall topology (7). Both enzymes are homotrimers with three active sites located near the subunit interfaces. Their active sites contain three binding regions corresponding to the purine-, (methythiol)ribose- and phosphate-binding sites.
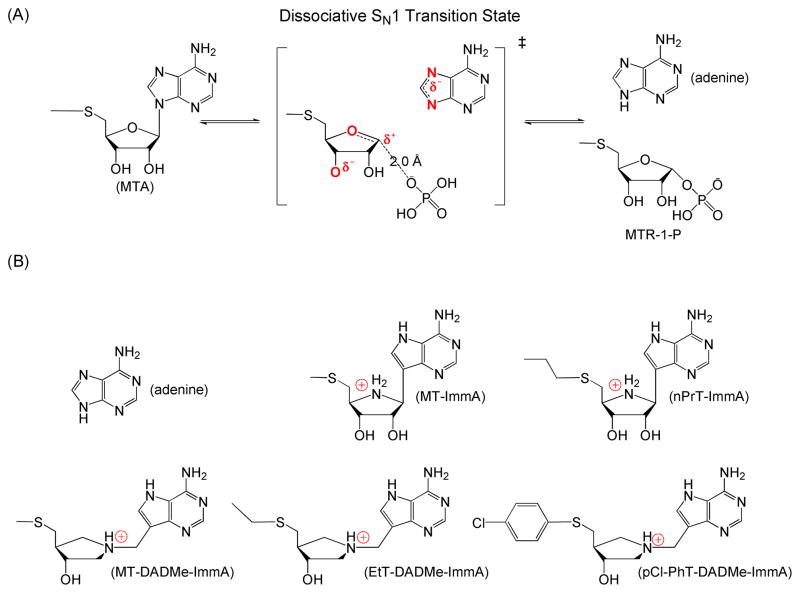
The transition state structure for human MTAP has been determined by kinetic isotope effects and computational modeling (8). MTAP forms a late dissociative transition state, featuring complete dissociation of the adenine leaving group with significant participation of the phosphate nucleophile (Fig. 1A). The ribocation transition state is stabilized by the 3′-oxygen and phosphate, forming a 5-methylthioribosyl zwitterion at the transition state (8).
Figure 1.
(A) Transition state of human MTAP. Atoms in red are those with charge differences at the transition state. (B) Adenine and iminoribitol-based (upper row) or hydroxypyrrolidine-based (lower row) of transition state analogue inhibitors of MTAP.
Two generations of transition state analogue inhibitors have been synthesized for human MTAP (Fig. 1B). MT-ImmA (Ki of 1 nM) is a first generation inhibitor, resembling an early transition state with ribocation character and an elevated pKa at N7 of the leaving group (9). MT-DADMe-ImmA (Ki of 90 pM) is a second generation inhibitor and mimics the fully dissociative transition state of MTAP by increasing the distance between deazaadenine and the pyrrolidine group through a methylene bridge (10). MT-DADMe-ImmA induces apoptosis in two head and neck carcinoma cell lines (FaDu and Cal27) and prevents the growth of FaDu tumors in a mouse model (6). MT-DADMe-ImmA also inhibits the tumor growth and metastases of human lung cancer cell lines in mouse xenografts (11). Its broad anticancer activity with low systemic toxicity makes MT-DADMe- ImmA a candidate for anticancer activity.
Thermodynamic parameters for the binding of picomolar transition state analogue inhibitors to human PNP revealed large favorable enthalpy opposed by an unfavorable entropy term (12). This pattern is expected by the general nature of enthalpy-entropy compensation, where the transition state analogue binding causes the protein to become stabilized and organized through favorable hydrogen bond and ion-pair contacts with the inhibitor. We wanted to investigate if this is a general phenomenon by examining the related MTAP system.
Binding studies with MTAP involve the thermodynamics of ligand binding using the product adenine and two generations of transition state analogue inhibitors. The results are unprecedented, revealing entropy-driven binding for adenine and for transition state analogue interactions with MTAP. The crystal structures and hydrodynamic properties of apo and liganded MTAP are described and compared to the binding thermodynamics found with human PNP. Thermodynamic properties and subunit cooperativity of MTAP are both distinct from the related human PNP. The work highlights the diversity of enzymatic function and the interaction of transition state analogues.
MATERIALS AND METHODS
Chemicals
Transition state analogue inhibitors of human MTAP were synthesized and provided by Dr. Gary B. Evans and colleagues of the Carbohydrate Chemistry Team, Industrial Research Ltd. These inhibitors include two first-generation ImmAs (MT-ImmA and PrT-ImmA) and three second-generation ImmAs (MT-DADMe-ImmA, EtT-DADME-ImmA, and p-Cl-PhT-DADMe-ImmA) (Fig. 1B). Their synthesis and characterization are detailed elsewhere (10, 13). Adenine was purchased from Sigma. Other chemicals and reagents were obtained from Sigma or Fisher Scientific and were of highest grade available, unless otherwise specified.
Plasmid Construction
A synthetic gene for human MTAP was designed from the NCBI reference sequence NP_002442.2 and was synthesized and cloned into the pJexpress414 expression vector by DNA2.0 Inc. The recombinant human MTAP has 14 additional amino acids at N-terminus of the native enzyme, including a His6 tag and a TEV protease cleavage site.
Enzyme Purification and Preparation
The plasmid containing the synthetic MTAP gene was transformed into BL21-CodonPlus(DE3)-RIPL E. coli cell and was grown overnight at 37 °C in 25 mL of LB medium containing 100 μg/mL ampicillin. This culture was transferred into 1 L of LB containing ampicillin medium and the cell growth was continued at 37 °C until the O.D.600 reached 0.7. Protein expression was induced by adding IPTG to 1 mM final concentration. After 4 hours induction at 37 °C, the cells were harvested by centrifugation at 4500 g for 30 min. Cell pellet was suspended in 20 mL of lysis buffer (15 mM imidazole, 300 mM NaCl, and 50 mM phosphate, pH 8.0), with EDTA-free protease inhibitor (2 tablets) added according to supplier recommendations (from Roche Diagnostics) and lysozyme (20 mg) added to the slurry. Cells were disrupted twice with a French Press and centrifuged at 20000 g for 30 min. The supernatant was loaded onto a 3 mL column of Ni-NTA Superflow resin pre-equilibrated with 15 mL lysis buffer. The column was washed with 15 mL wash buffer (80 mM imidazole, 300 mM NaCl, and 50 mM phosphate, pH 8.0), and enzyme was eluted with 12 mL elution buffer (250 mM imidazole, 300 mM NaCl, and 50 mM phosphate, pH 8.0). Purified enzyme was dialyzed against 100 mM phosphate, pH 7.4 with 2 mM DTT and concentrated to about 5 mg/ml. Enzyme was stored at frozen at −80 °C and had a purity of > 95% on SDS-PAGE. The extinction coefficient of this recombinant human MTAP is estimated to be 31.4 mM−1cm−1 at 280 nm (ProtParam program from ExPASy). The kcat and KMTA values of purified MTAP are similar to previously reported data (14), indicating that this enzyme is catalytically equivalent to native human MTAP.
Purified enzyme had approximately two-third of its sites occupied by tightly-bound adenine, consistent with a previous report of a MTAP structure containing an adenine complex (7). Co-purified adenine was identified by: (a) denaturing the enzyme using perchloric acid (final content of 10% V/V), (b) obtaining the supernatant by centrifugation, (c) performing a UV-Vis scan of the supernatant (220 nm-350 nm), and (d) calculating the concentration of adenine using ε260 of 13.0 mM−1cm−1. Adenine co-purifying with MTAP was removed by dialyzing purified enzyme against 100 mM phosphate, pH 7.4, containing 0.5% (V/V) charcoal for 3 hr or by extensive dialysis of the enzyme against 100 mM phosphate, pH 7.4 with multiple dialysate changes. Phosphate at 100 mM, the condition used here for binding experiments, weakens phosphate binding.
Enzymatic Assays
Adenine formation was coupled to the formation of 2, 8- dihydroxyadenine by xanthine oxidase (15). The extinction coefficient of this coupled assay was 15.5 mM−1cm−1 at 305 nm (16). Reactions were carried out at 25 °C in 1 cm path length cuvettes with a final volume of 1 mL. Reaction mixtures contained 100 mM phosphate, pH 7.4, 200 μM MTA, 1 mM DTT, 1 unit of xanthine oxidase, and appropriate amounts of MTAP.
A direct assay involves the absorbance decrease at 275 nm on conversion of MTA to adenine resulting in with an extinction coefficient of 1.6 mM−1cm−1. Reactions were carried out at 25 °C in 1 cm path length cuvettes with a final volume of 1 mL. Reaction mixtures contained 100 mM potassium phosphate, pH 7.4, 50 mM Hepes, pH 7.4, 150 μM MTA, and appropriate amounts of MTAP. Reactions were initiated by addition of enzyme and the initial rates were monitored using a CARY 300 UV-Visible spectrophotometer. Reactions were initiated by addition of enzyme and the initial rates were monitored using a CARY 300 UV-Visible spectrophotometer. Control rates (no MTAP) were subtracted from initial rates for all reactions.
Catalytic site titration of Human MTAP
Human MTAP was titrated with p-Cl-PhT-DADMe-ImmA. Titrations were monitored using residual enzyme activity and by fluorescence spectroscopy. Enzyme was prepared in eppendorf tubes followed by the addition of various concentrations of inhibitor to each tube. Enzyme-inhibitor mixtures were incubated at 25 °C for an hour and assayed. Assays were as described in “Enzymatic Assays” except that reactions were initiated by adding enzyme-inhibitor mixtures. Initial rates of the reactions were plotted as a function of the ratio of inhibitor concentration to MTAP trimer concentration. The titration mixtures (1 μM enzyme and various concentration of inhibitor) were excited at 298 nm when monitored by fluorescence spectroscopy. The slit width set to 3 for excitation and 2 for emission. Excitation spectra were collected from 310 nm to 450 nm and the relative intensities at 350 nm were plotted with the ratio of inhibitor concentration to MTAP trimer concentration.
Isothermal Titration Calorimetry Studies
ITC studies were carried out using a VP-ITC MicroCalorimeter. Adenine that purified with MTAP was removed using the methods mentioned above. Apo protein was dialyzed overnight against 100 mM potassium phosphate buffer, pH 7.4. Dialysate and apo protein were filtered (Millipore, 0.2 μm). Inhibitor solutions were prepared by dissolving the inhibitor into filtered dialysate. Apo protein sample and inhibitor solution were degassed (Microcal Thermovac) for 15 minutes and were loaded into a 1.46 mL sample cell and 250 μL injection syringe. The final concentration prior to titrations was 40 μM protein and 600 μM inhibitor. Titration of human MTAP used 30 injections of 6–8 μL with 4 min between injections. ITC data of first generation inhibitors was fitted to a model of two distinct independent sites. Data of second generation inhibitors was fitted to a model for a single set of identical sites. Data for adenine binding were fitted to a model for three sequential binding sites. MTAP inhibitors were also titrated into buffer to correct for heat of dilution. Those controls were subtracted from the corresponding ITC data using the “subtract reference” function in Origin 7.0. MTAP samples with or without reducing reagent (2 mM β-mercaptoethanol) resulted in identical ITC data. Enzyme samples prepared by either adenine removal method gave the same results in ITC studies.
Data Processing of ITC Studies
ΔG values were calculated from Ki using equation 1. The Ki of ImmAs was reported previously, given by equilibrium dissociation constant following slow-onset inhibition2. The Ki values of adenine were determined by ITC titration. The entropy terms (−TΔS) were calculated from equation 2 (the Gibbs free energy expression).
| (1) |
| (2) |
Equations 3, 4, and 5 represent the total heat content Q of the solution contained in V0 (active cell volume) for single set of identical sites, two sets of independent sites, and sequential binding sites models, respectively. Equation 6 represents the heat released, ΔQi, from the ith injection for those three models. In equations 3–6, n is the number of sites, Θ is the fraction of sites occupied by inhibitor, Fi is the fraction of total protein sample having i bound inhibitors, dVi is the injection volume, and ΔH is the molar heat of inhibitor binding. Data fitting follows the same procedures for all of three models. Initial guesses of n, Ka (association constant of inhibitor, the reciprocal of equilibrium dissociation constant Kd) and ΔH were made by software Origin 7.0, followed by the calculation of ΔQi for each injection. ΔQi data were then compared with the corresponding heat that measured for real injection. Optimizations of the values of n, Ka and ΔH were achieved using standard Marquardt methods and were iterated until there was no further significant improvement of data fit. The known Ka values can be directly input into Origin 7.0 for more accurate fitting. This and more detailed information related to data fitting are available from the User’s Manual for the VP-ITC MicroCalorimeter.
| (3) |
| (4) |
| (5) |
| (6) |
Determination of Heat Capacity Change
ITC studies were carried out at different temperatures (15°C, 20 °C, 25 °C, 30 °C and 37 °C) to determine the heat capacity change (ΔCp) of MT-ImmA binding to MTAP. The ΔH values were plotted as a function of temperature and exhibited a linear pattern. The slope of the line indicates the heat capacity change upon ligand binding (17).
Crystallization and Structure Determination of Apo MTAP and MTAP:Inhibitor Complex
Apo MTAP crystals were obtained by sitting-drop vapor diffusion by mixing recombinant MTAP (13 mg/ml) in 20 mM phosphate pH 7.4, 1 mM DTT with reservoir buffer composed of 0.2 M NaCl, 20% PEG3000, and 0.1 M Hepes pH 7.5 at 18 °C. MTAP:inhibitor complexes were formed by incubating MTAP (19 mg/ml) in 20 mM Tris pH 7.4 with 1 mM p-Cl-PhT-DADMe-ImmA and 6 mM potassium phosphate pH 7.4 on ice. The MTAP:p-Cl-PhT-DADMe-ImmA:phosphate complex was co-crystallized by hanging drop or sitting drop vapor diffusion methods with precipitant composed of 0.2 M NaCl, 10% PEG8000 and 0.1 M Na/K phosphate pH 6.2 at 18 °C. Crystals were transferred to the mother liquor supplemented with 20% glycerol and flash frozen in liquid N2 before data collection. X-ray diffraction data were collected at the X29 beamline of Brookhaven National Laboratory on an ADSC Q315 detector at 100 K. The data were processed using the HKL2000 program suite (18) and data reduction is summarized in Table 1.
Table 1.
Data collection and refinement statistics
| PDB codes | p-Cl-PhT-DADMe-ImmA/PO4 3OZC |
PO4 3OZE |
|---|---|---|
| Data collection | ||
| Space group | P321 | P21 |
| Cell dimension | ||
| a, b, c (Å) | 123.3, 123.3, 44.9 | 79.5, 81.8, 130.3 |
| α, β, γ (°) | 90.0, 90.0, 90.0 | 90.0, 91.0, 90.0 |
| Resolutions (Å) | 50.00–1.93 (2.00–1.93) | 20.00–2.00 (2.07–2.00) |
| Rsym (%) | 7.7 (37.6) | 7.3 (67.2) |
| I / σI | 24.7 (4.7) | 14.9 (1.6) |
| Completeness (%) | 99.5 (94.8) | 99.9 (97.6) |
| Redundancy | 7.2 (7.0) | 4.0 (3.9) |
|
| ||
| Refinement | ||
| Resolution (Å) | 50.00–1.93 | 20.00–2.00 |
| No. unique reflections | 29533 | 111658 |
| Rwork / Rfree (%) | 13.1/15.4 | 21.5/26.1 |
|
| ||
| B-factors (Å2) | ||
| Protein | ||
| (main chain) | 20.4 | 50.0 |
| (side chain) | 22.8 | 51.7 |
| Water | 22.7 | 45.8 |
| Ligand | 19.5 | 40.6 |
|
| ||
| No. of Atoms | ||
| Protein | 2112 | 12241 |
| Water | 67 | 270 |
| Ligand | 31 | 30 |
|
| ||
| R.m.s deviations | ||
| Bond lengths (Å) | 0.013 | 0.015 |
| Bond angles (°) | 1.46 | 1.48 |
|
| ||
| Ramanchran analysis | ||
| favored region | 98.2% | 97.8% |
| allowed region | 1.8% | 2.2% |
| disallowed region | 0% | 0% |
| Coordinate Error by Luzzati plot (Å) | 0.14 | 0.34 |
Numbers in parentheses are for the highest-resolution shell. One crystal was used for each data set.
The structures of apo MTAP and its inhibitor complexes were determined by molecular replacement using the crystal structure of adenine-omit MTAP (PDB ID: 1CB0) as the search model using the program Molrep (7, 19). Models without inhibitor were iteratively rebuilt in COOT and refined in Refmac5 (20, 21). Manual inhibitor building was initiated only after the Rfree decreased below 30% and was guided by clear ligand density in Fo–Fc electron density maps contoured at 3σ. Data processing and refinement statistics are summarized in Table 1.
Analytical Ultracentrifugation Experiments
Sedimentation velocity experiments were conducted and analyzed as described previously (22) at a MTAP concentration of 4.5 mg/mL (134 μM) and inhibitor concentrations of 400 μM. Of the several hundred interference scans acquired for each sample, the software DCDT+ (version 2.3.2) selected approximately eighty scans for the time derivative calculation.
RESULTS AND DISCUSSION
Titration of Human MTAP
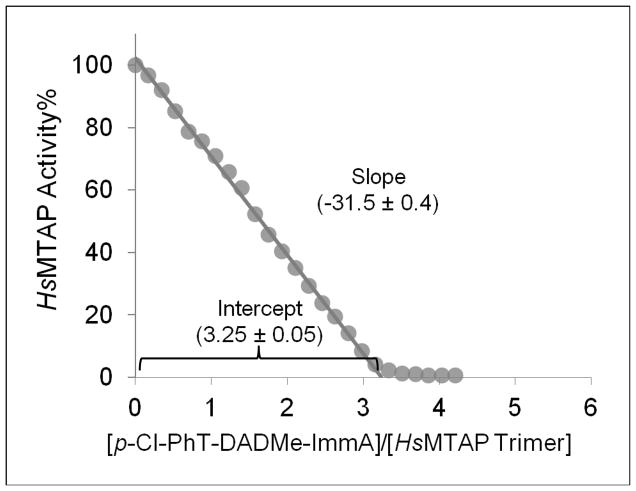
The stoichiometry of inhibitor binding to the MTAP trimer was probed by titration with p-Cl-PhT-DADMe-ImmA, a potent 10 pM inhibitor of MTAP (5). The titration was monitored by enzyme activity assays and fluorescence spectroscopy. The activity of enzyme-inhibitor mixtures was a linear function of inhibitor concentration with a slope indicating three equivalent, independent active sites filling with inhibitor. Thus, the three active sites of the MTAP trimer exhibit equal catalytic activities and comparable binding affinities for the transition state analogue inhibitor (Fig. 2). Relative fluorescence intensities plotted as a function of the molar ratio of inhibitor to human MTAP trimer also gave a linear pattern indicating equivalent conformational changes to the subunits as inhibitor binds (not shown). Thus, trimeric MTAP appears to contain three independent functional catalytic sites.
Figure 2.
Titration of p-Cl-PhT-DADMe-ImmA to Human MTAP. MTAP (200 nM) was incubated with inhibitor in 100 mM potassium phosphate, pH 7.4 to achieve equilibrium and assayed for MTAP activity.
Transition state analogue binding to MTAP differs remarkably from that of human PNP despite their trimeric structural similarity and their common chemistry of purines nucleoside phosphorolysis. Binding a transition state analogue inhibitor to a single site of trimeric human PNP causes complete inhibition indicating a one-third-the-sites functional interaction (23). Human PNP is thus proposed to have a sequential catalytic action at each subunit, reminiscent of other trimeric proteins with catalytic function, including F1 ATPase. Binding of transition state analogues to human PNP demonstrates strong negative cooperativity, with pM, nM and μM binding at the first, second and third sites, respectively (23).
Isothermal Titration Calorimetry Studies
MTAP isothermal titration calorimetry with five transition state analogue inhibitors included first generation analogues (MT-ImmA, nPrT-ImmA) and second generation analogues (MT-DADMe-ImmA, EtT-DADMe-ImmA, and 4-Cl-PhT-DADMe-ImmA). Accurate Kd (equilibrium dissociation constant) values for these inhibitors were obtained by slow-onset competitive kinetic inhibition assays (5, 9) and used for ITC data processing (Table 2 and Fig. 3).
Table 2.
Thermodynamics for binding adenine and transition state analogue inhibitors to human MTAP.
| Inhibitor | Kd [n]a (nM) | ΔG (kcal/mol) | ΔH (kcal/mol) | −TΔS (kcal/mol) |
|---|---|---|---|---|
| Adenine | 3000 ± 1000b [1] | −7.6 ± 0.2 | −0.003 ± 0.2 | −7.6 ± 0.3 |
| 2100 ± 80b [1] | −7.7 ± 0.2 | 2.4 ± 0.2 | −10.1 ± 0.3 | |
| 80000 ± 80000b [1] | −5.6 ± 0.5 | −2.6 ± 0.8 | −3.0 ± 0.9 | |
|
| ||||
| MT-ImmA | 1.0 ± 0.1c [2.42 ± 0.04] | −12.3 ± 0.1 | 0.24 ± 0.04 | −12.5 ± 0.1 |
| 700 ± 300b [0.58 ± 0.09] | −8.4 ± 0.3 | 2.7 ± 0.4 | −11.1 ± 0.5 | |
|
| ||||
| nPrT-ImmA | 0.214 ± 0.01c [2.13 ± 0.04] | −13.2 ± 0.03 | 0.24 ± 0.03 | −13.4 ± 0.1 |
| 900 ± 600b [0.9 ± 0.1] | −8.2 ± 0.4 | 1.1 ± 0.2 | −9.3 ± 0.4 | |
|
| ||||
| MT-DADMe-ImmA | 0.09 ± 0.01d [3] | −13.7 ± 0.1 | 1.5 ± 0.1 | −15.2 ± 0.1 |
|
| ||||
| EtT-DADMe-ImmA | 0.034 ± 0.003d [3] | −14.3 ± 0.1 | 1.8 ± 0.1 | −16.1 ± 0.1 |
|
| ||||
| p-Cl-PhT-DADMe-ImmA | 0.010 ± 0.005d [3] | −15.0 ± 0.3 | 2.6 ± 0.1 | −17.6 ± 0.3 |
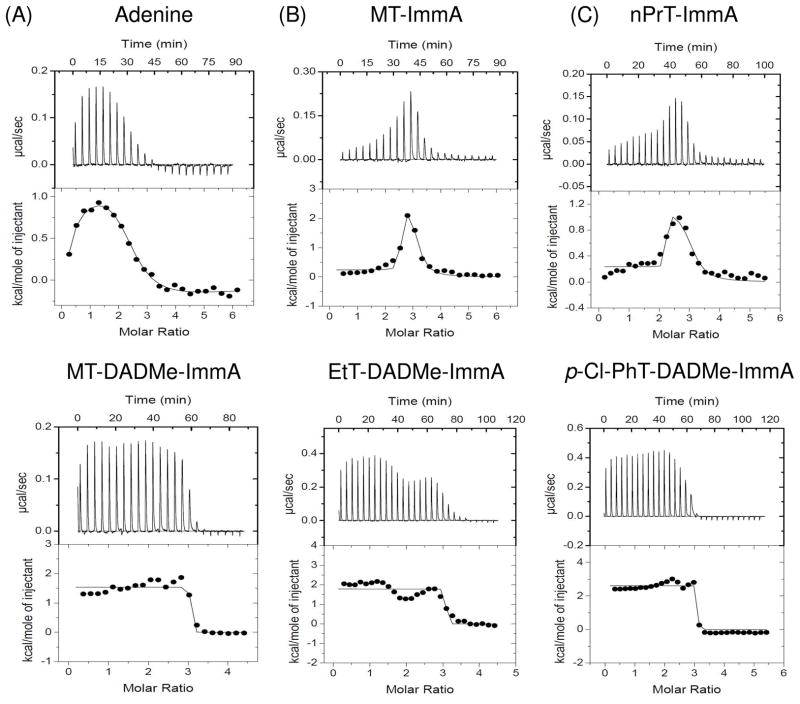
Figure 3.
Isothermal titrations of human MTAP with (A) adenine, (B) iminoribitol-based transition state analogues of MTAP, and (C) hydroxypyrrolidine transition state analogues of MTAP (see Fig. 1). The bell-shaped curves in panels A, B and C result from distinct enthalpic contributions upon filling sites 1, 2 and 3.
ITC Profiles for Binding First-generation MTAP Inhibitors
First generation MTAP inhibitors bind with small enthalpic heat uptakes in a cooperative manner to the three sites of trimeric MTAP (Table 2 and Fig. 3B). Thermodynamic changes are similar for binding at the first two sites, and a larger change occurs in the same direction as the third site is filled (Fig. 3B). MT-ImmA binding to the first two sites gives Kd values of 1 nM and 700 nM for the third site. As the steady-state kinetic Ki value for MT-ImmA is 1 nM, and complete inhibition is observed (5), the result suggests a functional cooperativity with substrate and MT-ImmA binding so that at near saturating MTA substrate, as occurs in steady-state assays, the three sites show similar affinity for the inhibitor. Binding to the third site shows a greater thermal change, also in the direction of heat uptake by the complex.
Binding of nPrT-ImmA to MTAP gave a thermal profile similar to that for MT-ImmA with calculated Kd values of 214 pM for the first two sites and approximately 900 pM for the third site. Catalytic site negative cooperativity in the energy landscape is apparent from the non-linear response to catalytic site filling with greater thermal energy uptake for filling of the third site for both of the first-generation MTAP inhibitors (Fig. 3B). As with MT-ImmA, these cooperative differences are masked in steady-state kinetic analysis of Ki values by the near-saturating MTA in these assays.
Binding of first generation ImmA inhibitors is completely dominated by favorable entropic terms with small enthalpic penalties. The ΔG, ΔH, and −TΔS values are −12.3, 0.2, and −12.5 kcal/mol, respectively, for the major binding sites of MT-ImmA. The binding ΔG, ΔH, and −TΔS values are −13.2, 0.2, and −13.4 kcal/mol, respectively, for the major binding sites of nPrT-ImmA.
Binding of Second-generation MTAP Inhibitors
Titration of MTAP catalytic function with p-Cl-PhT-DADMe-ImmA indicated three catalytically functional and independent binding sites (Fig. 2A), and these are known by inhibition kinetics to have dissociation constants of 10 pM (10). ITC data with three second generation MTAP inhibitions (MT-DADMe- ImmA, EtT-DADMe-ImmA and p-Cl-PhT-DADMe-ImmA) show similar patterns with small, equivalent thermal enthalpic heat uptakes as all three sites are filled. These data fit well to a single set of identical sites model, supporting the symmetric binding of these inhibitors to trimeric human MTAP (Table 2 and Fig. 3C). MT-DADMe-ImmA, EtT-DADMe- ImmA, and p-Cl-PhT-DADMe-ImmA have Kd values of 90 pM, 34 pM, and 10 pM, respectively. The binding of second generation ImmA inhibitors is completely driven by entropy with −TΔS values of −15.2, −16.1 and −17.6 compared to ΔG values of −13.7, −14.3 and −15.0 for MT-DADMe-ImmA, EtT-DADMe-ImmA, and p-Cl-PhT-DADMe-ImmA, respectively (Table 2). Thus the entropy term dominates binding and the enthalpic contribution is a modest penalty toward the binding energy (ΔG).
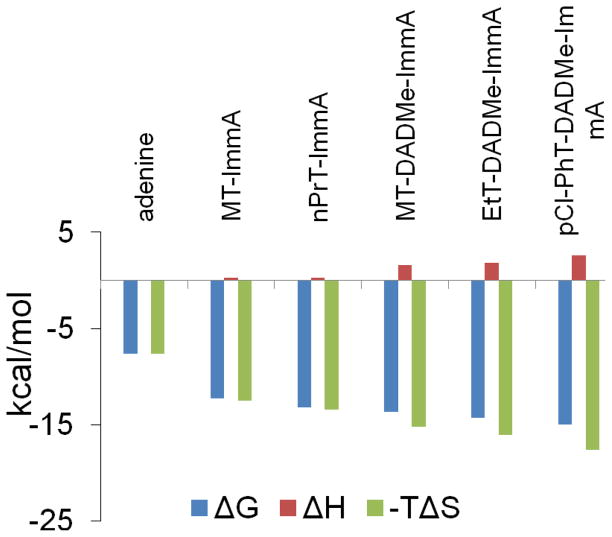
The binding thermodynamics of all transition state analogue inhibitors of MTAP establishes entropy as the driving force (Fig. 4). The enthalpic contribution to binding is unfavorable, but is a small fraction of the total binding energy. Increased hydrophobicity of the 5′-group promotes higher affinity to MTAP binding by causing an even more favorable entropy term. The second generation inhibitors are better mimics of the MTAP transition state and thus exhibit tighter binding than first-generation transition state analogues. However, for all inhibitors tested here, binding is entropy-driven.
Figure 4.
Thermodynamics signatures of inhibitors binding to MTAP.
Thermodynamics of Adenine Binding
Adenine is a product of MTA phosphorolysis by MTAP and is also of interest since it is found tightly bound on the purified enzyme. ITC data of adenine binding to adenine-free MTAP indicates sequential binding to the three active sites of trimeric MTAP (Table 2 and Fig. 3A) to give Kd values of 2.1 and 3 μM for the first two sites and 80 μM for the third site. Entropy (−TΔS) contributes all of the binding free energy (ΔG) for the first two binding sites, and accounts for 54% of the binding energy for the third site. Like the transition state analogues, binding of adenine to the initial binding sites is completely driven by entropy although the binding energy provided by the entropy term (−7.6 kcal/mol for 1st site) is smaller than found for transition state analogue inhibitors (Fig. 4), as expected because of the lack of transition state characteristics for adenine. The ITC values for adenine binding in the micromolar range are inconsistent with tightly bound adenine in purified enzyme, but may be explained by tighter binding of adenine at the low temperature and phosphate concentration used for purification.
Heat Capacity of Human MTAP and Inhibitor Binding
Binding enthalpy was measured at temperatures from 15 to 37 °C for MT-ImmA. Inhibitor binding was a linear function of temperature (Fig. 5). The heat capacity change (ΔCp) was determined to be − 600 ± 40 cal/mol.K. This large and negative ΔCp indicates altered hydrophobic effects upon ligand binding and can result from the removal of nonpolar surface from the solvent or the exclusion of bulk water from the enzyme active site (24, 25). Large and negative ΔCp values also indicate favorable solvation entropy (26). The ΔCp of −600 cal/mol.K indicates the release of water from human MTAP and/or increased system hydrophobic interactions upon inhibitor binding, consistent with the entropy-driven binding observed in the ITC studies.
Figure 5.
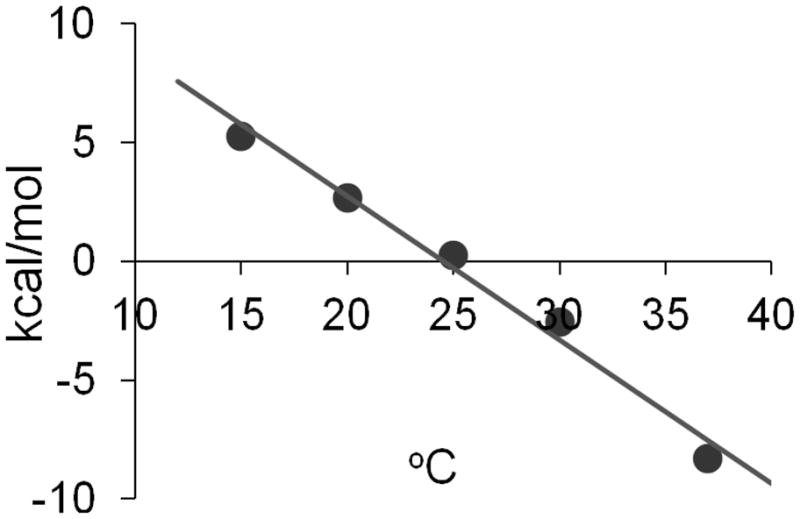
Heat capacity change of MTAP upon binding of MT-ImmA. The slope of the fitted line is ΔCp (−600 ± 40 cal/mol.K).
X-ray Crystal Structures of Human MTAP
Crystal structures of apo MTAP:phosphate and the MTAP:p-Cl-PhT-DADMe-ImmA:phosphate complex were determined to 1.9 A and 2.0 A resolution, respectively. The asymmetric unit in apo MTAP crystals contains 2 homotrimers with three-fold non-crystallographic symmetry, whereas the asymmetric unit of liganded MTAP crystals contains one MTAP subunit positioned about a crystallographic three-fold axis, which generates a strict three-fold symmetric homotrimer.
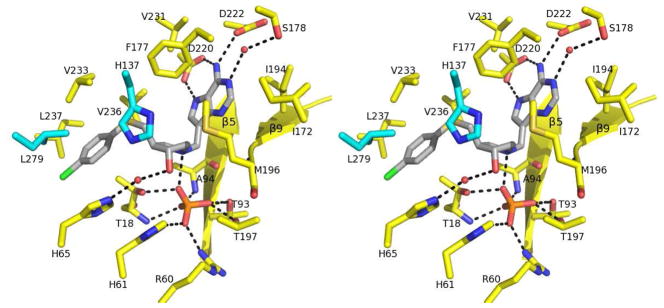
Human MTAP monomer contains 10 β strands and 6 α helices and possesses an α/β-fold consisting of a 7-stranded β-sheet and 6 α-helices. The β-5, β-6 and β-10 from 7-stranded β-sheet extend to create another 6-stranded β sheet (Fig. 6A). The active sites of human MTAP are located near the interface between two monomers of the trimer and each trimeric MTAP forms three active sites (Fig. 6B). The active site of human MTAP can be divided into three distinct regions corresponding to the purine-, methylthioribose- and phosphate-binding sites. The purine binding site is located between the backbone of β-5 and β-9 and the side chains of Phe177 and Met196 (Fig. 7). Side chains of Ser178, Ile172, Ile194, Asp220, Asp222 and Val231 contribute to the purine binding. The binding site for methylthioribose is formed primarily by hydrophobic residues (Phe177, Met196, Val233, Val236 and Leu237) with contributions from three hydrophilic residues (Thr18, His65 and His 137). Two amino acids in this site (His137 and Val279) are contributed from the adjacent subunit (Fig. 7). Phosphate interacts with side chains of Thr18, Thr93, Arg60, His61 and Thr197 and the amide nitrogen groups of Thr18 and Ala94 (Fig. 7).
Figure 6.
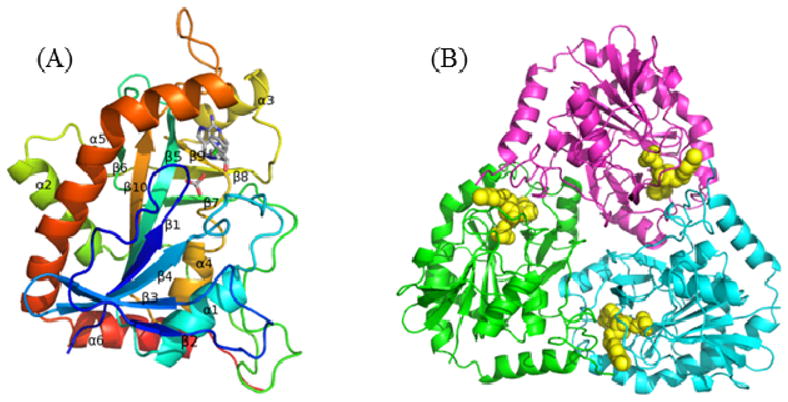
Crystal structure of MTAP. (A) A view of the MTAP monomer. MTAP is colorcoded from blue (N-terminus) to red (C-terminus). The p-Cl-PhT-DADMe-ImmA and phosphate are included as stick models to show the position of the active site. (B) The monomers of trimeric MTAP are shown in cyan, green and magenta. The p-Cl-PhTDADMe- ImmA and phosphate are included as space-filling models.
Figure 7.
Cross-eyed stereoview of active site of MTAP in complex with p-Cl-PhT-DADMe- ImmA and phosphate. The active site residues and the residues contributed from the adjacent subunit are colored in yellow and cyan, respectively. The p-Cl-PhT-DADMe- ImmA and phosphate are colored in gray and orange/red, respectively. Hydrogen bonds are indicated as dashed lines.
Contacts to p-Cl-PhT-DADMe-ImmA
The 9-deazaadenine of p-Cl-PhT-DADMe-ImmA is surrounded by the backbone of β-5 and β-9 and the side chains of Ile172, Phe177, Ile194, Met196 and Val231. The side chain of Asp220 forms hydrogen bonds with N6 and N7 of 9-deaza-adenine of the inhibitor. Asp222 and Ser178 form hydrogen bonds to the N1 and N6 of 9-deaza-adenine via a structural water molecule. The cationic hydroxypyrrolidine of p-Cl-PhT-DADMe-ImmA is surrounded by Thr18, His137, Phe177, Met196, Val233, Val236, Leu237, and Val279. The 3′-hydroxyl of the ribocation mimic forms a hydrogen bond with His65 via a structural water molecule. The 1-aza cation of the ribocation mimic forms a 2.8 A ion pair with the nucleophilic phosphate (Fig. 7).
Structural difference between apo and liganded MTAP
The overall crystal structures of apo and liganded MTAP are similar (the Cα r.m.s.d. of 0.7 A for 258 residues in the monomer), except the region from Thr219 to Asn245 and the loop composed of Gly16 to Glu24 (Fig 8A). In the crystal structure of the p-Cl-PhT-DADMe-ImmA:MTAP:phosphate complex, the side chains of Val231 (5 A), Val236 (4 A) and Leu237 (4 A) interact with inhibitor through van der Waals interactions. Superposition of apo and liganded MTAP reveals that Val236 and Leu237 of apo MTAP are 6 A away from the inhibitor and Val231 is disordered. Thus, the binding of p-Cl-PhT-DADMe-ImmA induces the bending of the N-terminal end of the Val233 to Asn245 segment of α-5 toward the active site (Fig. 8A). In addition, the loop composed of residues 227 to 235, located between α-5 and β-10, is ordered in liganded MTAP but disordered in the apo protein. The ordered loop contacts the side chain of Phe177 and the adjacent subunit. The movement of helix 5 creates the active site cavity (Fig. 8B and 8C). Similar catalytic site features are also observed in crystal structures of MTAP in complex with adenine (PDB ID: 1CB0) or MT-ImmA (PDB ID: 1K27) when compared to the apo protein. The conformational change of the region from Thr219 to Asn245 results in active site closing and facilitates tight binding of the transition state analogue inhibitors. Since transition state analogues are related to productive species encountered along the reaction coordinate, this geometry is likely to be pertinent for catalysis. These conformational changes suggest increased order in the protein, but inhibitor binding is driven by favorable entropy. These changes are associated with ligand binding causing protein order but also inducing the release of water from the active site and from the trimer interface, consistent with entropy-driven ligand binding, despite a more ordered catalytic site region.
Figure 8.
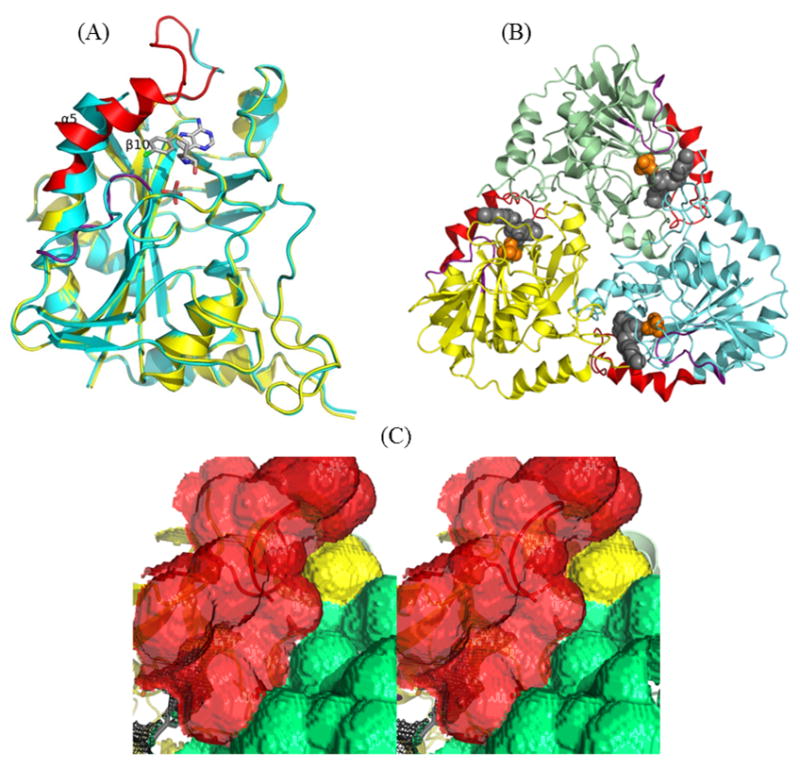
(A) The superimposed structures of apo (cyan) and p-Cl-PhT-DADMe-ImmA liganded (yellow) MTAP. The region from Thr219 to Asn245 and the loop of Gly16 to Glu24 of liganded MTAP are highlighted in red and purple, respectively, to emphasis the conformational difference. (B) The monomers of trimeric MTAP in complex with ligand are shown in cyan, green and yellow. The region from Thr219 to Asn245 and the loop of Gly16 to Glu24 of liganded MTAP are highlighted in red and purple, respectively. The p-Cl-PhT-DADMe-ImmA (gray) and phosphate (orange) included as space-filling models. (C) The cross-eyed stereoview of the solvent accessible surface of inhibitor bound MTAP highlighted via a Connolly surface (the molecular surface is generated using 1.4 A probe). The surface contributed from a protomer, the region from Thr219 to Asn245 and the adjacent subunit are colored in yellow, red and green, respectively. The enclosed active site pocket is drawn as black mesh.
Global conformation of Apo and Inhibitor-bound MTAP
Analytical sedimentation velocity analysis was used to probe whether inhibitor binding to MTAP would change the global conformation of MTAP. Increased entropy on inhibitor binding with local increased order in the catalytic sites suggests the entropic changes come from water interactions or from global expansion of the trimeric protein volume when complexed with inhibitors. The high precision of the interference scans analyzed by the time-derivative method of analytical ultracentrifugation allows subtle changes in sedimentation rate to be reliably measured. As summarized in Table 3, MT-DADMe-ImmA and p-Cl-PhT-DADMe- ImmA binding to MTAP results in faster sedimentation of both complexes even after correction for the increased molecular mass of the complexes. The most direct interpretation of these data is that inhibitor binding globally compacts MTAP. This agrees with the increased crystallographic order seen near the catalytic sites with inhibitor bound.
Table 3.
Compaction induced by transition state analogue binding revealed in the sedimentation rate of the MTAP complexes.a
| Sample | S(20,w) (normalized) | S(20,w) relative change |
|---|---|---|
| MTAP | 5.858 ± 0.021 | |
| MTAP + MT-DADMe-ImmA | 5.904 ± 0.016 | 0.79 ± 0.05 % |
| MTAP + p-Cl-PhT-DADMe-ImmA | 6.012 ± 0.067 | 2.63 ± 0.12 % |
The sedimentation coefficients determined for replicate experiments were averaged and the relative change in sedimentation coefficients (S(20,w)) are reported. The S values of the complexes are normalized for the increased molecular mass of the bound ligands.
Comparison of binding thermodynamics of PNP and MTAP
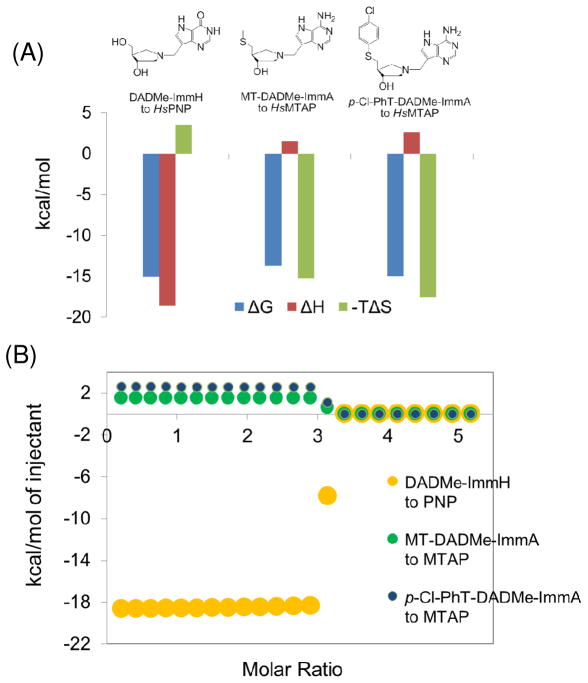
Human PNP and MTAP belong to the nucleoside phosphorylase-I structural family, are proposed to have evolved from a common ancestor and thus contain homologous structural elements (27). Despite the structural similarity, the catalytic site functions differ in extraordinary ways. For example, the binding thermodynamics of human PNP with an optimized 8.5 pM transition state analogue inhibitor features a ΔH term of −18.6 kcal/mol and a small unfavorable −TΔS term (12). The dominant ΔH term results from the hydrogen-bonding and ion-pair network formed upon inhibitor binding, which closely mimics the interactions at the enzyme transition state. The entropy penalty is readily explained from the increased order parameters of the protein:inhibitor complex (12). Since the overall structure and transition state analogue inhibitors of MTAP are similar to those of PNP, the thermodynamic properties of transition state analogues binding to MTAP are surprising in being driven completely by entropy with small unfavorable enthalpy terms (Fig. 9). The opposite binding thermodynamics for transition state analogues to related enzymes leads to the inescapable conclusion that interactions near the transition states differ substantially for PNP and MTAP despite common protein structural elements.
Figure 9.
Binding thermodynamics of PNP and MTAP. The thermodynamic signatures of PNP (12) and MTAP are compared for the binding of DADMe-ImmH (Ki of 8.5 pM) and MT-DADMe-ImmA (Ki of 90 pM) in panel A. The binding energy of PNP comes completely from favorable enthalpy with an entropic penalty. The tight binding of MTAP is driven by entropy with a minor enthalpy penalty. Thermodynamic titration data for PNP and MTAP are compared in the simulation in panel B.
Comparing the hydrogen bond and ion-pair networks at the active sites of MTAP and PNP with bound transition state analogues reveals similar types and numbers of interactions. However, interactions at the sugar pockets are significantly different near the 5′-positions. In PNP, the primary interaction to the 5′-OH group is a hydrogen bond interaction with His257. In MTAP, the 5′-hydrophobic group is surrounded by Val233, Val236, Leu237, and Val279, forming strong hydrophobic interactions. The removal of those hydrophobic residues from solvent supports a favorable entropy term upon inhibitor binding. In MTAP, His137 is from the adjacent subunit, forming van der Waals contacts near the 5′-position of the sugar with hydrogen bonds to His65. Leu237 is the other residue donated to the catalytic sites of MTAP by the adjacent subunit. In contrast, there are fewer contacts from adjacent subunits in the active sites of PNP. The interactions from neighboring subunit residues in the active site of MTAP are involved in rearrangement of the monomer interfaces upon inhibitor binding. These changes are proposed to contribute to the entropy term by releasing water molecules present in the apoenzyme. Overlays of crystal structures of apo MTAP and its inhibitor complexes do not show significant changes in the positions of Leu237 and His137, but altered dynamics of these regions might also contribute to entropic terms, but only in a local way that still permits compaction of the complex. The most significant conformational change upon inhibitor binding comes from the loop residues 227 to 235 in MTAP. This loop is flexible in the apo protein and allows the bulk solvent to reach the active sites. Binding of the inhibitor causes the conformational change of the loop and the closes the solvent channel to prevent access of solvent to the active site. The closure of the loop is thus consistent with the entropy-driven binding of the transition state analogue inhibitors.
Structural examination of PNP shows more subtle changes on substrate binding, accompanied by overall shrinkage of the protein as indicated by a 3% change in sedimentation velocity when a tight-binding inhibitor is bound (12). With MTAP we see a similar change of 2.63% increase in sedimentation velocity with p-Cl-PhT-DADMe-ImmA bound. The large hydrophobic group of p-Cl-PhT-DADMe-ImmA, loop motion to cause exclusion of water from the catalytic site and from subunit interfaces are dominant entropic forces that overwhelm the obvious enthalpic interactions of the catalytic site, including the formation of a new ion pair between the ribocation mimic and bound phosphate.
By making stable contacts to the enzyme to mimic interactions similar to the transition state, transition state analogues achieve tight binding to their cognate proteins. Here we show that these interactions can be manifested as an entropic change when the changes in water structure overwhelm the enthalpic interactions forming from catalytic site contacts. As two structurally and mechanistically related enzymes show dramatically different effects, it appears that each specific enzyme has novel mechanisms of converting bound complexes toward the transition state.
Acknowledgments
Structural data for this study were measured at beam line X29A of the National Synchrotron Light Source. The authors acknowledge members of the Carbohydrate Chemistry Team of Industrial Research Ltd (Lower Hutt, New Zealand) for their contribution to the synthesis and supply of transition state analogue inhibitors.
Financial support was also provided by the Offices of Biological and Environmental Research and of Basic Energy Sciences of the US Department of Energy.
Abbreviations
- MTA
5′-methylthioadenosine
- SAM
S-adenosyl-L-methionine
- MTAP
MTA phosphorylase
- PNP
purine nucleoside phosphorylase
- MTR-1-P
5-methylthioribose-α-D-1-phosphate
- ImmA
Immucillin-A
- DADMe
4′-deaza-1′-aza-2′-deoxy-1′-(9-methylene)
Footnotes
This work was supported by research grants CA135405 and GM41916 from the National Institutes of Health.
The Ki values listed for the Immucillin inhibitors is the equilibrium inhibition constant , previously referred to as Ki* from slow-onset kinetic studies.
References
- 1.Williams-Ashman HG, Seidenfeld J, Galletti P. Trends in the biochemical pharmacology of 5′-deoxy-5′-methylthioadenosine. Biochem Pharm. 1982;31:277–288. doi: 10.1016/0006-2952(82)90171-x. [DOI] [PubMed] [Google Scholar]
- 2.Cacciapuoti G, Oliva A, Zappia V. Studies on phosphate-activated 5′-methylthioadenosine nucleosidase from human placenta. Int J Biochem. 1978;9:35–41. doi: 10.1016/0020-711x(78)90135-0. [DOI] [PubMed] [Google Scholar]
- 3.Kamatani N, Carson DA. Dependence of adenine production upon polyamine synthesis in cultured human lymphoblasts. Biochim Biophys Acta. 1981;675:344–350. doi: 10.1016/0304-4165(81)90024-6. [DOI] [PubMed] [Google Scholar]
- 4.Wallace HM. Polyamines in human health. Proc Nutr Soc. 1996;55:419–431. doi: 10.1079/pns19960039. [DOI] [PubMed] [Google Scholar]
- 5.Singh V, Shi W, Evans GB, Tyler PC, Furneaux RH, Almo SC, Schramm VL. Picomolar transition state analogue inhibitors of human 5′-methylthioadenosine phosphorylase and x-ray structure with MT-Immucillin-A. Biochemistry. 2004;43:9–18. doi: 10.1021/bi0358420. [DOI] [PubMed] [Google Scholar]
- 6.Basu I, Cordovano G, Das I, Belbin TJ, Guha C, Schramm VL. A Transition state analogue of 5′-methylthioadenosine phosphorylase induces apoptosis in head and neck cancers. J Biol Chem. 2007;282:21477–21486. doi: 10.1074/jbc.M702287200. [DOI] [PubMed] [Google Scholar]
- 7.Appleby TC, Erion MD, Ealick SE. The structure of human 5′-deoxy-5′-methylthioadenosine phosphorylase at 1.7 angstrom resolution provides insights into substrate binding and catalysis. Structure. 1999;7:629–641. doi: 10.1016/s0969-2126(99)80084-7. [DOI] [PubMed] [Google Scholar]
- 8.Singh V, Schramm VL. Transition-state structure of human 5′-methylthioadenosine phosphorylase. J Am Chem Soc. 2006;128:14691–14696. doi: 10.1021/ja065419p. [DOI] [PMC free article] [PubMed] [Google Scholar]
- 9.Evans GB, Furneaux RH, Schramm VL, Singh V, Tyler PC. Targeting the polyamine pathway with transition-state analogue inhibitors of 5′-methylthioadenosine phosphorylase. J Med Chem. 2004;47:3275–3281. doi: 10.1021/jm0306475. [DOI] [PubMed] [Google Scholar]
- 10.Evans GB, Furneaux RH, Lenz DH, Painter GF, Schramm VL, Singh V, Tyler PC. Second generation transition state analogue inhibitors of human 5′-methylthioadenosine phosphorylase. J Med Chem. 2005;48:4679–4689. doi: 10.1021/jm050269z. [DOI] [PubMed] [Google Scholar]
- 11.Basu I, Locker J, Cassera MB, Belbin TJ, Merino EF, Dong X, Hemeon I, Evans GB, Guha C, Schramm VL. Growth and metastases of human lung cancer are inhibited in mouse xenografts by a transition state analogue of 5′-methylthioadenosine phosphorylase. J Biol Chem. 2011;286:4902–4911. doi: 10.1074/jbc.M110.198374. [DOI] [PMC free article] [PubMed] [Google Scholar]
- 12.Edwards AA, Mason JM, Clinch K, Tyler PC, Evans GB, Schramm VL. Altered enthalpy-entropy compensation in picomolar transition state analogues of human purine nucleoside phosphorylase. Biochemistry. 2009;48:5226–5238. doi: 10.1021/bi9005896. [DOI] [PMC free article] [PubMed] [Google Scholar]
- 13.Evans GB, Furneaux RH, Schramm VL, Singh V, Tyler PC. Targeting the polyamine pathway with transition-state analogue inhibitors of 5′-methylthioadenosine phosphorylase. J Med Chem. 2004;47:3275–3281. doi: 10.1021/jm0306475. [DOI] [PubMed] [Google Scholar]
- 14.Della Ragione F, Carteni-Farina M, Gragnaniello V, Schettino MI, Zappia V. Purification and characterization of 5′-deoxy-5′-methylthioadenosine phosphorylase from human placenta. J Biol Chem. 1986;261:12324–12329. [PubMed] [Google Scholar]
- 15.Singh V, Evans GB, Lenz DH, Mason JM, Clinch K, Mee S, Painter GF, Tyler PC, Furneaux RH, Lee JE, Howell PL, Schramm VL. Femtomolar transition state analogue inhibitors of 5′-methylthioadenosine/S-adenosylhomocysteine nucleosidase from Escherichia coli. J Biol Chem. 2005;280:18265–18273. doi: 10.1074/jbc.M414472200. [DOI] [PubMed] [Google Scholar]
- 16.Kung P-P, Zehnder LR, Meng JJ, Kupchinsky SW, Skalitzky DJ, Johnson MC, Maegley KA, Ekker A, Kuhn LA, Rose PW, Bloom LA. Design, synthesis, and biological evaluation of novel human 5′-deoxy-5′-methylthioadenosine phosphorylase (MTAP) substrates. Bioorg Med Chem Lett. 2005;15:2829–2833. doi: 10.1016/j.bmcl.2005.03.107. [DOI] [PubMed] [Google Scholar]
- 17.Chaires JB. Possible origin of differences between van’t Hoff and calorimetric enthalpy estimates. Biophys Chem. 1997;64:15–23. doi: 10.1016/s0301-4622(96)02205-3. [DOI] [PubMed] [Google Scholar]
- 18.Otwinowski Z, Minor W. Processing of X-ray diffraction data collected in oscillation mode. Method Enzymol. 1997;276:307–326. doi: 10.1016/S0076-6879(97)76066-X. [DOI] [PubMed] [Google Scholar]
- 19.The CCP4 suite: programs for protein crystallography. Acta Crystallogr D Biol Crystallogr. 1994;50:760–763. doi: 10.1107/S0907444994003112. [DOI] [PubMed] [Google Scholar]
- 20.Emsley P, Cowtan K. Coot: model-building tools for molecular graphics. Acta Crystallogr D Biol Crystallogr. 2004;60:2126–2132. doi: 10.1107/S0907444904019158. [DOI] [PubMed] [Google Scholar]
- 21.Potterton E, Briggs P, Turkenburg M, Dodson E. A graphical user interface to the CCP4 program suite, Acta Crystallogr. D Biol Crystallogr. 2003;59:1131–1137. doi: 10.1107/s0907444903008126. [DOI] [PubMed] [Google Scholar]
- 22.Edwards AA, Tipton JD, Brenowitz MD, Emmett MR, Marshall AG, Evans GB, Tyler PC, Schramm VL. Conformational states of human purine nucleoside phosphorylase at rest, at work and with transition state analogues. Biochemistry. 2010;49:2058–2067. doi: 10.1021/bi902041j. [DOI] [PMC free article] [PubMed] [Google Scholar]
- 23.Miles RW, Tyler PC, Furneaux RH, Bagdassarian CK, Schramm VL. One-third-the- sites transition-state inhibitors for purine nucleoside phosphorylase. Biochemistry. 1998;37:8615–8621. doi: 10.1021/bi980658d. [DOI] [PubMed] [Google Scholar]
- 24.Niedzwiecka A, Stepinski J, Darzynkiewicz E, Sonenberg N, Stolarski R. Positive heat capacity change upon specific binding of translation initiation factor eIF4E to mRNA 5′ cap. Biochemistry. 2002;41:12140–12148. doi: 10.1021/bi0258142. [DOI] [PubMed] [Google Scholar]
- 25.Eftink MR, Anusiem AC, Biltonen RL. Enthalpy-entropy compensation and heat capacity changes for protein-ligand interactions: general thermodynamic models and data for the binding of nucleotides to ribonuclease A. Biochemistry. 1983;22:3884–3896. doi: 10.1021/bi00285a025. [DOI] [PubMed] [Google Scholar]
- 26.Chervenak MC, Toone EJ. Calorimetric analysis of the binding of lectins with overlapping carbohydrate-binding ligand specificities. Biochemistry. 1995;34:5685–5695. doi: 10.1021/bi00016a045. [DOI] [PubMed] [Google Scholar]
- 27.Pugmire MJ, Ealick SE. Structural analyses reveals two distinct families of nucleoside phosphorylases. Biochem J. 2002;361:1–25. doi: 10.1042/0264-6021:3610001. [DOI] [PMC free article] [PubMed] [Google Scholar]


