Abstract
Extracellular ATP regulates many important cellular functions in the liver by stimulating purinergic receptors. Recent studies have shown that rapid exocytosis of ATP-enriched vesicles contributes to ATP release from liver cells. However, this rapid ATP release is transient, and ceases in ~30 s after the exposure to hypotonic solution. The purpose of these studies was to assess the role of vesicular exocytosis in sustained ATP release. An exposure to hypotonic solution evoked sustained ATP release that persisted for more than 15 min after the exposure. Using FM1-43 (N-(3-triethylammoniumpropyl)-4-(4-(dibutylamino)styryl)pyridinium dibromide) fluorescence to measure exocytosis, we found that hypotonic solution stimulated a transient increase in FM1-43 fluorescence that lasted ~2 min. Notably, the rate of FM1-43 fluorescence and the magnitude of ATP release were not correlated, indicating that vesicular exocytosis may not mediate sustained ATP release from liver cells. Interestingly, mefloquine potently inhibited sustained ATP release, but did not inhibit an increase in FM1-43 fluorescence evoked by hypotonic solution. Consistent with these findings, when exocytosis of ATP-enriched vesicles was specifically stimulated by 5-nitro-2-(3-phenylpropylamino)benzoic acid (NPPB), mefloquine failed to inhibit ATP release evoked by NPPB. Thus, mefloquine can pharmacologically dissociate sustained ATP release and vesicular exocytosis. These results suggest that a distinct mefloquine-sensitive membrane ATP transport may contribute to sustained ATP release from liver cells. This novel mechanism of membrane ATP transport may play an important role in the regulation of purinergic signaling in liver cells.
Keywords: Bioluminescence, ATP release, Exocytosis, FM1-43 fluorescence
Introduction
An increase in hepatocyte volume is a potent signal for stimulation of protein synthesis, bile secretion and gene expression in the liver [1–3]. Changes in hepatocyte volume contribute to stimulation of liver metabolic functions by circulating hormones [4]. Because cell volume is regulated by transport of ions, organic osmolytes and metabolites across the plasma membrane, liver cell volume represents a physiologically important mechanism for coupling changes in membrane transport to other cell and organ functions. Failure to regulate cell volume has been implicated in liver cell injury associated with alcohol, ischemia/reperfusion, and organ preservation [5–7]. Accordingly, regulation of liver cell volume is critical for stimulation of many important physiological functions, and the prevention of liver cell injury. Multiple lines of evidence suggest that increases in liver cell volume stimulate release of intracellular ATP [8, 9]. Once outside the cell, extracellular ATP acts as a potent signaling molecule by stimulating purinergic receptors in the plasma membrane. Activation of these receptors leads to activation of the plasma membrane Cl− channels that restores cell volume to the basal values [10, 11]. Thus, ATP release plays a key role in the regulation of liver cell volume and purinergic signaling in liver cells.
Cells release ATP by diffusion of intracellular ATP through transporters and/or channel proteins in the plasma membrane. There is evidence for ATP release through ATP-binding cassette (ABC) transporters, connexin hemichannels and multiple Cl− channels [12–14]. More recent studies have found that pannexin1 hemichannels play a key role in ATP release from many different cells [15–18]. Vesicular exocytosis may also contribute to ATP release [19–21]. Under basal conditions, the concentration of ATP in extracellular media is in a low nanomolar range. Vesicles store ATP in millimolar range, and exocytosis of these ATP-enriched vesicles increases extracellular ATP concentration. Using quinacrine fluorescence to monitor exocytosis of ATP-enriched vesicles, recent studies have shown that exocytosis of these vesicles contributes to ATP release from liver cells [20]. Exocytosis of ATP-enriched vesicles is rapid and ceases within ~30 s after the exposure to hypotonic solution [20]. Accordingly, the authors suggested that exocytosis of ATP-enriched vesicles may be involved in initiation of purinergic signaling in liver cells. It is well documented that ATP release from liver cells is sustained, and persists for many minutes after the exposure to hypotonic solution [8, 20, 22–24]. While exocytosis of ATP-enriched vesicles may explain the initial rapid phase of cellular ATP release, it is not known whether vesicular exocytosis and/or potentially other mechanisms of ATP transport mediate the later sustained phase of ATP release.
Membrane fluorescent marker N-(3-triethylammoniumpropyl)-4-(4-(dibutylamino)styryl)pyridinium dibromide (FM1-43) has been widely used to study vesicular exocytosis in many different cells [25]. The dye is not fluorescent in solution, but it becomes fluorescent upon binding to the biological membranes. In the presence of FM1-43, exocytic insertion of vesicles into the plasma membrane results in staining of the vesicle membrane, and an increase in FM1-43 fluorescence [26, 27]. Thus, FM1-43 fluorescence provides a measure of cellular exocytic activity resulting from exocytosis of all vesicles including ATP-enriched vesicles. Using FM1-43 fluorescence, it has been shown that phosphoinositide 3-kinase (PI 3-kinase) and protein kinase C (PKC) are required for stimulation of both vesicular exocytosis and ATP release from biliary cells [21]. These findings indicate that vesicular exocytosis may mediate ATP release from biliary cells. Similar to biliary cells, PI 3-kinase and PKC have been reported to modulate ATP release from liver cells [20, 24]. However, it is not known whether these kinases are involved in the regulation of sustained ATP release from liver cells.
Based on these considerations, the purpose of these studies was to assess the role of vesicular exocytosis in sustained ATP release from liver cells. Using bioluminescence to measure ATP release and FM1-43 fluorescence to measure vesicular exocytosis, we characterized a novel mechanism of membrane ATP transport that significantly contributes to sustained ATP release from liver cells. This novel mechanism of ATP transport is potently inhibited by mefloquine, and is not mediated by vesicular exocytosis. Thus, mefloquine-sensitive ATP transport may contribute to the regulation of cell volume and purinergic signaling in liver cells.
Materials and methods
Cell cultures
All studies were performed in rat HTC cells. These cells have been utilized as a liver cell model line to study hepatocyte ATP release, purinergic signaling and the regulation of cell volume [13, 28]. HTC cells are derived from rat hepatoma, and the procedures for culturing these cells have been previously described [29]. Cells were used within 48 h after plating.
Drugs and chemicals
Carbenoxolone disodium salt (CBX), suramin, mefloquine hydrochloride (MFQ, catalog# M2319) and chelerythrine chloride were from Sigma-Aldrich (St. Louis, MO). Probenecid was from Invitrogen (Carlsbad, CA; catalog# P36400). Bafilomycin A1, phorbol 12-myristate 13-acetate (PMA), 2-(4-morpholinyl)-8-phenyl-1(4H)-benzopyran-4-one hydrochloride (LY294002) and wortmannin were from EMD Chemicals (Gibbstown, NJ). Flufenamic acid (FFA) was from Fluka/Sigma-Aldrich (St. Louis, MO).
Measurement of ATP release
ATP release was measured using the luciferin–luciferase assay as previously described [8, 30]. HTC cells were grown to confluence in 35-mm Petri dishes. Prior to study, cells were gently washed twice with 1 ml of OptiMEM (Gibco). Subsequently, 800 ml of OptiMEM containing 2 mg/ml firefly luciferin–luciferase (Sigma, cat. num. FLAAM-5VL) was added to the dish. The dish was placed in a TD 20/20 Luminometer (Turner Designs), and the intensity of emitted light (luminescence) was measured every 10 s in real time using a 5-s integration interval. Luminescence was expressed as counts in luminometer readings. Luminescence measured under cell-free conditions (dishes plus OptiMEM) was about 0.05% of basal cellular luminescence indicating that ATP detected in extracellular media is derived from cells. The effect of different drugs was assessed by adding 5 microliters of stock solution to the edge of a dish, and then mixing to allow drugs to equilibrate within the dish. Identical volumes of OptiMEM were added in control studies to dissociate the effects of drugs from mechanical stimulation of ATP release. These effects were typically about 5% of basal luminescence. At the concentrations used, d-luciferin was present in excess and not rate limiting, so that the reagent was available to react with ATP molecules released from cells into extracellular media. The effect of hypotonic solution (30% dilution with water) on ATP release was assessed by measuring luminescence after adding 400 microliters of water with 2 mg/ml firefly luciferin–luciferase to the edge of a dish, and then mixing to allow for even dilution within the dish. In some experiments, to maintain extracellular osmolarity constant and prevent cell swelling, 100 mM d-sucrose was added together with water. This solution referred as hypotonic + sucrose had the same dilution of ions as hypotonic solution, and the same osmolarity as OptiMEM.
To minimize mechanical stimulation of ATP release evoked by addition of water to a dish, water was automatically dispensed to a dish using an Eppendorf Xplorer pipetter (Eppendorf AG, Hamburg, Germany) at a constant dispensing speed of about 70 μl/s. In order to produce efficient mixing of solutions within a dish, and to minimize ATP release evoked by mixing, dish was placed on a rocker 35/35D (Labnet International Inc., Woodbridge, NJ), and then allowed to tilt ten times for ~1 min prior to the placement in luminometer.
To account for the effect of hypotonic solution on the sensitivity of luciferin–luciferase assay to ATP, luminescence change was measured as a difference between luminescence readings 20 s after the initial rapid increase and 15 min after exposure to hypotonic solution. The initial rapid increase in luminescence was due in large part to an increase in the sensitivity of luciferin–luciferase to ATP caused by a decrease in ion concentrations in the hypotonic solution (see Fig. 1c).
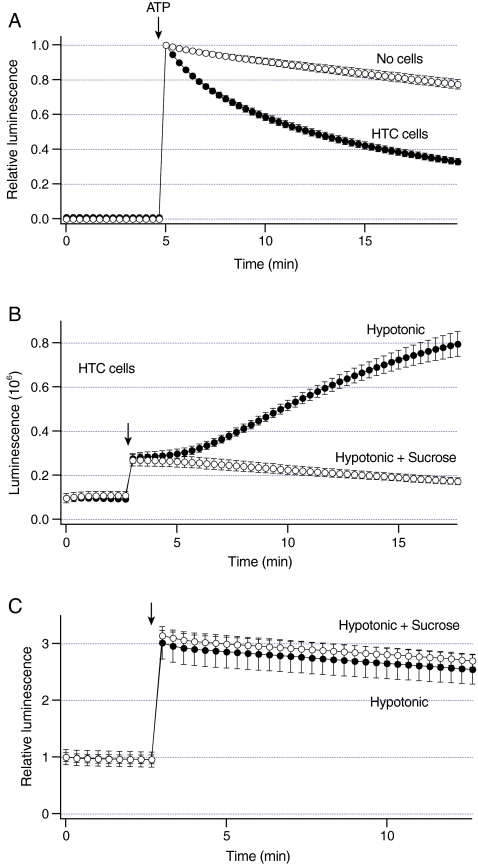
Fig. 1.
Increases in liver cell volume stimulate sustained ATP release.a Luminescence was measured from dishes with HTC cells (closed circles, n = 6 dishes) and no cells (open circles, n = 3 dishes). 500 nM ATP was added at arrow. Note that exogenous ATP is rapidly hydrolyzed in the presence of cells. b Luminescence was measured from dishes with HTC cells. Under basal conditions, these cells exhibit constitutive ATP release as indicated by non-zero luminescence values. Exposure to hypotonic solution (30% dilution) at arrow rapidly increased luminescence to a steady-state level (closed circles, n = 5 dishes). After ~2 min, luminescence gradually increased at a constant rate. In some experiments, cells were exposed to a solution that was a mixture of hypotonic solution and sucrose. This solution has the same osmolarity as control solution, and does not increase cell volume. Exposure to hypotonic + sucrose rapidly increased luminescence, but failed to further increase luminescence (open circles, n = 4 dishes). c Luminescence was measured from the dishes with no cells containing 20 nM ATP. Exposure to hypotonic solution at arrow rapidly increased relative luminescence (closed circles, n = 4 dishes). Similar changes were obtained after exposure to hypotonic + sucrose (open circles, n = 3 dishes)
Solutions for imaging
All imaging experiments were performed after washing culture medium with a standard physiologic solution that contained 142 mM NaCl, 4 mM KCl, 1 mM KH2PO4, 2 mM MgCl2, 2 mM CaCl2, 10 mM HEPES, 10 mM d-glucose. The pH was 7.25, and osmolarity was 295–305 mosmol kg−1. All compounds were purchased from Sigma-Aldrich.
Imaging and analysis
For imaging experiments, cells were plated on coverslips in the recording chambers, and incubated overnight in the culture media as described above. Cells were washed with a standard physiologic solution, and visualized through a 40× oil immersion objective (NA = 1.35) and an Olympus IX71 microscope. The images were acquired with a Sensicam QE camera controlled by a SlideBook 3.0 software (Intelligent Imaging Innovations, Denver, CO). Cellular fluorescence was measured by drawing a region of interest over the entire cell, and subtracting background fluorescence. Background fluorescence was measured from the regions with no cells.
Measurement of exocytosis
The magnitude of exocytosis was measured using a fluorescent dye FM1-43 (Invitrogen) as previously described [31]. FM1-43 binds to membranes but does not permeate through lipid bilayers. The dye is not fluorescent in solution, but it becomes fluorescent upon binding to the biological membranes [25]. In the presence of FM1-43 in the extracellular solution, exocytic insertion of vesicles into the plasma membrane results in staining of the vesicle membrane and an increase in FM1-43 fluorescence. Thus, the overall change in FM1-43 fluorescence provides in real time a measure of the sum of all exocytic events [26, 27]. For these experiments, cells were stained with 4 μM of FM1-43. The fluorescence was excited with an excitation filter (peak 480 nm) and collected with an emission filter (peak 535 nm). FM1-43 fluorescence was measured every 30 s using exposures of 200 ms. The initial staining of the plasma membrane was used to determine a baseline fluorescence (100%). The magnitude of exocytosis evoked by hypotonic solution was determined as a change in FM1-43 fluorescence (in %) 5 min after the exposure to hypotonic solution.
Statistics
Data were expressed as mean ± SEM. Results were compared using a two-tailed Student’s t-test on paired and unpaired data, and P values <0.05 were considered as statistically significant.
Results
Characterization of sustained ATP release from liver cells
The amount of ATP in the extracellular solution was measured using luminescence of luciferin–luciferase. Because luminescence reflects the balance between cellular ATP release and hydrolysis, we assessed whether HTC are capable of hydrolyzing ATP. In these experiments, 500 nM ATP was added to a dish with cells or no cells (Fig. 1a). Addition of ATP rapidly increased luminescence that decayed with a half-time of 7.3 ± 0.6 min (n = 6 dishes). Thus, HTC cells are capable of hydrolyzing ATP.
To assess whether increases in liver cell volume stimulate ATP release, luminescence was measured after the exposure to hypotonic solution. Representative recordings in Fig. 1b illustrate that hypotonic solution rapidly increased luminescence to a steady-state. This rapid increase was followed by a slow gradual increase in luminescence that persisted for many minutes after the hypotonic exposure. When cell swelling was prevented by exposing cells to a solution that was a mixture of hypotonic solution and sucrose to maintain the extracellular osmolarity constant, only the rapid increase in luminescence was observed (Fig. 1b). To assess whether this rapid increase was due to the effect of hypotonic solution on the sensitivity of the luciferin–luciferase assay to ATP, luminescence of ATP standard solution was measured in the absence of cells. Figure 1c shows that hypotonic solution rapidly increased luminescence of standard ATP solution by ~2-fold. Similar increases were observed with hypotonic solution and sucrose (Fig. 1c). These data indicate that changes in ion concentrations, and not changes in the extracellular osmolarity may influence the sensitivity of luciferin–luciferase assay to ATP. These data also indicate that a slow gradual increase in luminescence may represent sustained ATP release from HTC cells.
The magnitude of luminescence evoked by hypotonic solution in HTC cells exhibited a day-to-day variability ranging from ~40% to more than a 6-fold increase above the control values. Thus, to minimize errors in comparing the data under different conditions, data were compared with the corresponding controls on that day. The reasons for this variability are not known, and this variability has been previously observed in HTC cells [22, 23].
Role of vesicular exocytosis in sustained ATP release
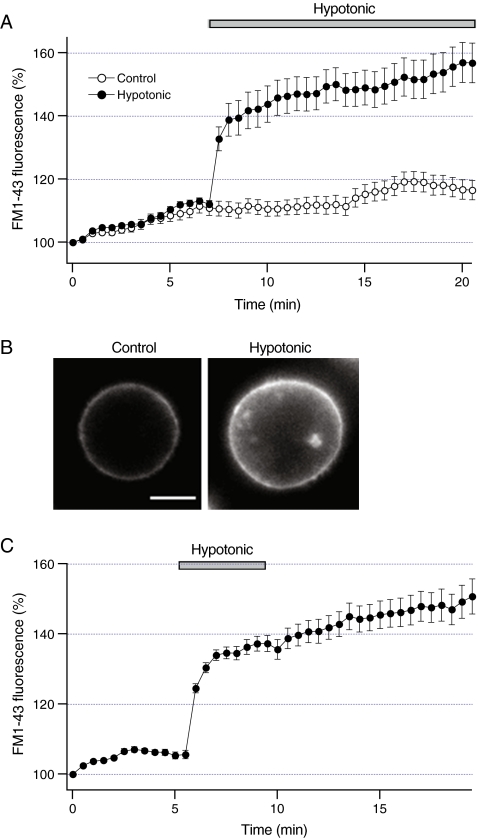
Recent studies have shown that exocytosis of ATP-enriched vesicles contributes to the initial rapid phase of ATP release from HTC cells [20]. To assess whether vesicular exocytosis contributes to sustained ATP release, FM1-43 fluorescence was measured after the exposure to hypotonic solution. Consistent with previous studies, Fig. 2a shows that under basal conditions FM1-43 fluorescence gradually increased at a constant rate (~2% per minute) indicating that HTC cells exhibit constitutive exocytosis [31]. Exposure to hypotonic solution stimulated a rapid increase in FM1-43 fluorescence that lasted ~2 min, after which the rate of exocytosis returned to the values close to the basal values (Fig. 2a). Representative fluorescent images in Fig. 2b illustrate that hypotonic solution increased both cell volume and FM1-43 fluorescence. We have previously shown that hypotonic solution increases FM1-43 fluorescence in chromaffin cells as a result of increases in membrane tension [27]. To assess whether changes in membrane tension also modulate FM1-43 fluorescence in liver cells, cells were briefly exposed to hypotonic solution in the presence of FM1-43 (Fig. 2c). If increases in membrane tension are responsible for increases in FM1-43 fluorescence, then removing hypotonic solution would be anticipated to decrease the fluorescence. Figure 2c shows that subsequent perfusion with control solution did not significantly decrease FM1-43 fluorescence, and the fluorescence remained elevated many minutes after the exposure to control solution. Thus, it is likely that increases in FM1-43 fluorescence result from stimulation of vesicular exocytosis and not increases in membrane tension. These findings indicate that hypotonic solution stimulates vesicular exocytosis in HTC cells.
Fig. 2.
Increases in liver cell volume stimulate transient exocytosis.a FM1-43 fluorescence was measured from HTC cells under control conditions (n = 7 cells, open circles) or after exposure to hypotonic solution (30% dilution, closed bar) (n = 5 cells, closed circles). Note that hypotonic solution rapidly increased FM1-43 fluorescence. bLeft panel shows a fluorescent image of a cell obtained after staining the plasma membrane with FM1-43. Right panel shows the same cell 10 min after the exposure to hypotonic solution. Note that hypotonic solution increased both cell volume and FM1-43 fluorescence. Scale bar is 5 micrometer. c Cells were exposed to hypotonic solution (closed bar) for 4 min in the presence of FM1-43. Hypotonic solution increased FM1-43 fluorescence within minutes of the exposure. Note that subsequent perfusion with control isotonic solution did not significantly change FM1-43 fluorescence. Data were obtained from ten cells
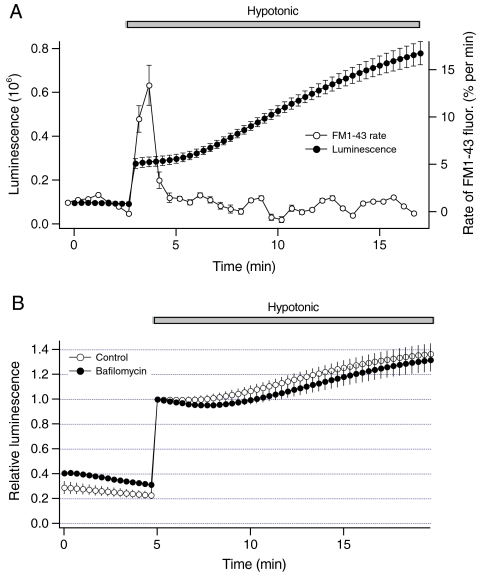
To further examine the relationship between exocytosis and ATP release, the rate of FM1-43 fluorescence obtained from Fig. 2a was plotted on the same time scale with luminescence data from Fig. 1b. The graph in Fig. 3a illustrates that the rate of FM1-43 fluorescence and the magnitude of luminescence were not proportional. While sustained ATP release persisted for more than 15 min after the hypotonic exposure, rapid increase in the rate of FM1-43 fluorescence was transient and returned to the basal level within ~2 min. Although the rate of FM1-43 fluorescence and the magnitude of luminescence were not proportional, exocytosis of ATP-enriched vesicles may have contributed to sustained ATP release if hypotonic solution increased the amount of ATP in the vesicle. To assess this possibility, sustained ATP release was measured after blocking storage of ATP in the vesicle with bafilomycin A1. This macrolide antibiotic is a potent inhibitor of V-type ATPase, and impairs storage of ATP and exocytosis of ATP-enriched vesicles evoked by hypotonic solution in HTC cells [20]. Figure 3b shows that bafilomycin A1 did not significantly inhibit sustained ATP release. These findings indicate that exocytosis of ATP-enriched vesicles may not directly mediate sustained ATP release from HTC cells.
Fig. 3.
Vesicular exocytosis does not mediate sustained ATP release from liver cells. a Luminescence from Fig. 1b shown on the left axis was measured after exposure to hypotonic solution (closed circles, n = 4 dishes). On the right axis, the rate of FM1-43 fluorescence (open circles) was obtained by calculating a slope of the data from Fig. 2a. Note that the rate of FM1-43 fluorescence and the magnitude of sustained ATP release are not proportional. b Luminescence was measured from cells that were preincubated with 2 microM bafilomycin A1 for 1 h. Bafilomycin A1 impairs the storage of ATP in the vesicles, and exocytosis of ATP-enriched vesicles evoked by hypotonic solution in HTC cells. Note that bafilomycin A1 did not inhibit sustained ATP release
Effects of pannexin1 inhibitors on sustained ATP release
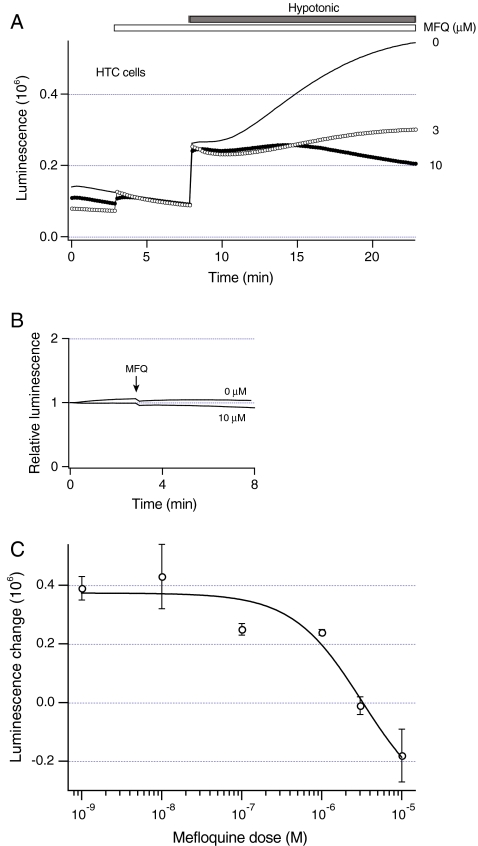
The data presented above suggest that in addition to exocytosis of ATP-enriched vesicles as recently described [20], other mechanisms may also contribute to ATP release from HTC cells. These mechanisms become dominant at the later times, and may mediate sustained ATP release. Accordingly, the role of membrane ATP transporters was assessed. Many cells release ATP through pannexin1 hemichannels, and mefloquine has been reported to inhibit ATP release through pannexin1 hemichannels [17]. To assess whether mefloquine modulates ATP release, HTC cells were exposed to different concentrations of mefloquine for 5 min before the exposure to hypotonic solution. Representative recordings in Fig. 4a show that the increasing concentrations of mefloquine progressively decreased sustained ATP release. Mefloquine did not change luminescence of ATP standard solution (Fig. 4b), indicating that mefloquine does not change the sensitivity of luciferin-luciferase assay to ATP. The effect of mefloquine was further examined by measuring a change in luminescence evoked by hypotonic solution in the presence of different mefloquine concentrations. Figure 4c shows that mefloquine inhibited sustained ATP release in a concentration-dependent manner with the IC50 of 3.2 ± 2.3 microM. These data indicate that mefloquine potently inhibits sustained ATP release from HTC cells.
Fig. 4.
Mefloquine inhibits sustained ATP release from liver cells. a Luminescence was measured from dishes with HTC cells. Before exposure to hypotonic solution (30% dilution, closed bar), cells were pretreated with different concentration of mefloquine for 5 min (open bar). The concentrations of mefloquine are shown in millimolar. Note that mefloquine inhibits sustained ATP release evoked by hypotonic solution. b Luminescence was measured from dishes with no cells that contained 20 nM ATP. Exposure to 10 microM mefloquine or equal volume of OptiMEM (at arrow) had similar effects on luminescence. c Luminescence was measured from dishes with HTC cells in the presence of different mefloquine concentrations (open circles). To eliminate the effects of hypotonic solution on the sensitivity of luciferin–luciferase to ATP, change in luminescence evoked by hypotonic solution was determined as a difference between luminescence readings 20 s after the initial rapid increase and 15 min after the exposure to hypotonic solution (see Materials and methods). Solid line represents the best fit to an inhibition curve. The number of dishes ranged from 3 to 20
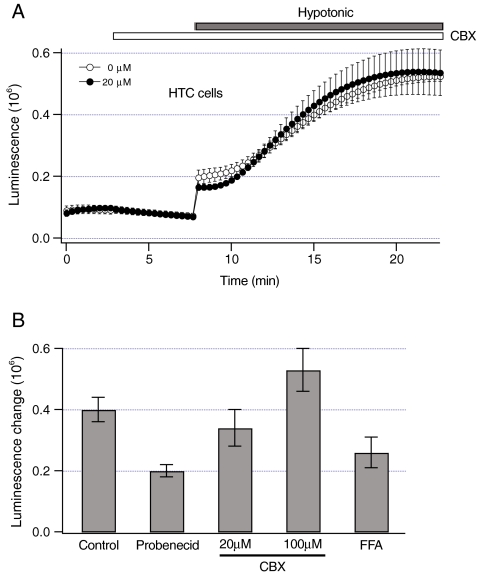
To further assess the role of pannexin1, other pannexin1 inhibitors were tested. The data in Fig. 5 show that CBX did not significantly inhibit sustained ATP release (P > 0.55). Because CBX also inhibits other connexin-based hemichannels and volume-dependent anion channels, we used more specific pannexin1 inhibitor probenecid. Probenecid inhibited sustained ATP release by ~50% (P < 0.05, Fig. 5b). Both CBX and probenecid did not change the sensitivity of luciferin–luciferase to ATP (data not shown). Suramin, another pannexin1 inhibitor could not be used since it potently decreased the sensitivity of luciferin–luciferase to ATP (data not shown). Collectively, these data indicate that pannexin1 hemichannels may contribute to sustained ATP release from HTC cells.
Fig. 5.
Effects of pannexin1 inhibitors on sustained ATP release. a Luminescence was measured from dishes with HTC cells in response to hypotonic solution (30% dilution, closed bar) under control conditions (n = 4 dishes, open circles). In some experiments, cells were pretreated with 20 microM CBX for 5 min (open bar) before the exposure to hypotonic solution (n = 6 dishes, closed circles). Note that CBX did not inhibit ATP release. b Luminescence change evoked by hypotonic solution was measured as described in Materials and methods from dishes with HTC cells pretreated with pannexin1 inhibitors for 5 min before the exposure to hypotonic solution. The concentration of inhibitors was 1 mM for probenecid, and 0.1 mM for FFA. CBX was used at 20 or 100 microM. Because FFA decreased the sensitivity of luciferin–luciferase to ATP by ~60%, luminescence measured in the presence of FFA was multiplied by 2.5. The number of dishes ranged from 4 to 19
Similar to CBX, mefloquine also inhibits certain connexin hemichannels [32]. Consequently, to assess whether connexin channels contribute to sustained ATP release, luminescence was measured from HTC cells in the presence of FFA, a potent blocker of connexin channels. FFA decreased the sensitivity of luciferin–luciferase to ATP by ~60% (data not shown). After correcting luminescence for this decrease, FFA did not significantly inhibit sustained ATP release (P > 0.18, Fig. 5b). Thus, it is unlikely that connexin channels are involved in sustained ATP release from HTC cells.
Effect of mefloquine on vesicular exocytosis
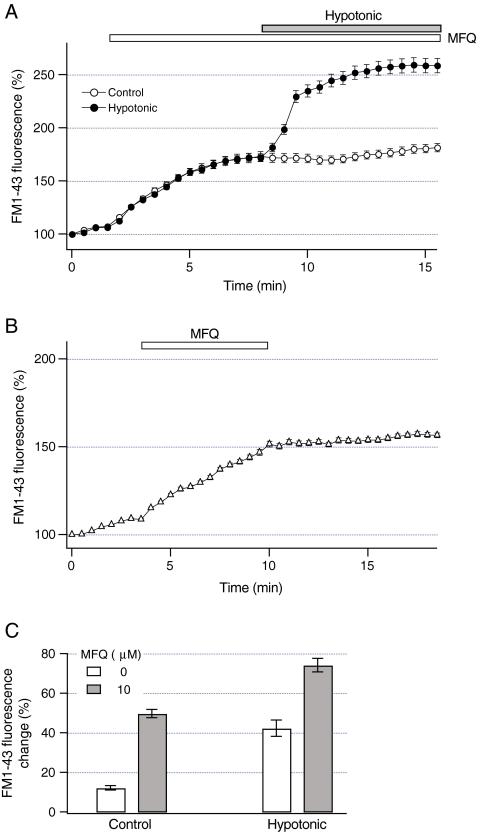
The data in Fig. 3 indicate that vesicular exocytosis may not directly mediate sustained ATP release. However, exocytosis could contribute to sustained ATP release by inserting ATP transporters into the plasma membrane of HTC cells. This implies that mefloquine could block ATP release by inhibiting exocytosis evoked by hypotonic solution. To assess whether mefloquine modulates exocytosis, FM1-43 fluorescence was measured after the exposure to hypotonic solution in the presence of mefloquine. Representative recordings in Fig. 6a show that mefloquine per se transiently increased FM1-43 fluorescence (P < 0.001). To determine whether this effect is due to increases in the binding affinity of the plasma membrane to FM1-43, FM1-43 fluorescence was measured after mefloquine was washed out. Figure 6b shows that FM1-43 fluorescence did not decrease after mefloquine was removed from the extracellular solution, indicating that mefloquine does not increase the binding affinity of FM1-43 to the plasma membrane, but rather stimulates vesicular exocytosis. Notably, in the presence of mefloquine, subsequent exposure to hypotonic solution rapidly increased FM1-43 fluorescence (Fig. 6a). The FM1-43 fluorescence change evoked by hypotonic solution increased by ~75% in the presence of mefloquine (P < 0.001, Fig. 6c). Thus, mefloquine does not inhibit exocytosis evoked by hypotonic solution, and can pharmacologically dissociate vesicular exocytosis and sustained ATP release.
Fig. 6.
Mefloquine does not inhibit vesicular exocytosis. a FM1-43 fluorescence was measured in HTC cells after the exposure to 10 microM mefloquine (open circles, n = 8 cells). FM1-43 fluorescence was also measured from cells exposed to 10 microM mefloquine for 5 min before the exposure to hypotonic solution (30% dilution, closed circles, n = 13 cells). Note that mefloquine did not inhibit an increase in FM1-43 fluorescence evoked by hypotonic solution. b FM1-43 fluorescence was measured after the exposure to mefloquine (10 microM for 7 min, open bar). Note that removal of mefloquine did not decrease FM1-43 fluorescence (n = 13 cells). c Magnitude of constitutive exocytosis under control conditions was measured as a change in FM1-43 fluorescence that occurred 5 min after the exposure to 10 microM mefloquine (closed bar) or in the absence of mefloquine (open bar). The magnitude of exocytosis evoked by hypotonic solution was measured as a change in FM1-43 fluorescence that occurred 5 min after the exposure to hypotonic solution in the presence of 10 microM mefloquine (closed bar) or absence of mefloquine (open bar). Note that mefloquine did not inhibit exocytosis evoked by hypotonic solution. The number of analyzed cells ranged from 12 to 34
Effect of mefloquine on exocytosis of ATP-enriched vesicles
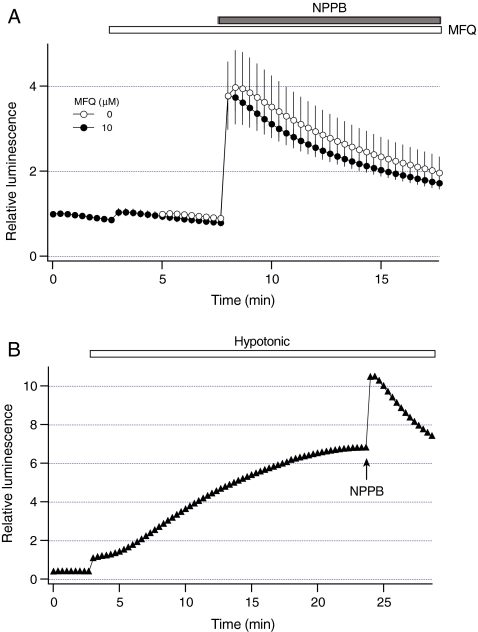
To further examine the effects of mefloquine, we assessed whether mefloquine is able to inhibit exocytosis of ATP-enriched vesicles. Our recent studies have shown that 5-nitro-2-(3-phenylpropylamino)benzoic acid (NPPB) specifically stimulates exocytosis of ATP-enriched vesicles in the absence of changes in cell volume [33]. For these experiments, cells were exposed to NPPB and luminescence was measured in the presence or absence of mefloquine. Figure 7a shows that mefloquine did not inhibit ATP release evoked by NPPB. Maximal change in relative luminescence evoked by NPPB was 3.0 ± 0.9 (n = 3 dishes), and was not significantly different in the presence of mefloquine 2.8 ± 0.4 (n = 3 dishes, P > 0.39). These data indicate that mefloquine does not inhibit exocytosis of ATP-enriched vesicles, and it is unlikely that exocytosis of these vesicles contribute to mefloquine-sensitive sustained ATP release from HTC cells.
Fig. 7.
Mefloquine does not inhibit exocytosis of ATP-enriched vesicles. a Luminescence was measured in HTC cells after exposure to 100 microM NPPB (closed bar) under control conditions (open circles, n = 3 dishes). Because NPPB decreases the sensitivity of luciferin–luciferase to ATP by ~50% [33], luminescence measured in the presence of NPPB was multiplied by 2. Luminescence was also measured from cells that were exposed to 10 microM mefloquine (open bar, closed circles, n = 3 dishes) for 5 min before the exposure to NPPB. Note that mefloquine did not significantly inhibit ATP release evoked by NPPB. b Representative luminescence recording from a dish with HTC cells (closed triangles) after the exposure to hypotonic solution (30% dilution, open bar). NPPB (100 microM) was applied at arrow 20 min after the exposure to hypotonic solution. Note that NPPB stimulated ATP release in the presence of hypotonic solution
If exocytosis of ATP-enriched vesicles is not responsible for sustained ATP release, then NPPB would be expected to stimulate ATP release during the hypotonic exposure. To test this hypothesis, NPPB was added 20 min after the exposure to hypotonic solution. Representative recordings in Fig. 7b illustrate that in the presence of hypotonic solution, NPPB stimulated an additional increase in luminescence. Under these conditions, maximal change in relative luminescence evoked by NPPB was 2.6 ± 0.3 (n = 4 dishes), and was not significantly different when measured under control conditions (P > 0.32). Thus, NPPB is able to stimulate exocytosis of ATP-enriched vesicles even after stimulation of sustained ATP release.
Regulation of vesicular exocytosis and sustained ATP release by PKC and PI 3-kinase
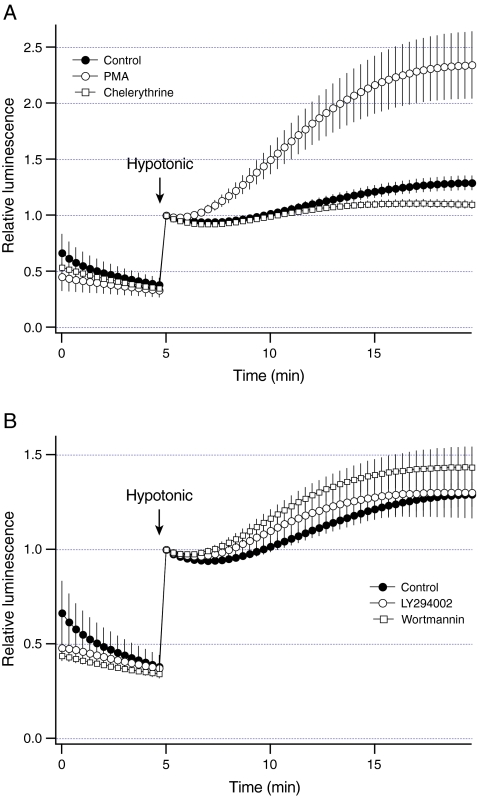
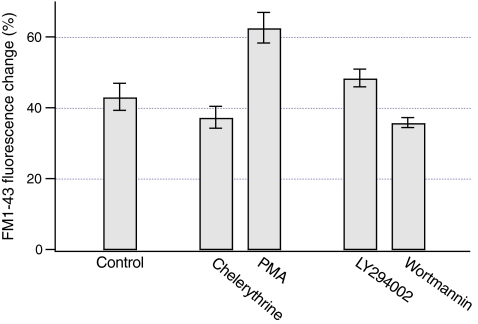
Previous studies have shown that PKC and PI 3-kinase modulate ATP release from liver cells [20, 24]. To assess whether PKC modulates sustained ATP release, luminescence was measured after stimulation of PKC with PMA. Consistent with the previous studies, Fig. 8a shows that PMA increased sustained ATP release by ~2.5-fold (P < 0.03). Furthermore, inhibition of PKC with chelerythrine blocked ATP release by ~75% (P < 0.05, Fig. 8a). To assess whether PKC has an effect on vesicular exocytosis, FM1-43 fluorescence was measured in response to hypotonic solution after manipulation of the PKC activity. As shown in Fig. 9, PMA increased the change in FM1-43 fluorescence evoked by hypotonic solution by ~50% (P < 0.003). However, chelerythrine did not significantly inhibit the change in FM1-43 fluorescence (P > 0.26, Fig. 9). Collectively, these data indicate that PKC differentially regulates vesicular exocytosis and sustained ATP release.
Fig. 8.
Regulation of sustained ATP release by PKC and PI 3-kinase. Luminescence was measured from dishes with HTC cells after the exposure to hypotonic solution at arrow (30% dilution). a Hypotonic solution evoked sustained ATP release from control cells (closed circles, n = 4 dishes). The activity of PKC was manipulated by preincubating cells with 1 microM PMA for 10 min (open circles, n = 4 dishes) or 20 microM chelerythrine for 15 min (open squares, n = 3 dishes). PMA increased and chelerythrine decreased sustained ATP release from HTC cells. b To inhibit PI 3-kinase, cells were preincubated with 10 microM LY294002 (open circles, n = 3 dishes) or 100 nM wortmannin (open squares, n = 3 dishes) for 15 min. Both LY294002 and wortmannin had no effect on sustained ATP release from HTC cells
Fig. 9.
Regulation of vesicular exocytosis by PKC and PI 3-kinase. After staining the plasma membrane of HTC cells with FM1-43, a change in FM1-43 fluorescence was measured 5 min after the exposure to hypotonic solution. Preincubation of cells with 1 microM PMA for 10 min increased the change in FM1-43 fluorescence evoked by hypotonic solution (n = 19 cells). Inhibition of PKC with 20 microM chelerythrine (15 min incubation) did not inhibit the FM1-43 fluorescence change (n = 11 cells). When PI 3-kinase was inhibited by incubating cells with 10 microM LY294002 (n = 9 cells) or 100 nM wortmannin (n = 10 cells) for 15 min, no significant effect on the change in FM1-43 fluorescence was found
The role of PI-3 kinase was also assessed. Inhibition of PI-3 kinase with LY294002 or wortmannin did not significantly inhibit sustained ATP release (P > 0.42 for both, Fig. 8b). Similarly, LY294002 and wortmannin did not significantly inhibit the change in FM1-43 fluorescence evoked by hypotonic solution (P > 0.09 for both, Fig. 9). Thus, stimulation of sustained ATP release and vesicular exocytosis does not require intact PI 3-kinase.
Discussion
Exocytosis of ATP-enriched vesicles contributes to ATP release from liver cells, and is important for initiation of purinergic signaling [20]. The major finding of these studies is that in addition to exocytosis of ATP-enriched vesicles, a distinct mechanism of membrane ATP transport that is not mediated by vesicular exocytosis, significantly contributes to ATP release from liver cells. This novel mechanism of membrane ATP transport is potently inhibited by mefloquine, and appears to mediate sustained ATP release that persists for many minutes after the exposure to hypotonic solution. Thus, mefloquine-sensitive ATP transport may play an important role in the regulation of cell volume and purinergic signaling in liver cells.
ATP release was studied in HTC cells that have been used as a model for hepatocyte ATP release and purinergic signaling [24, 34]. Exposure to hypotonic solution evoked a rapid increase in luminescence which was followed by a slow and gradual increase in luminescence that persisted for many minutes after the exposure. The experiments with standard ATP solution indicated that this rapid increase is due to an increase in the sensitivity of luciferin–luciferase assay to ATP resulting from the changes in ion concentration, and not changes in the extracellular osmolarity (see Fig. 1c). This phenomenon has been previously described, and should be taken into account when measuring luminescence in response to hypotonic solution [35, 36]. Thus, slow increase in luminescence may represent sustained ATP release evoked by changes in the extracellular osmolarity. Consistent with this explanation, we have shown that sustained ATP release was not observed when cells were exposed to hypotonic solution that contained sucrose to maintain the extracellular osmolarity constant (see Fig. 1b).
Several important findings in this work provide support for the concept that sustained ATP release from HTC cells is mediated in part through activation of membrane ATP transport mechanisms that are distinct from vesicular exocytosis. First, if exocytosis mediates sustained ATP release, then the rate of FM1-43 fluorescence and the magnitude of ATP release should be directly proportional. Using FM1-43 fluorescence, we found that an exposure to hypotonic solution stimulates exocytic insertion of vesicle membrane into the plasma membrane within minutes of the exposure (~40% of the initial plasma membrane). However, this large exocytic response was transient, and the rate of FM1-43 fluorescence rapidly decreased to the values that were similar to the basal values of constitutive exocytosis within ~2 min after the exposure to hypotonic solution. Notably, ATP release slowly and gradually increased for more than 15 min after the hypotonic exposure. Thus, the kinetics of vesicular exocytosis and sustained ATP release are quite different, and it is unlikely that vesicular exocytosis directly mediates sustained ATP release from liver cells.
Second, mefloquine can pharmacologically dissociate vesicular exocytosis and sustained ATP release. Mefloquine is a potent inhibitor of pannexin1 hemichannels, and did not block exocytosis evoked by hypotonic solution, but it potently inhibited sustained ATP release. Furthermore, probenecid inhibited sustained ATP release by ~50%. These findings are consistent with the hypothesis that pannexin1 hemichannels may mediate sustained ATP release from HTC cells. Although HTC cells are positive for pannexin1 immunofluorescence (unpublished data), a lack of inhibition by CBX is difficult to reconcile with canonical pannexin1 hemichannel function as described in expression systems. One potential explanation may be that the pharmacological features of sustained ATP release from liver cells may be influenced by association of pannexin1 with other proteins. For example, when pannexin1 was co-expressed with the potassium channel subunit Kvbeta3, the efficacies and potencies of CBX and probenecid were attenuated [37]. Similarly, changes in the extracellular osmolarity induced by hypotonic solution may also stimulate interaction of pannexin1 hemichannels with other membrane proteins in liver cells, and this may result in the decreased sensitivity to CBX and probenecid. A recent study in 1321 N1 astrocytes provides evidence for this explanation [38]. The authors found that extracellular osmolarity modulates the sensitivity of thrombin-dependent ATP release to probenecid. While pannexin1 hemichannels may contribute to mefloquine-sensitive sustained ATP release observed here, the present study does not provide conclusive evidence for the role of pannexin1 hemichannels in sustained ATP release from liver cells, and molecular targets of mefloquine remain unknown.
Third, if exocytosis of ATP-enriched vesicles mediates sustained ATP release, then impairing the storage of ATP in the vesicles with bafilomycin A1 would be expected to inhibit sustained ATP release. We found that bafilomycin A1 did not inhibit sustained ATP release (see Fig. 3b). Furthermore, when exocytosis of ATP-enriched vesicles was specifically stimulated with NPPB [33], mefloquine failed to inhibit ATP release evoked by NPPB (see Fig. 7a) indicating that mefloquine does not modulate exocytosis of ATP-enriched vesicles. Collectively, these results provide further support for the concept that mefloquine-sensitive sustained ATP release from liver cells may be mediated in part through the mechanisms which are distinct from exocytosis of ATP-enriched vesicles.
Assuming that mefloquine-sensitive ATP transport contributes to sustained ATP release from liver cells, several important points merit emphasis. First, using fast imaging of bioluminescence, recent studies have demonstrated that hypotonic solution stimulates ATP release which is mediated by exocytosis of ATP-enriched vesicles that ceases within ~30 s after the hypotonic exposure [20]. We did not observe this rapid ATP release because luminescence was not measured for ~1 min after the exposure to hypotonic solution (see Materials and methods). Furthermore, because HTC cells are capable of hydrolyzing ATP, and a half-life of ATP added to the dish is ~7 min, the contribution of exocytosis of ATP-enriched vesicles to sustained ATP release that was measured ~15 min after the hypotonic exposure might have not been significant. Thus, it is unlikely that sustained ATP release may be mediated by exocytosis of ATP-enriched vesicles.
Second, using FM1-43 fluorescence, we found that PMA stimulates exocytosis evoked by hypotonic solution by ~50%. Using quinacrine fluorescence to stain ATP-enriched vesicles, recent studies have shown that PMA potently stimulates exocytosis of ATP-enriched vesicles by several-fold [20]. These data are consistent with the hypothesis that changes in FM1-43 and quinacrine fluorescence cannot be directly compared. The data with the PI 3-kinase inhibitor wortmannin provide further support for this hypothesis. Wortmannin potently inhibited exocytosis of ATP-enriched vesicles [20], but it had no effect on exocytosis measured with FM1-43 fluorescence (see Fig. 9). Furthermore, the time course of changes in quinacrine fluorescence and FM1-43 fluorescence are different. While changes in quinacrine fluorescence cease in ~30 s after the hypotonic exposure, rapid changes in FM1-43 fluorescence persist for ~2 min. Because FM1-43 stains membranes in a nonspecific manner, increases in FM1-43 fluorescence result from exocytosis of all vesicles including ATP-enriched vesicles. On the other hand, quinacrine specifically stains vesicle that contain high ATP concentration, and decreases in quinacrine fluorescence represent a measure of exocytosis of only ATP-enriched vesicles. Thus, it appears that FM1-43 stains a much larger vesicle pool, and the simplest explanation of these findings is that hypotonic solution stimulates exocytosis of a pool of ATP-enriched vesicles, and a distinct pool of vesicles which can be detected with FM1-43 fluorescence. While exocytosis of ATP-enriched vesicles appears to be responsible for the initiation of purinergic signaling in liver cells [20], the role of exocytosis of a distinct pool of vesicles is not known. One potential role of these vesicles may be to insert ATP transport proteins into the plasma membrane, and to increase the capacity of liver cells for sustained ATP release. This implies that any manipulation that inhibits exocytosis would also inhibit sustained ATP release. However, we did not find any pharmacological manipulation that inhibits both vesicular exocytosis and sustained ATP release. Thus, it is not known whether vesicles mobilized by hypotonic solution contain functional ATP transporters in their membranes. It is interesting to note that by using FM1-43 fluorescence, recent studies have shown that inhibition of PKC or PI 3-kinase in biliary cells blocks both vesicular exocytosis and ATP release [21]. These studies indicate that vesicular exocytosis may contribute to ATP release from biliary cells.
Third, inhibition of PI 3-kinase did not block exocytosis evoked by hypotonic solution. This was a surprising result because PI 3-kinase plays a key role in the regulation of vesicular exocytosis in liver cells [20, 31]. Interestingly, recent studies have demonstrated that a large pool of small vesicles (~50% of the cell surface area) can undergo exocytosis in a PI 3-kinase-independent manner, and these vesicles are important for cell survival and wound repair of the plasma membrane [39]. While the identity of a pool of vesicles that are undergo exocytosis in response to increases in liver cell volume is not known, it is attractive to speculate that exocytosis of these vesicles may function as a protective mechanism which is activated in the response to hypotonic stress.
Fourth, previous studies have shown that inhibition of PI 3-kinase blocks ATP release evoked by hypotonic solution from HTC cells by ~50% [24]. We found that both LY294002 and wortmannin did not significantly inhibit sustained ATP release. One potential explanation for this discrepancy may be that Feranchak and co-workers measured maximal ATP release immediately after the exposure to hypotonic solution, when the contribution of wortmannin-sensitive exocytosis of ATP-enriched vesicles to ATP release is significant. In the present study, the magnitude of sustained ATP release was measured 15 min after the hypotonic exposure, when exocytosis of ATP-enriched vesicles completely ceased.
Finally, the data in Fig. 6a show that mefloquine increased FM1-43 fluorescence. This effect was not due to increases in the affinity of FM1-43 to the plasma membrane but rather stimulation of vesicular exocytosis under basal conditions (see Fig. 6b). The cellular mechanisms responsible for stimulation of exocytosis by mefloquine, and the identity of these vesicles are not known. Furthermore, mefloquine per se did not stimulate ATP release indicating that inhibition of sustained ATP release by mefloquine was not caused by depletion of intracellular pool of ATP.
In summary, these results suggest that in addition to exocytosis of ATP-enriched vesicles, a distinct mechanism of membrane ATP transport that is not mediated by vesicular exocytosis, significantly contributes to ATP release from liver cells. This novel mechanism of ATP transport is potently inhibited by mefloquine, and appears to mediate sustained ATP release that persists for many minutes after the exposure to hypotonic solution. Thus, mefloquine-sensitive ATP release may play an important role in the regulation of purinergic signaling in liver cells.
Acknowledgements
We are grateful to J. Gregory Fitz for helpful comments. This work was supported by National Institute of Health grant DK46082.
References
- 1.Schliess F, Haussinger D. Osmosensing and signaling in the regulation of liver function. Contrib Nephrol. 2006;152:198–209. doi: 10.1159/000096324. [DOI] [PubMed] [Google Scholar]
- 2.Graf J, Haussinger D. Ion transport in hepatocytes: mechanisms and correlations to cell volume, hormone actions and metabolism. J Hepatol. 1996;24(Suppl 1):53–77. [PubMed] [Google Scholar]
- 3.Bruck R, Haddad P, Graf J, Boyer JL. Regulatory volume decrease stimulates bile flow, bile acid excretion, and exocytosis in isolated perfused rat liver. Am J Physiol. 1992;262:G806–G812. doi: 10.1152/ajpgi.1992.262.5.G806. [DOI] [PubMed] [Google Scholar]
- 4.Hallbrucker C, vom Dahl S, Lang F, Gerok W, Haussinger D. Modification of liver cell volume by insulin and glucagon. Pflugers Arch. 1991;418:519–521. doi: 10.1007/BF00497781. [DOI] [PubMed] [Google Scholar]
- 5.Wondergem R, Davis J. Ethanol increases hepatocyte water volume. Alcohol Clin Exp Res. 1994;18:1230–1236. doi: 10.1111/j.1530-0277.1994.tb00110.x. [DOI] [PubMed] [Google Scholar]
- 6.Wettstein M, Haussinger D. Cytoprotection by the osmolytes betaine and taurine in ischemia–reoxygenation injury in the perfused rat liver. Hepatology. 1997;26:1560–1566. doi: 10.1053/jhep.1997.v26.pm0009397998. [DOI] [PubMed] [Google Scholar]
- 7.Serrar H, Haddad P. Effects of cold preservation and rewarming on rat liver cell volume regulation and concentrative amino acid uptake. Gastroenterology. 1997;112:1344–1353. doi: 10.1016/S0016-5085(97)70148-3. [DOI] [PubMed] [Google Scholar]
- 8.Feranchak AP, Fitz JG, Roman RM. Volume-sensitive purinergic signaling in human hepatocytes. J Hepatol. 2000;33:174–182. doi: 10.1016/S0168-8278(00)80357-8. [DOI] [PubMed] [Google Scholar]
- 9.Wang Y, Roman R, Lidofsky SD, Fitz JG. Autocrine signaling through ATP release represents a novel mechanism for cell volume regulation. Proc Natl Acad Sci USA. 1996;93:12020–12025. doi: 10.1073/pnas.93.21.12020. [DOI] [PMC free article] [PubMed] [Google Scholar]
- 10.Bodily K, Wang Y, Roman R, Sostman A, Fitz JG. Characterization of a swelling-activated anion conductance in homozygous typing cell hepatoma cells. Hepatology. 1997;25:403–410. doi: 10.1002/hep.510250224. [DOI] [PubMed] [Google Scholar]
- 11.Roman RM, Smith RL, Feranchak AP, Clayton GH, Doctor RB, Fitz JG. ClC-2 chloride channels contribute to HTC cell volume homeostasis. Am J Physiol Gastrointest Liver Physiol. 2001;280:G344–G353. doi: 10.1152/ajpgi.2001.280.3.G344. [DOI] [PubMed] [Google Scholar]
- 12.Sabirov RZ, Okada Y. ATP release via anion channels. Purinergic Signal. 2005;1:311–328. doi: 10.1007/s11302-005-1557-0. [DOI] [PMC free article] [PubMed] [Google Scholar]
- 13.Roman RM, Wang Y, Lidofsky SD, Feranchak AP, Lomri N, Scharschmidt BF, Fitz JG. Hepatocellular ATP-binding cassette protein expression enhances ATP release and autocrine regulation of cell volume. J Biol Chem. 1997;272:21970–21976. doi: 10.1074/jbc.272.35.21970. [DOI] [PubMed] [Google Scholar]
- 14.Cotrina ML, Lin JH, Alves-Rodrigues A, Liu S, Li J, Azmi-Ghadimi H, Kang J, Naus CC, Nedergaard M. Connexins regulate calcium signaling by controlling ATP release. Proc Natl Acad Sci USA. 1998;95:15735–15740. doi: 10.1073/pnas.95.26.15735. [DOI] [PMC free article] [PubMed] [Google Scholar]
- 15.Locovei S, Bao L, Dahl G. Pannexin 1 in erythrocytes: function without a gap. Proc Natl Acad Sci USA. 2006;103:7655–7659. doi: 10.1073/pnas.0601037103. [DOI] [PMC free article] [PubMed] [Google Scholar]
- 16.Silverman WR, Rivero Vaccari JP, Locovei S, Qiu F, Carlsson SK, Scemes E, Keane RW, Dahl G. The pannexin 1 channel activates the inflammasome in neurons and astrocytes. J Biol Chem. 2009;284:18143–18151. doi: 10.1074/jbc.M109.004804. [DOI] [PMC free article] [PubMed] [Google Scholar]
- 17.Iglesias R, Locovei S, Roque A, Alberto AP, Dahl G, Spray DC, Scemes E. P2X7 receptor–Pannexin 1 complex: pharmacology and signaling. Am J Physiol Cell Physiol. 2008;295:C752–C760. doi: 10.1152/ajpcell.00228.2008. [DOI] [PMC free article] [PubMed] [Google Scholar]
- 18.Ransford GA, Fregien N, Qui F, Dahl G, Conner GE, Salathe M (2009) Pannexin 1 contributes to ATP release in airway epithelia. Am J Respir Cell Mol Biol 41:525–534 [DOI] [PMC free article] [PubMed]
- 19.Orriss IR, Knight GE, Utting JC, Taylor SE, Burnstock G, Arnett TR. Hypoxia stimulates vesicular ATP release from rat osteoblasts. J Cell Physiol. 2009;220:155–162. doi: 10.1002/jcp.21745. [DOI] [PubMed] [Google Scholar]
- 20.Feranchak AP, Lewis MA, Kresge C, Sathe M, Bugde A, Luby-Phelps K, Antich PP, Fitz JG. Initiation of purinergic signaling by exocytosis of ATP-containing vesicles in liver epithelium. J Biol Chem. 2010;285:8138–8147. doi: 10.1074/jbc.M109.065482. [DOI] [PMC free article] [PubMed] [Google Scholar]
- 21.Gatof D, Kilic G, Fitz JG (2004) Vesicular exocytosis contributes to volume-sensitive ATP release in biliary cells. Am J Physiol Gastrointest Liver Physiol 286:G538–546 [DOI] [PubMed]
- 22.Roman RM, Feranchak AP, Davison AK, Schwiebert EM, Fitz JG. Evidence for Gd(3+) inhibition of membrane ATP permeability and purinergic signaling. Am J Physiol. 1999;277:G1222–G1230. doi: 10.1152/ajpgi.1999.277.6.G1222. [DOI] [PubMed] [Google Scholar]
- 23.Roman RM, Lomri N, Braunstein G, Feranchak AP, Simeoni LA, Davison AK, Mechetner E, Schwiebert EM, Fitz JG. Evidence for multidrug resistance-1 P-glycoprotein-dependent regulation of cellular ATP permeability. J Membr Biol. 2001;183:165–173. doi: 10.1007/s00232-001-0064-7. [DOI] [PubMed] [Google Scholar]
- 24.Feranchak AP, Roman RM, Schwiebert EM, Fitz JG. Phosphatidylinositol 3-kinase contributes to cell volume regulation through effects on ATP release. J Biol Chem. 1998;273:14906–14911. doi: 10.1074/jbc.273.24.14906. [DOI] [PubMed] [Google Scholar]
- 25.Cochilla AJ, Angleson JK, Betz WJ. Monitoring secretory membrane with FM1-43 fluorescence. Annu Rev Neurosci. 1999;22:1–10. doi: 10.1146/annurev.neuro.22.1.1. [DOI] [PubMed] [Google Scholar]
- 26.Smith CB, Betz WJ. Simultaneous independent measurement of endocytosis and exocytosis. Nature. 1996;380:531–534. doi: 10.1038/380531a0. [DOI] [PubMed] [Google Scholar]
- 27.Kilic G. Exocytosis in bovine chromaffin cells: studies with patch-clamp capacitance and FM1-43 fluorescence. Biophys J. 2002;83:849–857. doi: 10.1016/S0006-3495(02)75213-2. [DOI] [PMC free article] [PubMed] [Google Scholar]
- 28.Roman RM, Feranchak AP, Salter KD, Wang Y, Fitz JG. Endogenous ATP release regulates Cl− secretion in cultured human and rat biliary epithelial cells. Am J Physiol. 1999;276:G1391–G1400. doi: 10.1152/ajpgi.1999.276.6.G1391. [DOI] [PubMed] [Google Scholar]
- 29.Roman RM, Wang Y, Fitz JG. Regulation of cell volume in a human biliary cell line: activation of K+ and Cl- currents. Am J Physiol. 1996;271:G239–G248. doi: 10.1152/ajpgi.1996.271.2.G239. [DOI] [PubMed] [Google Scholar]
- 30.Taylor AL, Kudlow BA, Marrs KL, Gruenert DC, Guggino WB, Schwiebert EM. Bioluminescence detection of ATP release mechanisms in epithelia. Am J Physiol. 1998;275:C1391–C1406. doi: 10.1152/ajpcell.1998.275.5.C1391. [DOI] [PubMed] [Google Scholar]
- 31.Kilic G, Doctor RB, Fitz JG. Insulin stimulates membrane conductance in a liver cell line: evidence for insertion of ion channels through a phosphoinositide 3-kinase-dependent mechanism. J Biol Chem. 2001;276:26762–26768. doi: 10.1074/jbc.M100992200. [DOI] [PubMed] [Google Scholar]
- 32.Cruikshank SK, Hopperstad M, Younger M, Connors BW, Spray DC, Srinivas M. Potent block of Cx36 and Cx50 gap junction channels by mefloquine. Proc Natl Acad Sci USA. 2004;101:12364–12369. doi: 10.1073/pnas.0402044101. [DOI] [PMC free article] [PubMed] [Google Scholar]
- 33.Dolovcak S, Waldrop SL, Fitz JG, Kilic G. 5-Nitro-2-(3-phenylpropylamino)benzoic acid (NPPB) stimulates cellular ATP release through exocytosis of ATP-enriched vesicles. J Biol Chem. 2009;284:33894–33903. doi: 10.1074/jbc.M109.046193. [DOI] [PMC free article] [PubMed] [Google Scholar]
- 34.Feranchak AP, Berl T, Capasso J, Wojtaszek PA, Han J, Fitz JG. p38 MAP kinase modulates liver cell volume through inhibition of membrane Na+ permeability. J Clin Invest. 2001;108:1495–1504. doi: 10.1172/JCI12190. [DOI] [PMC free article] [PubMed] [Google Scholar]
- 35.Boudreault F, Grygorczyk R. Cell swelling-induced ATP release and gadolinium-sensitive channels. Am J Physiol Cell Physiol. 2002;282:C219–C226. doi: 10.1152/ajpcell.00317.2001. [DOI] [PubMed] [Google Scholar]
- 36.Seminario-Vidal L, Lazarowski ER, Okada SF. Assessment of extracellular ATP concentrations. Methods Mol Biol. 2009;574:25–36. doi: 10.1007/978-1-60327-321-3_3. [DOI] [PubMed] [Google Scholar]
- 37.Bunse S, Locovei S, Schmidt M, Qiu F, Zoidl G, Dahl G, Dermietzel R. The potassium channel subunit Kvbeta3 interacts with pannexin 1 and attenuates its sensitivity to changes in redox potentials. FEBS J. 2009;276:6258–6270. doi: 10.1111/j.1742-4658.2009.07334.x. [DOI] [PubMed] [Google Scholar]
- 38.Blum AL, Walsh BC, Dubyak GR. Extracellular osmolarity modulates G protein-coupled receptor-dependent ATP release from 1321N1 astrocytoma cells. Am J Physiol Cell Physiol. 2010;298:C386–C396. doi: 10.1152/ajpcell.00430.2009. [DOI] [PMC free article] [PubMed] [Google Scholar]
- 39.Wang TM, Hilgemann DW (2008) Ca-dependent nonsecretory vesicle fusion in a secretory cell. J Gen Physiol 132:51–65 [DOI] [PMC free article] [PubMed]


