

Non-technical summary
Agonist-induced oscillatory changes in intracellular calcium represent a critical mechanism for the selective regulation of various discrete cellular activities, as different responses are activated at different frequencies of calcium oscillations. An important determinant of oscillation frequency is the rate of agonist-induced calcium entry, although precisely how this effect is achieved remains controversial. Here we show that calcium entering via a specific calcium channel that is regulated by agonist-induced increases in arachidonic acid (the ARC channel) stimulates the enzyme phosopholipase C-δ (PLCδ), whose activity is known to result in an increase in cellular levels of inositol trisphosphate – a key determinant in the regulation of the release of calcium from intracellular stores, thereby increasing oscillation frequency. Interestingly, this activation of PLCδ by calcium entering via the ARC channels occurs in a highly localized manner, and is not duplicated by equivalent calcium entry via co-existing store-operated calcium channels.
Abstract
Abstract
The frequency of oscillatory Ca2+ signals is a major determinant in the selective activation of discrete downstream responses in non-excitable cells. An important modulator of this oscillation frequency is known to be the rate of agonist-activated Ca2+ entry. However precisely how this is achieved and the respective roles of store-operated versus store-independent Ca2+ entry pathways in achieving this are unclear. Here, we examine the possibility that a direct stimulation of a phospholipase C (PLC) by the entering Ca2+ can induce a modulation of Ca2+ oscillation frequency, and examine the roles of the endogenous store-operated and store-independent Orai channels (CRAC and ARC channels, respectively) in such a mechanism. Using the decline in the magnitude of currents through expressed PIP2-dependent Kir2.1 channels as a sensitive assay for PLC activity, we show that simple global increases in Ca2+ concentrations over the physiological range do not significantly affect PLC activity. Similarly, maximal activation of endogenous CRAC channels also fails to affect PLC activity. In contrast, equivalent activation of endogenous ARC channels resulted in a 10-fold increase in the measured rate of PIP2 depletion. Further experiments show that this effect is strictly dependent on the Ca2+ entering via these channels, rather than the gating of the channels or the arachidonic acid used to activate them, and that it reflects the activation of a PLCδ by local Ca2+ concentrations immediately adjacent to the active channels. Finally, based on the effects of expression of either a dominant-negative mutant Orai3 that is an essential component of the ARC channel, or a catalytically compromised mutant PLCδ, it was shown that this specific action of the store-independent ARC channel-mediated Ca2+ entry on PLCδ has a significant impact on the oscillation frequency of the Ca2+ signals activated by low concentrations of agonist.
Introduction
The essential role of Ca2+ entry in maintaining agonist-induced cytosolic Ca2+ signals has long been appreciated, and is readily demonstrated by the rapid effects of eliminating Ca2+ entry on the sustained elevation of Ca2+ seen on stimulation with high agonist concentrations (Takemura et al. 1989; Takemura & Putney, 1989; Parekh & Putney, 2005), and the slowing, or even cessation, of the repetitive Ca2+ oscillations typical of stimulations at lower agonist concentrations (Kawanishi et al. 1989; Rooney et al. 1989; Martin & Shuttleworth, 1994; Bootman et al. 1996). Such effects have been shown to have important physiological implications in influencing the specific nature of the response of the cell to relevant signals. Thus, both the amplitude of sustained Ca2+ signals and, more particularly, the frequency of oscillatory Ca2+ signals, are known to represent critical parameters in determining the specificity of the activation of selective downstream effectors including the activation of various transcription factors, kinases, and mitochondrial enzymes (Hajnoczky et al. 1995; De Koninck & Schulman, 1998; Dolmetsch et al. 1998).
The mechanism by which Ca2+ entry affects the amplitude of sustained Ca2+ signals seems clear, as such signals basically represent the relative balance between the rate of Ca2+ entering the cytosol versus the rate at which it is being extruded by Ca2+ pumps. However, oscillatory Ca2+ signals essentially arise from the repetitive release and reuptake of Ca2+ from internal stores, indicating that the underlying mechanisms by which Ca2+ entry modulates the frequency of such release and reuptake are likely to be more complex. In addition, it seems that both store-operated and store-independent modes of Ca2+ entry are capable of inducing such changes in the frequency of agonist-induced Ca2+ oscillations (Shuttleworth, 1999; Shuttleworth et al. 2004; Bird & Putney, 2005; Mignen et al. 2005; Dupont et al. 2011; Putney, 2011). Consequently, both the actual mechanism involved, and the nature of the entry pathway responsible, could differ in different cell types, or even in the same cell type in response to different agonists. Most mechanisms proposed to date have generally focused on the ability of entering Ca2+ to directly modulate the oscillatory process – for example by influencing the activity of the InsP3 receptors (Bezprozvanny et al. 1991; Shuttleworth & Thompson, 1996; Mak et al. 1998; Taylor & Laude, 2002). However, a potential constraint of any such direct effect is the limited diffusion distance of free Ca2+ ions in the highly buffered environment of the cytosol. Consequently, in situations where there is little or no significant sustained increase in the baseline level of Ca2+ (i.e. during so-called ‘baseline spikes or oscillations’), such a mechanism would require that the sites of repetitive Ca2+ release be situated close to the sites of entry. This seems difficult to reconcile with the situation in certain highly polarized epithelial cells (e.g. pancreatic acinar cells) where the oscillatory release and re-uptake of Ca2+ often occurs in a restricted apical region at some distance from the presumed predominant sites of agonist-induced Ca2+ entry in the basal, or basolateral, regions of the cell (Ashby et al. 2003; Petersen, 2003).
Such considerations led us to explore potential alternative mechanisms whereby Ca2+ entry could act to modulate agonist-induced oscillatory Ca2+ signals, particularly focusing on those that might permit the ‘local conversion’ of the entering Ca2+ into a more global messenger capable of influencing events at some distance from the specific site of entry. In the study presented here, we have used a sensitive real-time assay for phospholipase C (PLC) activity to show that the entry of Ca2+ results in a local activation of a closely associated Ca2+-dependent PLC (PLCδ). In this way, the spatially confined Ca2+ entry signal is converted into a tonic increase in InsP3, which can then act as a more global messenger to increase agonist-induced oscillation frequency. Interestingly, examination of the relative contribution to this mechanism of the two co-existing members of the Orai family of Ca2+ entry channels – store-operated CRAC channels and store-independent ARC channels – revealed that the observed PLCδ-dependent effect is an exclusive property of Ca2+ entering via the store-independent ARC channels.
Methods
DNA constructs and transfection
The Kir2.1(R228Q) mutant cDNA (a gift from R. Hardie) was subcloned into the pcDNA5/FRT vector. This was then used to generate a HEK293 cell line stably expressing the mutant Kir2.1(R228Q) channel using the FlpIn system (Invitrogen), following the manufacturer's instructions. After antibiotic selection, cells were maintained on polylysine-coated culture plates in EMEM (Eagle's Minimum Essential Medium) containing 10% newborn calf serum at 5% CO2. Cells were transfected using an Amaxa Nucleofector (Lonza, Basel, Switzerland) (Solution V, programme Q010), and used 44–54 h post-transfection. For electrophysiological experiments 0.1 μg of pVenus cDNA was cotransfected with the relevant cDNA or siRNA to allow identification of transfected cells.
PLCδ constructs and molecular biology
The siRNAs targeting the PLCδ1 and PLCδ3 isoforms, as well as the siRNA negative control, were obtained from Ambion (Austin, TX, USA). Two different siRNAs were used for the PLCδ1 experiments, with the following sequences (sense strand target) GGUGAAGUCCAGCUCAUGGtt and CAACAAGAAUAAGAAUUCAtt (cat no. 4390817 and AM16810). The single siRNA used for PLCδ3 had the following sequence (sense strand target) GCAGCUCAUUCAGACCUAUtt (cat no. 4390817). For Western blot analysis of PLCδ3 knock-down, transfected cells were washed with phosphate-buffered saline (PBS) followed by homogenization in 500 μl lysis buffer (20 mm Tris HCl pH 7.5, 150 mm NaCl, 1 mm EDTA, 1 mm EGTA, 1% Triton X-100, 2.5 mm sodium pyrophosphate, 1 mmβ-glycerophosphate, 1 mm sodium orthovanadate, 1 μg ml−1 leupeptin and a protease inhibitor tablet (Roche)) followed by sonication and centrifugation at 100,000 g for 40 min. Protein samples were loaded onto a 7% SDS-PAGE gel, transferred onto nitrocellulose and immunoblotted using 1 μg ml−1 of the PLCδ3 pAb (Sigma) for 2 h at room temperature, followed by a 1 hour exposure to 1:2000 anti-rabbit IgG HRP-linked secondary antibody (Cell Signaling Technology, Inc., Danvers, MA, USA). Visualization of the labelled bands was by chemiluminescence, and exposure to Biomax XAR film. Blots were stripped and reprobed with 1:5000 β-actin mAb (Sigma) followed by 1:2000 goat anti-mouse horseradish peroxidase (HRP)-linked secondary antibody (Bio-Rad) as a loading control. For the evaluation of siRNA induced knock-down of PLCδ1 RNA using PCR, total RNA was extracted from transfected cells using RNAeasy (Qiagen, Valencia, CA, USA). The resulting total RNA (1 μg) was used for reverse transcription and amplification using the Invitrogen One-Step PCR kit and PLCδ1 sense (5′CATCCGGGCACTGTGCAAAG3′) and antisense (5′CGGGTAGATTCTGCTCAGGTG3′) primers. PCR products were run on a 0.75% agarose gel and the image digitally captured. The PLCδ3-H352A mutant construct was created by a two-step PCR approach using PLCδ3 pcmv6-xl6 (Origene) as the template. The mutated segment was transferred to the wild-type construct with the flanking BglII restriction sites, and the coding region sequenced to ensure orientation and validity.
Whole-cell patch-clamp recording
All patch-clamp recordings of whole-cell currents were carried out at room temperature (20–22°C). Measurements of CRAC channel currents and ARC channel currents were as previously described (Mignen et al. 2008). Whole-cell Kir2.1 channel currents were recorded using 250 ms voltage pulses to −100 mV delivered every 2 s from a holding potential of –70 mV, sampled at 20 kHz, and filtered at 5 kHz. Kir2.1 current–voltage relationships were routinely collected before and after the above protocol to verify the quality of the recording. These were obtained by applying 100 ms pulses at 5 or 10 mV steps every 1 s from –140 to –50 mV. Currents were sampled at 10 kHz and filtered at 5 kHz. Unless otherwise stated, the standard extracellular (bath) solution contained (in mm) NMDG-glutamate 135, potassium glutamate 5, MgCl2 2, CaCl2 10, Hepes 10 (pH 7.4). Standard pipette solutions contained (in mm) potassium glutamate 135, MgCl2 3.37, CaCl2 1.76, EGTA 5, Hepes 10 (pH 7.2). Calculated free [Ca2+] in this solution was 100 nm. In the experiments examining the effects of increased intracellular Ca2+, this solution was modified as follows – for a buffered free [Ca2+] of 300 nm, CaCl2 was increased to 3.08 mm, whilst for a buffered free [Ca2+] of 1.3 μm, the CaCl2 was 0.91 mm, EGTA was 1 mm, and HEDTA was added at 4 mm. MgCl2 concentrations were adjusted as appropriate. ARC channels were activated by switching to a bath solution containing arachidonic acid (8 μm). CRAC channels were activated by including 2 μm of the potent InsP3 receptor agonist adenophostin A in the internal (pipette) solution. To quantify the decline in Kir2.1 currents, the measured current values were plotted as a percentage of the initial current at each time point, and the maximum rate of current decay over a minimum period of 30 s, expressed as a percentage of the initial current per minute, was determined in each case.
Single-cell Ca2+ measurements
HEK293 cells stably expressing the muscarinic m3 receptor (m3-HEK cells) were transfected with 1 μg of the appropriate construct DNA, together with 0.5 μg of a nuclear-targeted DsRed construct DNA (pDsRed2-Nuc, BD Biosciences Clontech, Palo Alto, CA, USA) using the Amaxa Nucleofector as described above. Approximately 48 h later, the cells were plated onto polylysine-coated coverslips and allowed to adhere for 3–4 h in culture medium. The cells were then transferred to saline (with the following composition (in mm): NaCl 120, KCl 5.4, MgCl2 0.8, CaCl2 1.5, glucose 10, Hepes 20 (pH 7.4), loaded with 0.1 μm fura-2AM) for 25 min at 37°C (Jing et al. 2011), and incubated for a further 30 min at 37°C before use. Each coverslip formed the base of a microscope perfusion chamber (approximate volume 300 μl) that was used for imaging. All images was performed on an inverted epifluorescence microscope (Nikon Eclipse TE200), using a 20× S-Fluor objective lens (numerical aperture 0.75). Excitation was performed by a high-speed monochromator (TILL Polychrome IV, TILL Photonics, Grafeling, Germany), and images were captured and digitized at 12-bit resolution using an interline progressive scan CCD camera (Sensicam QE, Cooke Corp., Auburn Hills, MI, USA). Control of both the monochromator and image acquisition by the camera were by Imaging Workbench software (Indec version 5, Indec Biosystems, Santa Clara, CA, USA). Each experimental run involved first identifying transfected cells in an image field by the presence of the co-transfected DsRed2-Nuc, using excitation at 557 nm, and emission at >600 nm. Changes in cytosolic Ca2+ in the same cells were then recorded using Fura-2 fluorescence by collecting images at an emission wavelength of 510 ± 45 nm every second using alternating excitation at 340 and 380 nm (20 ms exposure). Background subtraction and calculation of the 340/380 ratio values were performed off-line. All experiments were performed at room temperature.
Analysis of agonist-induced Ca2+ oscillation frequency
Oscillatory Ca2+ responses to a low agonist concentration were examined using a HEK293 cell line stably transfected with the muscarinic m3 receptor (Shuttleworth & Thompson, 1998). Initial preliminary experiments with these cells revealed that the frequency of oscillations seen in response to a low concentration of the muscarinic agonist carbachol (CCh, 0.5 μm) varied widely from cell to cell within the same field of view, and in the same experimental run (i.e. in an individual coverslip). To obtain reliable data from such divergent individual responses, we adapted an approach based on that used by Putney's group who similarly reported such highly variable individual oscillatory responses in HEK293 cells responding to low concentrations of agonists (Bird & Putney, 2005; Wedel et al. 2007). First, in order to unequivocally identify cells responding to the agonist in a genuinely oscillatory fashion, only those cells displaying repeated, discrete Ca2+‘spikes’ of a magnitude greater than double the baseline fluorescence ratio, after background subtraction, were analysed. For each cell in the field of view that responded, as defined above, the total number of oscillations occurring in a 20 min period following agonist addition was determined. The resulting individual number of oscillations per period for all such cells (typically 5–12 per experiment) was averaged to give a mean value for the response in that particular experimental run. The overall data reported represent the mean from several such individual experiments (i.e. separate coverslips) as indicated, obtained from 3–6 separate transfections. In certain cases (see Results), oscillation frequency was determined for each of two subsequent 10 min periods in order to assess whether the oscillation rate changed progressively over time following agonist addition. Values are presented as means ± SEM. Where appropriate, statistical significance was determined using Student's t test, with a value of P < 0.05 taken as significant.
Results
The Kir2.1 channel assay for PIP2 depletion in resting cells
In the studies presented here, we have used the rate of decay of currents through an expressed, constitutively active, PIP2-dependent inwardly rectifying K+ channel (Kir2.1) as a reporter of PIP2 hydrolysis (Hardie et al. 2004). The very high affinity of native Kir2.1 channels for PIP2 generally results in a constitutively active channel that is highly resistant to agonist-induced PIP2 depletion. However, mutation of an arginine to glutamine at position 228 in the Kir2.1 sequence reduces the affinity for PIP2, resulting in a channel whose constitutive activity is now highly sensitive to the activation of PLC (Kobrinsky et al. 2000; Hardie et al. 2004). Finally, by assaying this as whole-cell current measurements using an intracellular solution that does not contain ATP, further phosphorylation of PIP2, or its resynthesis from its phosphoinositide precursors, is prevented (Hardie et al. 2004).
Whole-cell patch clamp of HEK293 cells stably expressing the R228Q mutant version of the Kir2.1 channel revealed the presence of a constitutively active, inwardly rectifying current, that displayed pronounced voltage-dependent block by external Cs+ (1 mm) (Fig. 1A), features that are consistent with the presence of the potassium-selective Kir2.1 channel. No such current was detected in untransfected cells. Measurements of the magnitude of this current revealed that, after an initial equilibration period, the currents steadily decayed at a rate of approximately 7% per minute (6.7 ± 1.0% min−1, n = 6). In these initial experiments, cytosolic Ca2+ was buffered at a resting level of 100 nm. We began by examining whether increases in global cytosolic Ca2+ concentrations within the range that might be predicted to occur following agonist activation were capable of enhancing PIP2 hydrolysis (Fig. 1B). Increasing the buffered cytosolic Ca2+ concentration to 300 nm, corresponding to the typical sustained (plateau) Ca2+ levels following agonist addition, failed to induce any significant increase in the rate of decay of the Kir2.1 channel currents (P = 0.75). Further increasing the internal Ca2+ concentration to 1.3 μm, to mimic maximal peak agonist-induced Ca2+ levels, resulted in a mean rate of decay of Kir2.1 channel currents of 9.6 ± 1.3% min−1 (n = 6). Again, this was not significantly different from that obtained at the resting level of Ca2+ (P = 0.1). From these data, we conclude that increases in global cytosolic Ca2+ concentrations within the physiological agonist-induced range fail to significantly affect resting PIP2 hydrolysis, at least as measured by the decay in expressed Kir2.1 channel activity.
Figure 1. Effects of cytosolic Ca2+ and activation of Ca2+ entry on PIP2 depletion as measured by the decline in Kir2.1 channel currents.
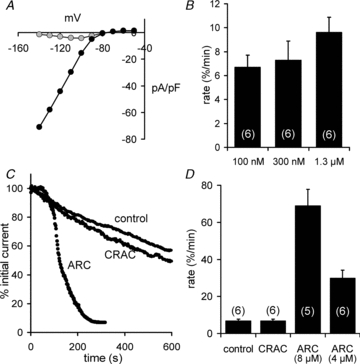
A, representative I–V curve from a HEK cell stably expressing the R228Q mutant Kir2.1 channel (black symbols), and the same cell in the presence of external Cs+ (1 mm, grey symbols). B, means ± SEM for the rate of decline in Kir2.1 channel currents in the presence of different global cytosolic Ca2+ concentrations. C, representative traces of the decline in Kir2.1 channel currents in unstimulated cells (control), and in cells in which either the CRAC channels or the ARC channels were maximally activated, as indicated. D, means ± SEM of the rate of decline in Kir2.1 currents under the corresponding conditions. The values indicated for the ARC channel data represent the concentrations of arachidonic acid used to activate the channels in each case. Values of n shown in parentheses.
Activation of Orai channel Ca2+ entry and PIP2 depletion
We next turned our attention to the possible effects of activating Ca2+ entry on the rate of PIP2 depletion. To examine the effect of entry via endogenous store-operated CRAC channels, the intracellular Ca2+ stores were maximally depleted by inclusion of the highly potent InsP3 analogue adenophostin-A (2 μm) in the pipette solution. However, the data obtained showed that this failed to significantly affect the resting rate of decay of the Kir2.1 channel activity (P = 0.93) (Fig. 1C and D). In marked contrast, maximal activation of the store-independent ARC channels, using bath application of arachidonic acid (8 μm), resulted in an approximately 10-fold increase in the rate of decline of Kir2.1 channel activity to reach a mean value of 68.9 ± 8.9% min−1 (n = 5) (Fig. 1C and D). This effect is related to the activity of the ARC channels because submaximal activation of the channels using a lower concentration of arachidonic acid (4 μm), reduced the measured rate of Kir2.1 channel current inhibition to a value of 29.8 ± 4.4% min−1 (n = 6), equivalent to an almost 60% inhibition of that seen with 8 μm arachidonic acid (Fig. 1D). Interestingly, this degree of inhibition is almost exactly the same as the corresponding reduction in whole-cell ARC channel currents measured under the same conditions (Mignen et al. 2003). Finally, to confirm that the increased rate in the decline of Kir2.1 channel currents seen on activation of the ARC channels was not simply an artefact caused by the high external Ca2+ concentrations (10 mm) used in these experiments, the concentration of Ca2+ in the bath solution was reduced to a more physiologically relevant value of 1.5 mm. However, this failed to significantly impact the rapid decline in Kir2.1 channel currents seen following maximal activation of the ARC channels with 8 μm arachidonic acid (60.7 ± 6.0% min−1, n = 4, P = 0.50).
To try to explain this obvious difference in the effects of activating the CRAC channels versus the ARC channels, we examined various features of the CRAC channel currents that might have impacted their ability to induce a decline in Kir2.1 channel currents. Examination of the magnitude of the adenophostin-induced CRAC channel currents revealed no significant difference from the corresponding arachidonic acid-activated ARC channel currents (Fig. 2A). The adenophostin-induced currents showed the marked inward rectification and positive reversal potential (>+60 mV) typical of a highly Ca2+-selective conductance (Fig. 2B), and were fully activated within approximately 80–90 s after achieving the whole-cell configuration (Fig. 2C). Consequently, neither a lack in Ca2+ selectivity, nor a delayed activation, can account for the inability of activation of the CRAC channels to induce the depletion of PIP2. We next examined whether our use of adenophostin-A to deplete the intracellular stores might have impacted any ability to increase PLC activity. The basis for this concern is that it is known that the phosphate groups at positions 4 and 5 of the inositol ring are key features in the ability of InsP3 to compete with the pleckstrin homology (PH) domain of PLCδ for access to PIP2 (Yagisawa et al. 1994). As the adenophostin-A molecule possesses phosphate groups in the same positions, it is possible that our use of this drug to deplete intracellular stores might have impeded access of a PLC to its PIP2 substrate. If this was the case, we would predict that adenophostin-A would have a similar impact on the rapid decline of Kir2.1 channel activity seen on activation of the ARC channels. However, activation of the ARC channels in the presence of adenophostin-A (2 μm) in the pipette solution resulted in a measured rate of decline in Kir2.1 channel currents that was not significantly different from that recorded in the absence of adenophostin (P = 0.63, Fig. 2D). Finally, we examined an alternative means of activating the store-operated channels using the SERCA pump inhibitor cyclopiazonic acid (CPA). Activation of the store-operated CRAC channels following addition of CPA (30 μm) resulted in a rate of decline in Kir2.1 channel currents of 8.69 ± 1.62% min−1 (n = 5), a value that was not significantly different from either the control rate (P = 0.31), or that seen following adenophostin activation of CRAC channels (P = 0.33).
Figure 2. Examination of the CRAC currents fails to account for its inability to activate PIP2 depletion.
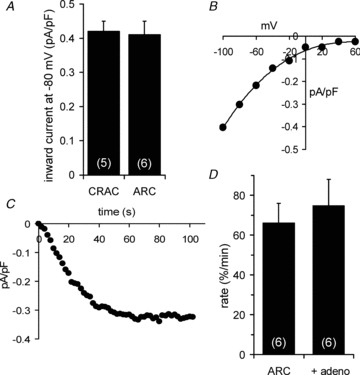
A, comparison of the mean ± SEM current magnitudes of maximally activated CRAC and ARC channel currents, measured at –80 mV. B, representative I–V curve recorded following maximal activation of the CRAC channels with adenophostin-A. C, representative time course of the adenophostin-A activation of CRAC channel currents measured at –80 mV. D, effect of inclusion of adenophostin-A (2 μm) on the rate of decline in Kir2.1 channel currents induced by maximal activation of the ARC channels. Values are means ± SEM with n shown in parentheses.
The above data indicate that the observed effects on PIP2 depletion are specific to the activation of the store-independent ARC channels. However, it is unclear whether the effect was dependent on the activation of the channel per se, or the resulting influx of Ca2+. In particular, as our mode of activating these channels involved the addition of exogenous arachidonic acid, it was possible that the observed effects were induced by this fatty acid itself. However, simply blocking the entry of Ca2+ through the channel by addition of 5 μm Gd3+ to the bath (Mignen et al. 2003) reduced the rate of Kir2.1 current decline by some 80% (Fig. 3A). We next used a molecular approach as a more specific means of selectively inhibiting the ARC channel activity. Whereas the functional CRAC channel pore is known to be composed of Orai1 subunits, the ARC channels are formed by a combination of both Orai1 and Orai3 subunits (Mignen et al. 2008). Consistent with this, expression of a dominant-negative E81Q mutant Orai3 selectively inhibits currents through endogenous ARC channels, whilst the co-existing CRAC channels are unaffected (Mignen et al. 2008). Examination of the rate of arachidonic acid-induced decline of Kir2.1 currents in cells expressing the E81Q-Orai3 mutant indicated a greater than 63% reduction compared to transfected control cells (Fig. 3A). Finally, as an alternative mode of inhibiting the entry of Ca2+ via the channels, without affecting the actual channel itself, we examined the effect of reducing the driving force for Ca2+ entry. Thus, after establishing a stable initial Kir2.1 current magnitude at –100 mV in the unstimulated cells, the cells were held at 0 mV for 2 min in the presence of arachidonic acid. Examination of the current–voltage relationship of the ARC channels indicates that this would result in an approximate 75–80% reduction in the Ca2+ current. Comparison of the magnitude of the Kir2.1 currents before and after this period at 0 mV revealed that they had actually increased slightly (by 20.6 ± 7.2%, n = 6) (Fig. 3B). This contrasts with a decline of almost 60% in cells held at the normal voltage of –70 mV for the same 2 min (Fig. 3B). Together, these data demonstrate that the observed ARC channel-dependent depletion of PIP2 reflects an action of the entering Ca2+ itself. This apparent unique ability of ARC channel-mediated Ca2+ entry to induce a rapid depletion of PIP2– whilst increases in Ca2+ in the physiologically relevant range, or a similar entry of Ca2+ via the CRAC channels, are completely ineffective – suggests the activation of a PLC by local increases in Ca2+ in the vicinity of the ARC channels.
Figure 3. ARC channel activation of PIP2 depletion is specifically due to the entry of Ca2+.
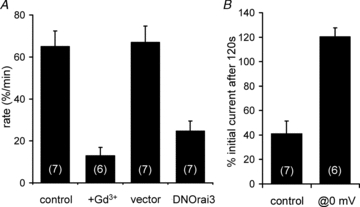
A, inhibition of Ca2+ entry by Gd3+ (5 μm) and ARC channel activity by expression of a dominant-negative E81Q-Orai3 mutant both inhibit the ARC channel-mediated decline in Kir2.1 channel currents. B, effect of eliminating Ca2+ entry via activated ARC channels by holding the cells at 0 mV for 120 s on the ARC channel-mediated inhibition of Kir2.1 channel currents. All values are means ± SEM with n shown in parentheses.
ARC channel-mediated Ca2+ entry activates PLCδ3
Of the various PLC enzymes known to exist, PLCβ, PLCγ and PLCδ are the most widely expressed, and are each characterized by distinct modes of activation (Rebecchi & Pentyala, 2000). Whilst the physiological activation of the PLCβ and PLCγ enzymes involves the actions of G protein subunits and tyrosine kinases, respectively, the mechanisms underlying physiological activation of PLCδ enzymes are unclear. However, it is recognized that the PLCδ enzymes are particularly sensitive to activation by increases in Ca2+ alone (Allen et al. 1997), suggesting members of this group as potential candidates for mediating the Ca2+ entry induced depletion of PIP2 seen in the above experiments. The activity of PLCδ is known to specifically depend on high affinity binding (Kd = 10–100 nm) of the enzyme to the negatively charged inositol phosphate headgroup of PIP2 via its N-terminal PH domain (Yagisawa et al. 1994). This binding can be competitively disrupted by the presence of excess InsP3 (Cifuentes et al. 1994; Allen et al. 1997). We therefore examined the effect of a high concentration of intracellular InsP3 on the ability of activated ARC channels to induce the depletion of PIP2, as measured by the decline in Kir2.1 channel activity. The data obtained showed that inclusion of 50 μm InsP3 in the pipette solution, a concentration reported to produce an almost complete block of the PLCδ PH domain to PIP2-containing vesicles (Cifuentes et al. 1994; Kavran et al. 1998), reduced the decline in Kir2.1 currents seen on activation of the ARC channels by more than 70% (Fig. 4A).
Figure 4. ARC channel mediated Ca2+ entry activates PLCδ3.
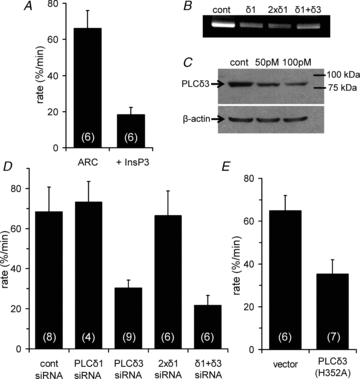
A, inclusion of a high concentration of InsP3 (50 μm) in the pipette solution inhibits the ARC channel-mediated inhibition of Kir2.1 channel currents. Values are means ± SEM. B, representative PCR results showing PLCδ1 RNA levels following expression (100 pmol per siRNA) of a control siRNA (cont), a single siRNA to PLCδ1 (δ1), or combinations of either two different siRNAs to PLCδ1 (2×δ1), or siRNAs to PLCδ1 and PLCδ3 (δ1+δ3). C, representative Western analysis of PLCδ3 protein levels following transfection with a control siRNA, and two different concentrations of the PLCδ3 siRNA, along with β-actin as a loading control. D, effect of expression of various siRNAs (100 pmol per siRNA) on ARC channel induced inhibition of Kir2.1 channel currents. Shown are the mean ± SEM rates of Kir2.1 current inhibition with a control siRNA (cont), with single siRNAs to either PLCδ1, or PLCδ3, two different siRNAs to PLCδ1 (2×δ1), or a combination of siRNAs to PLCδ1 and PLCδ3 (δ1+δ3). E, effect of expression of either an empty vector, or the same vector containing the PLCδ3-H352A mutant construct, on the ARC channel-mediated inhibition of Kir2.1 channel currents. Values are means ± SEM with n shown in parentheses.
Of the three members of the PLCδ family (PLCδ1, PLCδ3 and PLCδ4), the δ1 and δ3 forms are the most widely expressed, display broadly similar biochemical and biophysical properties, and are localized to the plasma membrane. In contrast, PLCδ4 is found predominantly in nuclear and ER membranes and, more importantly, displacement of the enzyme from PIP2 requires much higher concentrations of InsP3 (Kd∼200 μm for PLCδ4, versus∼5–10 μm for PLCδ1 and PLCδ3) (Pawelczyk & Matecki, 1999; Lee et al. 2004). Based on our finding that 50 μm InsP3 can effectively block the ARC channel-induced PIP2 depletion, we focused on the PLCδ1 and PLCδ3 enzymes. We began by using an siRNA knock-down approach (Fig. 4B–D). Whilst siRNA-induced reductions in PLCδ3 could be readily detected at the protein level (Fig. 4C), attempts to use similar techniques to evaluate siRNA knock-down of PLCδ1 protein proved problematic, possibly because of low levels of the protein in the cells or limited effectiveness of the available antibodies. Knock-down of PLCδ1 was therefore demonstrated at the mRNA level. Expression of a PLCδ1 siRNA that induced a marked reduction in PLCδ1 mRNA levels (Fig. 4B) failed to significantly affect the rate of PIP2 depletion induced by ARC channel activation (P = 0.80). In marked contrast, expression of a PLCδ3 siRNA dramatically reduced the rate of ARC channel-induced PIP2 depletion by 62%. The failure of the PLCδ1 siRNA to affect the rate of PIP2 depletion was unlikely to be due to any mis-targeting of the siRNA, as combining this siRNA with another siRNA targeted to a different sequence of PLCδ1 also failed to affect the rate of PIP2 depletion (P = 0.92). Finally, combining siRNAs to both PLCδ1 and PLCδ3 did not induce any significant further inhibition above that seen with the PLCδ3 siRNA alone (P = 0.20). Together, these data indicate that the observed effect on PIP2 depletion by the Ca2+ entering via the ARC channels is exclusively mediated by an activation of a PLCδ3 enzyme.
To confirm this specific role of PLCδ3, we examined the effect of expressing a form of the enzyme incorporating a mutation that is predicted to dramatically reduce the catalytic activity of the enzyme without affecting its sensitivity to activation by Ca2+. Mutational analyses have shown that the activity of the various PLC enzyme isoforms is critically determined by a limited series of highly conserved residues within the X and Y catalytic domains (Rebecchi & Pentyala, 2000). In particular, histidine to alanine mutation of a single residue located within the X domain of PLCδ1 (H311) has been shown to profoundly reduce the ability of the enzyme to hydrolyse PIP2 without significantly affecting its sensitivity to Ca2+ (Ellis et al. 1998). Because this residue is conserved in all eukaryotic PLC enzymes, we examined the effect of expressing the corresponding H352A mutant version of PLCδ3 on the ability of the active ARC channels to induce a depletion of PIP2. The results obtained (Fig. 4E) show that expression of this mutant PLCδ3 reduced the rate at which the activated ARC channels induced the depletion of PIP2 by more than 50% (P = 0.01), consistent with a specific role of PLCδ3 in the observed ARC channel-mediated depletion of membrane PIP2.
PLCδ3 activity modulates agonist-induced oscillatory Ca2+ responses
Whilst the above data demonstrate a unique activation of PLCδ activity by Ca2+ entering specifically via the store-independent ARC channels, the actual physiological significance of this effect remains uncertain. In part, this results from the high sensitivity of the current assay, as demonstrated by its ability to detect PLC activity even under resting conditions. Consequently, although a large effect was demonstrated in the above experiments, this does not necessarily imply that such activity would contribute significantly to the overall agonist response. In fact, in previous studies using a biochemical assay, pharmacological inhibition of arachidonic acid generation, and hence ARC channel activity, failed to reveal any significant effect on the measurable generation of total inositol phosphates at low concentrations of agonist (Shuttleworth & Thompson, 1998). This is despite the fact that direct activation of the ARC channels clearly does induce an increase in cytosolic Ca2+ that occurs without any detectible release of stored Ca2+ (Shuttleworth & Thompson, 1998). Moreover, overall PLC activity during agonist activation in intact cells is complex and involves multiple interacting pathways. For example, although the receptor-mediated stimulation of PLCβ is strictly dependent on the activation of Gq, the actual activity of the Gq-activated enzyme is highly dependent on increases in Ca2+ concentrations above basal levels (∼100 nm) up to approximately 5–10 μm (Taylor & Exton, 1987; Smrcka et al. 1991; Horowitz et al. 2005). Together, these factors suggest that, although the current assay is suitable for demonstrating the presence and nature of the specific effect we have identified, it may not be appropriate for quantifying its contribution to an overall agonist-induced response. Therefore, in order to evaluate the contribution of the ARC channel-mediated activation of PLCδ reported here in a physiologically relevant agonist-activated Ca2+ response we used a HEK293 cell line stably expressing the muscarinic m3 receptor (m3-HEK cells). Previous studies using this cell line have demonstrated the key role of Ca2+ entry in agonist-induced oscillatory Ca2+ signals, and the effects of the pharmacological inhibition of agonist-induced arachidonic acid generation on oscillation frequency (Shuttleworth, 1996; Shuttleworth & Thompson, 1998), as well as the specific activation of the ARC channels under identical agonist conditions (Mignen et al. 2001). Critically, similar data have also been obtained in other cell types (Mignen et al. 2005). Preliminary experiments showed that stimulation of the m3-HEK cells with a low concentration of the muscarinic agonist carbachol (0.5 μm) resulted in the development of oscillatory Ca2+ responses in a high proportion of cells that could be sustained for several minutes (Fig. 5A). To confirm the involvement of ARC channel activity in the modulation of such oscillatory signals in these cells, we examined the effect of expressing the same dominant-negative E81Q mutant Orai3 used above. Importantly, we have shown that expression of this mutant Orai3 resulted in a less than complete reduction (approximately 60%) of PLC activity (Fig. 3A). As such, this would likely ensure that at least some level of oscillatory response would still be present, thereby allowing comparison with the corresponding response in control (vector-transfected) cells. Oscillatory Ca2+ responses to application of a low concentration of the muscarinic agonist carbachol (0.5 μm) were recorded in transfected cells, as identified by the presence of a co-transfected nuclear-targeted DsRed2 probe, and were analysed as the mean number of oscillations in the recorded cells for each experimental run (see Methods for details). The data obtained revealed that expression of the E81Q-Orai3 mutant resulted in a reduction of approximately 34% in the frequency of the agonist-induced Ca2+ oscillations, declining from a value of 30.8 ± 2.0 oscillations per 20 min (n = 6) in control vector-expressing cells, to 20.5 ± 1.4 oscillations per 20 min (n = 10) in the E81Q-Orai3 mutant expressing cells (P = 0.0006) (Fig. 5B; for representative traces from individual cells, see Fig. S1). Consistent with the earlier pharmacological and electrophysiological data (Shuttleworth, 1996; Shuttleworth & Thompson, 1998; Mignen et al. 2005), these findings directly demonstrate a significant role for the ARC channels in modulating agonist-induced Ca2+ oscillation frequencies.
Figure 5. PLCδ3 activity modulates agonist-induced oscillation frequency.
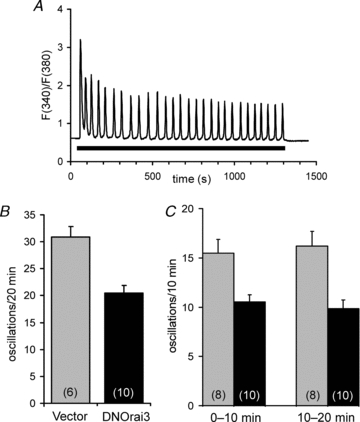
A, representative trace showing a typical oscillatory Ca2+ response to a low concentration of the agonist carbachol (0.5 μm) in a HEK cell stably expressing the m3 muscarinic receptor (m3-HEK cell). The Ca2+ signal is represented as the Fura-2 fluorescence ratio (F340/F380), calculated after background subtraction. The bar represents the period during which carbachol was present. B, oscillation frequency in response to 0.5 μm carbachol in m3-HEK cells expressing either a control vector (grey bars), or the dominant-negative E81Q-Orai3 (black bars). Oscillation frequency was measured as the number of Ca2+ oscillations recorded in cells for the 20 min period following agonist addition. Values are means ± SEM with n shown in parentheses. See Fig. S1 for representative individual traces. C, oscillation frequency in response to 0.5 μm carbachol in m3-HEK cells expressing either the wild-type PLCδ3 (grey bars), or the catalytically impaired H352A mutant PLCδ3 (black bars). Oscillation frequency was measured as the number of Ca2+ oscillations recorded in cells during the first and second 10 min periods after agonist addition, as indicated. Values are mean ± SEM with n shown in parentheses. See Fig. S1 for representative individual traces.
If, as proposed, this ARC channel effect is mediated via the activation of PLCδ3, then oscillation frequency should similarly be affected by the activity of this enzyme. To evaluate this, we chose to investigate the effect of expression of the catalytically impaired PLCδ3 H352A mutant in these cells, and to compare this with a similar expression of the wild-type PLCδ3. Our reasoning in choosing this approach was twofold. First, the ability to compare any effect with that of the wild-type would emphasize a response dependent on the catalytic activity of the enzyme per se, rather than any potential effect involving PIP2 binding, Ca2+ sensitivity, etc. Secondly, initial experiments revealed that, compared to cells expressing the wild-type PLCδ3, expression of the PLCδ3 H352A mutant reduced the rate of ARC channel PIP2 depletion by 57% (from 83.1 ± 14.5% min−1, n = 5, to 35.3 ± 6.7% min−1, n = 7). Consequently, just as with the E81Q-Orai3 mutant above, this less than complete reduction of PLC activity would facilitate comparisons with the corresponding control cells expressing the wild-type enzyme. Examination of the effect of expression of these PLCδ3 constructs on the oscillatory Ca2+ responses induced by 0.5 μm carbachol revealed that expression of the mutant PLCδ3 reduced the frequency of the agonist-induced Ca2+ oscillations from a value of 31.7 ± 2.9 oscillations per 20 min (n = 8) in wild-type PLCδ3-expressing cells, to 20.4 ± 1.5 oscillations per 20 min (n = 10) in the mutant PLCδ3-expressing cells, equivalent to a reduction of more than 35% (P = 0.002) (see Fig. S1 for representative traces from individual cells). Furthermore, examination of the oscillation frequencies in each of the two 10 min periods of measurement (Fig. 5C) showed that this effect was apparent in both phases of the response, indicating that the effect is essentially ‘constitutive’ rather than progressive. As such, this is consistent with an effect of the enzyme on oscillatory signals from a point early in the overall response.
Discussion
In the above experiments, we have demonstrated that Ca2+ entering specifically via the store-independent ARC channels induces a loss of membrane PIP2 via the activation of a PLCδ3 enzyme. We also demonstrate that this effect is not an action of the arachidonic acid used to activate the channels, but is strictly dependent on the induced entry of Ca2+ itself. This is important as arachidonic acid is reported to have multiple effects on various proteins, including an ability to directly bind to and activate PLCδ1 (Kobayashi et al. 2004). Similarly, the observed depletion of membrane PIP2 could have occurred through various means other than a PLC-mediated hydrolysis, including the action of phospholipid phosphatases. In the past, a common approach to evaluate a specific role of PLC activity in PIP2 depletion is to use the PLC inhibitor U73122. However, this drug has been shown to inhibit the Kir2.1 channel, independent of any effect on PLC activity (Hardie et al. 2004), and to display additional potentially relevant actions including partial activation of PLC, stimulation of lipid phosphatases, and inhibition of PI and PIP kinases (Horowitz et al. 2005). Instead, in our studies, we used both an siRNA approach, and the over-expression of a catalytically impaired PLCδ3 construct to demonstrate its specific involvement in the effects observed. However, because both PLCδ3 and PLCδ1 share many essential biochemical features, we cannot exclude the possibility that the PLCδ1 enzyme might perform the same function in other cell types.
Two critical points arise from the data obtained. First, PLCδ3 activity is entirely unaffected by global increases in cytosolic Ca2+ within the normal physiological range. Secondly, the effect is specifically limited to the Ca2+ entering via the store-independent ARC channels, as entry via the store-operated CRAC channels is entirely ineffective, despite the similarity in the total Ca2+ current magnitude recorded in each case. Together, these findings suggest that activation of the enzyme is dependent on a spatially limited region of relatively high Ca2+ concentration located close to the active ARC channels. There are several possible explanations for this selective activation by ARC channel activity. For example, even though the measured total cellular Ca2+ currents are identical (Fig. 2A), the single channel conductance of the ARC channels could be much higher than that of the CRAC channels, resulting in higher local Ca2+ concentrations close to the active channels. Alternatively, a local domain of significantly elevated Ca2+ could result from the spatial clustering of the ARC channels in the membrane. Of course, any highly localized activation of the PLCδ3 may not necessarily involve a direct physical coupling between the channels and the enzyme. Indeed, experiments designed to reveal any such direct molecular coupling by examining the ability of Orai3, Orai1, or STIM1 to co-immunoprecipitate with PLCδ3 failed to show any indication of such a direct interaction. Similarly, application of a bimolecular fluorescence complementation approach (Hynes et al. 2004; Kerppola, 2006) using expressed constructs of PLCδ3 and either Orai3, Orai1, or STIM1 tagged with complimentary halves of eYFP also failed to result in any detectible fluorescence signal indicative of such a direct interaction (data not shown). It is possible that the observed effects could involve some form of intermediate ‘Ca2+-sensor’ that is activated by the Ca2+ entering via the channel, and which then diffuses to the PLCδ3 in order to activate it. However, to date, no such Ca2+-sensitive modulator of PLCδ has been identified and it is well established that the PLCδ enzymes themselves are directly activated by increases in Ca2+ (Allen et al. 1997; Pawelczyk & Matecki, 1998; Varnai & Balla, 1998). Consequently, we suggest only that the observed effect reflects an intimate functional interaction between the PLCδ3 and the channels.
To obtain some estimate of the potential spatial limits for such an interaction we used calculations based on the three-dimensional diffusion of Ca2+ ions from a point source into an exogenously buffered solution (Neher, 1986) to estimate the concentration of free Ca2+ ions at various distances from an ‘entry site’ (either an individual channel or a cluster of closely associated channels) displaying different values of inward Ca2+ current (see Fig. S2). Although the actual magnitude of the currents at such entry sites is unknown, the range of possible values is ultimately constrained by the finite size of the whole-cell ARC channel current (approximately 3.3 pA at –70 mV), and reasonable estimates for the minimum number of such sites in the cell. Using such a range of values, and published values for the concentrations of Ca2+ required to effectively activate PLCδ under physiologically relevant conditions (5–10 μm) (Pawelczyk & Matecki, 1998; Varnai & Balla, 1998), the calculations indicate that the activation of the PLCδ3 by Ca2+ entering via the ARC channels is likely to reflect a functional interaction that occurs within a few tens of nanometres (<25 nm) of the channels. Consequently, the failure of a similar overall rate of Ca2+ entry via the CRAC channels to activate this enzyme could simply reflect the failure of the PLCδ3 to be appropriately targeted to sites close to these channels. Alternatively, if the CRAC channels are dispersed within the plasma membrane, this would result in a very low Ca2+ flux per individual ‘entry site’ that would probably not be adequate to significantly activate the enzyme. However, possibly arguing against such an explanation is the recent evidence showing that activation of the CRAC channels actually involves the clustering of the channels into discrete puncta (Luik et al. 2006; Xu et al. 2006). Of course, modulation of the activity of specific enzymes by their targeting to discrete microdomains associated with such small conductance Ca2+ entry channels is not a novel finding. For example, local Ca2+ entry via the store-operated CRAC channels has been shown to directly influence the activity of nitric oxide synthase (Lin et al. 2000), and the plasma membrane Ca2+ pump (Bautista & Lewis, 2004), as well as the activity of various isoforms of adenylyl cyclase (Fagan et al. 1996). Interestingly, in this last example, activation of the relevant adenylyl cyclases has also been shown to display a pronounced selectivity for the specific Orai channels involved except that, in this case, it is strictly dependent on Ca2+ entering via the CRAC channels, whilst entry via the ARC channels is entirely without effect (Shuttleworth & Thompson, 1999).
In summary, we have demonstrated a specific activation of PLCδ3 by Ca2+ entering via the store-independent ARC channels, and shown that such activity has a marked effect on the frequency of the oscillatory Ca2+ signals generated by low agonist concentrations. Presumably this simply reflects an action of the InsP3 generated as a result of the ‘Ca2+ entry-dependent’ PLCδ3 activity, adding to that arising from the more widely recognized agonist-dependent PLCβ (or PLCγ) activity. Whilst it could be argued that this PLCδ3 activity might compete with the agonist-activated PLCs for available PIP2, limiting the extent of any potential additive effect, our demonstration that specific inhibition of the PLCδ3 catalytic activity has a clear effect on the agonist-induced oscillatory Ca2+ signal suggests that any such competition must be limited. Moreover, this effect is likely to be restricted to only those conditions applying during stimulation at low agonist concentrations, as it has been shown that at higher agonist concentrations when the CRAC channels become activated, the ARC channels are actually inhibited in a reciprocal fashion (Mignen et al. 2001). Consequently, any potential competition between the activities of the Ca2+ entry-activated PLCδ3 and agonist-activated PLCβ or PLCγ would only occur at low agonist concentrations and, presumably, relatively low PLCβ/γ activities.
Another potentially relevant point is that several studies have reported that Ca2+ entry has an additional effect on Ca2+ signals in that it modulates the initial delay, or latency period of the signal – the time between addition of the agonist and the initiation of the first detectible increase in cytosolic Ca2+ (Rooney et al. 1989; Berridge, 1994; Shuttleworth & Thompson, 1996). In this context, it is clear that the store-independent activation of the ARC channels, and the resulting stimulation of PLCδ3 and generation of additional InsP3, would be expected to reduce the time required for the cell to achieve the necessary concentration of InsP3 to initiate Ca2+ release. However, it is important to note that, although our data demonstrate a profound effect on the activity of the PIP2-dependent Kir2.1 channel currents, we do not interpret this as indicating that the ARC channel effect on PLCδ activity represents a major contribution to overall agonist-activated InsP3 generation. Rather, it simply reflects the high sensitivity of the assay system used. Consistent with this, previous studies have shown that activation of Ca2+ entry via the ARC channels does not generate sufficient InsP3 to induce any detectible Ca2+ release from InsP3 sensitive stores (Shuttleworth, 1996). Thus, the response described here is likely to act only as an ‘amplifier’ of the traditional agonist-activated InsP3 response. Interestingly, just such a suggestion that the main role of PLCδ might be to act as a signal amplifier, rather than a signal initiator, was proposed in an early review based on the unique biochemical properties of this enzyme (Rebecchi & Pentyala, 2000).
Finally, it should be noted that the effects described here were seen with all the relevant proteins present at endogenous levels. This includes the Orai1 and Orai3 proteins that form the ARC channel, the plasma membrane STIM1 that regulates its activity, and the PLCδ3 enzyme responsible. Therefore, we would predict that the observed interactions and their effects are likely to be relevant in native cells. Critically, this unique role of the ARC channels in activating a PLCδ enzyme to modulate oscillatory Ca2+ signals is consistent with the previous demonstration, in various cell types, of the dependence of oscillatory Ca2+ signals on the agonist-induced generation of arachidonic acid (Shuttleworth, 1996; Shuttleworth & Thompson, 1998), and the specific and selective activation of the ARC channels under these same conditions (Mignen et al. 2001, 2005).
Acknowledgments
We thank Dr Roger Hardie for generously providing the Kir2.1-R228Q mutant construct, Dr Alan Smrcka, and Dr David Yule for helpful comments, and Pauline Leakey for excellent technical assistance. This work was supported by National Institutes of Health Grants GM040457 and DE019245.
Glossary
Abbreviations
- ARC channel
arachidonate-regulated Ca2+ channel
- CRAC channel
Ca2+ release-activated Ca2+ channel
- Kir channel
inwardly rectifying potassium channel
- PIP2
phosphatidylinositol 4,5-bisphosphate
- PLC
phospholipase C
- STIM1
stromal interacting molecule 1
Author contributions
J.T., and T.S. both contributed to the conception, design, analysis and interpretation of the data. T.S. drafted the article, with assistance from J.T. Both authors have approved the final version.
Supplementary material
Supplementary Fig. S1
Supplementary Fig. S2
As a service to our authors and readers, this journal provides supporting information supplied by the authors. Such materials are peer-reviewed and may be re-organized for online delivery, but are not copy-edited or typeset. Technical support issues arising from supporting information (other than missing files) should be addressed to the authors
References
- Allen V, Swigart P, Cheung R, Cockcroft S, Katan M. Regulation of inositol lipid-specific phospholipase C delta by changes in Ca2+ ion concentrations. Biochem J. 1997;327:545–552. doi: 10.1042/bj3270545. [DOI] [PMC free article] [PubMed] [Google Scholar]
- Ashby MC, Camello-Almaraz C, Gerasimenko OV, Petersen OH, Tepikin AV. Long distance communication between muscarinic receptors and Ca2+ release channels revealed by carbachol uncaging in cell-attached patch pipette. J Biol Chem. 2003;278:20860–20864. doi: 10.1074/jbc.M302599200. [DOI] [PubMed] [Google Scholar]
- Bautista DM, Lewis RS. Modulation of plasma membrane calcium-ATPase activity by local calcium microdomains near CRAC channels in human T cells. J Physiol. 2004;556:805–817. doi: 10.1113/jphysiol.2003.060004. [DOI] [PMC free article] [PubMed] [Google Scholar]
- Berridge MJ. Relationship between latency and period for 5-hydroxytryptamine- induced membrane responses in the Calliphora salivary gland. Biochem J. 1994;302:545–550. doi: 10.1042/bj3020545. [DOI] [PMC free article] [PubMed] [Google Scholar]
- Bezprozvanny I, Watras J, Ehrlich BE. Bell-shaped calcium-response curves of Ins(1,4,5)P3- and calcium-gated channels from endoplasmic reticulum of cerebellum. Nature. 1991;351:751–754. doi: 10.1038/351751a0. [DOI] [PubMed] [Google Scholar]
- Bird GS, Putney JW., Jr Capacitative calcium entry supports calcium oscillations in human embryonic kidney cells. J Physiol. 2005;562:697–706. doi: 10.1113/jphysiol.2004.077289. [DOI] [PMC free article] [PubMed] [Google Scholar]
- Bootman MD, Young KW, Young JM, Moreton RB, Berridge MJ. Extracellular calcium concentration controls the frequency of intracellular calcium spiking independently of inositol 1,4,5-trisphosphate production in HeLa cells. Biochem J. 1996;314:347–354. doi: 10.1042/bj3140347. [DOI] [PMC free article] [PubMed] [Google Scholar]
- Cifuentes ME, Delaney T, Rebecchi MJ. d-myo-Inositol 1,4,5-trisphosphate inhibits binding of phospholipase C-δ1 to bilayer membranes. J Biol Chem. 1994;269:1945–1948. [PubMed] [Google Scholar]
- De Koninck P, Schulman H. Sensitivity of CaM kinase II to the frequency of Ca2+ oscillations. Science. 1998;279:227–230. doi: 10.1126/science.279.5348.227. [DOI] [PubMed] [Google Scholar]
- Dolmetsch RE, Xu KL, Lewis RS. Calcium oscillations increase the efficiency and specificity of gene expression. Nature. 1998;392:933–936. doi: 10.1038/31960. [DOI] [PubMed] [Google Scholar]
- Dupont G, Combettes L, Bird GS, Putney JW. Calcium oscillations. Cold Spring Harb Perspect Biol. 2011;3:a004226. doi: 10.1101/cshperspect.a004226. [DOI] [PMC free article] [PubMed] [Google Scholar]
- Ellis MV, James SR, Perisic O, Downes CP, Williams RL, Katan M. Catalytic domain of phosphoinositide-specific phospholipase C (PLC)Mutational analysis of residues within the active site and hydrophobic ridge of PLCδ1. J Biol Chem. 1998;273:11650–11659. doi: 10.1074/jbc.273.19.11650. [DOI] [PubMed] [Google Scholar]
- Fagan KA, Mahey R, Cooper DM. Functional co-localization of transfected Ca2+-stimulable adenylyl cyclases with capacitative Ca2+ entry sites. J Biol Chem. 1996;271:12438–12444. doi: 10.1074/jbc.271.21.12438. [DOI] [PubMed] [Google Scholar]
- Hajnoczky G, Robb-Gaspers LD, Seitz MB, Thomas AP. Decoding of cytosolic calcium oscillations in the mitochondria. Cell. 1995;82:415–424. doi: 10.1016/0092-8674(95)90430-1. [DOI] [PubMed] [Google Scholar]
- Hardie RC, Gu Y, Martin F, Sweeney ST, Raghu P. In vivo light-induced and basal phospholipase C activity in Drosophila photoreceptors measured with genetically targeted phosphatidylinositol 4,5-bisphosphate-sensitive ion channels (Kir2.1) J Biol Chem. 2004;279:47773–47782. doi: 10.1074/jbc.M407525200. [DOI] [PubMed] [Google Scholar]
- Horowitz LF, Hirdes W, Suh BC, Hilgemann DW, Mackie K, Hille B. Phospholipase C in living cells: activation, inhibition, Ca2+ requirement, and regulation of M current. J Gen Physiol. 2005;126:243–262. doi: 10.1085/jgp.200509309. [DOI] [PMC free article] [PubMed] [Google Scholar]
- Hynes TR, Tang L, Mervine SM, Sabo JL, Yost EA, Devreotes PN, Berlot CH. Visualization of G protein βγ dimers using bimolecular fluorescence complementation demonstrates roles for both β and γ in subcellular targeting. J Biol Chem. 2004;279:30279–30286. doi: 10.1074/jbc.M401432200. [DOI] [PubMed] [Google Scholar]
- Jing X, Chen L, Ren S, Luo D. Rational method in the repetitive calcium oscillation measurement in wild type human epithelial kidney cells. Cytotechnology. 2011;63:81–88. doi: 10.1007/s10616-010-9332-7. [DOI] [PMC free article] [PubMed] [Google Scholar]
- Kavran JM, Klein DE, Lee A, Falasca M, Isakoff SJ, Skolnik EY, Lemmon MA. Specificity and promiscuity in phosphoinositide binding by pleckstrin homology domains. J Biol Chem. 1998;273:30497–30508. doi: 10.1074/jbc.273.46.30497. [DOI] [PubMed] [Google Scholar]
- Kawanishi T, Blank LM, Harootunian AT, Smith MT, Tsien RY. Ca2+ oscillations induced by hormonal stimulation of individual fura-2-loaded hepatocytes. J Biol Chem. 1989;264:12859–12866. [PubMed] [Google Scholar]
- Kerppola TK. Design and implementation of bimolecular fluorescence complementation (BiFC) assays for the visualization of protein interactions in living cells. Nat Protoc. 2006;1:1278–1286. doi: 10.1038/nprot.2006.201. [DOI] [PMC free article] [PubMed] [Google Scholar]
- Kobayashi M, Mutharasan RK, Feng J, Roberts MF, Lomasney JW. Identification of hydrophobic interactions between proteins and lipids: free fatty acids activate phospholipase C δ1 via allosterism. Biochemistry. 2004;43:7522–7533. doi: 10.1021/bi035966c. [DOI] [PubMed] [Google Scholar]
- Kobrinsky E, Mirshahi T, Zhang H, Jin T, Logothetis DE. Receptor-mediated hydrolysis of plasma membrane messenger PIP2 leads to K+-current desensitization. Nat Cell Biol. 2000;2:507–514. doi: 10.1038/35019544. [DOI] [PubMed] [Google Scholar]
- Lee SB, Varnai P, Balla A, Jalink K, Rhee SG, Balla T. The pleckstrin homology domain of phosphoinositide-specific phospholipase Cδ4 is not a critical determinant of the membrane localization of the enzyme. J Biol Chem. 2004;279:24362–24371. doi: 10.1074/jbc.M312772200. [DOI] [PubMed] [Google Scholar]
- Lin S, Fagan KA, Li KX, Shaul PW, Cooper DMF, Rodman DM. Sustained endothelial nitric-oxide synthase activation requires capacitative Ca2+ entry. J Biol Chem. 2000;275:17979–17985. doi: 10.1074/jbc.275.24.17979. [DOI] [PubMed] [Google Scholar]
- Luik RM, Wu MM, Buchanan J, Lewis RS. The elementary unit of store-operated Ca2+ entry: local activation of CRAC channels by STIM1 at ER-plasma membrane junctions. J Cell Biol. 2006;174:815–825. doi: 10.1083/jcb.200604015. [DOI] [PMC free article] [PubMed] [Google Scholar]
- Mak DO, McBride S, Foskett JK. Inositol 1,4,5-trisphosphate activation of inositol trisphosphate receptor Ca2+ channel by ligand tuning of Ca2+ inhibition. Proc Natl Acad Sci U S A. 1998;95:15821–15825. doi: 10.1073/pnas.95.26.15821. [DOI] [PMC free article] [PubMed] [Google Scholar]
- Martin SC, Shuttleworth TJ. Ca2+ influx drives agonist-activated [Ca2+]i oscillations in an exocrine cell. FEBS Lett. 1994;352:32–36. doi: 10.1016/0014-5793(94)00913-9. [DOI] [PubMed] [Google Scholar]
- Mignen O, Thompson JL, Shuttleworth TJ. Reciprocal regulation of capacitative and arachidonate-regulated noncapacitative Ca2+ entry pathways. J Biol Chem. 2001;276:35676–35683. doi: 10.1074/jbc.M105626200. [DOI] [PubMed] [Google Scholar]
- Mignen O, Thompson JL, Shuttleworth TJ. Ca2+ selectivity and fatty acid specificity of the noncapacitative, arachidonate-regulated Ca2+ (ARC) channels. J Biol Chem. 2003;278:10174–10181. doi: 10.1074/jbc.M212536200. [DOI] [PubMed] [Google Scholar]
- Mignen O, Thompson JL, Shuttleworth TJ. Both Orai1 and Orai3 are essential components of the arachidonate-regulated Ca2+-selective (ARC) channels. J Physiol. 2008;586:185–195. doi: 10.1113/jphysiol.2007.146258. [DOI] [PMC free article] [PubMed] [Google Scholar]
- Mignen O, Thompson JL, Yule DI, Shuttleworth TJ. Agonist activation of arachidonate-regulated Ca2+-selective (ARC) channels in murine parotid and pancreatic acinar cells. J Physiol. 2005;564:791–801. doi: 10.1113/jphysiol.2005.085704. [DOI] [PMC free article] [PubMed] [Google Scholar]
- Neher E. Concentration profiles of intracellular calcium in the presence of a diffusible chelator. Exp Brain Res Ser. 1986;14:80–96. [Google Scholar]
- Parekh AB, Putney JW., Jr Store-operated calcium channels. Physiol Rev. 2005;85:757–810. doi: 10.1152/physrev.00057.2003. [DOI] [PubMed] [Google Scholar]
- Pawelczyk T, Matecki A. Localization of phospholipase C δ3 in the cell and regulation of its activity by phospholipids and calcium. Eur J Biochem. 1998;257:169–177. doi: 10.1046/j.1432-1327.1998.2570169.x. [DOI] [PubMed] [Google Scholar]
- Pawelczyk T, Matecki A. Phospholipase C-δ3 binds with high specificity to phosphatidylinositol 4,5-bisphosphate and phosphatidic acid in bilayer membranes. Eur J Biochem. 1999;262:291–298. doi: 10.1046/j.1432-1327.1999.00388.x. [DOI] [PubMed] [Google Scholar]
- Petersen OH. Localization and regulation of Ca2+ entry and exit pathways in exocrine gland cells. Cell Calcium. 2003;33:337–344. doi: 10.1016/s0143-4160(03)00047-2. [DOI] [PubMed] [Google Scholar]
- Putney JW. The physiological function of store-operated calcium entry. Neurochem Res. 2011;36:1157–1165. doi: 10.1007/s11064-010-0383-0. [DOI] [PMC free article] [PubMed] [Google Scholar]
- Rebecchi MJ, Pentyala SN. Structure, function, and control of phosphoinositide-specific phospholipase C. Physiol Rev. 2000;80:1291–1335. doi: 10.1152/physrev.2000.80.4.1291. [DOI] [PubMed] [Google Scholar]
- Rooney TA, Sass EJ, Thomas AP. Characterization of cytosolic calcium oscillations induced by phenylephrine and vasopressin in single fura-2-loaded hepatocytes. J Biol Chem. 1989;264:17131–17141. [PubMed] [Google Scholar]
- Shuttleworth TJ. Arachidonic acid activates the noncapacitative entry of Ca2+ during [Ca2+]i oscillations. J Biol Chem. 1996;271:21720–21725. doi: 10.1074/jbc.271.36.21720. [DOI] [PubMed] [Google Scholar]
- Shuttleworth TJ. What drives calcium entry during [Ca2+]i oscillations?– Challenging the capacitative model. Cell Calcium. 1999;25:237–246. doi: 10.1054/ceca.1999.0022. [DOI] [PubMed] [Google Scholar]
- Shuttleworth TJ, Thompson JL. Evidence for a non-capacitative Ca2+ entry during [Ca2+] oscillations. Biochem J. 1996;316:819–824. doi: 10.1042/bj3160819. [DOI] [PMC free article] [PubMed] [Google Scholar]
- Shuttleworth TJ, Thompson JL. Muscarinic receptor activation of arachidonate-mediated Ca2+ entry in HEK293 cells is independent of phospholipase C. J Biol Chem. 1998;273:32636–32643. doi: 10.1074/jbc.273.49.32636. [DOI] [PubMed] [Google Scholar]
- Shuttleworth TJ, Thompson JL. Discriminating between capacitative and arachidonate-activated Ca2+ entry pathways in HEK293 cells. J Biol Chem. 1999;274:31174–31178. doi: 10.1074/jbc.274.44.31174. [DOI] [PubMed] [Google Scholar]
- Shuttleworth TJ, Thompson JL, Mignen O. ARC channels: a novel pathway for receptor-activated calcium entry. Physiology (Bethesda) 2004;19:355–361. doi: 10.1152/physiol.00018.2004. [DOI] [PubMed] [Google Scholar]
- Smrcka AV, Hepler JR, Brown KO, Sternweis PC. Regulation of polyphosphoinositide-specific phospholipase C activity by purified Gq. Science. 1991;251:804–807. doi: 10.1126/science.1846707. [DOI] [PubMed] [Google Scholar]
- Takemura H, Hughes AR, Thastrup O, Putney JW., Jr Activation of calcium entry by the tumor promoter thapsigargin in parotid acinar cells. Evidence that an intracellular calcium pool, and not an inositol phosphate, regulates calcium fluxes at the plasma membrane. J Biol Chem. 1989;264:12266–12271. [PubMed] [Google Scholar]
- Takemura H, Putney JW., Jr Capacitative calcium entry in parotid acinar cells. Biochem J. 1989;258:409–412. doi: 10.1042/bj2580409. [DOI] [PMC free article] [PubMed] [Google Scholar]
- Taylor CW, Laude AJ. IP3 receptors and their regulation by calmodulin and cytosolic Ca2+ Cell Calcium. 2002;32:321–334. doi: 10.1016/s0143416002001859. [DOI] [PubMed] [Google Scholar]
- Taylor SJ, Exton JH. Guanine-nucleotide and hormone regulation of polyphosphoinositide phospholipase C activity of rat liver plasma membranes. Bivalent-cation and phospholipid requirements. Biochem J. 1987;248:791–799. doi: 10.1042/bj2480791. [DOI] [PMC free article] [PubMed] [Google Scholar]
- Varnai P, Balla T. Visualization of phosphoinositides that bind pleckstrin homology domains: calcium- and agonist-induced dynamic changes and relationship to myo-[3H]inositol-labeled phosphoinositide pools. J Cell Biol. 1998;143:501–510. doi: 10.1083/jcb.143.2.501. [DOI] [PMC free article] [PubMed] [Google Scholar]
- Wedel B, Boyles RR, Putney JW, Bird GS. Role of the store-operated calcium entry proteins, Stim1 and Orai1, in muscarinic-cholinergic receptor stimulated calcium oscillations in human embryonic kidney cells. J Physiol. 2007;579:679–689. doi: 10.1113/jphysiol.2006.125641. [DOI] [PMC free article] [PubMed] [Google Scholar]
- Xu P, Lu J, Li Z, Yu X, Chen L, Xu T. Aggregation of STIM1 underneath the plasma membrane induces clustering of Orai1. Biochem Biophys Res Commun. 2006;350:969–976. doi: 10.1016/j.bbrc.2006.09.134. [DOI] [PubMed] [Google Scholar]
- Yagisawa H, Hirata M, Kanematsu T, Watanabe Y, Ozaki S, Sakuma K, Tanaka H, Yabuta N, Kamata H, Hirata H. Expression and characterization of an inositol 1,4,5-trisphosphate binding domain of phosphatidylinositol-specific phospholipase C-δ1. J Biol Chem. 1994;269:20179–20188. [PubMed] [Google Scholar]
Associated Data
This section collects any data citations, data availability statements, or supplementary materials included in this article.