

Abstract
Background and Purpose
Black/white disparities in stroke incidence are well-documented, but few studies have assessed the contributions to the disparity. Here we assess the contribution of “traditional” risk factors.
Methods
25,714 black and white men and women, aged 45+ and stroke-free at baseline were followed for an average of 4.4 years to detect stroke. Mediation analysis employing proportional hazards analysis assessed the contribution of “traditional” risk factors to racial disparities.
Results
At age 45, incident stroke risk was 2.90 (95% CI: 1.72 – 4.89) times more likely in blacks than whites, and 1.66 (95% CI: 1.34 – 2.07) times at age 65. Adjustment for risk factors attenuated these excesses by 40% and 45%, respectively, resulting in relative risks of 2.14 (95% CI: 1.25 – 3.67) and 1.35 (95% CI: 1.08 – 1.71). Approximately one-half of this mediation is attributable to systolic blood pressure. Further adjustment for socioeconomic factors resulted in total mediation of 47% and 53% to relative risks of 2.01 (95% CI: 1.16 – 3.47) and 1.30 (1.03 – 1.65) respectively.
Conclusions
Between ages 45 to 65 years, approximately half of the racial disparity in stroke risk is attributable to traditional risk factors (primarily systolic blood pressure) and socioeconomic factors, suggesting a critical need to understand the disparity in the development of these traditional risk factors. Because half of the excess stroke risk in blacks is not attributable to traditional risk factors and socioeconomic factors, differential racial susceptibility to risk factors, residual confounding or non-traditional risk factors may also play a role.
Keywords: stroke, risk factors, hypertension, diabetes, mediation analysis
Introduction
The great success and horrid failure in reducing racial disparities in stroke mortality are shown by Figures 1A and 1B. The left panel was calculated from publically available data from the CDC WONDER data system and shows the dramatic decline in stroke mortality between 1979 to 2006 by race and sex, with more than a 50% reduction in stroke mortality for both whites and blacks in only 27 years.1 This striking decline in stroke (and heart disease) mortality was recognized as one of the 10 great public health achievements of the past century.2 In 2000, the Healthy People 2010 statement, the guiding document for the United States Department of Health and Human Services, set the lofty goal to eliminate health disparities by the year 2010.3 The right panel was calculated from the information in the left panel and shows the 55% increase in the black-to-white stroke mortality disparity for men (from a 39% to 61% excess) and 26% increase for women (from a 31% to a 39%) over this period. Efforts to eliminate racial disparities in stroke mortality have been strikingly unsuccessful.
Figure 1.


Age-adjusted (2000 standard) stroke mortality estimates for blacks and whites aged 45 and over in the US between 1979 to 2006 (Figure 1A) and black-to-white stroke mortality ratio between 1979 and 2006 (Figure 1B). Calculated from CDC WONDER.1
This racial disparity in stroke mortality has been recognized for decades;4 however, there has been little advancement of the understanding of underlying causes. A higher prevalence of “traditional” risk factors (herein defined by inclusion in the Framingham stroke risk function5) in blacks likely contributes to these racial disparities in stroke risk. The American Heart Association notes that “the prevalence of hypertension in blacks in the United States is among the highest in the world,” and the prevalence of diabetes in blacks is 1.8 times greater than whites. 6 We have observed similar striking differences in the REasons for Geographic And Racial Differences in Stroke (REGARDS) study.7 In addition, the widely recognized black-white differences in socio-economic status (SES) could affect stroke risk through multiple pathways.6
Differences in the magnitude of stroke mortality disparities across the age spectrum complicate interpretations, where the risk of death from stroke is 3 to 4 times higher for blacks than whites for ages 45 to 65, but there is a declining disparity with increasing age.8–11 Sixteen years ago, Giles and coauthors directly addressed the contribution of the higher prevalence of risk factors among blacks to the age-specific racial disparities in stroke incidence using the National Health And Nutrition Examination Survey (NHANES) follow-up data.12 They reported a 2.62 (95% CI: 1.23 – 5.57) black-to-white relative risk of incident stroke between ages 35–44, but adjustment for traditional risk factors attenuated this excess only 33% to 2.07 (95% CI: 0.97 – 4.42). Over age 64, the black-to-white excess was only 1.14 (95% CI: 0.90 to 1.46), but this was completely mediated to 0.82 (95% 0.29 to 2.33) by risk factors. Herein we expand the observations of Giles using data from the REGARDS Study.
Methods
REGARDS is a population-based longitudinal cohort study of black and white individuals age 45 and older. The sample was drawn from 1,842 of the 3,140 (59%) US counties, and was recruited between 2003 and 2007 using a combination of mail and telephone contact (33% participation rate13). The study oversampled blacks and residents of the southeastern Stroke Belt (Alabama, Arkansas, Georgia, Louisiana, Mississippi, North Carolina, South Carolina, and Tennessee), and achieved a sample of 30,239 including 42% blacks and 56% residents of the Stroke Belt. Medical and risk factor history were obtained by telephone interview and physical measurements done at an in-home visit (including phlebotomy, blood pressure, anthropometry, electrocardiogram). Incident stroke was ascertained using telephone surveillance every 6-months, and retrieval and central physician adjudication of medical records of suspected strokes. Because the racial disparities are an order of magnitude larger for blacks than other minority race/ethnic groups, REGARDS focused on the black and white disparity. Study design details14 and details of event identification and adjudication 15 available elsewhere.
In this manuscript we have limited risk factors potentially contributing to the racial disparity in stroke to the “traditional” risk factors as defined by inclusion in the Framingham Stroke Risk Function.4 There are a wealth of “non-traditional” risk factors (i.e., any risk factor not in the Framingham Stroke risk function) that could be contributors including body mass index, sleep apnea, markers of inflammation (c-reactive protein, etc), psychosocial factors (discrimination, etc), and many others. However, we have been guided by the Framingham risk factors in limiting factors considered, and plan to assess the potential role of non-traditional risk factors in future manuscripts. Likewise, there are many approaches to quantify the risk factors that were included, for example smoking which can be quantified as current/non-smoker or as pack-years of exposure. Again, we have been guided to the approach of quantification by the approaches in Framingham, and plan to assess potential additional contributions introduced by better quantification of risk factors in future manuscripts.
The race of participants was determined by self-report. Systolic blood pressure was defined as the average of two seated measures taken after a five minute rest. Use of antihypertensive medications was defined by self-report. Diabetes was defined as fasting glucose of ≥126 mg/dL among the 87% of participants who complied with the request for an overnight fast, or non-fasting glucose of ≥200 mg/dL among the 13% without an overnight fast, or self-reported use of medications for diabetes control. Atrial fibrillation was defined by self-report of a physician diagnosis or electrocardiogram evidence, and left ventricular hypertrophy (LVH) by electrocardiogram. Current cigarette smoking was defined by self report. History of heart disease was defined as a self-reported myocardial infarction, electrocardiogram evidence of myocardial infarction, or self-report of coronary artery bypass, angioplasty or stent. Income (<$20K, $20K–$34K, $35K–$74K, ≥$75K, and refused response) and education (<high school, high school graduate, some college, and college graduate) were defined by self-report. A stroke diagnosis was made by a committee of trained neurologists. Medical record data including neuroimaging and other pertinent diagnostic reports were reviewed to confirm stroke type and possible etiology. Final endpoint adjudication was based on the World Health Organization’s definition of stroke.
Proportional hazards analysis was used to estimate the black-to-white hazard ratio in a series of incremental models, first including demographic factors (age, race, age*race interaction, sex), then additionally adjusting for risk factors (SBP, antihypertensive medication use, diabetes, atrial fibrillation, LVH, heart disease, and cigarette smoking), and finally additionally adjusting for SES (indexed by income and education). The contribution of individual risk factors to the observed mediation of the racial disparity was assessed by the change in estimated black-to-white risk associated with its individual addition to the model. Multiple imputation techniques were employed in the analysis to reduce the potential bias introduced through either failure to retrieve medical records or from records remaining in the adjudication process at the time of analysis (approximately 10% each). Ten imputation datasets were employed, with statistics calculated by the approach of Rubin.16 Additional details of the application of multiple imputation techniques in REGARDS are provided elsewhere.17
The focus of this paper is the attenuation in the estimated black-to-white hazard ratio associated with adjustment for traditional risk factors and SES measures, estimated using the approach of MacKinnon.18 Briefly, the proportion of the excess risk attributable to these traditional risk factors was calculated by estimating the black-to-white hazard ratio before adjustment for the risk factors (HRB) and after adjustment for the risk factors (HRA). The amount of excess risk was calculated as proportion reduction of the black risk before and after adjustment for the risk factors, that is (HRB − HRA)/(HRB − 1). Age (along with an interaction with race) was modeled as a continuous factor and the attenuation of the black-to-white difference was estimated at arbitrary ages of 45, 55, 65, 75 and 85 years. The standard error of the change in the hazard ratio was estimated by bootstrap methods with 100 replications.
Results
Follow-up was available on 29,612 (98%) of the 30,239 REGARDS participants. Of these, 1,885 (6%) participants with pre-baseline stroke were excluded, as were 2,009 (7%) with one or more missing predictor variables, and 4 (< 0.1%) participants with problematic follow-up times, resulting in a final analytic sample of 25,714.
At baseline, blacks were younger, but had a higher use of antihypertensive medication, a higher prevalence of diabetes, LVH, smoking and lower SES than whites (Table 1). There were 427 stroke events detected over 4.4 years of follow-up, where among whites there were 203 (83%) ischemic stroke, 31 (13%) hemorrhagic stroke and 12 (5%) nonspecific stroke, while among blacks there were 152 (84%) ischemic stroke, 22 (12%) hemorrhagic stroke, and 7 (4%) nonspecific stroke. Those with stroke were older, more likely to be black, male and had adverse stroke risk factors and lower levels of SES than those remaining stroke-free (Table 1).
Table 1.
Description of Study Population by race, and by race and by those with and without an incident stroke outcome
| White | Black | |||||
|---|---|---|---|---|---|---|
| No stroke | Stroke | No stroke | Stroke | |||
| N | 15215 | 246 | 10072 | 181 | ||
| Demographic Factors | Age (mean + SD) | 65.1 ± 9.4 | 71.0 ± 8.0 | 63.8 ± 9.2 | 67.8 ± 8.9 | |
| Male (%) | 49.8 | 60.2 | 37.5 | 46.4 | ||
| Risk Factors | Atrial Fibrillation (%) | 8.6 | 19.9 | 7.2 | 8.3 | |
| Diabetes (%) | 14.9 | 20.7 | 29.2 | 32.6 | ||
| Systolic blood pressure (mean + SD) | 125.0 ± 16.5 | 131.9 ± 17.6 | 130.4 ± 17.1 | 139.0 ± 18.3 | ||
| Antihypertensive Medications (%) | 41.6 | 54.5 | 61.8 | 71.8 | ||
| Heart Disease (%) | 17.8 | 36.2 | 13.6 | 23.2 | ||
| Current Smoking (%) | 12.1 | 18.3 | 16.6 | 24.3 | ||
| Left Ventricular Hypertrophy (%) | 6.4 | 10.6 | 14.3 | 24.9 | ||
| SES Factors | Education (%) | Less than High School | 6.9 | 7.8 | 18.4 | 24.9 |
| High School Graduate | 24.2 | 26.0 | 27.8 | 34.8 | ||
| Some College | 26.7 | 26.8 | 27.1 | 18.8 | ||
| College Graduate + | 42.2 | 39.4 | 26.7 | 21.5 | ||
| Income (%) | Less than $20K | 10.9 | 16.6 | 25.6 | 30.3 | |
| $20K – $34K | 22.3 | 28.5 | 26.3 | 29.3 | ||
| $35K – $74K | 33.3 | 31.3 | 26.8 | 23.8 | ||
| $75K+ | 21.7 | 11.0 | 9.6 | 4.4 | ||
| Refused | 11.8 | 12.6 | 11.7 | 12.2 | ||
The association of traditional risk factors with stroke is shown in Table 2. The relative risk of stroke in blacks compared to whites at different ages are provided in Figure 2 and Table 3, and ranged from 2.90 at age 45 to 0.95 at age 85. There was a substantial attenuation of the black excess risk with the addition of risk factors, and further attenuation with the addition of SES measures. The estimated mediation at specific ages, shown in Table 3, demonstrated that at ages 65 and younger (where the racial disparities in stroke risk are largest), the risk factors accounted for over 40% of the excess stroke risk in blacks; the further addition of SES factors increased the mediation to approximately 50%. The substantial attenuation associated with adjustment for risk factors was highly significant (p < 0.0001), as was the attenuation with SES.
Table 2.
Multivariable association (hazard ratio with 95% confidence limits) of demographic, risk factors and income with subsequent incident stroke events. Hazard ratios in each model (column) are after adjustment for other factors in the model. Note that the SES model also includes income, which was not significantly associated with stroke risk and estimated hazard ratios were not provided.
| All Stroke (nevents = 427) | |||||
|---|---|---|---|---|---|
| Demographic Model | Risk Factor Model | SES Model | |||
| Demographic Factors | Age – by – race | See Figure 2a | See Figure 2a | See Figure 2a | |
| Male Sex | 1.22 (1.02 – 1.47) | 1.12 (0.93 – 1.35) | 1.20 (0.99 – 1.45) | ||
| Risk Factors | Atrial Fibrillation | 1.47 (1.14 – 1.89) | 1.45 (1.13 – 1.87) | ||
| Diabetes | 1.40 (1.13 – 1.72) | 1.37 (1.11 – 1.69) | |||
| Systolic Blood Pressure (Δ10 mmHg) | 1.15 (1.09 – 1.21) | 1.14 (1.08 – 1.20) | |||
| Use of Antihypertensive Medications | 1.15 (0.93 – 1.42) | 1.15 (0.93 – 1.42) | |||
| Heart Disease | 1.60 (1.29 – 1.98) | 1.58 (1.27 – 1.97) | |||
| Current Smoking | 2.05 (1.64 – 2.57) | 1.98 (1.58 – 2.48) | |||
| Left Ventricular Hypertrophy | 1.41 (1.09 – 1.81) | 1.40 (1.08 – 1.81) | |||
| SES Factors | Education | Less than HS | 1.00 (ref) | ||
| HS Graduate | 1.18 (0.86 – 1.60) | ||||
| Some College | 1.03 (0.74 – 1.44) | ||||
| College Graduate | 1.07 (0.79 – 1.46) | ||||
Figure 2.
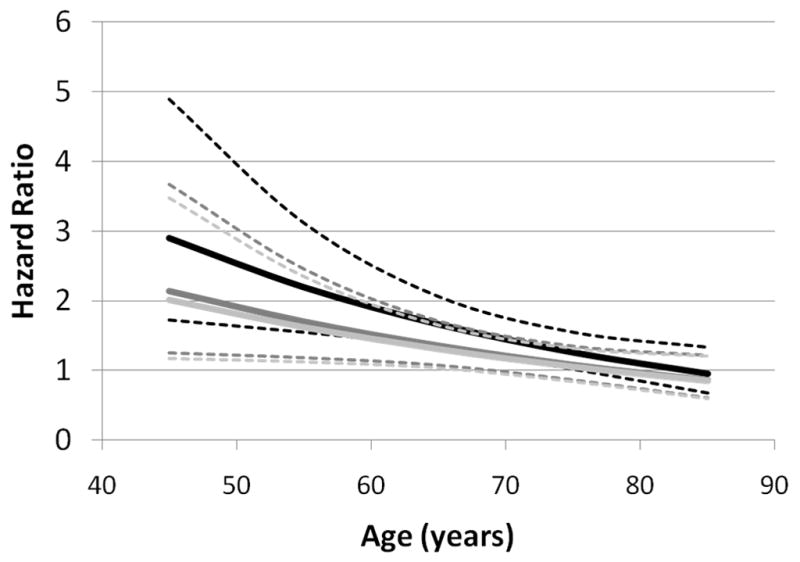
Estimated black-to-white hazard ratio as a function of age and covariate adjustment. Darkest lines show hazard ratio and 95% confidence limits after adjustment for sex, medium dark lines show hazard ratio and 95% confidence limits after further adjustment for Framingham stroke risk factors, and lightest lines show hazard ratio and 95% confidence limits after further adjustment for SES factors.
Table 3.
The mediation by stroke risk factors is described by the estimated hazard ratio for all stroke in demographic model and after adjustment for stroke risk factors, and after further adjustment for risk factors plus SES measures. Shown are the estimated decrease in the hazard ratio (for example, for all strokes at age 45 (2.90–2.14)/(2.90 – 1.00) = 0.40 or 40% decrease) and Wald p-value where the standard error of the decrease is estimated via bootstrapping techniques. The further mediation by adjustment for SES factors is shown by the hazard ratio after further adjustment for income and education, and change in hazard ratio relative the demographic and risk factor with similar Wald p-value.
| Outcome | Age | Mediation by Stroke Risk Factors | Effects after further adjustment for SES | ||||
|---|---|---|---|---|---|---|---|
| HR Stroke in Blacks for Demographic Model (95% CI) | HR Stroke in Blacks for Risk Factor Model (95% CI) | % Decrease Comparing Risk Factor to Demographic Model (p – value) | HR Stroke in Blacks for Risk Factors + SES Model (95% CI) | % Decrease Comparing Risk Factors +_SES to Demographic Model (p – value) | % Decrease Comparing SES to Risk Factor Model (p-value) | ||
| All Strokes | 45 | 2.90 (1.72 – 4.89) | 2.14 (1.25 – 3.67) | 40% (p < 0.0001) | 2.01 (1.16 – 3.47) | 47% (p < 0.0001) | 12% (p < 0.0001) |
| 55 | 2.20 (1.55 – 3.12) | 1.70 (1.18 – 2.45) | 41% (p < 0.0001) | 1.62 (1.12 – 2.35) | 48% (p < 0.0001) | 12% (p < 0.0001) | |
| 65 | 1.66 (1.34 – 2.07) | 1.35 (1.08 – 1.71) | 45% (p < 0.0001) | 1.30 (1.03 – 1.65) | 53% (p < 0.0001) | 15% (p < 0.0001) | |
| 75 | 1.26 (1.02 – 1.55) | 1.08 (0.86 – 1.34) | 64% (p < 0.0001) | 1.05 (0.84 – 1.32) | 76% (p < 0.0001) | 32% (p < 0.0048) | |
| 85 | 0.95 (0.68 – 1.34) | 0.86 (0.60 – 1.21) | N/A | 0.85 (0.59 – 1.21) | N/A | N/A | |
Table 4 provides the contribution of individual risk factors to the observed mediation of black-to-white risk in stroke. Systolic blood pressure proved to have the most powerful mediating effect, accounting for approximately one-half of the combined risk factor effect. For example at age 45, the addition of systolic blood pressure to the demographic model reduced the hazard ratio for black race from 2.90 to 2.56, a reduction that was 45% as great as the joint effect of the addition of all seven risk factors that mediated the hazard ratio to 2.14 [(2.90 – 2.56)/(2.90 – 2.14) = 0.45or 45%]. Generally, use of antihypertensive medications and diabetes accounted for the next largest portion of the total mediation, accounting for approximately one-third of the total mediating effect of all risk factors. At older ages the higher prevalence of heart disease in whites implied that adjustment for this factor actually increased (i.e., “negative mediation”) the black-to-white estimated risk.
Table 4.
Estimated black-to-white hazard ratio all stroke outcome at arbitrary ages from the demographic model and from the risk factor model, and black-to-white hazard ratio associated with the addition of specific risk factors to the demographic model. For example, at age 45 the B/W HR in the demographic model was 2.90, which was attenuated to 2.14 by adjustment for all of the risk factors; however, B/W HR for a model with the demographic factors plus atrial fibrillation was 2.81, which was 12% [(2.90 – 2.81)/(2.90 – 2.14)] of the total mediation for that age.
| Age | |||||||||||
|---|---|---|---|---|---|---|---|---|---|---|---|
| 45 | 55 | 65 | 75 | 85 | |||||||
| B/W Hazard Ratio | Percent of Mediation attributable to Factor | B/W Hazard Ratio | Percent of Mediation attributable to Factor | B/W Hazard Ratio | Percent of Mediation attributable to Factor | B/W Hazard Ratio | Percent of Mediation attributable to Factor | B/W Hazard Ratio | Percent of Mediation attributable to Factor | ||
| Demographic Model | 2.90 | 2.20 | 1.66 | 1.26 | 0.95 | ||||||
| All Risk Factor Model | 2.14 | 1.70 | 1.35 | 1.08 | 0.86 | ||||||
| Addition of Single Risk Factors to the Demographic Model | Atrial Fibrillation | 2.81 | 12% | 2.17 | 6% | 1.68 | −6% | 1.30 | −22% | 1.00 | Undefined |
| Diabetes | 2.73 | 22% | 2.05 | 30% | 1.54 | 39% | 1.16 | 56% | 0.87 | Undefined | |
| Systolic Blood Pressure | 2.56 | 45% | 1.96 | 48% | 1.51 | 48% | 1.16 | 56% | 0.89 | Undefined | |
| Antihypertensive use | 2.69 | 28% | 2.05 | 30% | 1.56 | 32% | 1.19 | 39% | 0.90 | Undefined | |
| Heart Disease | 2.76 | 18% | 2.16 | 8% | 1.70 | −13% | 1.33 | −39% | 1.04 | Undefined | |
| Current smoking | 2.77 | 17% | 2.11 | 18% | 1.61 | 17% | 1.22 | 22% | 0.93 | Undefined | |
| LVH | 2.82 | 11% | 2.12 | 16% | 1.60 | 19% | 1.20 | 33% | 0.91 | Undefined | |
Discussion
Over the age range from 45 to 65 where racial disparities in stroke incidence are largest, racial differences in risk factors and SES accounted for approximately 50% of the black excess in stroke incidence, either a half-full (the part explained) or half-empty (the part failing to explanation) explanation. We observed a larger attenuation than the 33% mediation observed by Giles approximately 20 years ago.12 The risk factors appear to explain the majority of the mediation effect rather than SES indices, suggesting that a higher risk factor profile in blacks is a powerful and substantial contributor to the racial disparity in stroke risk (the half-full portion). Of the risk factors, hypertension (as indexed by systolic blood pressure and use of antihypertensive medications) and diabetes appear to be the largest contributors, accounting for one-half and one-third of the joint mediating effect of all risk factors combined respectively. That hypertension and diabetes are such powerful mediators is a product of both the large racial disparities in their prevalence (see Table 1) and their powerful association with stroke risk (see Table 2). However, the combination of risk factors and SES indices failed to account for half of the excess risk (the half-empty portion). These findings have substantial public health implications in considering elimination of racial disparities in stroke. Based on our findings, this goal will require efforts to reduce the impact of risk factors and SES indices, and to advance the understanding of the contributors to the unexplained portion.
The factors considered here as mediators of the black excess stroke risk included the risk factors of diabetes, atrial fibrillation, left ventricular hypertrophy, and cigarette smoking (we note that SBP is a actual level, hence is a measure of risk factor severity rather than prevalence). Hence, to reduce racial disparities in stroke we must prevent the development of the risk factors. As shown in Table 1, racial differences in the prevalence of these factors are striking, with blacks 20% more likely to be on anti-hypertensive medications, and twice as likely to have diabetes and left ventricular hypertrophy. We previously reported that the 10-year predicted stroke risk based on these risk factors was also higher in blacks than whites.7 It is likely that the higher prevalence rates of these risk factors is due to higher incidence rates for the risk factors (the alternative would be a longer life expectancy for those with the risk factors), the most powerful approach to reducing racial disparities in stroke might be to focus efforts on reducing racial disparities in the incidence of these risk factors (and not the treatment of these factors). This “primordial prevention” of risk factors (or protoprophylaxis as first called by Toma Strasser 19), requires knowledge of why there are disparities in the incidence of these risk factors. Unfortunately, knowledge regarding the contributors to racial differences in the incidence of risk factors is limited, and studies are urgently needed in order to allow appropriate interventions.
The findings of this study also suggest a need to improve the control of blood pressure in blacks. Others have shown the odds of achieving blood pressure goals for treated black hypertensive patients is approximately 40% less than treated white hypertensive patients.20–24 Among the Framingham factors, this is the single risk factor affected by treatment of a prevalent condition.
Hence, reduction of racial disparities in stroke risk needs to focus on risk factor prevention. For example, prevalent diabetes is a lifelong diagnosis, and the models reported here include the presence and not the level of control of this condition. An effort to reduce disparities through these risk factors implies the prevention of the conditions. This potentially could be achieved through interventions on obesity or physical activity, or other factors in the pathways of prevention. However, it is not clear if there are other pathways leading to disparities in the development of these risk factors – a possibility that requires further research.
Considering the unexplained 50% of the racial disparity in stroke risk, there are several possible explanations that could individually or jointly be playing a role. First, blacks could be differentially susceptible to risk factors. For example, given two hypertensive individuals, one black and one white, the same degree of elevated blood pressure could be associated with a larger increase in stroke risk for the black individual. That is, risk factors could be more “potent” in blacks than in whites. The possibility of such a differential susceptibility is not addressed herein, but can be evaluated in REGARDS with a larger number of events to permit assessment of statistical interactions. REGARDS was designed to accumulate a large number of stroke events, and as follow-up continues we will be able to assess the potential differential susceptibility of risk factors.
Second, residual confounding from the studied risk factors could be contributing to the unexplained racial disparity in stroke. Framingham investigators used thoughtful approaches in the selection of risk factors as predictors of stroke risk; however, the quantification of the risk factor may not fully capture all of the implied risk associated with the factor. For example, describing diabetes as present/absent fails to account for differences in either severity or duration of the disease. Describing smoking as current/not-current may not be as sensitive a measure as pack years of exposure. Being guided by the Framingham Stroke Risk Function, we have described hypertension by systolic blood pressure and antihypertensive medication use. This fails to capture the severity or duration of the disease, and also does not include other metrics of blood pressure assessment such as pulse pressure. Many studies, including REGARDS, have extensive data collection instruments better quantifying the risk factors, but careful and hypothesis-driven modeling is needed to assess their additional contribution to stroke risk.
Third, it is possible that “non-traditional” risk factors not included in the Framingham Risk Score could be playing a role. These factors could include sleep apnea, elevated BMI or physical activity, C-reactive protein, coagulation factors, stress and depression. Future work in REGARDS will address these risk factors.
Finally (and almost certainly), part of the unexplained racial disparity in stroke is likely attributable to measurement error. As in other regression models, the proportional hazards model assumes that the predictor variables are measured with precision, a situation that is not the case. We attempted to minimize measurement error by using standardized approaches including averaging of blood pressures and centralized training of field technicians.
This report has strengths and weaknesses. REGARDS is among the largest population-based longitudinal cohort studies in the US and is accumulating a substantial number of physician-confirmed incident stroke events. The black and white participants are sampled from across the nation and come from a diverse spectrum of communities, and the findings are likely generalizable to the nation. We have also carefully designed and conducted the study to assess likely contributors to racial (and geographic) disparities in stroke. Both a strength and weakness of the study is the number of stroke events (n = 427) that has been accumulated over a 4.4 year period. This number compares favorably to the number of events in other cohort studies such as the 1136 incident strokes over 56 years of follow-up across all the cohorts in the Framingham Study25 (or 144 incident strokes over 8-years follow-up from the original Framingham cohort26), 577 over 15 years in the Atherosclerosis Risk in Communities study,27 437 over 15 years in the Cardiovascular Health Study,28 and the 660 over approximately 12 years of follow-up in the NHANES report by Giles.29 While the number of strokes included in this analysis is comparable to these other studies and provides a solid foundation for the analyses reported herein, ongoing follow-up in REGARDS will accrue a larger number of stroke events for future analysis. A particular strength of REGARDS is the combination of a national sample with physician adjudication of events (in contrast to the reliance on discharge diagnoses of stroke events in the national sample of NHANES). Our current findings focus on black/white disparities in stroke risk and fail to examine other racial/ethnic groups. The decision to focus REGARDS on the black-white disparity in stroke risk was strategic as this is both the largest disparity and a large minority group in the US. The age-specific black/white disparities in stroke risk are in excess of 300% for ages 45 to 65, while disparities for other race/ethnic groups are a full order of magnitude smaller (e.g., Hispanic-to-white disparities are approximately 30%, Asian/Pacific Islander-to-white disparities are less than 15%, and Native American-to-white disparities are approximately 20%29). Finally, herein we have reported the impact of risk factor adjustment racial disparities in all types of stroke. These analyses have been repeated assessing the impact of risk factor adjustment on cerebral infarctions, providing similar results that have been omitted for brevity.
In conclusion, we demonstrate that in the age range from 45 to 65 years (where the largest disparities exist) approximately half of the black-to-white disparities in stroke risk are attributable to traditional stroke risk factors and measures of SES. This gives rise for the urgent focus on strategies for primordial prevention of these risk factors, particularly hypertension and diabetes. Specifically, these findings suggest that half of the excess stroke mortality in blacks could be prevented if we could prevent blacks from having higher prevalence of risk factors. While racial differences in SES significantly contributed to racial differences in stroke risk, the magnitude of the contribution was relatively small. These finding also suggest that the other half of the excess stroke risk in blacks is not attributable to risk factors and SES, implying that other pathways contribute to racial disparities in stroke risk. These could include differential racial susceptibility to risk factors, residual confounding from the lack of a complete quantification of the traditional risk factors and a role for non-traditional risk factors. Further work needs to focus on the relative contributions of these potential pathways.
Acknowledgments
The research reported in this article was supported by cooperative agreement NS 041588 from the National Institute of Neurological Disorders and Stroke
The authors thank the investigators, staff, and participants of the REGARDS study for their valuable contributions. A full list of participating REGARDS investigators and institutions can be found at http://www.regardsstudy.org.
Footnotes
Disclosures: The authors had full access to all the data in the study and takes responsibility for the integrity of the data and the accuracy of the data analysis. The authors have no disclosures pertinent to this publication.
References
- 1.Centers for Disease Control and Prevention (CDC) CDC WONDER. Available at http://wonder.cdc.gov/. Retrieved July, 2010.
- 2.CDC. Ten Great Public Health Achievements -- United States, 1900–1999. MMWR. 1999;48:241–243. [PubMed] [Google Scholar]
- 3.U.S. Department of Health and Human Services. Healthy People 2010: Understanding and Improving Health. 2. Washington, DC: U.S. Government Printing Office; Nov, 2000. [Google Scholar]
- 4.Howard G, Howard VJ. Ethnic disparities in stroke: the scope of the problem. Ethn Dis. 2001;11:761–768. [PubMed] [Google Scholar]
- 5.Wolf PA, D’Agostino RB, Belanger AJ, Kannel WB. Probability of stroke: a risk profile from the Framingham Study. Stroke. 1991;22:312–318. doi: 10.1161/01.str.22.3.312. [DOI] [PubMed] [Google Scholar]
- 6.Lloyd-Jones D, Adams RJ, Brown TM, Carnethon M, Dai S, De Simone G, et al. Heart Disease and Stroke Statistics—2009 Update: A Report From the American Heart Association Statistics Committee and Stroke Statistics Subcommittee. Circulation. 2010;23(121):948–954. doi: 10.1161/CIRCULATIONAHA.109.192666. [DOI] [PubMed] [Google Scholar]
- 7.Cushman M, Cantrell RA, McClure LA, Howard G, Prineas RJ, Moy CS, et al. Estimated 10-year stroke risk by region and race in the United States. Ann Neurol. 2008;64:507–513. doi: 10.1002/ana.21493. [DOI] [PMC free article] [PubMed] [Google Scholar]
- 8.Cooper ES. Cardiovascular diseases and stroke in African Americans: a call for action. J Natl Med Assoc. 1993;85:97–100. [PMC free article] [PubMed] [Google Scholar]
- 9.Howard G, Anderson R, Sorlie P, Andrews VC, Backlund E, Burke GL. Ethnic differences in stroke mortality between non-Hispanic Whites, Hispanic whites, and blacks: the National Longitudinal Mortality Study. Stroke. 1994;25:2120–2125. doi: 10.1161/01.str.25.11.2120. [DOI] [PubMed] [Google Scholar]
- 10.Incidence and Prevalence: 2006 Chart Book on Cardiovascular and Lung Diseases. Bethesda, Md: National Heart, Lung, and Blood Institute; 2006. [Google Scholar]
- 11.Rosamond WD, Folsom AR, Chambless LE, Wang CH, McGovern PG, Howard G, et al. Stroke incidence and survival among middle-aged adults: 9-year follow-up of the Atherosclerotic Risk in Communities (ARIC) cohort. Stroke. 1999;30:736–743. doi: 10.1161/01.str.30.4.736. [DOI] [PubMed] [Google Scholar]
- 12.Giles WH, Kittner SJ, Hebel JR, Losonczy KG, Sherwin RW. Determinants of black-white differences in the risk of cerebral infarction. The National Health and Nutrition Examination Survey Epidemiologic Follow-up Study. Arch Intern Med. 1995;155:1319–1324. [PubMed] [Google Scholar]
- 13.Morton LM, Cahill J, Hartge P. Reporting participation in epidemiologic studies: A survey of practice. Am J Epidemiol. 2006;163:197–203. doi: 10.1093/aje/kwj036. [DOI] [PubMed] [Google Scholar]
- 14.Howard VJ, Cushman M, Pulley LV, Gomez CR, Go RC, Prineas RJ, et al. The REasons for Geographic and Racial Differences in Stroke (REGARDS) Study: Objectives and Design. Neuroepidemiology. 2005;25:135–143. doi: 10.1159/000086678. [DOI] [PubMed] [Google Scholar]
- 15.Howard VJ, Kleindorfer DO, Judd SE, McClure LA, Safford MM, Rhodes JD, et al. The contribution of disparities in stroke incidence to the disparities in stroke mortality: The REasons for Geographic and Regional Differences in Stroke (REGARDS) Study. Ann Neurol. 2011;69:619–627. doi: 10.1002/ana.22385. [DOI] [PMC free article] [PubMed] [Google Scholar]
- 16.Rubin DB. Multiple Imputation for Nonresponse in Surveys. J. Wiley & Sons; New York: 1987. [Google Scholar]
- 17.Howard G, McClure LA, Moy CS, Safford MM, Cushman M, Judd SE, et al. Imputation of Incident Events in Longitudinal Cohort Studies. Am J Epidemiology. 2011 doi: 10.1093/aje/kwr155. in press. [DOI] [PMC free article] [PubMed] [Google Scholar]
- 18.MacKinnon DP, Warsi G, Dwyer JH. A simulation study of mediated effect measures. Multivariate Behav Res. 1995;30:41–62. doi: 10.1207/s15327906mbr3001_3. [DOI] [PMC free article] [PubMed] [Google Scholar]
- 19.Strasser T. Reflections on cardiovascular disease. Interdisc Sci Rev. 1978;3:225–230. [Google Scholar]
- 20.Howard G, Prineas R, Moy C, Cushman M, Kellum M, Temple E, et al. Racial and Geographic Differences in Awareness, Treatment and Control of Hypertension: The REasons for Geographic And Racial Differences in Stroke (REGARDS) Study. Stroke. 2006:1171–1178. doi: 10.1161/01.STR.0000217222.09978.ce. [DOI] [PubMed] [Google Scholar]
- 21.Hertz RP, Unger AN, Cornell JA, Saunders E. Racial disparities in hypertension prevalence, awareness, and management. Arch Intern Med. 2005;165:2098–2104. doi: 10.1001/archinte.165.18.2098. [DOI] [PubMed] [Google Scholar]
- 22.Hall WD, Ferraro CM, Moore MA, Hall JE, Flack JM, Cooper W, et al. Hypertension-related morbidity and mortality in the Southeastern United States. Am J Med Sci. 1997;313:195–209. doi: 10.1097/00000441-199704000-00002. [DOI] [PubMed] [Google Scholar]
- 23.Jones D, Basile J, Cushman W, Egan B, Ferrario C, Hill M, et al. Managing hypertension in the Southeastern United States: applying the guidelines from the Sixth Report of the Joint National Committee on Prevention, Detection, Evaluation and Treatment of High Blood Pressure (JNC VI) Am J Med Sci. 1999;318:357–364. [PubMed] [Google Scholar]
- 24.Hajjar I, Kotchen TA. Trends in prevalence, awareness, treatment and control of hypertension in the United States, 1988–2000. J Am Med Assoc. 2003;290:199–206. doi: 10.1001/jama.290.2.199. [DOI] [PubMed] [Google Scholar]
- 25.Petrea RE, Beiser AS, Seshadri S, Kelly-Hayes M, Kase CS, Wolf PA. Gender differences in stroke incidence and poststroke disability in the Framingham heart study. Stroke. 2009;40:1032–1037. doi: 10.1161/STROKEAHA.108.542894. [DOI] [PMC free article] [PubMed] [Google Scholar]
- 26.Salaycik KJ, Kelly-Hayes M, Beiser A, Nguyen AH, Brady SM, Kase CS, et al. Depressive symptoms and risk of stroke: the Framingham Study. Stroke. 2007;38:16–21. doi: 10.1161/01.STR.0000251695.39877.ca. [DOI] [PubMed] [Google Scholar]
- 27.Ohira T, Peacock JM, Iso H, Chambless LE, Rosamond WD, Folsom AR. Serum and dietary magnesium and risk of ischemic stroke: the Atherosclerosis Risk in Communities Study. Am J Epidemiol. 2009;169:1437–1444. doi: 10.1093/aje/kwp071. [DOI] [PMC free article] [PubMed] [Google Scholar]
- 28.Wong ND, Lopez VA, Roberts CS, Solomon HA, Burke GL, Kuller L, et al. Combined association of lipids and blood pressure in relation to incident cardiovascular disease in the elderly: the cardiovascular health study. Am J Hypertens. 2010;23:161–167. doi: 10.1038/ajh.2009.216. [DOI] [PMC free article] [PubMed] [Google Scholar]
- 29.Howard G, Howard VJ. Distribution of stroke: heterogeneity of stroke by age, race and sex. In: Mohr JP, Choi D, Grotta JC, Weir B, Wolf PA, editors. Stroke: pathophysiology, diagnosis and management. Churchill Livingstone; Philadelphia: 2004. [Google Scholar]