

Abstract
CASP has been assessing the state of the art in the a priori estimation of accuracy of protein structure prediction since 2006. The inclusion of model quality assessment category in CASP contributed to a rapid development of methods in this area. In the last experiment forty six quality assessment groups tested their approaches to estimate the accuracy of protein models as a whole and/or on a per-residue basis. We assessed the performance of these methods predominantly on the basis of the correlation between the predicted and observed quality of the models on both global and local scales. The ability of the methods to identify the models closest to the best one, to differentiate between good and bad models, and to identify well modeled regions was also analyzed. Our evaluations demonstrate that even though global quality assessment methods seem to approach perfection point (weighted average per-target Pearson's correlation coefficients as high as 0.97 for the best groups), there is still room for improvement. First, all top-performing methods use consensus approaches to generate quality estimates and this strategy has its own limitations and deficiencies. Second, the methods that are based on the analysis of individual models lag far behind clustering methods and need a boost in performance. The methods for estimating per-residue accuracy of models are less accurate than global quality assessment methods with an average weighted per-model correlation coefficient in the range of 0.63–0.72 for the best 10 groups.
Keywords: CASP, QA, model quality assessment, protein structure modeling, protein structure prediction
Introduction
The role of protein structure modeling in biomedical research is steadily increasing1–3. Models are routinely used to address various problems in biology and medicine. Contrary to experimentally derived structures, where accuracy can be deduced from experimental data and typically falls within a narrow range, theoretical models are usually un-annotated with quality estimates and can span a broad range of the accuracy spectrum. Thus, reliable a priori estimates of global and local accuracy of models are critical in determining the usefulness of a model to address a specific problem. For example, high-resolution models (expected C-alpha atom RMSD from the experimental structure ~1Å; expected GDT_TS>80) often are sufficiently accurate for detecting sites of protein-ligand interactions4, understanding enzyme reaction mechanisms5, interpreting the molecular basis of disease-causing mutations6, solving crystal structures by molecular replacement7,8 and even for drug discovery9–11. A model of medium accuracy (typically 2–3Å C-alpha atom RMSD from the native structure, GDT_TS>50) can still be useful for detecting putative active sites in proteins12,13, virtual screening14 or predicting the effect of disease-related mutations15. Low resolution models can be useful for providing structural characterization of macromolecular ensembles13, recognizing approximate domain boundaries13, helping choose residues for mutation experiments16 or formulating hypotheses on the protein molecular function17,18.
In response to these needs the computational biology community has focused on the Model Quality Assessment (MQA) problem, i.e. on the possibility of predicting the accuracy of structural models when experimental structural data are not available. Several dozen papers have been published on the subject in the recent years19. CASP now includes a specific category for testing QA methods and a large number of prediction groups participate20,21. In CASP9, 46 groups (including 34 servers) submitted predictions of the global quality of models and 22 also provided estimates of model reliability on a per-residue basis. Here we assess the performance of these groups and discuss the problems facing the field.
Materials and Methods
Submission procedure and prediction formats
The procedure for submitting QA predictions in CASP9 did not change from that used in CASP8. Server models submitted in the tertiary structure prediction categories (TS and AL) were archived at the Prediction Center and posted on the web following the closing of the server prediction deposition time window on a target. The same day, web locations of the tarballs were automatically sent to the registered QA servers, which in turn had three calendar days to submit quality estimates for the models. Human groups were invited to download the server models and submit their quality estimates to CASP according to the deadlines set by the organizers for the tertiary structure prediction on the corresponding target.
The QA predictions were accepted in two modes: QMODE 1 (QA1) for the assessment of the overall reliability of models, and QMODE 2 (QA2) for the assessment of the per-residue accuracy of models. In QMODE 1 predictors were asked to score each model on a scale from 0 to 1, with higher values corresponding to better models and value of 1.0 corresponding to a model virtually identical to the native structure. In QMODE 2 predictors were asked to report estimated distances in Angstroms between the corresponding residues in the model and target structures after optimal superposition. Details of the QA format are provided at the Prediction Center website http://predictioncenter.org/casp9/index.cgi?page=format#QA.
Evaluation data: targets and predictions
7,116 QA predictions on 129 targets were submitted to CASP9; all are accessible from http://predictioncenter.org/download_area/CASP9/predictions/ (file names starting with QA). These predictions contain quality estimates (global and residue-based) for 39,702 tertiary structure models generated by the CASP9 server groups (http://www.predictioncenter.org/download_area/CASP9/server_predictions/). Thirteen targets were cancelled by the organizers and the assessors for tertiary structure prediction22, and those were also excluded from the QA assessment, leaving 116 targets to be assessed*.
Protein structure prediction is usually a time demanding process, and in order to allow human-expert predictors extra time for modeling challenging proteins, CASP9 targets were released as either human/server or server only targets. In the MQA category, though, methods are usually much faster and therefore all targets were used for model quality estimation.
In CASP9, targets that were difficult for structure prediction also appeared to be difficult for model quality prediction (see Figure S1 in Supplementary Material). This fact can be explained, in part, by the observation that the best performing methods are consensus methods (see further analysis in the Results), which work better for the TBM targets for which the cluster center is dominated by the presence of structurally similar templates, while for hard modeling cases there is usually no consensus or, in some cases, a wrong one. As results from structure comparison programs become less meaningful below some cut-off (e.g., a model with a GDT_TS score of 20 does not superimpose with a target significantly better than a model with a GDT_TS score of 15), the relationship between model quality estimates and structure similarity scores for difficult targets can be misleading. Thus, inclusion of such targets in the evaluation dataset might have introduced noise. To check this, we ran three separate evaluations: one on the whole set of 116 targets, and two more on reduced sets, composed of the targets where at least one model with a GDT_TS score above 40 or 50 existed (102 and 89 targets, respectively). The comparative analysis across these three target sets showed that each of the main evaluation scores is quite stable with the SRCC ranging from 0.92 to 0.94 for different pairs of the test sets. Thus, except when otherwise noted, throughout this paper we refer to the results of the analysis performed on all 116 targets.
Unlike tertiary structure assessment, the QA evaluation was performed on whole targets without splitting them into evaluation subunits, as it was impossible to dissect a single score submitted for the whole model into quality scores for the constituting domains. For the same reason, we excluded from the calculations the so-called multi-frame models consisting of two or more segments predicted independently, i.e. not using a common Cartesian frame of reference†. We also disregarded models shorter than 20 amino acids and, for the QA2 assessment, those for which fewer than seven local quality prediction groups submitted their estimates. All in all, we evaluated the performance of QA methods on 35,198 server models.
Evaluation measures and assumptions
What is compared and how?
In CASP, model quality predictions are evaluated by comparing submitted estimates of global reliability and per-residue accuracy of structural models with the values obtained from the sequence-dependent LGA23 superpositions of models with experimental structures (http://predictioncenter.org/download_area/CASP9/results_LGA_sda/). Therefore, perfect QA1 scores should ideally correspond to the LGA-derived GDT_TS scores (divided by 100) and predicted per-residue distances in QA2 should ideally reproduce those extracted from the optimal model-target superpositions. In both prediction modes, estimated and observed data are compared on a target-by-target basis and by pooling all models together. The first approach rewards methods that are able to correctly rank models regardless of their absolute GDT-TS values, while the second accentuates how well the method is able to assign different scores to models of different quality regardless of their ranking within the set of models for the specific target.
Correlation coefficients: Pearson or Spearman?
As predicted values should ideally duplicate the observed ones, a linear relationship between them is expected. This assumption is confirmed by the visual inspection of the data (see Figure S2 in Supplementary Material). Therefore, the Pearson's product-moment correlation coefficient r is a sensible choice to measure the level of association between the predicted and observed scores. However, PMCC is very sensitive to outliers and it assumes normally distributed data, which is usually not the case for sets of per-target GDT_TS scores or residue distance errors. Thus, it may seem that distribution-free association measures, e.g. Spearman's ρ or Kendall's τ, are more appropriate for the problem at hand. However, these measures also have flaws, as it is not appropriate to use rank-based measures for sets with multiple tied original values and because they present problems in handling big sets of data24. Also, even though non-parametric measures are more robust in guarding against outliers, they cannot guarantee more sensible results on such data25. In order to eliminate bias in the analysis connected with the selection of the association measure, we have evaluated all the data using both parametric and non-parametric inferential statistic methods. The comparison of the results showed that the choice of the association measure has only marginal influence on the conclusions (Spearman's ρ between the rankings based on SRCC and PMCC and their z-scores ranged from 0.97 to 0.99 for both QA1 and QA2). In what follows, we use Pearson's r for data analysis since, in general, it gives a more accurate estimate of the correlation between continuous values, and it has been shown to be less prone to bias than rank-based measures for big sets of data even when the assumption of a normal bivariate distribution is violated26. The raw results of the correlation analyses are available at http://predictioncenter.org/casp9/qa_analysis.cgi.
Transformation of correlation coefficients
As correlation coefficients are not additive27,28, their averaging has to be preceded by a transformation into additive quantities. Fisher's transformation29 is the best known technique to do so. The following transformation
| (1) |
converts the correlation coefficient r into a normally distributed variable Z with variance s2 = 1/(n−3), where n is the number of observations. Once r values are converted into Z values, an arithmetic mean score can be computed and subsequently transformed into the correlation coefficient weighted mean value by using the inverse formula
| (2) |
Note that while the Fisher transformation is usually used for PMCCs when observations have a bivariate normal distribution, it can also be applied to SRCCs in more general cases.
Evaluation measures for QA1 assessment
Correlation between the predicted accuracy scores and the corresponding GDT_TS values for the submitted server models was used as a main evaluation measure for assessing the QA1 results. In the per-target assessment regime, we calculate the Pearson's correlation coefficient for each group on each target, and the corresponding z-score derived from the distribution of the per-target PMCC values obtained by all groups. The final score for each prediction group is determined by the weighted mean of PMCCs and the average z-score over the set of predicted targets. In the “all models pooled together” regime, correlation coefficients are calculated for all quality estimates submitted by a group on all targets. The group scores are next compared to the CCs obtained by other groups using the standard Z-test procedure‡.
Besides the correlation measure, we have also evaluated performance of the global quality estimators by (a) testing the ability of prediction groups to distinguish between good and bad models, (b) calculating the difference in quality between the model predicted to be the best and the actual best model, and (c) comparing results of the methods to the results of two naïve predictors: BLAST/LGA20 and NAÏVE_CONSENSUS.
The ability of predictors to discriminate between good and bad models was assessed with the receiver operating characteristic (ROC) analysis30§. A ROC curve shows the correspondence between the true positive rate of a predictor (Sensitivity) and its false positive rate (1-Specificity) for a set of probability thresholds (from 0 to 1 in our case). For each threshold, a model is considered a positive example if its predicted QA1 score is equal to or greater than the threshold value. The area under a ROC curve (AUC) is indicative of the classifier accuracy31: an AUC of 1 identifies a perfect predictor, while an AUC of 0.5 corresponds to a random classifier. We have computed the AUC scores using the trapezoid integration rule with a threshold increment of 0.05 for four reference “model goodness” parameters: GDT_TS=30, 40, 50 and 60. The scores for all goodness parameters appeared to be highly correlated, with the lowest pair-wise PMCC of 0.98 (for the GDT_TS=30 and GDT_TS=60 pair). Therefore we show here the results for only one of the goodness parameters, defining good models as those having GDT_TS≥50.
The loss in quality between the best available and the estimated best model was calculated for the targets when at least one good model (scoring higher than the specified cutoff) was present.
The naïve BLAST/LGA predictor assigns a score to a model based on its structural divergence from the most closely related known protein structure detectable by standard sequence analysis. The predictor first searches the protein structure database – frozen at the time of release of the corresponding target – for the best potential template by running at most five PSI-BLAST iterations with default parameters. Next, it superimposes the selected structure onto the input protein model by running LGA with default parameters in sequence independent mode. Finally, the resulting LGA_S score is multiplied by the model-to-target coverage ratio (the shorter the model – the lower the ratio) and divided by 100 to obtain a number between 0.0 and 1.0.
The NAÏVE_CONSENSUS predictor assigns quality score to a model based on the average pair-wise similarity of the model to all other models submitted on that target. The predictor superimposes all models submitted on the target by running LGA with default parameters in the sequence dependent mode. Next, for each model the quality score is calculated by averaging the GDT_TS scores from all pair-wise comparisons, followed by appropriate scaling.
Evaluation measures for QA2 assessment
As in the QA1 mode, correlation was the basic evaluation measure for assessing the QA2 results. Here the correlation is measured between the estimated and actual distances in Angstroms between the corresponding Cα atoms of the model and the experimental structure after their optimal superposition. The Pearson r coefficients and the corresponding z-scores are computed for each server model. While calculating correlation for the QA2 data, we had to overcome the problem of CCs distortion due to the high distance values in the poorly modeled regions of a protein. From a practical point of view, for a residue being misplaced by several Angstroms (e.g. more than 5 Å) the exact distance does not make much difference and thus we set the predicted and observed distance errors exceeding 5Å to 5Å. The final score of each prediction group is determined by the weighted mean of PMCCs and the average z-score over the set of predicted models**.
The aforementioned procedure of setting an upper limit on the distance values makes the analysis of distance error associations more sensible, but it also introduces a bias into the analysis as many data points acquire the same values, possibly affecting the accuracy of the correlation-based conclusions. On the other hand, our analysis in the “all models together” mode is meant to determine the ability of the QA methods to identify reliable and unreliable regions in the model regardless of this bias. To perform such an analysis we used two descriptive statistics measures: Matthews's correlation coefficient32
| (3) |
and accuracy
| (4) |
The two measures are calculated on the whole set of residues for two distance cut-offs - 5Å and 3.8Å – separating reliably predicted residues from unreliable ones. The TP [FN] in formulae (3) and (4), is the number of residues in the model that are closer than the specified cut-off to the corresponding residues in the native structure and are estimated to be closer [at least as far away as] this cut-off in the QA prediction, respectively. The TN [FP] is the number of residues in the model that are at least as far away as the specified cut-off from the corresponding residues in the native structure and are estimated to be at least as far away [closer] than this cut-off in the QA prediction, respectively. The MCC and accuracy scores are highly correlated (Pearson's r=0.99 [0.98] for 5Å [3.8Å] distance thresholds respectively), and therefore we show the results for only one of them (MCC) in what follows.
Ranking of participating groups: z-scores, t-, Wilcoxon-, Z- and DeLong- tests
The correlation coefficients obtained by each group for each target (in QA1) or model (in QA2) and on the whole set of targets were converted into z-scores. As in previous CASPs20,21, the performance of each group was measured by the average of the z-scores after replacing negative values with zeros. The choice of neglecting negative z-scores is meant not to penalize groups that, by attempting more novel and riskier methods, might obtain negative scores in some cases.
The statistical significance of the differences in performance of the participating methods was verified by the two-tailed paired t-tests (or Wilcoxon tests) on the common set of predicted targets/models in the target-based analysis regime and by Z-tests for the analysis of all models pooled together.
In the per-target assessment regime, we ran paired t-tests on PMCCs and Wilcoxon signed rank tests on SRCCs. The raw correlation coefficients are used because the significance levels of the tests based on Fisher's Z transformations are shown to be severely distorted for skewed distributions26.
For the “all targets together” assessment, Z-tests were performed on the correlation coefficients in accordance with standard statistical practice. To test whether Pearson's correlation coefficients r1 and r2 from two different samples are significantly different, we converted them into the corresponding Fisher's Z1 and Z2 using formula (1) and then computed a statistics Z by dividing their absolute difference by the pooled standard error, i.e.
| (5) |
where n1 and n2 represent the number of models evaluated by the two predictors. The corresponding p-value from the standard normal probability table helps assessing whether the difference between r1 and r2 is statistically significant at the desired confidence level.
Statistical significance of the differences between the AUC scores in the ROC analysis was assessed using the DeLong non-parametric tests33.
Software used
Quality assessment calculations were performed using a set of in-house Java, C and Perl scripts pulling data from the CASP results database and the statistical package R34 with the installed pROC library35.
Results
QA1: assessment of global model accuracy estimates
QA1.1: per-target analysis
Figure 1A shows the mean z-scores and PMCC weighted means on the whole set of targets for all forty six prediction groups. Several top performing groups obtained very similar results. This visual conclusion is confirmed by the results of the statistical significance tests on the common set of predicted targets. According to the paired Student's t-test, the top-ranked eight predictors (MuFOLD-WQA, MuFOLD-QA, QMEANClust, United3D, Multicom-cluster, Mufold, MetaMQAPclust and MQAPmulti – all using clustering techniques) appear to be indistinguishable from each other, and perform better than the rest of the groups at the p=0.01 significance level (see Table S1 in Supplementary Material for details).
Figure 1.

Performance of individual groups in the global quality prediction category (QA1). Evaluation scores for the 46 participating groups and the NAÏVE_CONSENSUS benchmarking method are presented for (A) per-target based assessment (QA1.1) and (B) all targets pooled together assessment (QA1.2). Clustering methods are shown in blue, single model methods in red, quasi-single model methods in green, and unidentified in grey (see Table I for a more detailed description of the methods). Bars corresponding to z-scores have black borders and are drawn in darker colors; bars corresponding to correlation coefficients are drawn in lighter colors (legend for clustering methods is shown as an example). The z-scores for the naïve method are calculated from the average and standard deviation values of the correlation coefficients for the 46 participating predictors. Statistically indistinguishable top groups are marked with shaded rectangles.
It should be noted that not all groups submitted quality estimates for all models and therefore correlation coefficients for different groups on a specific target might be calculated on slightly different subsets of models. This may raise a question of reliability of direct comparisons of the scores for different groups. To check the influence of this discrepancy on the evaluation scores, we compared the results of the QA methods on the whole set of models with those obtained on randomly selected subsets of models. For each QA group, we have randomly selected 30 models for each target (approximately 10% of all submitted models) and calculated the correlation with the observed quality. We repeated this procedure 100 times for each group and for each target and calculated the PMCC means weighted over the number of trials and over all targets predicted by the group. The resulting PMCCs appear to differ by no more than 0.2% (data not shown) from the correlation coefficients calculated on the whole set of models, therefore indicating a very high stability of the results.
The ability of predictors to identify the best models in the decoy sets of all models submitted for the target was assessed on targets for which at least one model obtained a GDT_TS score higher than 40. For each target we have calculated the ΔGDT_TS difference between the model identified as best by the QA predictor and the model with the highest GDT_TS score. Average ΔGDT_TS scores over all targets attempted by each group are presented in Figure 2A. The best prediction groups reach an average ΔGDT_TS score of about 5. Thus, the actual best models might be significantly down the list from those designated as best. Figure 2B supports this conclusion showing that even for the best groups, the model designated as best is 2 GDT_TS units or closer to the best available model for only approximately one in three targets (green + yellow bars in the figure). Even though all best predictors are again clustering methods, it is encouraging to see that the best quasi-single model method (QMEANdist) and the best single model method (ProQ2) attain ΔGDT_TS scores that are roughly only 2 GDT_TS units worse than that of the best clustering method (Figure 2A). It should be noted, however, that this small difference in absolute scores translates into substantial (approximately 40%) difference in relative terms, and overall low rankings of these two groups.
Figure 2.

Ability of QA predictors to identify the best models in the decoy sets. Analysis was carried out on the 102 targets having at least one structural model with a GDT_TS score over 40. (A) Average loss in quality between the models predicted to be the best and actual best models. For each group, ΔGDT_TS scores are calculated for every target and averaged over all predicted targets. The lower the score, the better the group performance. Coloring of the methods is the same as in Figure 1. (B) Stacked bars show the percentage of predictions where the model estimated to be the best is 0–1, 1–2, 2–10 and >10 GDT_TS units away from the actual best model, respectively. Groups are sorted according to the results in the 0–2 bin (sum of green and yellow bars).
QA1.2: models from all targets pooled together
Figure 1B reports the results of the correlation analysis in the “all models pooled together” mode. The QMEANClust group proved to be the best in assigning absolute quality scores to models coming from proteins of different modeling difficulty. It outperforms all other groups, including the three next best - Multicom-cluster, ModFOLDclust2 and MetaMQAPclust - which are statistically indistinguishable from each other according to the Z-tests (Table S2 in Supplementary Material) and not far behind QMEANClust in terms of PMCC values.
The ability of predictors to discriminate between good and bad models was additionally assessed with the receiver operating characteristic analysis. Figure 3 shows that the ROC curves for the top performing groups (and subsequently their AUC scores) are very similar, suggesting that the corresponding methods have similar discriminatory power. However, according to the results of non-parametric DeLong tests, the QMEANclust AUC score proved to be statistically better than that of all other groups, except for MULTICOM-cluster (see Table S2 in Supplementary Material). Comparing the AUC scores for the GDT_TS=40 and GDT_TS=50 goodness cut-offs (see the two panels in the inset of Figure 3), one can assert that they are similar for all groups except for MuFOLD-WQA, which has better discriminating power at the smaller “goodness” cutoff.
Figure 3.

ROC curves of the binary classifications of models into two classes - good (GDT_TS≥50) and bad (otherwise). Groups in the legend are ranked according to decreasing AUC scores. The inset shows the AUC scores for all the groups for two definitions of “model goodness”: GDT_TS=40 and GDT_TS=50.
Summarizing the QA1.2 assessment we want to emphasize that, similarly to QA1.1, clustering methods dominate the results tables.
QA1 results: comparison with previous CASPs
The comparison of the CASP9 results with the results from previous experiments is important for establishing whether the MQA field is making progress.
Figures 4A and B show the correlation coefficients obtained by groups participating in CASP9 and CASP8 for both the per-target and “all models together” assessment. CASP9 groups display better performance than the CASP8 groups according to both assessment procedures. Consistent improvement in the correlation scores is noticeable for both the best and moderately-well performing groups, with a more pronounced improvement for the latter groups.
Figure 4.

Correlation coefficients in the last two CASPs. Groups are sorted from the best to worst in each CASP. (A) Weighted means of PMCCs from the per-target QA1.1 assessment. (B) PMCCs from the “all models together” QA1.2 assessment.
Figure 5 presents the cumulative distributions of the correlation coefficients for the last three CASPs. We show the fraction of the observed Pearson's correlation coefficients attaining values larger than those specified along the x-axis. It is apparent that the fraction of cases with larger r has consistently and significantly increased over the last four years. For example, the percentage of QA1 predictions yielding correlation coefficients 0.8 or higher increased from 30% in CASP7 to 50% in CASP8 and to 70% in CASP9! These results look even more impressive when one takes into consideration the fact that CASP9 targets were harder than CASP8 targets, which, in turn, were harder than CASP7 ones36, and that there were fewer consensus methods in CASP9 than in CASP8. Therefore, the observed progress cannot be attributed to the decreased target difficulty or larger number of consensus methods, but rather reflects methodological improvements implemented over the last three CASPs. At the same time, it should be mentioned that there are no conceptually novel approaches among the best performing CASP9 methods and the observed progress is most likely associated with improvements of the existing QA servers. Indeed, the comparison of performance of the best CASP9 groups that have also participated in CASP8 shows that none performed worse, with many significantly improving their results. This is particularly true of the MUFOLD-QA and United-3D (Circle in CASP8) groups, which have improved their correlation scores by more than 30%.
Figure 5.
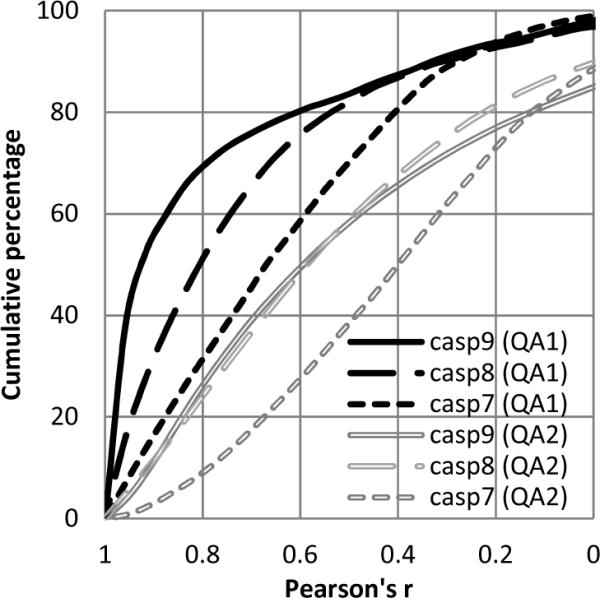
Cumulative distribution of Pearson's r in the last three CASPs. Only positive CC values are shown. Black color indicates the global quality estimates (QA1) while grey refers to the per-residue estimates (QA2).
QA1 results: comparison with naïve methods
The effectiveness of QA1 methods in CASP9 was tested by comparing their performance with that of two naïve predictors: BLAST/LGA, assigning a global accuracy score to a model based on its distance from the best template found by sequence similarity, and NAÏVE_CONSENSUS, assigning a quality score based on the structural similarity of a model to other models submitted on the target (see Materials and Methods).
BLAST/LGA uses only the information available from the best template and therefore is conceptually similar to quasi-single model methods. Quality assessment scores were generated for all models submitted on 79 single-domain TBM targets, where PSI-BLAST detected at least one potential template. In order to compare the naïve predictor with participating groups in an unbiased manner, we recomputed the z-scores on the selected 79 TBM targets from the average and standard deviation values of the Pearson's r distributions for the forty six official predictors. It is apparent that while the BLAST/LGA predictor performs worse than the best clustering and quasi- single model methods, its z-score is higher than that of any of the CASP9 pure single-model methods (see Figure S3, Supplementary Material).
To benchmark the effectiveness of clustering techniques we compared them to the NAÏVE_CONSENSUS method utilizing information from all tertiary structure models submitted on a target. Figure 1 demonstrates that this method would have been among the best performing methods, had it participated in CASP9. In the QA1.1 assessment mode, the naïve method achieves the highest wmPMCC of 0.97 and is statistically indistinguishable from the eight top performing groups (Table S1 in Supplementary Material); in the QA1.2 mode, it attains a PMCC of 0.946 and is statistically indistinguishable from the best performing method (QMEANclust, PMCC=0.949) both according to the correlation-based and ROC-based analysis (Table S2 in Supplementary Material). These results show that even though the best CASP consensus predictors reach very high correlation scores, they do not compare favorably with a simple naïve clustering method.
Open issues
Comparison of the QA1 results from the latest CASPs points to clear though modest progress in the area: all assessment scores have improved since CASP8 and correlation coefficients for the best groups have nearly reached saturation (0.97) so it may seem that the QA1 problem has been solved. But a closer look reveals hidden problems and issues that need attention.
As in two previous CASPs, all top performing methods in CASP9 relied on a consensus technique to assess model quality (see Figures 1–3 for the results and Table I for the classification and brief description of the methods). However, for real life applications researches may want to obtain estimates for single models downloaded from one of the many widely used model databases37–39. Therefore there is an urgent need for methods that can assign a quality score to a single model without requiring the availability of tens of models from diverse servers. Unfortunately, these methods lag behind the best consensus-based techniques: the best quasi- single model method in CASP9 was ranked 18th in both QA1.1 (Lee group) and QA1.2 (Splicer) correlation-based assessments, while the best “pure” single-model method (Multicom-novel) was ranked only 28th in both QA1.1 and QA1.2.
Table I.
Classification and short description of CASP9 QA methods.
| Method | C/S M | G/L | Scoring function |
|---|---|---|---|
| 1D-jury40 | C | G | Similarity of secondary structure and solvent accessibility of equivalent residues in the model and all models in a decoy set |
| AOBA | C | L+G | TM-score41 (global) and per-residue CA-CA distance (local) between the model and the average structure calculated from the subset of best 16 models selected using score combining the all-model consensus TM-score41, per-residue Verify-3D42 and Stability43 scores. |
| Baltymus | S | G | Combines a potential based on the volume of the cavities surrounding a residue and statistical pairwise potentials44 |
| ConQuass45 http://bental.tau.ac.il/ConQuass | S | G | Correlation between each residue's degree of evolutionary conservation and its solvent accessibility in the structure |
| Distill NNPIF | S | L+G | An artificial neural network based on Cα-Cα contact interactions |
| IntFOLD-QA46 www.reading.ac.uk/bioinf/IntFOLD | C/S* | L+G | ModFOLD 3.0 method capable of carrying out either single-model mode or multiple-model mode clustering. In the single-model mode an ensemble of supplementary models is generated by nFOLD4, and the quality score is deduced from comparison of a model against this set using ModFOLDclust2 method. |
| Kurcinski-Kihara47 http://kiharalab.org/SubAqua | MS | G | A meta-approach combining scores from several QA methods |
| Lee (human); GWS (server) | S* | G | Similarity (TM-score) to the putative best template identified with the in-house method |
| MetaMQAP48 http://genesilico.pl/toolkit/mqap | MS | L+G | A machine learning approach combining the output from a number of primary MQAPs and local residue features: secondary structure agreement, solvent accessibility, and residue depth |
| MetaMQAPclust | MC | L+G | MetaMQAP followed by a 3D-Jury-like procedure for 15% of the top-ranked models. The consensus score of a given model is its average GDT_TS to all models in the subset |
| Modcheck-J2 | C | L+G | Structural similarity of the model to other models in the ensemble |
| ModFOLDclust2 | CM | L+G | Global: mean of the QA scores obtained from the ModFOLDclustQ and the original ModFOLDclust methods49. Local: the per-residue score taken from ModFOLDclust. |
| ModFOLDclustQ | C | L+G | Similar to the original ModFOLDclust method49, but using a modified version of the alignment-free Q-measure instead of the TM-score |
| MQAPmulti | C | L+G | Compares structural features of the model with those predicted from its primary sequence and uses statistical potentials and information from evolutionary related proteins |
| MQAPsingle | MC | L+G | Compares the model against a subset of models comprised of GeneSilico, Pcons, and HHpred models |
| MUFOLD | MC | G | Combination of knowledge-based scoring functions, consensus approaches and machine learning techniques |
| MUFOLD_QA | C | G | Average pair-wise similarity (in terms of GDT_TS) of the model to all models in a non-redundant subset of server models |
| MUFOLD_WQA | C | G | MUFOLD_QA + empirical weighting of models in the set |
| MULTICOM50 http://sysbio.rnet.missouri.edu/apollo | MC | L+G | A meta-approach, averaging quality scores of CASP9 QA predictors with post-refinement |
| Multicom-construct | C | L+G | The average Q-score51 between the model and all other models in ensemble with post-refinement |
| Multicom-cluster | C | L+G | Average GDT-TS between the model and all other models in a decoy set (similar to the NAÏVE_CONSENSUS method - see Materials) |
| Multicom-novel52 | S | G | Uses secondary structure, solvent accessibility, beta-sheet topology, and a contact map to generate quality estimates |
| Multicom-refine | C | L+G | A hybrid approach to integrate ab initio model ranking methods with structural comparison-based methods |
| Pcons53,54 http://pcons.net/ | C | L+G | Average S-score55 to all other models in a decoy set |
| PconsM56 | C | L+G | Pcons with re-scoring on a selected subset of best models |
| Pcomb | CM | L+G | Linear combination of Pcons and ProQ2 scores |
| ProQ54 | S | L+G | Combination of structural features of the model using ANN |
| ProQ2 | S | L+G | A successor of ProQ54; combines evolutionary information, multiple sequence alignment and structural features of a model using an SVM |
| QMEAN57–59 http://swissmodel.expasy.org/qmean | S | L+G | Combines four potentials of mean force (analyzing long-range interactions, local backbone geometry and burial status of the residues) with two agreement terms verifying fit between the predicted and observed secondary structure and solvent accessibility |
| QMEANclust57 http://swissmodel.expasy.org/qmean | C | L+G | QMEAN-weighted mean GDT_TS deviation of the model to all models in the subset |
| QMEANdist | S* | L+G | QMEAN with an additional term that accounts for the agreement with residue-level distance constraints extracted from related protein structures |
| QMEANfamily57 | S* | G | Average of QMEAN scores for ensemble of supplementary models generated for protein sequences sharing at least 40% sequence identity with the target, using the starting model as a template |
| SMEG-CCP | C | G | Agreement of the model's contact map with the sample mean of contact maps of all models in the decoy set |
| Splicer (human); Splicer_QA (server) | S* | G | Combination of two statistical potentials, a physics-based potential and a template-derived residue-residue distance potential using non-linear and linear regression methods |
| United3D | C | G | Combination of scores from structural clustering of models and conservation of contacts |
Legend:
G – a global quality estimator (one score per model).
L – a local quality estimator (per-residue reliability scores).
S – a single model method capable of generating the quality estimate for a single model without relying on consensus between models or templates.
C – a clustering (consensus) method that utilizes information from a set of different models.
S* – a quasi-single model method capable of generating the quality estimate for a single model but only by means of preliminary generation of auxiliary ensembles of models or finding evolutionary related proteins and then measuring similarity of the sought model to the structures in the ensemble.
M – a meta-method combining scores from different quality assessment methods.
Note. Both clustering and meta- methods are often called consensus methods in the literature. To avoid confusion, we here use the term “consensus method” meaning a method based on the agreement between the features of different models (clustering) – rather than on scores derived from different MQAPs (meta).
Single model approaches (S) are shaded
Appreciating the outstanding performance of clustering methods in CASP, the question arises of whether such a performance can be attributed to the CASP model set being easier (for quality assessment) than those that one might expect in real life applications. As the CASP model set contains many models of different quality (while this is not necessarily the case in real life applications), it can be hypothesized that there is a bias in the scores arising from diversity of the models in the datasets. Unfortunately, it is impossible to confirm or reject this hypothesis based on the CASP data alone, but we can obtain an approximate answer to this question by assessing how much the scores of the participating methods differ for various subsets of the CASP models. Figure 6 shows that the correlation scores of the QA1 methods drop significantly and approximately linearly with the decrease in the number of bad models in the subset. If only the best 50% of the models for each target are taken into account, the PMCC values decrease by about 50% as well. When only the 60 best models per target (approximately 20% of the whole target set) are used for the analysis, the correlation coefficients for all groups drop below the significance level (<0.2). Another way of verifying that method scores are worse on sets of models with limited spread in quality is illustrated in Figure S4 of the Supplementary Material, where the correlation coefficients calculated on the whole model dataset are compared with those calculated on relatively good models only (GDT_TS above 50). Analysis of the results shows that the correlation coefficients for the best groups drop by approximately 0.2 in both assessment modes.
Figure 6.
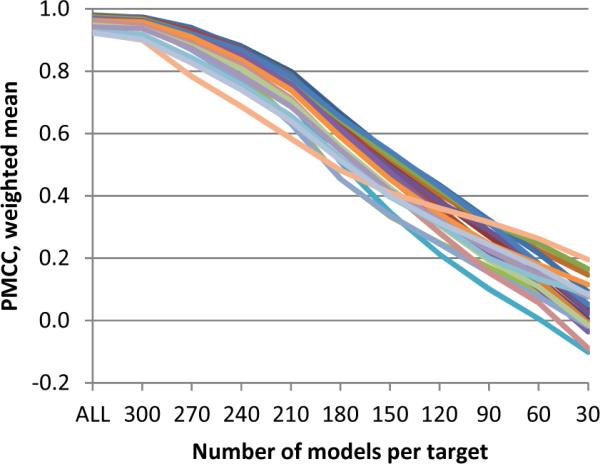
Weighted mean of Pearson's correlation coefficients as a function of the number of analyzed models. Each line corresponds to one group. Data are shown for the best 25 groups. Server models submitted on a target (from 265 to 333 models per target) are sorted according to their GDT_TS scores. Correlation coefficients on the incremental sets of 30*n models (n=1,…,10) are then calculated for each QA group on the targets having at least one model over GDT_TS=50 (maximum - 89 targets). PMCCs weighted means are calculated over the targets attempted by a group at each increment cut-off (30 models, 60, …) separately.
The aforementioned analyses provide grounds for speculation that clustering methods in general might lose their edge when the set of assessed models is more uniform in quality and composed of only relatively good models. This suggestion is backed up by two examples obtained retrospectively, after the end of CASP9 (August 2010), and presented at the CASP meeting in December 2010. We asked Pascal Benkert, the leader of the QMEAN and QMEANclust groups, to re-run his methods on the reduced datasets, containing for each target only the models with GDT_TS ≥ 50 (these datasets, for 85 targets having at least 30 qualified models, are publicly available at http://predictioncenter.org/download_area/CASP9/server_pred_over50/). Results of these two post-CASP model quality assessments were evaluated in the same way as those of regular CASP9 groups. Figure 7 compares the results of QMEAN and QMEANclust on three different prediction/evaluation datasets. It can be seen that for both methods the reduction in the number and diversity of models in the prediction datasets produces a similar drop-off in correlation scores as that caused by the removal of the same models from the evaluation datasets. It is also interesting to notice that the drop in performance is observed for both methods, with the decrease in scores for the clustering method (QMEANclust) being slightly more pronounced, as expected. This might indicate that both single-model and clustering methods are less effective in discriminating models of similar but reasonable quality, and that it is hard to expect the high, CASP-like correlation coefficients in applications outside of CASP.
Figure 7.
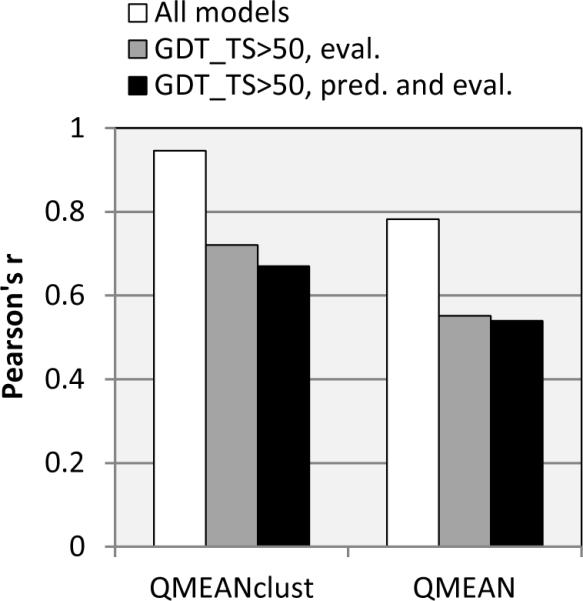
Comparison of the performance of two selected CASP9 methods (QMEAN and QMEANclust) on three different prediction/evaluation datasets: 1) both the prediction and the evaluation are performed on the complete dataset of models (hollow bars), 2) the prediction is performed on the complete dataset and the evaluation – on the reduced dataset (grey bars); 3) both the prediction and the evaluation are performed on the reduced dataset (black bars).
Another aspect of global quality assessment that needs improvement is the capability of selecting the very best model in a decoy set. Even though the best methods can attain very high correlation coefficients, none can consistently select the best models for all targets††. Figure 2B shows that even the best methods miss the best available model by 10 GDT_TS units or more in ~20% of cases (red bars).
QA2: Assessment of residue-level accuracy estimates
For the twenty one groups that submitted model confidence estimates at the level of individual residues‡‡, we measured the correlation between predicted and observed distance errors as well as the accuracy with which the correctly predicted regions were identified. As it is described in more detail in Materials and Methods, all distances higher than 5Å were set to 5Å in the calculation of the correlation coefficients.
QA2.1: local accuracy assessment on per-model basis
Figure 8A shows the mean z-scores and PMCC weighted means for the twenty one QA2 groups on the whole set of models. The PconsM group achieves the highest score according to both measures. The results of this group are statistically indistinguishable from those of the ModFOLDclust2 group (Table S3, Supplementary Material), but differ from those of the second tier of five QA2 groups - IntFOLD-QA, MQAPmulti, MetaMQAPclust, MULTICOM and Pcomb - which are statistically different from the first two and statistically indistinguishable from each other.
Figure 8.

Assessment scores for individual groups in the per-residue quality prediction category (QA2). (A) Correlation analysis results calculated on a per-model basis and subsequently averaged over all models. (B) Accuracy of the binary classifications of residues (good / bad) expressed in terms of Matthew's correlation coefficients calculated for two distance cut-offs – 5.0Å (MCC5) and 3.8Å (MCC38). Two groups (Modcheck-J2 and Distill_NNPIF) submitted all distance estimates below 3.8Å resulting in zeroing of TN and FN values (at both cut-offs) and, subsequently, the MCC scores for these groups could not be properly computed.
QA2.2: residues from all models and all targets pooled together
To evaluate the ability of prediction groups to identify good and bad regions in a model, we pooled the submitted estimates for all residues from all models and all targets together (approximately 7,000,000 residues from 35,000 models per QA predictor), and calculated the MCC and the accuracy on this dataset (see Materials and Methods). Figure 8B shows the results of this analysis. Two methods developed by the same research group (ModFOLDclust2 and IntFOLD-QA) show the best results in this analysis, although they are not very different from the others, as the MCC5 for the median 11th group differs from that of the 1st group by only 0.05.
QA2 results: comparison with previous CASPs
Figure 9A shows the weighted means of the correlation coefficients over all models submitted to CASP9 and CASP8. The best groups show a slightly worse performance in CASP9, while the remaining ones seem to have improved.
Figure 9.

(A) Weighted means of correlation coefficients for the per-residue assessment in the last two CASPs. Groups are sorted from the best to worst in each CASP. (B) Comparison of the predictors' ability to distinguish between correctly and incorrectly modeled regions in proteins in the two last CASPs. Groups in each CASP are sorted according to their MCC_avg=(MCC5+MCC38)/2 score. Only the results for the fifteen best performing groups are shown.
The analysis of performance of the best CASP9 QA2 groups that also participated in CASP8 shows that, on average, there is not much progress, with the best CASP8 group performing noticeably worse in CASP9 (likely due to an error in the automatic procedure of the server).
The cumulative distribution of the QA2 correlation coefficients for the last three CASPs is shown in Figure 5. In contrast to QA1, there is no clear progress between the last two CASPs according to this measure. Also, the percentage of correlation coefficients that are higher than a selected value is always lower in the QA2 mode than it is in the QA1.
Figure 9B compares the ability to distinguish between the well and not so well modeled regions in a protein. The accuracy is measured in terms of the averaged Matthews correlation coefficient MCC_avg=(MCC5+MCC38)/2. Similarly to what we have observed for the other measures in QA2, the results of the best groups did not improve, while groups achieving an average accuracy have submitted better predictions in CASP9 than in CASP8.
Discussion and conclusions
In this paper we present the results of the third round of model quality assessment experiment within the scope of CASP. The methodology for the assessment is now sufficiently robust for drawing general conclusions about the state of the art in the field.
There is clearly room for improvement in this category of prediction. In particular, there is an apparent need for improving single-model methods. The ability to rank models by consensus methods, i.e. to sort a set of models according to their quality, is very useful for structural meta-predictors, but is of limited use for biologists who often need to estimate the quality of a single model or its specific regions.
To further promote the development of single-model methods, we plan to emphasize them in the next CASP by a separate assessment. Looking at the clustering approach, we note that the best methods participating in CASP9 cannot outperform a naïve consensus technique tested in this paper, a rather disappointing result. We also would like to see improvement in the ability of clustering methods to rank models of similar and relatively high quality.
Another issue is that presently the QA1 type assessments cannot be performed at the level of individual domains. This would be desirable though, as individual domains usually present different levels of modeling difficulty and thus constitute separate model quality assessment problems. However, separation into structural domains is feasible only with the knowledge of target structures. Solving the domain level assessment problem might be possible by developing techniques capable of deriving global quality estimates directly from those made at the level of individual residues.
We hope that residue-based estimates of model accuracy will gain more attention and that improvements in this area will continue to appear. After an impressive advances made between CASP7 and 8, the progress seems to have slowed down. Our assessment shows that the best QA2 methods in CASP9 performed at the same level or even slightly worse than those in CASP8. The reasons behind this are not clear, and the observed decrease in QA2 performance might just reflect an average increased difficulty of targets in CASP936. In any case, we would like to underline that the residue-based error estimates are still less than satisfactory and hope that this somewhat disappointing result will encourage the community to direct efforts in this direction.
Supplementary Material
Acknowledgements
This work was partially supported by the US National Library of Medicine (NIH/NLM) - grant LM007085 to KF, and by KAUST Award KUK-I1-012-43 to AT.
Abbreviations
- MQA
Model Quality Assessment
- QA[1,2]
Quality Assessment mode [1,2]
- TBM
Template-Based Modelling
- RMSD
Root Mean Square Deviation
- GDT_TS
Global Distant Test – Total Score
- CC
Correlation Coefficient
- PMCC
Pearson's product-Moment Correlation Coefficient
- SRCC
Spearman's Rank Correlation Coefficient
- MCC
Matthews' Correlation Coefficient
- MCC5 / MCC38
MCCs for two distance cut-offs - 5Å and 3.8Å
- wmPMCC
weighted mean of PMCC
Footnotes
Results presented at the CASP meeting were based on 117 targets including T0549, the target canceled just before the meeting by the assessors due to its inadequate quality for tertiary structure assessment.
Format-wise, multi-frame models are those containing several PARENT…TER blocks - see format description for TS and AL predictions at http://predictioncenter.org/casp9/index.cgi?page=format.
Details on calculating z-scores and conducting Z-tests are discussed further in this section.
The conceptually similar analysis can be performed using Matthews' correlation coefficient or statistical accuracy score, but the ROC curve analysis is more general as it does not require linear relationship between the predicted and observed scores but assumes only monotony.
We also calculated QA2 summary scores using somewhat different procedure. First, per-residue scores for each model were averaged over all models submitted on a target, and then per-target averages were averaged over all targets. The difference in summary scores from the two procedures constituted 0.35% on the average for all considered measures and all participating groups.
This is not only a limitation of the QA methods, but also a partial limitation of the assessment method, since QA predictions and evaluations are done on full (i.e. not split in domains) targets.
QA2 results from the group Pcons were excluded from the analysis as they were identical to the results from the group PconsM.
References
- 1.Schwede T, Sali A, Honig B, Levitt M, Berman HM, Jones D, Brenner SE, Burley SK, Das R, Dokholyan NV, Dunbrack RL, Jr., Fidelis K, Fiser A, Godzik A, Huang YJ, Humblet C, Jacobson MP, Joachimiak A, Krystek SR, Jr., Kortemme T, Kryshtafovych A, Montelione GT, Moult J, Murray D, Sanchez R, Sosnick TR, Standley DM, Stouch T, Vajda S, Vasquez M, Westbrook JD, Wilson IA. Outcome of a Workshop on Applications of Protein Models in Biomedical Research. Structure. 2009;17(2):151–159. doi: 10.1016/j.str.2008.12.014. [DOI] [PMC free article] [PubMed] [Google Scholar]
- 2.Moult J. Comparative modeling in structural genomics. Structure. 2008;16(1):14–16. doi: 10.1016/j.str.2007.12.001. [DOI] [PubMed] [Google Scholar]
- 3.Tramontano A. The role of molecular modelling in biomedical research. FEBS Lett. 2006;580(12):2928–2934. doi: 10.1016/j.febslet.2006.04.011. [DOI] [PubMed] [Google Scholar]
- 4.Krishnan L, Li X, Naraharisetty HL, Hare S, Cherepanov P, Engelman A. Structure-based modeling of the functional HIV-1 intasome and its inhibition. Proc Natl Acad Sci U S A. 2010;107(36):15910–15915. doi: 10.1073/pnas.1002346107. [DOI] [PMC free article] [PubMed] [Google Scholar]
- 5.Haider SM, Patel JS, Poojari CS, Neidle S. Molecular modeling on inhibitor complexes and active-site dynamics of cytochrome P450 C17, a target for prostate cancer therapy. J Mol Biol. 2010;400(5):1078–1098. doi: 10.1016/j.jmb.2010.05.069. [DOI] [PubMed] [Google Scholar]
- 6.Mokarzel-Falcon L, Padron-Garcia JA, Carrasco-Velar R, Berry C, Montero-Cabrera LA. In silico study of the human rhodopsin and meta rhodopsin II/S-arrestin complexes: impact of single point mutations related to retina degenerative diseases. Proteins. 2008;70(4):1133–1141. doi: 10.1002/prot.21873. [DOI] [PubMed] [Google Scholar]
- 7.Raimondo D, Giorgetti A, Giorgetti A, Bosi S, Tramontano A. Automatic procedure for using models of proteins in molecular replacement. Proteins. 2007;66(3):689–696. doi: 10.1002/prot.21225. [DOI] [PubMed] [Google Scholar]
- 8.Qian B, Raman S, Das R, Bradley P, McCoy AJ, Read RJ, Baker D. High-resolution structure prediction and the crystallographic phase problem. Nature. 2007;450(7167):259–264. doi: 10.1038/nature06249. [DOI] [PMC free article] [PubMed] [Google Scholar]
- 9.Mitrasinovic PM. Advances in the structure-based design of the influenza A neuraminidase inhibitors. Curr Drug Targets. 2010;11(3):315–326. doi: 10.2174/138945010790711932. [DOI] [PubMed] [Google Scholar]
- 10.Du QS, Huang RB, Wang SQ, Chou KC. Designing inhibitors of M2 proton channel against H1N1 swine influenza virus. PLoS ONE. 2010;5(2):e9388. doi: 10.1371/journal.pone.0009388. [DOI] [PMC free article] [PubMed] [Google Scholar]
- 11.Gonzalez-Diaz H, Prado-Prado FJ, Garcia-Mera X, Alonso N, Abeijon P, Caamano O, Yanez M, Munteanu CR, Pazos Sierra A, Dea-Ayuela MA, Gomez-Munoz MT, Garijo MM, Sansano J, Ubeira FM. MIND-BEST: web server for drugs & target discovery; design, synthesis, and assay of MAO-B inhibitors and theoretic-experimental study of G3PD protein from Trichomona gallineae. J Proteome Res. 2010 doi: 10.1021/pr101009e. [DOI] [PubMed] [Google Scholar]
- 12.Tuccinardi T, Botta M, Giordano A, Martinelli A. Protein kinases: docking and homology modeling reliability. J Chem Inf Model. 2010;50(8):1432–1441. doi: 10.1021/ci100161z. [DOI] [PubMed] [Google Scholar]
- 13.Warner DF, Ndwandwe DE, Abrahams GL, Kana BD, Machowski EE, Venclovas C, Mizrahi V. Essential roles for imuA'- and imuB-encoded accessory factors in DnaE2-dependent mutagenesis in Mycobacterium tuberculosis. Proc Natl Acad Sci U S A. 2010;107(29):13093–13098. doi: 10.1073/pnas.1002614107. [DOI] [PMC free article] [PubMed] [Google Scholar]
- 14.Vilar S, Ferino G, Phatak SS, Berk B, Cavasotto CN, Costanzi S. Docking-based virtual screening for ligands of G protein-coupled receptors: Not only crystal structures but also in silico models. J Mol Graph Model. 2011;29(5):614–623. doi: 10.1016/j.jmgm.2010.11.005. [DOI] [PMC free article] [PubMed] [Google Scholar]
- 15.Ye Y, Li Z, Godzik A. Modeling and analyzing three-dimensional structures of human disease proteins. Pac Symp Biocomput. 2006:439–450. [PubMed] [Google Scholar]
- 16.Jurenaite-Urbanaviciene S, Serksnaite J, Kriukiene E, Giedriene J, Venclovas C, Lubys A. Generation of DNA cleavage specificities of type II restriction endonucleases by reassortment of target recognition domains. Proc Natl Acad Sci U S A. 2007;104(25):10358–10363. doi: 10.1073/pnas.0610365104. [DOI] [PMC free article] [PubMed] [Google Scholar]
- 17.Brylinski M, Skolnick J. Comprehensive structural and functional characterization of the human kinome by protein structure modeling and ligand virtual screening. J Chem Inf Model. 2010;50(10):1839–1854. doi: 10.1021/ci100235n. [DOI] [PMC free article] [PubMed] [Google Scholar]
- 18.Adam B, Charloteaux B, Beaufays J, Vanhamme L, Godfroid E, Brasseur R, Lins L. Distantly related lipocalins share two conserved clusters of hydrophobic residues: use in homology modeling. BMC Struct Biol. 2008;8:1. doi: 10.1186/1472-6807-8-1. [DOI] [PMC free article] [PubMed] [Google Scholar]
- 19.Kryshtafovych A, Fidelis K. Protein structure prediction and model quality assessment. Drug Discov Today. 2009;14(7/8):386–393. doi: 10.1016/j.drudis.2008.11.010. [DOI] [PMC free article] [PubMed] [Google Scholar]
- 20.Cozzetto D, Kryshtafovych A, Ceriani M, Tramontano A. Assessment of predictions in the model quality assessment category. Proteins. 2007;69(Suppl 8):175–183. doi: 10.1002/prot.21669. [DOI] [PubMed] [Google Scholar]
- 21.Cozzetto D, Kryshtafovych A, Tramontano A. Evaluation of CASP8 model quality predictions. Proteins. 2009;77(Suppl 9):157–166. doi: 10.1002/prot.22534. [DOI] [PubMed] [Google Scholar]
- 22.Kinch L, Shi S, Cheng H, Cong Q, Pei J, Schwede T, Grishin N. CASP9 target classification. Proteins. 2011 doi: 10.1002/prot.23190. Current. [DOI] [PMC free article] [PubMed] [Google Scholar]
- 23.Zemla A. LGA: A method for finding 3D similarities in protein structures. Nucleic Acids Res. 2003;31(13):3370–3374. doi: 10.1093/nar/gkg571. [DOI] [PMC free article] [PubMed] [Google Scholar]
- 24.Electronic Statistics Textbook. http://www.statsoft.com/textbook/nonparametric-statistics/
- 25.Wilcox RR. Fundamentals of modern statistical methods : substantially improving power and accuracy. Springer; New York, NY: 2010. p. xvi.p. 249. [Google Scholar]
- 26.Zimmerman DW, Zumbo BD, Williams RH. Bias in Estimation and Hypothesis Testing of Correlation. Psicologica. 2003;24:133–158. [Google Scholar]
- 27.Electronic Statistics Textbook. http://www.statsoft.com/textbook/basic-statistics/#Correlationso.
- 28.Faller AJ. An Average Correlation-Coefficient. J Appl Meteorol. 1981;20(2):203–205. [Google Scholar]
- 29.Sheskin DJ. Handbook of Parametric and Nonparametric Statistical Procedures. Chapman & Hall/CRC; Boca Raton: 2007. p. 1776. [Google Scholar]
- 30.Lasko TA, Bhagwat JG, Zou KH, Ohno-Machado L. The use of receiver operating characteristic curves in biomedical informatics. J Biomed Inform. 2005;38(5):404–415. doi: 10.1016/j.jbi.2005.02.008. [DOI] [PubMed] [Google Scholar]
- 31.Hanley JA, McNeil BJ. The meaning and use of the area under a receiver operating characteristic (ROC) curve. Radiology. 1982;143(1):29–36. doi: 10.1148/radiology.143.1.7063747. [DOI] [PubMed] [Google Scholar]
- 32.Matthews BW. Comparison of the predicted and observed secondary structure of T4 phage lysozyme. Biochim Biophys Acta. 1975;405(2):442–451. doi: 10.1016/0005-2795(75)90109-9. [DOI] [PubMed] [Google Scholar]
- 33.DeLong ER, DeLong DM, Clarke-Pearson DL. Comparing the areas under two or more correlated receiver operating characteristic curves: a nonparametric approach. Biometrics. 1988;44(3):837–845. [PubMed] [Google Scholar]
- 34.The R development Core Team . R: a language and environment for statistical computing. Vienna: 2006. [Google Scholar]
- 35.2011 http://ca.expasy.org/tools/pROC/
- 36.Kryshtafovych A, Fidelis K, Moult J. CASP9 results compared to those of previous CASP experiments. Proteins. 2011 doi: 10.1002/prot.23182. Current. [DOI] [PMC free article] [PubMed] [Google Scholar]
- 37.Pieper U, Webb BM, Barkan DT, Schneidman-Duhovny D, Schlessinger A, Braberg H, Yang Z, Meng EC, Pettersen EF, Huang CC, Datta RS, Sampathkumar P, Madhusudhan MS, Sjolander K, Ferrin TE, Burley SK, Sali A. ModBase, a database of annotated comparative protein structure models, and associated resources. Nucleic Acids Res. 2011;39(Database issue):D465–474. doi: 10.1093/nar/gkq1091. [DOI] [PMC free article] [PubMed] [Google Scholar]
- 38.Kiefer F, Arnold K, Kunzli M, Bordoli L, Schwede T. The SWISS-MODEL Repository and associated resources. Nucleic Acids Res. 2009;37(Database issue):D387–392. doi: 10.1093/nar/gkn750. [DOI] [PMC free article] [PubMed] [Google Scholar]
- 39.Castrignano T, De Meo PD, Cozzetto D, Talamo IG, Tramontano A. The PMDB Protein Model Database. Nucleic Acids Res. 2006;34(Database issue):D306–309. doi: 10.1093/nar/gkj105. [DOI] [PMC free article] [PubMed] [Google Scholar]
- 40.Adamczak R, Pillardy J, Vallat BK, Meller J. Fast Geometric Consensus Approach for Protein Model Quality Assessment. J Comput Biol. 2011 doi: 10.1089/cmb.2010.0170. [DOI] [PMC free article] [PubMed] [Google Scholar]
- 41.Zhang Y, Skolnick J. Scoring function for automated assessment of protein structure template quality. Proteins. 2004;57(4):702–710. doi: 10.1002/prot.20264. [DOI] [PubMed] [Google Scholar]
- 42.Eisenberg D, Luthy R, Bowie JU. VERIFY3D: assessment of protein models with three-dimensional profiles. Methods Enzymol. 1997;277:396–404. doi: 10.1016/s0076-6879(97)77022-8. [DOI] [PubMed] [Google Scholar]
- 43.Ota M, Nishikawa K. Assessment of pseudo-energy potentials by the best-five test: a new use of the three-dimensional profiles of proteins. Protein Eng. 1997;10(4):339–351. doi: 10.1093/protein/10.4.339. [DOI] [PubMed] [Google Scholar]
- 44.Sippl MJ. Recognition of errors in three-dimensional structures of proteins. Proteins. 1993;17(4):355–362. doi: 10.1002/prot.340170404. [DOI] [PubMed] [Google Scholar]
- 45.Kalman M, Ben-Tal N. Quality assessment of protein model-structures using evolutionary conservation. Bioinformatics. 2010;26(10):1299–1307. doi: 10.1093/bioinformatics/btq114. [DOI] [PMC free article] [PubMed] [Google Scholar]
- 46.Roche DB, Buenavista MT, Tetchner SJ, McGuffin LJ. The IntFOLD server: an integrated web resource for protein fold recognition, 3D model quality assessment, intrinsic disorder prediction, domain prediction and ligand binding site prediction. Nucleic Acids Res. 2011 doi: 10.1093/nar/gkr184. [DOI] [PMC free article] [PubMed] [Google Scholar]
- 47.Yang YD, Spratt P, Chen H, Park C, Kihara D. Sub-AQUA: real-value quality assessment of protein structure models. Protein Eng Des Sel. 2010;23(8):617–632. doi: 10.1093/protein/gzq030. [DOI] [PMC free article] [PubMed] [Google Scholar]
- 48.Pawlowski M, Gajda MJ, Matlak R, Bujnicki JM. MetaMQAP: a meta-server for the quality assessment of protein models. BMC Bioinformatics. 2008;9:403. doi: 10.1186/1471-2105-9-403. [DOI] [PMC free article] [PubMed] [Google Scholar]
- 49.McGuffin LJ. Prediction of global and local model quality in CASP8 using the ModFOLD server. Proteins. 2009;77(Suppl 9):185–190. doi: 10.1002/prot.22491. [DOI] [PubMed] [Google Scholar]
- 50.Cheng J, Wang Z, Tegge AN, Eickholt J. Prediction of global and local quality of CASP8 models by MULTICOM series. Proteins. 2009;77(Suppl 9):181–184. doi: 10.1002/prot.22487. [DOI] [PubMed] [Google Scholar]
- 51.McGuffin LJ, Roche DB. Rapid model quality assessment for protein structure predictions using the comparison of multiple models without structural alignments. Bioinformatics. 2010;26(2):182–188. doi: 10.1093/bioinformatics/btp629. [DOI] [PubMed] [Google Scholar]
- 52.Wang Z, Tegge AN, Cheng J. Evaluating the absolute quality of a single protein model using structural features and support vector machines. Proteins. 2009;75(3):638–647. doi: 10.1002/prot.22275. [DOI] [PubMed] [Google Scholar]
- 53.Lundstrom J, Rychlewski L, Bujnicki J, Elofsson A. Pcons: a neural-network-based consensus predictor that improves fold recognition. Protein Sci. 2001;10(11):2354–2362. doi: 10.1110/ps.08501. [DOI] [PMC free article] [PubMed] [Google Scholar]
- 54.Larsson P, Skwark MJ, Wallner B, Elofsson A. Assessment of global and local model quality in CASP8 using Pcons and ProQ. Proteins. 2009 doi: 10.1002/prot.22476. [DOI] [PubMed] [Google Scholar]
- 55.Cristobal S, Zemla A, Fischer D, Rychlewski L, Elofsson A. A study of quality measures for protein threading models. BMC Bioinformatics. 2001;2:5. doi: 10.1186/1471-2105-2-5. [DOI] [PMC free article] [PubMed] [Google Scholar]
- 56.Larsson P, Wallner B, Lindahl E, Elofsson A. Using multiple templates to improve quality of homology models in automated homology modeling. Protein Sci. 2008;17(6):990–1002. doi: 10.1110/ps.073344908. [DOI] [PMC free article] [PubMed] [Google Scholar]
- 57.Benkert P, Tosatto SC, Schwede T. Global and local model quality estimation at CASP8 using the scoring functions QMEAN and QMEANclust. Proteins. 2009;77(Suppl 9):173–180. doi: 10.1002/prot.22532. [DOI] [PubMed] [Google Scholar]
- 58.Benkert P, Kunzli M, Schwede T. QMEAN server for protein model quality estimation. Nucleic Acids Res. 2009;37(Web Server issue):W510–514. doi: 10.1093/nar/gkp322. [DOI] [PMC free article] [PubMed] [Google Scholar]
- 59.Benkert P, Tosatto SC, Schomburg D. QMEAN: A comprehensive scoring function for model quality assessment. Proteins. 2008;71(1):261–277. doi: 10.1002/prot.21715. [DOI] [PubMed] [Google Scholar]
Associated Data
This section collects any data citations, data availability statements, or supplementary materials included in this article.