

Abstract
To test the effect of varying the proton donor-acceptor distance in proton-coupled electron transfer (PCET) reactions, the oxidation of a bicyclic amino-indanol (2) is compared with that of a closely related phenol with an ortho CPh2NH2 substituent (1). Spectroscopic, structural, thermochemical and computational studies show that the two amino-phenols are very similar, except that the O⋯N distance (dON) is >0.1 Å longer in 2 than in 1. The difference in dON is 0.13 ± 0.03 Å from X-ray crystallography and 0.165 Å from DFT calculations. Oxidations of these phenols by outer-sphere oxidants yield distonic radical cations •OAr–NH3+ by concerted proton-electron transfer (CPET). Simple tunneling and classical kinetic models both predict that the longer donor-acceptor distance in 2 should lead to slower reactions, by ca. two orders of magnitude, as well as larger H/D kinetic isotope effects (KIEs). However, kinetic studies show that the compound with the longer proton-transfer distance, 2, exhibits smaller KIEs and has rate constants that are quite close to those of 1. For example, the oxidation of 2 by the triarylamminium radical cation N(C6H4OMe)3•+ (3a+) occurs at (1.4 ± 0.1) × 104 M-1 s-1, only a factor of two slower than the closely related reaction of 1 with N(C6H4OMe)2(C6H4Br)•+ (3b+). This difference in rate constants is well accounted for by the slightly different free energies of reaction: ΔG°(2 + 3a+) = +0.078 V vs. ΔG°(1 + 3b+) = +0.04 V. The two phenol-amines do display some subtle kinetic differences: for instance, compound 2 has a shallower dependence of CPET rate constants on driving force (Brønsted α, Δln(k)/Δln(Keq)). These results show that the simple tunneling model is not a good predictor of the effect of proton donor-acceptor distance on concerted-electron transfer reactions involving strongly hydrogen-bonded systems. Computational analysis of the observed similarity of the two phenols emphasizes the importance of the highly anharmonic O⋯H⋯N potential energy surface and the influence of proton vibrational excited states.
Introduction
Reactions that involve transfer of proton(s) and electron(s) are important in a wide variety of chemical and biological systems, from enzymatic reactions to electrocatalysts for important energy processes such as water oxidation to dioxygen.1-4 The most studied class of such proton-coupled electron transfer (PCET) reactions involve the transfer of one electron and one proton transfer in the same kinetic step, called concerted proton-electron transfer (CPET).5 Understanding the parameters which affect CPET and other hydrogen transfer reactivity will be broadly valuable. Studies of CPET have been aided by parallels with the Marcus theory of outer-sphere electron transfer (ET), which relates reaction rates with driving force.6 Marcus-type treatments have been used by experimentalists to explain CPET results,7 and most of the more extensive theoretical treatments have used a Marcus-type approach as their starting point.8
The greater mass of the proton relative to the electron requires that hydrogen transfers occur over much smaller distances than ET, making the proton transfer (PT) distance a key parameter in CPET. Nuclear tunneling is often important in these processes and is highly dependent on the distance the proton must transfer. One simple tunneling model predicts that an increase of 0.1 Å should lead to a 30-fold decrease in rate.9 Kinetic isotope effects (KIEs) of deuterium (and tritium) substitution are valuable tools in the study of these processes. To a first approximation, the more massive nuclei have a steeper distance dependence of tunneling probabilities.
The PT distance has received particular attention in the study of biological hydrogen atom transfer (HAT), which is one type of CPET process. For example, HAT in lipoxygenase enzymes, from an allylic C–H bond to the iron(III)-hydroxo active site, has been of interest since the discovery of hydrogen/deuterium kinetic isotope effects (KIEs) as large as 81.10 This large value indicates that nuclear tunneling is important.10,11 The temperature dependence of the KIE and other data indicate that vibrations which modulate the PT distance are crucial to the action of the enzyme.12 In a series of detailed computational studies, Hammes-Schiffer and co-workers have found that HAT occurs primarily from configurations in which the proton donor acceptor distance has been compressed to 2.69 Å, substantially shorter than the equilibrium distance of 2.88 Å.13 Optimization of these motions in the protein and the resulting effects on proton tunneling have been suggested to be key factors in enzyme catalysis.2,3,13,14
Small molecule phenol-base compounds have proven to be valuable model systems for the systematic investigation of the importance of various parameters on CPET, in addition to being models for the key tyrosine-histidine pair in photosystem II.15-20 Removal of an electron from these compounds proceeds with concomitant transfer of the phenolic proton to the base. These are not HAT reactions because the electron and proton are separated in the products, so these have been termed separated CPET (or multiple site, bidirectional, or orthogonal EPT).1 In our ongoing studies of phenols with a pendant nitrogen base, the PT transfer distance (dON) has been a parameter of interest, but the kinetic effects of this parameter have been convoluted with changes in other variables. For example, in our study of oxidations of a series of phenolimidazole compounds, we found that intrinsic barriers to CPET were fairly constant despite variations in ground state dON spanning 0.113(3) Å, as determined by X-ray crystallography.21 However, we concluded that crystal packing forces were likely a major cause of this variation, as computed gas phase values varied by only 0.04 Å with poor correlation to X-ray values. Comparing two phenol-pyridines, we found that the presence of a methylene unit between the phenol and pyridine moieties leads to a longer proton-transfer distance as well as substantially increased intrinsic barriers to CPET.22 This kinetic effect was ascribed to changes in the hydrogen bond, specifically, the disruption of the strong, resonance-assisted hydrogen bond in the fully conjugated case, rather than specifically to the distance.22 This explanation is consistent with kinetic data obtained with phenol-imidazoles which have lower CPET barriers despite longer dON.19b,21
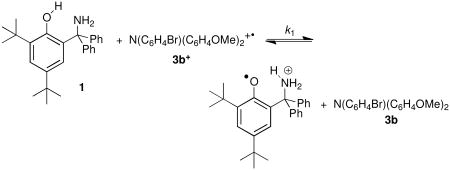
Herein, we describe the first detailed experimental study to probe the importance of proton transfer distance on separated CPET, comparing the oxidations of two closely related phenol-amine compounds. Reactions of 2,4-di-tert-butyl-6-(diphenylaminomethyl)phenol (1) (Scheme 1) with one-electron, outer-sphere oxidants such as substituted triarylamminium radical cations proceed via CPET to yield the distonic, proton-transferred cation.19a The bicyclic compound 2, 1-amino-4,6-di-tert-butyl-7-hydroxyindan, is an analogue of 1 in which the fused five-membered ring leads to an increase in dON. The kinetic, thermodynamic, structural, and spectroscopic properties of 1 and 2 are compared below, using both experiment and DFT calculations. The results are not what is predicted by simple theoretical tunneling models, and contrast with those of a paper that appeared just as this one was undergoing final revisions.23 This study therefore can serve as a test case for more sophisticated theories of CPET, and it illustrates the importance of combining experimental and theoretical analyses of PCET.
Scheme 1.
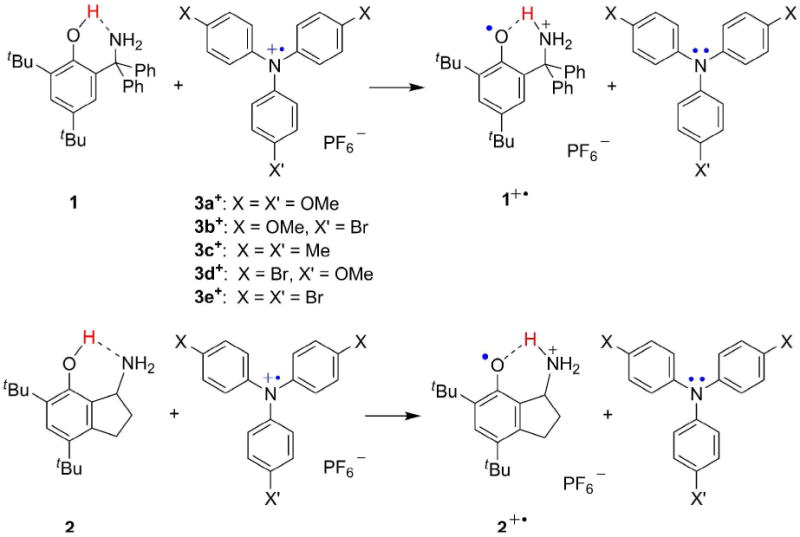
Phenol-amines 1 and 2 and their concerted proton-electron transfer oxidations by triarylamminium cations (3+).
Results
Synthesis of bicyclic amine 2
The hydrochloride salt of compound 2, 4,6-di-tert-butyl-7-hydroxy-1-aminoindan hydrochloride, has been reported by Oshiro et al.24 The oxime reduction in that report proved problematic in our hands, perhaps a result of the formation of byproducts via ortho-quinone methide intermediates.25 However, 2 was successfully prepared via reductive amination of 7-hydoxy-1-indanone25 followed by alkylation in tert-butanol/H2SO4(aq) in the presence of urea.26 The resulting salt was deprotonated to the neutral amine, 2, which has been characterized by IR, NMR, and mass spectrometry (see Experimental Section). In addition, single crystals of 2 were obtained from a solution in hexanes and were characterized by X-ray diffraction.
Structural and spectroscopic comparisons of 1 and 2
Compound 2 crystallizes in an orthorhombic space group with one independent molecule per unit cell, with the enantiomers related by symmetry. The triclinic unit cell of 1, however, has two independent molecules;19 the comparisons below either use the average or give the parameters for both molecules explicitly. Figure 1 presents ORTEPs of 2 and one of the independent molecules of 1, as well as the atom labeling used.
Figure 1.
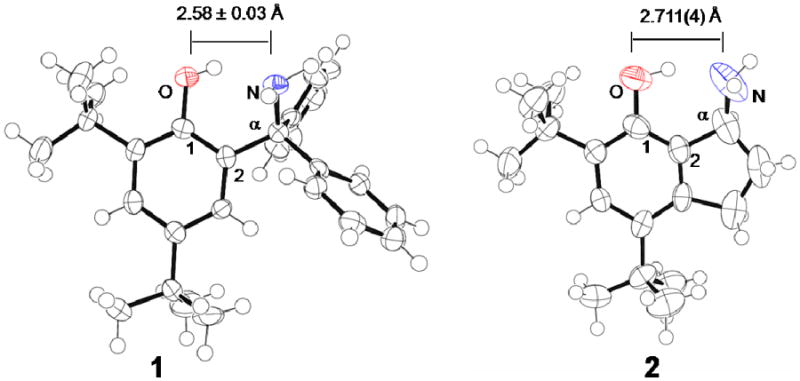
ORTEPs, with crystallographic O⋯N distances, for phenols 119 and 2, ellipsoids drawn at 75% probability. For 1, the O⋯N distance listed is the average of the two independent molecules in the unit cell, which have distances that differ by 0.06 Å. Atom labels for relevant carbons used for the geometry discussion are given on the drawings.
The structures of 1 and 2 are similar in many ways. The C–O distances and comparable bond lengths in the phenol rings of the two compounds are the same within less than 0.02 Å. In both cases, the aliphatic carbon that holds the amino group (Cα) is essentially in the phenol plane, but the amine nitrogen lies out of the plane of the phenol by 0.827 Å (2) and 0.832, 0.998 Å (1). The twisting of the nitrogen out of the plane is also indicated by the C1-C2-Cα-N torsion angles of 35.1(4)° (2) and 33.6(3)°, 41.9(3)° (1). In addition, the O-H-N angle of the hydrogen bonds, are the same within uncertainty for 2 (153(3)°) and 1 (152(2)° and 155(2)°).
There are also significant differences between the structures. The critical O⋯N distance (dON) in 2, 2.711(4) Å, is 0.13 ± 0.03 Å longer than in the two independent molecules in the structure of 1, 2.550(2), 2.613(3) Å. The dON in 2 is comparable to that reported for a closely related 7-hydroxy-1-aminoindan derivative, 2.747 ± 0.013 Å (this is the average of two independent molecules in the unit cell).24,27 The longer dON in 2 is due in part to Cα being constrained away by the cyclopentane ring, as indicated by the larger C1-C2-Cα angle in 2 (113.8(3)°) than in 1 (107.3(2)° and 107.4(2)°). In addition, the N–Cα–C2 angle is 113.8(3)° in 2, larger than the tetrahedral angle and larger than the 107.4(3)° in 1. The C2–Cα and Cα–N bonds are shorter in 2 than 1, by 0.035(6) Å (C2–Cα) and 0.061(5) Å (Cα–N). These differences may be the result of steric effects in 1 and increased sp2 character at the α-carbon in 2, which is distorted from a tetrahedral geometry; the sum of the three angles, excluding the hydrogen, around Cα is 336.6(5)°.28
We focus on the O⋯N distance rather than the O–H and H⋯N distances because the broad vibrational wavefunction means that the proton does not have a well-defined position. Electron density for the H1 was observed in the structures of 1 and 2 in the difference Fourier map and its position was refined isotropically, but it is not straightforward to interpret this position.29
The crystallographic structures can be significantly influenced by packing forces, as indicated by the 0.063(4) Å difference in dON between the two independent molecules in crystalline 1. Therefore gas-phase geometries have been computed using Density Functional Theory (DFT), specifically B3LYP/6-31G(d,p). For computational studies, tert-butyl and phenyl groups have been replaced by CH3, with little effect on the value of dON.30 The gas-phase DFT structures have longer dON than the crystallographic values, 2.808 Å for 2 and 2.643 Å for 1, but the difference between the two (0.165 Å) is similar to the value obtained from X-ray structures. Additionally, geometry optimizations for 1 and 2 using five expanded basis sets in conjunction with four additional density functionals or the inclusion of a solvent model gave similar results (see Supporting Information). More specifically, in geometries calculated using the largest basis set (aug-cc-pVTZ), dON varies by < 0.05 Å for both 2 (2.797 – 2.846 Å) and 1 (2.626 – 2.670 Å). In each, these ranges contain the B3LYP/6-31G(d,p) values. The differences in dON between 1 and 2 were somewhat increased: 0.168 – 0.182 Å depending on the functional, suggesting that the crystallographic values may provide an underestimate of the difference in this coordinate. Also in line with the crystallographic structures, the B3LYP/6-31G(d,p) O-H-N angles are very similar for 2 (146.4°) and 1 (147.9°), indicating that the proton donor acceptor distance here is a good proxy for the proton transfer distance (see Supporting Information) which is not necessarily the case in other studies of the kinetic effects of increased distance.31,32 DFT calculations have also been used to estimate the energies required to reduce dON, as described in the Discussion.
The IR and NMR spectra of 1 and 2 also indicate significant differences in their hydrogen bonds. The IR spectra both show a very broad vOH band, underneath the sharper C–H stretching modes at 2800-3000 cm-1 (Figure 2). Broad vOH bands are typical of strongly hydrogen bonded systems.33 Compound 1 was deuterated via exchange with MeOD, causing decrease in the broad band assigned to vOH and the appearance of new broad band centered at 2200 cm-1 (in CHCl3 solution), corresponding to the vOD stretch (Figure S3, Supporting Information). While quantitative analysis is difficult, vOH in 2 does appear to be higher in energy than the vOH in 1, consistent with a longer and weaker hydrogen bonding interaction.34,35
Figure 2.
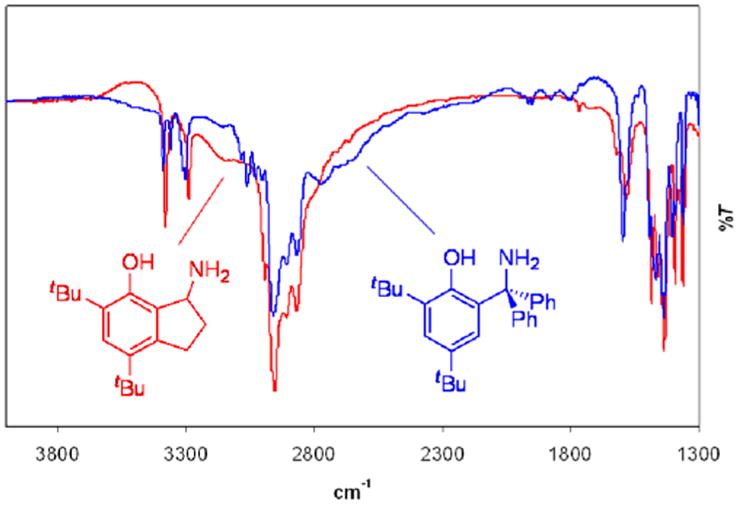
IR spectra of 1 (blue) and 2 (red) collected as KBr pellets. The lines from the drawings to the spectra indicate the broad vOH band in each spectrum.
The 1H NMR spectrum of 2 in dried CD3CN ([2] = 5 mM) shows a single broad peak for the diastereotopic amino protons, δ(NH2) = 2.10 ppm, which overlaps with trace water, and a very broad downfield peak for the phenolic proton: δ(OH) = 11.14 ppm, fwhm = 71 Hz. These two resonances in the spectrum of 2 sharpen at lower concentrations, and sharpen and shift at lower temperatures. Exchange between these sites is indicated by a cross peak in the two-dimensional EXSY experiment (Figure S1, Supporting Information). Analysis of the EXSY spectrum, with the perhaps overly simple assumption of purely intramolecular exchange, gives a rough estimate of the rate constant for the exchange process at 298 K of 0.6 s-1. In contrast, the 1H NMR spectrum of 1 (CD3CN, [1] = 5 mM) has sharp singlets for the OH and NH2 protons, both downfield of the corresponding signals for 2 (OH: δ12.32 ppm, fwhm = 4 Hz; δNH2, 3.34 ppm). These results support the conclusion of a weaker O-H⋯N hydrogen bonding interaction in 2 than in 1.
Thermodynamics of oxidations
Cyclic voltammograms (CVs) of 2 in MeCN (Figure 3) showed a chemically reversible wave at E1/2 = 0.244 ± 0.006 V (all potentials are reported vs. Cp2Fe0/+ internal standard). This is somewhat lower than that of 1 (E1/2 = 0.36 ± 0.02 V).19 The CVs of 1 and 2 are not, however, electrochemically reversible. As is evident from Figure 3, the peak separations, ΔEp, are a function of scan rate. An earlier study modeled the CV waves for 1 in terms of slow electron transfer kinetics, and extracted a rate constant that was consistent with homogeneous ET rate constants.19b CVs of 1 and 2 have similar ΔEp values, 110 mV vs. 140 mV for 1 at 0.2 V s-1; both are larger than that observed for ferrocene (ca. 80 mV) under the same conditions. The low potential (compared with 2,4,6-tBu3ArOH and related phenols) and the quasi-reversible behavior are evidence that electrochemical oxidations proceed via CPET.1e,18,19b,36.
Figure 3.
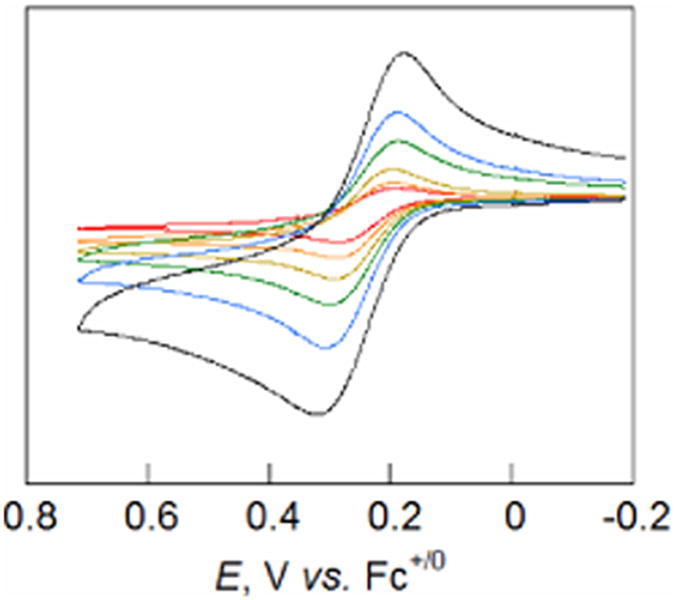
Cyclic voltammograms of 2 with scan rates of 12, 25, 50, 100, 200, and 500 mV s-1 (red, orange, gold, green, blue, and black lines respectively).
The reaction of 2 with the triarylamminium radical cation oxidant N(p-C6H4OMe)3+• (3a+), is thermodynamically uphill and reaches equilibrium, 2 + 3a+⇌2+ + 3a0 (where 2+ is the phenoxyl radical cation and 3a0 is the neutral triarylamine, see eq 2 below). These experiments were done using stopped-flow mixing and on this timescale the equilibrium mixtures are stable. The change in the position of the equilibrium with varying amounts of excess phenol was used to determine the equilibrium constant, K2 = 0.049(8) (see Supporting Information). This value, and the E1/2 for 3a+/0 of 0.16 ± 0.02 V,19 corresponds to E1/2(2) = 0.24 ± 0.02 V in excellent agreement with the value determined electrochemically. Stopped-flow equilibrium measurements were obtained at various temperatures, T = 288 – 328 K. Over this temperature range K2 increases monotonically from 0.043(6) to 0.064(9), a change in ΔG of less than 1 mV, yielding ΔH2°= 1.8 ± 0.8 kcal mol-1 and ΔS2° = 0.0 ± 2.7 cal K-1 mol-1 (all errors are listed as 2σ).
We have reported previously that cyclic voltammograms of 1 and 3c at T = 275 and 322 K indicated the potentials did not shift within our experimental uncertainty (± 30 mV) indicating a small entropy of reaction.19b Savéant and co-workers later performed similar variable temperature CVs on 3c and a synthetically simpler analogue of 1 (a pyrrolidine-derived Mannich base) and obtained results consistent with our earlier measurements.18b While their data are quite scattered (R2 ∼ 0.6), they reported18b,c that the reaction of 1 with 3c+ has a variation in Erxn of ca. 12 mV over the temperature range 260 – 294 K, with ΔH° = 2.4 ± 1.4 kcal mol-1 and ΔS° = 9.6 ± 4.8 cal K-1 mol-1. This ΔS° for an analogue of reaction 1 is similar, but significantly higher than those reported above for 2 + 3a+. Even these modest entropic contributions to the driving force, at the limits of what can be determined electrochemically, can have large effects on the analysis of rate vs. temperature data.18b,c
Kinetics of oxidations of phenol-amines by amminium ions
Reactions 1 + 3b+ and 2 + 3a+ allow for comparison of reactivity of the two phenol-amines at comparable driving force using similar oxidants. Equation 1 has Erxn = −0.04 ± 0.03 V19 and eq 2 has Erxn = −0.078 ± 0.011 V. The kinetics were studied in dry anaerobic MeCN using stopped-flow techniques, monitoring the disappearance of the intense blue color of the oxidant (Figure 4). The spectral data are fitted globally to an approach-to-equilibrium kinetic model.
Figure 4.
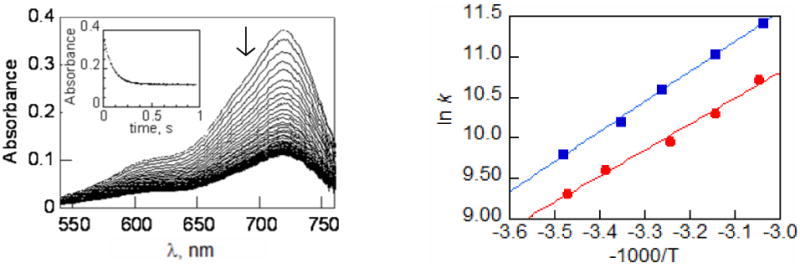
(a) Representative stopped flow data for reaction 2 showing decay of the amminium oxidant. The inset is the time trace of absorbance at λmax (718 nm) fit to an approach to equilibrium kinetic model. (b) Arrhenius plots for reaction 1 (red
 ) and reaction 2 (blue
 ).
).
 |
(1) |
 |
(2) |
The forward rate constant for reaction 2, k2, was found to be (1.4 ± 0.1) × 104 M-1 s-1. This is roughly half the value determined previously for reaction 1, k1 = (2.7 ± 0.3) × 104 M-1 s-1.19 The rates for these two reactions are quite similar, with the slower reaction 2 also having the less favorable thermodynamics. The difference in driving force (0.038 ± 0.030 V) corresponds to a difference in equilibrium constant of a factor of 4.4, which would very closely account for the factor of two in rate given the dependence of k on Keq for these reactions (see below). Thus, in this case, increased PT distance has little effect on reaction rates. As discussed below, this contrasts with first-order proton tunneling models that predict changes of ca. two orders of magnitude.
The rates of reactions 1 and 2 have been determined as a function of temperature over the range T = 288 – 328 K. Arrhenius analysis of this data, Figure 4b, yields log A = 9.8 ± 0.8 and Ea = 7.4 ± 1.2 kcal mol-1 for reaction 1 and log A = 8.8 ± 0.8 and Ea = 6.3 ± 1.2 kcal mol-1 for reaction 2 (Table 1). Similar values were reported previously for the related reaction 1 + 3c+.19b,37 While the error bars on these Arrhenius parameters are large, we note that reaction 2, with the larger PT distance, appears to have a lower A factor. Changes in nuclear quantum effects such as decreased tunneling probabilities would, to a first approximation, be expected to appear as a lower A factor. In the comparison here, the lower A factor for reaction 2 appears to be compensated by a smaller Ea to give similar rate constants at 298 K.
Table 1.
Kinetic parameters for reactions 1 and 2.
| Reaction | Erxn, V | k, M-1s-1 | logA | Ea, kcal mol-1 | KIE |
|---|---|---|---|---|---|
| (1) 1 + 3b+ | −0.04 ± 0.03 | (2.7 ± 0.3) × 104 | 9.8 ± 0.8 | 7.4 ± 1.2 | 2.1 ± 0.3 |
| (2) 2 + 3a+ | −0.078 ± 0.011 | (1.4 ± 0.2) × 104 | 8.8 ± 0.8 | 6.3 ± 1.2 | 1.3 ± 0.2 |
To determine the deuterium kinetic isotope effect (KIE, kH/kD) in reactions 1 and 2, stopped-flow experiments have been performed in the presence of 0.5 – 1% CD3OD in CH3CN solvent. Under these conditions, the exchangeable N-H and O-H protons are replaced by deuterons from the large molar excess of CD3OD, yielding 1-d3 and 2-d3. Control experiments in the presence of CH3OH at these concentrations gave rate constants within the experimental uncertainty of experiments performed in pure MeCN19 (for reaction 2, k2H in the presence of CH3OH = (1.6 ± 0.2) × 104 M-1 s-1). Studies of reaction 2 in the presence of CD3OD gave the forward reaction rate constant k2D = (1.2 ± 0.1) × 104 M-1 s-1, corresponding to a KIE (kH/kD) = 1.3 ± 0.2. Varying the amount of (d4-)methanol from 0.1 – 5.0% gave variations in kH/kD (from 1.22 to 1.32) that are within experimental uncertainty and did not follow a simple trend. By comparison, reaction 1 was found to have k1D = (1.3 ± 0.1) × 104 M-1 s-1, and KIE = 2.1 ± 0.3. Thus, under otherwise similar reaction conditions, phenol-amine 2, with the larger proton transfer distance, displays a smaller kinetic isotope effect. This result is in sharp contrast with predictions based on a simple tunneling model that predict that deuterium tunneling probabilities should be much more sensitive to changes in distance than protium.
Potentially, the smaller KIE observed for reaction 2 could be in part a result of a thermodynamic isotope effect (KH/KD). Analyses of the equilibrium mixtures of reaction 2D, as above, yields K2D = 0.08(2), somewhat larger than the value of 0.053(8) obtained in the presence of CH3OH. The KH/KD of 0.7(2) is an inverse isotope effect, which is not expected for conversion of an O–H bond to an N–H one based on standard zero-point-energy arguments.38 However, the modes involved are highly anharmonic and mixed (see Figure 2, Figure 7 below, and reference 35b, Chapter 4). The inverse thermodynamic isotope effect may be causing a small (∼20%) decrease in the observed kinetic isotope effect kH/kD.
Figure 7.
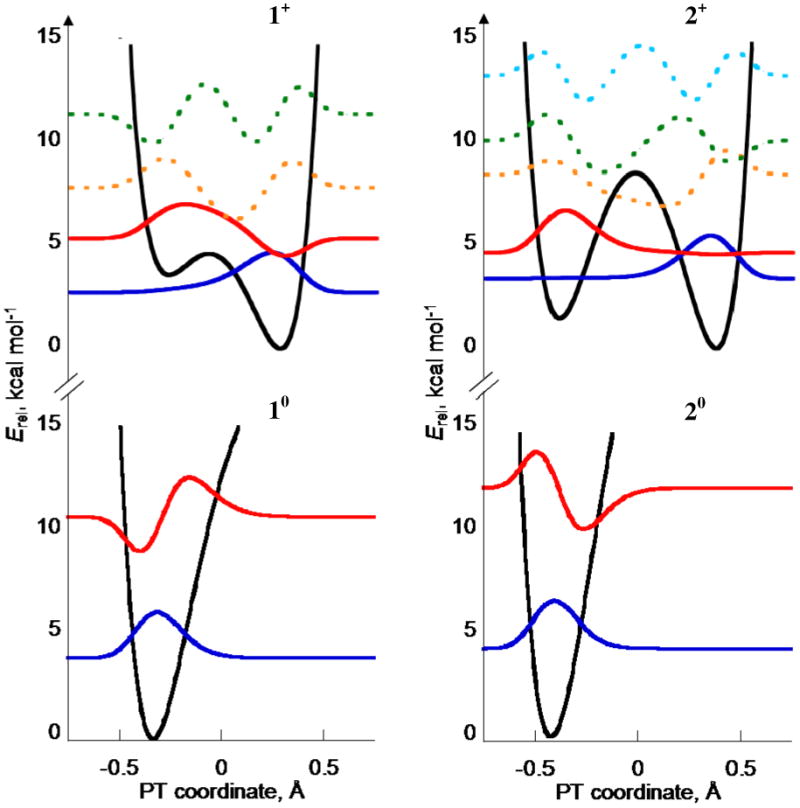
Proton transfer potential energy surfaces (black lines) calculated for neutrals (bottom) and distonic radical cations (top) of 1 and 2, with heavy atoms fixed at the average “TS0” geometry, dON = 2.59 Å (1) and 2.67 Å (2). Proton vibrational wavefunctions are shown: v = 0 (blue) and v = 1 (red); higher vibrational wavefunctions (dotted lines) are minor contributors to the CPET reaction.
For both reactions 1 and 2, the KIE did not vary significantly over the temperature range studied and Arrhenius analysis does not give a strong indication of tunneling effects.3,39 Arrhenius parameters derived from the variation of kD with T analysis were found to be well within error of those stated above for the proteo analogues: Ea,D – Ea,H = 0 ± 1.7 kcal mol-1 (reaction 2) and −0.1 ± 1.7 kcal mol-1 (reaction 1) while log (AH/AD) = 0.1 ± 1.1 (reaction 2) and 0.3 ± 1.1 (reaction 1).
Variation of rate constants with driving force
Rate constants have also been determined for the oxidation of 2 by four other amminium oxidants 3b+-3e+. The potentials of the five oxidants vary by 0.51 V, so these constitute a series of very similar reactions with a systematic variation in driving force. In the series of reactions, 2 + 3a+-3e+, Keq varies from 4 × 10⁻² to 2 × 10⁷ and the bimolecular forward reaction rate constants vary monotonically from (1.4 ± 0.1) × 104 for 2 + 3a+ to (4.9 ± 1.5) × 107 M-1 s-1 for 2 + 3e+ (Table 2). The last rate constant is near the upper limit of what can be measured with our apparatus, hence the greater uncertainty in the rate constant. As illustrated in Figure 5, ln(k) correlates linearly with ln(Keq) with a slope of 0.38(3) (R2 = 0.982). This is the Brønsted α, the dependence of rate constant on driving force, for this set of reactions.
Table 2.
Rate constants for reactions of 2 with various oxidants.
| oxidanta | Erxn, V | kH, M-1 s-1 | kD, M-1 s-1 | KIEb |
|---|---|---|---|---|
| [N(p-C6H4OMe)3]+ (3a+) | −0.08 | (1.4 ± 0.1) × 104 | (1.1 ± 0.2) × 105 | 1.3 ± 0.2 |
| [N(p-C6H4OMe)2(p-C6H4Br)]+ (3b+) | 0.08 | (2.4 ± 0.2) × 105 | c | |
| [N(p-C6H4Me)3]+ (3c+) | 0.14 | (4.3 ± 0.4) × 105 | (1.9 ± 0.2) × 105 | 2.4 ± 0.3 |
| [N(p-C6H4Br)2(p-C6H4OMe)]+ (3d+) | 0.24 | (1.4 ± 0.1) × 106 | (5.0 ± 0.5) × 105 | 2.6 ± 0.4 |
| [N(p-C6H4Br)3]+ (3e+) | 0.43 | (4.9 ± 1.5) × 107 | (1.5 ± 0.3) × 107 | 3.7 ± 1.3 |
| [Fe(Me4phen)3]3+ d | 0.22 | (3.0 ± 0.3) × 105 | c | |
| [Fe(Me2phen)3]3+ e | 0.31 | (2.1 ± 0.2) × 106 | c | |
| [Fe(Me2bpy)3]3+ f | 0.36 | (4.3 ± 0.4) × 105 | c |
All oxidants are PF6- salts.
KIE is the ratio of the rates in the presence of CH3OH and CD3OD.
Not determined.
Me4phen = 3,4,7,8-Me4phen.
Me2phen = 4,7-Me2phen.
Me2bpy = 5,5′-Me2bpy.
Figure 5.
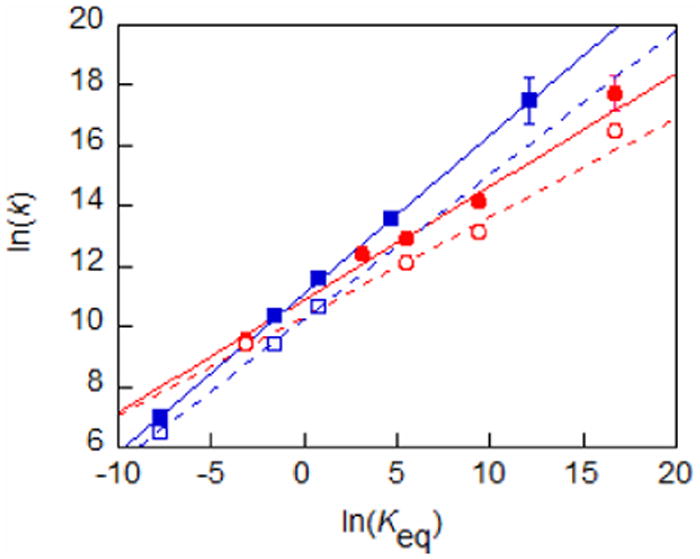
Variation of ln(k) with ln(Keq) for reactions of 3a+-3e+ with 1 (blue squares and line), 1-d3 (open squares, dotted line), 2 (red circles and line), 2-d3 (open circles, dotted line). Lines are linear fits where the slope is the parameter α.
A similar Brønsted plot of our previously reported data for 1 + 3a+-3e+ yields a line with a slope of 0.53(3), R2 = 0.999 (Figure 5).19a Given the differences in α for reactions of 1 and 2, the kinetic differences between the two reactions (k1/k2) are a function of driving force. At the same driving force, 2 is predicted to react faster than 1 when Erxn < −0.05 V, despite the longer dON. The similarity in rate constants noted for reactions 1 and 2 is a consequence of the reactions falling near the crossing point of the lines in Figure 5. However, over the 0.39 V range for which direct comparison is available, rates are predicted to differ by no more than a factor of 13 (k1+3/k2+3 = 0.4-13).
KIEs have been determined for reactions of 2 with four of the amminium oxidants (3+), Table 2. The values increase monotonically with Erxn, from 1.3 ± 0.2 (for 2 + 3a+) to 3.7 ± 1.3 (for 2 + 3e+). The same behavior is seen in the oxidations of 1 by 3+ (1 + 3a+, KIE = 1.6 ± 0.2, Erxn = −0.20;19b 1 + 3b+, KIE = 2.1 ± 0.3, Erxn = −0.04 and 1 + 3c+, KIE = 2.5 ± 0.3, Erxn = 0.0219b). This is in contrast with the semiclassical prediction that the KIE should be at a maximum when ΔGrxn = 0.38 Full quantum mechanical/deep tunneling models of hydrogen transfer also predict that the KIE will generally peak when ΔGrxn is near zero, but deviations are predicted.40,41 Plotting ln(k) vs. ln(Keq) for the reactions of 2-d3 + 3+ gives α2,D = 0.33(2), R2 = 0.98 (Figure 5), which is lower than the value of 0.38(3) obtained for the proteo analogues. Similarly, α1,D = 0.48(4), R2 = 0.9997, again smaller than α1,H. The point in Figure 5 corresponding to the reaction of 2-d3 + 3e+, the most downhill reaction, lies above the best fit line by a factor of 2, potentially indicating curvature or a discontinuity in the relationship due to contributions of stepwise ET/PT pathways which would be favored over CPET by the KIE.42 Overall, it should be emphasized that at the same reaction driving force, the KIE is always smaller for the oxidations of 2 than for the oxidations of 1, despite the longer dON in 2.
Kinetics of oxidations of phenol-amines by iron oxidants
Rate constants have also been determined for the reactions of 2 with several iron(III)-tris-bipyridyl or tris-phenanthroline oxidants (Table 2, ln(k) vs. ln(Keq) in Figure S4). As has been observed with all of the phenol-base compounds we have studied, the variation of k with driving force has shown more scatter with these iron(III)-tris-diimine oxidants19b,22 than is observed in the reactions of the triarylamminium oxidants 3a+-3e+, making a detailed analysis more complex. Still, it is clear that the rate constants are generally similar for 1 and 2 at comparable driving force, as found for the amminium oxidations.
Discussion
Mechanism of the Oxidations
The mechanism of the phenol oxidations could, in principle, be either concerted proton-electron transfer (CPET) or a sequence of discrete electron transfer and proton-transfer steps with either the ET or PT occurring first (ET/PT or PT/ET, respectively). As we have described in detail previously, the stepwise pathways are ruled out for the reactions of 1 based on thermodynamic arguments: the observed Eyring barriers (ΔG‡) for the oxidations are much higher than the ΔG° for the initial ET or PT steps of the stepwise mechanisms. The stepwise paths yield either the phenol radical cation B-ArOH+• by initial ET, or the zwitterion +HB-ArO− by initial PT, and the ΔG° for these steps is estimated from E° and pKa values of related compounds.43 Because of the similar rates, as well as the structural similarities, these arguments also hold for the reactions of 2 with the amminium oxidants (3+). For the PT/ET mechanism, the additional alkyl substituent on phenol 2 should increase its pKa, making this pathway even less likely. The ET/PT pathway is ruled out by the estimated ΔG°ET for initial ET being much larger than the Eyring barriers ΔG‡ (with the possible exception of 2 + 3e+)42c These thermodynamic arguments are further supported by the variation of rates with driving force (α ∼ ½) which is only consistent with the CPET mechanism.19b,44 This argument is not as strong for the reactions of the iron tris-diimine oxidants, but CPET pathways are still indicated (see Supporting Information). The relatively small primary isotope effects for these reactions (Table 2) are typical of CPET reactions of this kind.1e,15a,18,19b
Comparison of reactions 1 and 2: Distance has little effect
Compounds 1 and 2 are very similar molecules, phenols with a saturated carbon in the 2-position bearing an NH2 group. In broad terms, the two molecules have closely related structures, spectroscopy, thermochemistry, and reactivity. The primary difference between them is that the bicyclic phenol 2 has a longer OH⋯N hydrogen bond. Crystallographically, the O⋯N distance (dON) is 0.13 ± 0.03 Å longer in 2 (2.711(4) Å) than in 1 (2.550(2), 2.613(3) Å for the two independent molecules in its unit cell). Gas-phase DFT calculations give a 0.165 Å difference between the two dON values, at the larger end of the crystallographic range. Given the otherwise similar hydrogen bond geometries, these two phenols thus present a clear test of the effect of hydrogen donor-acceptor distance on proton-coupled electron transfer (PCET) reactivity.
The proton transfer distance is a key parameter in the developing theories that describe the concerted transfer of a proton and an electron.2,8,45 These hydrogen transfer reactions are important in the action of a variety of proteins. In a number of cases, kinetic isotope effects of unusual magnitude and temperature dependence have been observed.46 They present intriguing challenges for theoretical description because of the interplay of classical energetic barriers, nuclear tunneling, and dynamical effects. As such, the theory continues to develop. A decade ago, Krishtalik provided an overview of proton transfer reactions and presented some typical cases.9 In the simplest model, using ground state vibrational wavefunctions in Morse potentials for the X–H bond and assuming weak interactions between the donor and acceptor, the rate of proton tunneling is predicted to vary exponentially with distance. Quantitatively, rate constants in this model vary with distance by e-βΔR with β = 30-40 Å-1, in other words decreasing by a factor of e for an increased distance of 0.025 – 0.033 Å. However, as Krishtalik noted, this simple model does not hold for strongly hydrogen bonded systems such as 1 and 2, which should show a shallower dependence on distance.9 Still, the simple model provides one crude estimate of the effect of different donor-acceptor distances in the reactions of 1 and 2. Using the 0.13 Å crystallographic difference in dON, the simple model predicts that 2 should have a 50 – 200-fold slower rate constant than 1 for similar reactions. With the larger ΔdON of 0.165 Å from the DFT-calculated ground state structures, this difference rises to 140-700 times.
The experimental results show that the CPET reactions of 1 and 2 are much more similar than this simple theoretical model would predict. Reactions 1 and 2 provide the simplest comparison, because they use similar triarylamminium oxidants and have driving forces that differ by only 38 ± 30 mV. The rate constants for these reactions differ by a factor of 1.9, much less than predicted by the weak-coupling tunneling model. More quantitatively, the 38 mV less favorable Erxn for reaction 2 corresponds to a difference in equilibrium constants of a factor of 4.4. Given the dependence of k on Keq discussed above (Figure 5), with a Brønsted α of 0.46, this difference in Keq's would predict a difference in rate constants of a factor of 2.0. The more detailed discussion below indicates that this remarkably close agreement with the observed factor of 1.9 is somewhat fortuitous, but the general conclusion is clear. Compounds 1 and 2 have very similar CPET reactivity. The same conclusion is evident from the reactions with iron(III) tris(diimine) oxidants (Figure S4). There are only subtle differences in the reactivity of the two phenols, despite the substantial difference in ground-state donor-acceptor distance.
These results contrast with those of a paper that appeared as the final version of this report was being submitted.23 That study concluded that intrinsic rates strongly correlate with distance. Its conclusions are based on crystallographic distances which, as shown above, can be misleading,47 and on comparisons of compounds with planar, conjugated (resonance assisted) hydrogen bonds with those of non-conjugated analogs. As we have presented previously,22 the different PCET rates between these classes of molecules is more likely due to differences in the hydrogen bonding, between these classes of molecules, as indicated by different OH⋯N stretching frequencies and 1H NMR chemical shifts, or possibly to differences in tunneling distances or donor-acceptor vibrations.32 The spectroscopic differences indicate different proton potential energy surfaces and vibrational wavefunctions, which play an important role in PCET as described below and in detail elsewhere.48
Variation of CPET rates with driving force
The CPET kinetics of reactions of 1 and 2 with 3a+-3e+ as a function of driving force show subtle but important differences (Figure 5). This dependence is best summarized by the Brønsted α, the slope of a line correlating ln k with ln Keq, or equivalently the changes in free energy barrier with changes in driving force ΔΔG*/ΔΔG°. The rate constants for oxidations of 1 + 3a+-3e+ have α(1) = 0.53(3), which is very near the value of ½ predicted by the Marcus equation (eqs 3, 4)49 in the limit of |ΔG°| ≪ 2 λ appropriate for these reactions.19b However, the reactions 2 + 3a+-3e+ show a more shallow dependence, α(2) = 0.38(3). For both 1 and 2, deuterium substitution leads to a decrease in α: α (1-d3) = 0.48 and α (2-d3) = 0.33. Differences in α for proteo and deutero analogues result in KIEs which increase with Erxn. An increase in KIE with driving force is also evident in the CPET reactions of a phenol-pyridine with two [Fe(R2bpy)3] 3+ oxidants.19b The rates of reactions 1 and 2 are similar because they fall in the range of Erxn where the two lines in Figure 5 cross. When Erxn = 0.31 V, the linear fits in that figure predict that 1 should react 8.5 times faster than 2. On the other hand, in reactions more endoergic than 1 and 2, reactions of 2 are predicted to have higher rate constants than comparable reactions of 1. The various effects of increased proton donor-acceptor distance on rates and isotope effects is thus much more complex than the simple models outlined above would predict.
| (3) |
| (4) |
The small α(2) = 0.38(3) and even smaller α (2-d3) = 0.33 are surprising both in light of the Marcus equation prediction and by comparison with the α ≅ ½ found for other phenol-amine oxidations (0.5319 for 1 and a (2-pyridylmethyl)phenol22,50 and 0.51 for phenol-imidazoles21). Equation 4 predicts that Brønsted plots such as Figure 5 should be curved, with α = ½ when |ΔG°| ≪ 2λ and decreasing as ΔG° approaches −2λ. Our analysis of the reactions of 1 + 3a+-3e+ using the adiabatic Marcus equation (eq 3 with κυ = 1011 M-1 s-1) yielded a large value of λ (1.5V), consistent with its α = 0.53. Savéant and co-workers have reinterpreted our variable temperature kinetic data for 1 using a linearized non-adiabatic model that assumes α = ½ and has a non-zero ΔS°CPET (and has poorer agreement with our data), obtaining λ = 0.79 ± 0.12 V.18b,51 While the latter value would predict some curvature in the Brønsted plot for 2, there is no indication of curvature over the experimental +0.08 to −0.43 V range of ΔG° (Figure 5). In addition, the rate constants with the highest driving force fall above the best fit line, rather than below as would be predicted by a smaller λ. In sum, the small α for the reactions of 2 is not due to the Marcus dependence of α on ΔG°/2λ.
Current theories of CPET go well beyond Marcus theory, for instance including pathways that give X–H vibrationally excited states in the product.8 Such pathways are more endoergic and therefore increase the value of α.52 Meyer and coworkers recently invoked this effect to explain their measured α of 0.6 for CPET oxidations of aqueous tyrosine, in which the driving force was varied by changing either the oxidant or buffer.53 Like Meyer's system, our computational studies (see below) indicate that vibrational excited states are more important for the product than the reactant, which should raise α above ½. This is therefore not the origin of the small α observed for the reactions of 2. Hammes-Schiffer recently attributed a value of α = 0.47 observed for proton-coupled electrochemical oxidation of an osmium(II) aquo complex54 to the increase in the proton donor-acceptor distance upon oxidation.55 While a similar analysis is beyond the scope of this study, gas-phase DFT calculations predict the dON in 1 and 2 will instead decrease, by 0.164 and 0.123 Å, upon oxidation. Thus, this analysis would also seem to predict α > ½ the opposite of the observed trend.
A change in α might also indicate a change in the nature of the classical transition structure in the reactions of 2.56,57 For example, if the transition structure involved mostly proton transfer with little electron transfer, the barrier would be less sensitive to the redox potential of the oxidant and α should be less than ½ when ΔG° is varied by changing the outersphere oxidant. This kind of asynchrony has been discussed by Lee, Kreevoy et al. in the context of hydride transfer reactions,58 and more generally by Bernasconi and others.56,57,59 It is not clear, however, why this would be favored with longer dON or with deuterium substitution. Still, this work and that of Meyer and others indicate that the value of α may provide valuable insight into the nature of the CPET processes and may serve as a benchmark for computational studies.16-18,53
Motion along the proton donor-acceptor coordinate
The role of ‘promoting’ or ‘gating’ vibrations in hydrogen transfer reactions – motions which compress the proton transfer distance and thereby facilitate the transfer – has received considerable attention in the literature.1,12-14,31,41 The energetics of such motion in compounds 1 and 2 has been examined computationally, using a series of partial geometry optimizations. In each gas-phase DFT calculation, dON was fixed and the positions of all of the other atoms were optimized, as described in the Experimental Section). The energies as a function of dON, as shown in Figure 6, are a slice through the multidimentional potential energy surface that describes the CPET reactions. This analysis ignores solvent effects and the presence of the oxidant, but these should be very similar for the two phenol-amines reacting with closely related oxidants.
Figure 6.
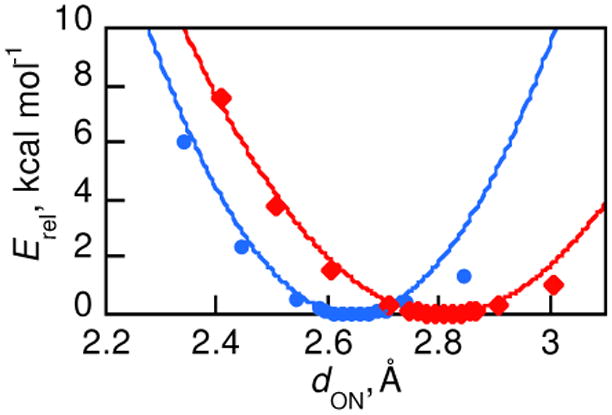
Relative potential energy for partially optimized structures of 1 (
 ) and 2 (
 ) with varied dON. Lines are parabolic fits of the points with dON ≤ dON(optimized).60
Parabolic fits of the points corresponding to compression along dON (Figure 6) give effective force constants of 148 and 92 kcal mol-1 Å-2 for 1 and 2, respectively.60 Fits to Morse potentials give smaller values in roughly the same ratio (76 and 53 kcal mol-1 Å-2). We were initially surprised that 2 is easier to compress along the dON coordinate because the bicyclic structure would appear more rigid. However, the dominant factor in determining the magnitude of this force constant appears to be O⋯N steric repulsion. Still, despite the difference in force constants, it is always more energetically costly for 2 to reach a compressed value of dON than it is for 1. To distort 2 to the calculated dON of ground state 1 requires 1.2 kcal mol-1 and to reduce its dON an additional 0.1 Å requires an additional 1.3 kcal mol-1. In a model in which 1 and 2 have to reach the same value of dON to undergo CPET, these energies imply that 2 would react one or two orders of magnitude slower than 1. This simple calculation applies both to a classical over-the-barrier model and to a proton tunneling model, but only if all of the other parameters important to CPET are equal for 1 and 2. In sum, the similarity of their CPET reactivity of 1 and 2 does not follow in a straightforward manner from ground state dON and changes in the donor-acceptor motions.
A deeper look: Proton vibrational wavefunctions
In the multistate continuum theory for PCET developed by Hammes-Schiffer and co-workers, one set of significant kinetic parameters are the overlaps of reactant and product vibrational wavefunctions (Franck-Condon factors). As part of a more extensive study,48 we have calculated these wavefunctions (with certain assumptions) for 1 and 2, as shown in Figure 7. Multistate continuum theory is conceptually related to Marcus theory, in which the non-transferring atoms and solvent reorganize to a surface crossing point where the electron/proton tunneling occurs. Our calculations fixed all of the atoms at a structure halfway between the phenol and the product radical cation, termed the TS geometry, then determined the energy as a function of proton position between the O and the N. The derived surface was fitted to a sixth-order polynomial, which was used to derive the proton wavefunctions (see Experimental Section).
The neutral phenols at the TS geometry have a single-well, distorted harmonic potential for the proton bound to the phenol oxygen (Figure 7, bottom). The zwitterionic form with the proton bound to the nitrogen, −OAr–NH3+, is high in energy, >15 kcal mol-1 for both compounds 1 (left) and 2 (right). In contrast, the distonic radical cations 1•+ and 2•+ have the proton potential energy surfaces at the TS geometry that are double minima (top plots). The ground vibrational states (blue lines) are localized on the nitrogen, on the right, but the first excited states (red) have more O–H bond character. The bicyclic compound 2•+ has an especially pronounced double minimum due to its longer O–N distance, and the v = 1 state is almost fully localized at oxygen. The Franck-Condon overlap between the ground v = 0 state in 2 and the v = 1 state in 2•+ is almost unity, S0,12 = 〈ϕ0(2)|ϕ1(2•+)〉2 = 0.90. In addition, this first vibrational excited state is calculated to be only 1.3 kcal mol-1 or 450 cm-1 above the ground state, so the energetic cost to access this state is small. For compound 1 at its TS geometry, the first excited state is two times higher (935 cm-1) and the overlap is smaller, S0,12 = 0.54.
This vibrational analysis suggests a possible explanation for the similarity of the CPET reactions of compounds 1 and 2. The higher classical barrier for CPET in 2 due to the longer distance could be balanced by the facility of reaction from the v = 0 state in 2 to the v = 1 state in 2•+, ϕ0(2) →ϕ1(2•+). This is more facile for 2 because the longer distance makes the ϕ1(2•+) lower in energy and more localized on the oxygen. However, structures with smaller dON probably contribute significantly to the rate constants, and a complete study including the vibrational overlaps for structures with a range of O⋯N distances will be required to indicate if these trends are indeed key factors in the kinetics of 1 and 2.
Vibrational excited states should be even more important in deuterium transfers, so this analysis also provides a qualitative rationalization for the counterintuitive lower KIEs for compound 2. While the magnitude of the KIE differences vary with driving force, the trend remains unchanged, KIE(1) > KIE(2). This is opposite to the prediction of a simple tunneling model, in which the X–D vibrational wavefunctions penetrate less into the forbidden region so that at longer distances tunneling is less favored and KIEs are larger. As Hammes-Schiffer et al. state in their analysis of KIEs for CPET reactions, “typically the KIE will increase with increasing equilibrium proton donor-acceptor distance if all other parameters remain fixed.”40 That study shows, however, that there are a number of situations where an inverse relationship of KIE and PT distance can occur, for instance when the species with a longer distance has a lower frequency for the vibration along the proton donor-acceptor coordinate.40 Experimental support for this case has been provided by high pressure stopped flow and site directed mutagenesis studies on hydride transfer reactivity of morphinone reductase by Scrutton and coworkers.14c,d For the phenols presented here, the effective frequency of this motion is lower in 2 than in 1 (Figure 6), so this effect could also be a cause of the decreased KIEs observed in reactions of 2.
The involvement of vibrational excited states and the differences in effective dON vibrational frequencies are likely to also be the origins of the unusual effects of driving force on the reactions of 1 and 2. For instance, the KIEs increase with ΔG°CPET, in contrast with the semiclassical prediction that the KIE should be a maximum at ΔGreaction = 0. Reactions of 2 show an unusually shallow dependence of rate constant on driving force, with the Brønsted α [Δln(k)Δln(Keq)] = 0.38(3). The reactions of deuterated 2 show an even lower α of 0.33. These values are significantly below the typical α = ½ found for 1 and related phenol-base compounds.19,21,22,35b As discussed above, the deviation of α from ½ does not come from the parabolic dependence of rate on driving force from the Marcus equation (eq 4). It must instead come from a more subtle dependence of other vibrational and quantum coupling factors, unique to CPET, on ΔG°CPET.
Conclusions
This study compares CPET oxidations of two closely related phenol-amines, phenol-amine 1 and bicyclic amino-indanol 2, in which the proton donor-acceptor distance varies by roughly 0.15 Å. The difference in distances is shown to be more accurately determined by computational studies rather than crystallographic results, because of the effects of crystal packing on the low-frequency donor-acceptor mode. These results provide valuable new test cases for the development of theory, which in turn, will guide new experiments and the interpretation of kinetic and structural chemical and biochemical data.
In contrast with the results of both classical and simple tunneling models, the kinetic effects of the different donor-acceptor distances in 1 and 2 are small. For reactions with similar oxidants when ΔG°CPET is near zero, the rate constants for 1 and 2 are very similar, within a factor of ca. 2. The H/D kinetic isotope effects for the reactions of 2, with the longer proton-transfer distance, are smaller than those observed for 1, and increase with increasing ΔG°CPET. Reactions of 2 and 2-d3 show an unusually shallow dependence of rate on driving force, with Brønsted α [Δln(k)/Δln(Keq)] values of 0.38(3) and 0.33, respectively. These results contrast with the conclusions of a very recent report, that phenol-amine compounds with (crystallographically) shorter, conjugated hydrogen bonds react faster than those with non-conjugated H-bonds.23 Future studies will to determine whether that conclusion is biased by comparing compounds with conjugated vs. non-conjugated hydrogen bonds (as suggested by earlier studies22,31) or whether the phenol-amine compounds 1 and 2 compared here are atypical for some reason.
Classical, over-the-barrier models predict much slower rates for 2 due to the larger barrier to proton transfer at larger distances and to the larger energetic costs to reach shorter proton donor-acceptor distances. First-order tunneling models also predict slower rates and higher kinetic isotope effects for 2 because of the longer tunneling distance. Simple tunneling models assume (1) tunneling from v = 0 in the reactant to v = 0 in the product, (2) small overlap between the vibrational wavefunctions, and (3) Morse-like potentials for the protons. The vibrational analysis summarized in Figure 7 shows that none of these three assumptions hold for 1 and 2. Simple tunneling models are not appropriate for strongly hydrogen-bonded systems such as these because the proton potential surfaces are highly anharmonic and often exhibit double minima. The surfaces also change substantially at shorter donor-acceptor distances,61 structures which often contribute significantly to the CPET rate constant.62
The experimental and computational comparison of 1 and 2 indicates that changing the proton-donor acceptor distance in hydrogen bonded systems affects multiple parameters that are important to CPET. Changing the distance strongly affects the shape of the proton potential energy surface and therefore the vibrational overlaps involving vibronic excited states. Compounds with a longer donor-acceptor distance are also likely to have lower effective force constants for distortion along this coordinate. These effects are not evident from simple tunneling models and illustrate the complexity of CPET processes.
Experimental Section
General considerations
Unless otherwise noted, reagents were purchased from the Aldrich, solvents from Fischer, and deuterated solvents from Cambridge Isotope. MeCN was used as obtained from Burdick and Jackson (low-water brand) and stored in an argon-pressurized stainless steel drum plumbed directly into a glove box. CD3CN was dried by stirring over CaH2 overnight, then distilled onto P2O5, followed by another distillation from CaH2 and stored in a glove box. Ammonium acetate was dissolved in methanol and evaporated to dryness (×3) and the residue was dried in vacuo at 40 °C for 24 h. nBu4NPF6 was recrystallized three times from EtOH and dried in vacuo for two days at 110° C prior to use. The iron-bipyridyl and phenanthroline complexes were synthesized according to literature procedures63 and were used as PF6− salts. Triarylamminium salts were prepared from the corresponding amines as described previously.19b 1H NMR and 13C NMR spectra were recorded on Bruker AV300, AV301, DRX499 or AV500 spectrometers at ambient temperatures; chemical shifts are reported relative to TMS in ppm by referencing to the residual solvent signals. The UV-vis spectra were obtained on a Hewlett Packard 8453 diode array spectrophotometer. Infrared spectra (Figure 2) were obtained from KBr pellets on a Bruker Vector 33. Mass spectrometry was performed on a Kratos Profile HV-3 direct inlet, electron impact mass spectrometer.
Calculations
Unless stated otherwise all calculations were performed using Gaussian 03.64 In these computational studies, tert-butyl groups were replaced by CH3. Geometry optimizations, IR frequency calculations and potential energy scans of the ON coordinate utilized B3LYP/6-31G(d,p) level of theory. Calculation of the proton transfer surfaces utilized the (U)B3LYP functional with 6-31G(d) basis set used for all atoms with the exception of the transferring proton, for which a set of p polarization functions were included, i.e. 6-31G(d,p). All calculations were performed in the gas phase. PCM models of MeCN solvent with ε = εop appear to have relatively minor effects on the shape of the hydrogen bond potentials for the neutral and cation. Proton vibrational energy levels and wavefunctions were calculated numerically for these one-dimensional potential energy wells using a basis set of 200 harmonic oscillator functions.65
Synthesis
1-Amino-4,6-di-tert-butyl-7-hydroxyindan (2)
tert-Butanol (4 mL) was added to a stirred solution of 1-amino-7-hydroxyindan hydrochloride24,25 (0.409 g, 2.28 mmol) and urea (0.398 g) in 75% H2SO4 (aq). Beige solids formed as the reaction mixture was stirred at ambient temperatures for 52 h. Ice (15 g) was added and the suspension was filtered while cold. The solids were washed with cold water (15 ml) and dried thoroughly in vacuo. The residue was suspended in 15% aqueous methanol and the pH was adjusted to 9 with the addition of NaOH(aq). This solution was extracted with methylene chloride (3 × 30 mL) and the combined organic layers were washed with water and brine, then dried over MgSO4. Removal of solvent on the rotary evaporator gave a beige solid (0.55 g). Recrystallization from boiling hexanes gave 2 as a pale yellow crystalline solid (0.348 g, 61%). 1H NMR (CD3CN) (using IUPAC indan numbering): 1.30 (9 H, s, C(CH3)3), 1.37 (9 H, s, C(CH3)3), 1.60 (1 H, m, 2-H), 2.10 (2 H, br, NH2), 2.46 (1 H, m, 2-H), 2.74 (1 H, m, 3-H), 3.10 (1 H, m, 3-H), 4.36 (1 H, m, 1-H), 7.08 (1 H, s, 5-H), 11.14 (1 H, br, OH). MS (m/z): 261 (M+). The rate constant for OH/NH2 exchange was determined from the EXSY spectra using the relation: k = tm-1 ln (r + 1 / r – 1), where tm is the mixing time and the term r is related the intensity of the cross and diagonal peaks (IAB, IAA, and IBB), r = 4XAXB(IAA + IBB)/2IAB – (XA – XB)2, where X is the mole fraction population of a given site.66 No correction for an NOE was made.
Cyclic voltammetry
Cyclic voltammograms were taken on an E2 Epsilon electrochemical analyzer (Bioanalytical Systems) at ca. 5 mM substrate in anaerobic 0.1 M nBu4NPF6 acetonitrile solution. The electrodes were as follows: working, Pt disc; auxiliary, platinum wire; and reference, Ag/AgNO3 (0.01 M) in electrolyte solution. The working electrode was polished with alumina, then rinsed with water, dilute HNO3(aq), water, and ethanol following each scan. All potentials are reported vs. a Cp2Fe+/0 internal standard.
Kinetics
Kinetics experiments were performed using an OLIS RSM-1000 stopped-flow in anaerobic MeCN. The data were analyzed with SpecFit™ global analysis software.67 For the reaction of 2 + 3e+ rates were also obtained by fitting the absorbance at a single wavelength using Microsoft Excel as was done for the reaction of 1 + 3e+.19 The rates obtained via these two methods were the same within error. Kinetics were fit to pseudo-first order, second order, or opposing second order kinetics as appropriate. Kinetics for the reactions utilizing iron(III) oxidants were obtained at 0.1 M nBu4NPF6 as the potentials for these compounds vary with ionic strength due to ion pairing.68 Typical conditions used for reactions 1 and 2 were [3]i ≈ 1.5 × 10⁻⁵ M and 4 - 40 equivalents of 2 or 3 – 30 equivalents of 1.
The variation of the optical extinction coefficients (ε) with temperature of 3a+ and 3b+ was determined. Two solutions each of 3a+ and 3b+ were taken up in temperature from ca. 299 to 327 K and the absorbance at the λmax (718 nm for 3a+ and 748 nm for 3b+) were recorded at six temperatures. At each temperature, ε at λmax of the amminium was taken as the slope of the best fit line in plots of absorbance vs. [3], with the inclusion of zero as a point. For each amminium, the variation of ε (M-1 cm-1) vs. T (K) is linear. For 3a+: ε = −102 T +31300 (R2 = 0.998); for 3b+: ε = −103 T + 59400 (R2 = 0.994).
Crystal structure of 2
A colorless block 0.12 × 0.10 × 0.04 mm in size was mounted on a Cryoloop with Paratone oil. Data were collected in a nitrogen gas stream at 208(2) K using phi and omega scans. Crystal-to-detector distance was 60 mm and exposure time was 30 seconds per frame using a scan width of 0.5°. Data collection was 99.7% complete to 25.00° in θ. A total of 19339 reflections were collected covering the indices, −11 ≤ h ≤ 10, −11 ≤ k ≤ 14, −32 ≤ l ≤ 31. 2794 reflections were found to be symmetry independent, with an Rint of 0.1033. Indexing and unit cell refinement indicated a primitive, orthorhombic lattice. The space group was found to be Pbca (No. 61). The data were integrated using the Bruker SAINT software program and scaled using the SADABS software program. Solution by direct methods (SIR-2004) produced a complete heavy-atom phasing model consistent with the proposed structure. All non-hydrogen atoms were refined anisotropically by full-matrix least-squares (SHELXL-97). All hydrogen atoms, with the exception of the hydroxyl hydrogen H1, were placed using a riding model. Their positions were constrained relative to their parent atom using the appropriate HFIX command in SHELXL-97. The hydroxyl hydrogen H1 was located from the difference map and its position was refined isotropically.
Supplementary Material
Acknowledgments
We thank Dr. Antonio DiPasquale for the X-ray crystal determination, Drs. Abraham Nudelman and Yaacov Herzig for providing details on the preparation of 7-hydroxy-1-aminoindan, Drs. Eric Heatwole, Andri Arnaldsson, and Oleg Prezhdo for sharing their program to calculate vibrational wavefunctions from sixth-order polynomial surfaces, and Dr. Adam Tenderholt for comments on the manuscript and some additional computations. We are grateful to the U.S. National Institutes of Health (GM50422), and the University of Washington for support of this work.
Footnotes
Supporting Information Available. Complete citation for reference 64, 2-D EXSY spectrum, solution IR spectra of 1 and 1-d3, details on the spectrophotometric determination of equilibrium constants and the crystal structure of 2. This material is available free of charge at http://pubs.acs.org.
References
- 1.(a) Huynh MHV, Meyer TJ. Chem Rev. 2007;107:5004–5064. doi: 10.1021/cr0500030. [DOI] [PMC free article] [PubMed] [Google Scholar]; (b) Hammes-Schiffer S. Chem Rev. 2010;110:6937–6938. doi: 10.1021/cr100367q. Introduction to a special issue of Chem Rev on PCET. [DOI] [PubMed] [Google Scholar]; (c) Hodgkiss J, Rosenthal J, Nocera DG. In: Hydrogen-Transfer Reactions. Hynes JT, Klinman JP, Limbach HH, Schowen RL, editors. Wiley-VCH; Weinheim: 2006. pp. 503–562. [Google Scholar]; (d) Warren JJ, Tronic TA, Mayer JM. Chem Rev. 2010;110:6961–7001. doi: 10.1021/cr100085k. [DOI] [PMC free article] [PubMed] [Google Scholar]; (e) Costentin C. Chem Rev. 2008;108:2145–2179. doi: 10.1021/cr068065t. [DOI] [PubMed] [Google Scholar]
- 2.Pu J, Gao J, Truhlar DG. Chem Rev. 2006;106:3140–3169. doi: 10.1021/cr050308e. [DOI] [PMC free article] [PubMed] [Google Scholar]
- 3.Klinman JP. Biochim Biophys Acta. 2006;1757:981–987. doi: 10.1016/j.bbabio.2005.12.004. [DOI] [PubMed] [Google Scholar]
- 4.(a) Stubbe J, van der Donk WA. Chem Rev. 1998;98:705–762. doi: 10.1021/cr9400875. [DOI] [PubMed] [Google Scholar]; (b) Pesavento RP, van der Donk WA. Adv Protein Chem. 2001;58:317. doi: 10.1016/s0065-3233(01)58008-0. [DOI] [PubMed] [Google Scholar]
- 5.The term ‘CPET’ was coined in: Costentin C, Evans DH, Robert M, Savéant JM, Singh PS. J Am Chem Soc. 2005;127:12490–12491. doi: 10.1021/ja053911n.
- 6.(a) Marcus RA, Sutin N. Biochim Biophys Acta. 1985;811:265–322. [Google Scholar]; (b) Barbara PF, Meyer JT, Ratner MA. J Phys Chem. 1996;100:13148–13168. [Google Scholar]
- 7.cf., Mayer JM. Acc Chem Res. 2011;44:36–46. doi: 10.1021/ar100093z.Bonin J, Costentin C, Louault C, Robert M, Savéant JM. J Am Chem Soc. 2011;133:6668–6674. doi: 10.1021/ja110935c. references therein. Mayer JM. J Phys Chem Lett. 2011;2:1481–1489. doi: 10.1021/jz200021y.
- 8.(a) Hammes-Schiffer S. In: Hydrogen-Transfer Reactions. Hynes JT, Klinman JP, Limbach HH, Schowen RL, editors. Wiley-VCH; Weinheim: 2007. pp. 479–503. [Google Scholar]; (b) Hammes-Schiffer S, Alexei A, Stuchebrukhov AA. Chem Rev. 2010;110:6939–6960. doi: 10.1021/cr1001436. [DOI] [PMC free article] [PubMed] [Google Scholar]; (c) Marcus RA. J Phys Chem B. 2007;111:6643–6654. doi: 10.1021/jp071589s. [DOI] [PubMed] [Google Scholar]
- 9.Krishtalik LI. Biochim Biophys Acta. 2000;1458:6–27. doi: 10.1016/s0005-2728(00)00057-8. [DOI] [PubMed] [Google Scholar]
- 10.(a) Rickert KW, Klinman JP. Biochemistry. 1999;38:12218–12228. doi: 10.1021/bi990834y. [DOI] [PubMed] [Google Scholar]; (b) Liang ZX, Klinman JP. Curr Opin Struct Bio. 2004;14:648–655. doi: 10.1016/j.sbi.2004.10.008. [DOI] [PubMed] [Google Scholar]; (c) Lewis ER, Johansen E, Holman TR. J Am Chem Soc. 1999;121:1395–1396. [Google Scholar]; (d) Costas M, Mehn MP, Jensen MP, Que L. Chem Rev. 2004;104:939–986. doi: 10.1021/cr020628n. [DOI] [PubMed] [Google Scholar]
- 11.cf., Hatcher E, Soudackov AV, Hammes-Schiffer S. J Am Chem Soc. 2004;126:5763–5775. doi: 10.1021/ja039606o.Lehnert N, Solomon EI. J Biol Inorg Chem. 2003;8:294–305. doi: 10.1007/s00775-002-0415-6.Meyer MP, Klinman JP. J Am Chem Soc. 2011;133:430–439. doi: 10.1021/ja1050742.
- 12.(a) Knapp MJ, Klinman JP. J Am Chem Soc. 2002;124:3865–3874. doi: 10.1021/ja012205t. [DOI] [PubMed] [Google Scholar]; (b) Klinman JP. Phil Trans R Soc B. 2006;361:1323–1331. doi: 10.1098/rstb.2006.1870. [DOI] [PMC free article] [PubMed] [Google Scholar]; (c) Meyer MP, Klinman JP. J Am Chem Soc. 2011;133:430–439. doi: 10.1021/ja1050742. [DOI] [PMC free article] [PubMed] [Google Scholar]; (d) Meyer MP, Klinman JP. Chem Phys. 2005;319:283–296. doi: 10.1016/j.chemphys.2005.05.017. [DOI] [PMC free article] [PubMed] [Google Scholar]
- 13.(a) Hatcher E, Soudackov AV, Hammes-Schiffer S. J Am Chem Soc. 2004;126:5763–5775. doi: 10.1021/ja039606o. [DOI] [PubMed] [Google Scholar]; (b) Hatcher E, Soudackov AV, Hammes-Schiffer S. J Am Chem Soc. 2007;129:187–196. doi: 10.1021/ja0667211. [DOI] [PubMed] [Google Scholar]
- 14.cf., Masgrau L, Roujeinikova A, Johannissen LO, Hothi P, Basran J, Ranaghan KE, Mulholland A, Sutcliffe MJ, Scrutton NS, Leys D. Science. 2006;312:237. doi: 10.1126/science.1126002.Johannissen LO, Hay S, Scrutton NS, Sutcliffe MJ. J Phys Chem B. 2007;111:2631–2638. doi: 10.1021/jp066276w.Hay S, Sutcliffe MJ, Scrutton NS. Proc Natl Acad Sci U S A. 2007:104–507. doi: 10.1073/pnas.0608408104.Pudney CR, Johannissen LO, Sutcliffe MJ, Hay S, Scrutton NS. J Am Chem Soc. 2010;132:11329–11335. doi: 10.1021/ja1048048.Peters B. J Chem Theory Comput. 2010;6:1447–1454. doi: 10.1021/ct100051a.Benkovic SJ, Hammes-Schiffer S. Science. 2003;301:1196–1202. doi: 10.1126/science.1085515.
- 15.(a) Biczók L, Gupta N, Linschitz H. J Am Chem Soc. 1997;119:12601–12609. [Google Scholar]; (b) Gupta N, Linschitz H. J Am Chem Soc. 1997;119:6384–6391. [Google Scholar]
- 16.(a) Sjödin M, Styring S, Wolpher H, Xu Y, Sun L, Hammarström L. J Am Chem Soc. 2005;127:3855–3863. doi: 10.1021/ja044395o. [DOI] [PubMed] [Google Scholar]; (b) Sjödin M, Irebo T, Utlas TE, Lind J, Merényi G, Åkermark B, Hammarström L. J Am Chem Soc. 2006;128:13076–13083. doi: 10.1021/ja063264f. [DOI] [PubMed] [Google Scholar]; (c) Irebo T, Reece SY, Sjödin M, Nocera DG, Hammarström L. J Am Chem Soc. 2007;129:15462–15464. doi: 10.1021/ja073012u. [DOI] [PubMed] [Google Scholar]; (d) Irebo T, Johansson O, Hammarström L. J Am Chem Soc. 2008;130:9194–9195. doi: 10.1021/ja802076v. [DOI] [PubMed] [Google Scholar]; (e) Sjödin M, Styring S, Åkermark B, Sun L, Hammarström L. J Am Chem Soc. 2000;122:3932–3936. [Google Scholar]
- 17.Reece SY, Nocera DF. J Am Chem Soc. 2005;127:9448–9458. doi: 10.1021/ja0510360. [DOI] [PubMed] [Google Scholar]
- 18.Costentin C, Robert M, Savéant JM. J Am Chem Soc. 2006;128:8726–8727. doi: 10.1021/ja0621750.Costentin C, Robert M, Savéant JM. J Am Chem Soc. 2007;129:9953–9963. doi: 10.1021/ja071150d.Correction to reference 18b: Costentin C, Robert M, Savéant JM. J Am Chem Soc. 2010;132:2845. doi: 10.1021/ja103421f.Bonin J, Costentin C, Louault C, Robert M, Routier M, Savéant JM. Proc Nat Acad Sci USA. 2010;107:3367–3372. doi: 10.1073/pnas.0914693107.
- 19.(a) Rhile IJ, Mayer JM. J Am Chem Soc. 2004;126:12718–12719. doi: 10.1021/ja031583q. [DOI] [PubMed] [Google Scholar]; (b) Rhile IJ, Markle TF, Nagao H, DiPasquale AG, Lam OP, Lockwood MA, Rotter K, Mayer JM. J Am Chem Soc. 2006;128:6075–6088. doi: 10.1021/ja054167+. [DOI] [PMC free article] [PubMed] [Google Scholar]
- 20.Song N, Stanbury DM. Inorg Chem. 2008;47:11458–11460. doi: 10.1021/ic8015595. [DOI] [PubMed] [Google Scholar]
- 21.Markle TF, Rhile IJ, DiPasquale AG, Mayer JM. Proc Natl Acad Sci USA. 2008;105:8185–8190. doi: 10.1073/pnas.0708967105. [DOI] [PMC free article] [PubMed] [Google Scholar]
- 22.Markle TF, Mayer JM. Angew Chem Int Ed. 2008;47:738–740. doi: 10.1002/anie.200702486. [DOI] [PubMed] [Google Scholar]
- 23.Zhang MT, Irebo T, Johansson O, Hammarström L. J Am Chem Soc. 2011;133:13224–13227. doi: 10.1021/ja203483j. [DOI] [PubMed] [Google Scholar]
- 24.Oshiro Y, Sakurai Y, Tanaka T, Ueda H, Kikuchi T, Tottori K. J Med Chem. 1991;34:2004–2013. doi: 10.1021/jm00111a013. [DOI] [PubMed] [Google Scholar]
- 25.Herzig Y, Lerman L, Goldenberg W, Lerner D, Gottlieb HE, Nudelman A. J Org Chem. 2006;71:4130–4140. doi: 10.1021/jo052621m. [DOI] [PubMed] [Google Scholar]
- 26.Nevrekar NB, Sawardekar SR, Pandit TS, Kudav NA. Chem Ind. 1983:206–207. [Google Scholar]
- 27.The dON in 2 is comparable to that reported for a closely related 7-hydroxy-1-aminoindan derivative, 2.747 ± 13 Å (this is the average of two independent molecules in the unit cell). The structure for 1-amino-6-ehtyl-7-hydroxy-4-methyl-2-phenylindan reported in reference 24 is available at Cambridge Structural Database, reference code KOFNOI.
- 28.The calculated Mayer Bond orders for the bonds to Cα in 1 (the calculated Cα-gem-diemthyl analogue) and 2 are consistent with a small difference in hybridization: Cα–N: 0.913 (1) vs. 0.940 (2); Cα–NC2 0.946 (1) vs. 0.956 (2); Cα–Cβ: 1.003 (1) vs. 0.974 (2); Cα–C/H: 0.991 (1, Cα–CH3) vs. 0.935 (2, Cα–H).
- 29.Some of the complexity in structural studies of strong hydrogen bonds are evident in: Fontaine-Vive F, Johnson MR, Kearley GJ, Howard JAK, Parker SF. J Am Chem Soc. 2006;128:2963–2969. doi: 10.1021/ja0569712.
- 30.The optimized dON value for 1 with two phenyl groups on Cα (2.633 Å) is essentially identical to that of the simplified Cα-gem-dimethyl analogue (dON = 2.640 Å).
- 31.Johannissen LO, Irebo T, Sjödin M, Johansson O, Hammarström L. J Phys Chem B. 2009;113:16214–16225. doi: 10.1021/jp9048633. [DOI] [PubMed] [Google Scholar]
- 32.In ref. 31, Hammarström, et al noted that in two phenol-carboxylates which differ by a methylene unit, the donor-acceptor distance varied by 0.05 Å, however the difference in the proton tunneling distance was identical within 0.01 Å because the longer hydrogen bond was also more linear. This is likely true in other studies where the dON is varied by insertion of a methylene unit between phenol and base (i.e. refs. 22 and 23).
- 33.Bratos S, Leicknam JCl, Gallot G, Ratajczak H. In: Ultafast Hydrogen Bonding Dynamics and Proton Transfer Processes in the Condensed Phase. Elsaaesser T, Bakker HJ, editors. Kluwer Academic; Boston: 2002. pp. 5–30. [Google Scholar]
- 34.Jeffrey GA. An Introduction to Hydrogen Bonding. Oxford University Press; New York: 1997. pp. 220–225. [Google Scholar]
- 35.Harmonic vibrational analyses performed at B3LYP/6-31G(d,p) and corrected following Korth et al.35a predict vOH to be 193 cm-1 lower for 1 compared to 2 (3068 and 3261 cm-1, respectively). However, the O–H–N surfaces are highly anharmonic and the analysis of hydrogen bond vibrations is not straightforward, so this calculation would not be expected to give quantitative agreement Korth HG, de Heer MI, Mulder P. J Phys Chem A. 2002;106:8779–8789. v(OH)DFT,corr = [v(OH)DFT - 159.5] × 0.9904.Markle TF. PhD Thesis. University of Washington; 2009. Concerted Proton-Electron Transfer in the Oxidation of Hydrogen Bonded Phenol-Base Compounds. (c) Ref. 48a.
- 36.Rhile IJ, Mayer JM. Angew Chem Int Ed. 2005;44:1598–1599. doi: 10.1002/anie.200461977. [DOI] [PubMed] [Google Scholar]
- 37.In ref. 19b rates were determined for the reaction 1 + 3c+ with T = 279.6 – 327.0 K and fit to the Eyring equation yielding ΔH‡ = 6.3 ± 0.8 kcal mol-1 and ΔS‡ = −14.1 ± 2 eu. Fitting this same data to the Arrhenius equation gives Ea = 6.9 ± 0.8 kcal mol-1 and log A = 10.2 ± 0.6.
- 38.Bell RP. The Proton in Chemistry. 2nd. Cornell University Press; Ithaca: 1973. pp. 226–249. [Google Scholar]
- 39.Bell RP. The Tunnel Effect in Chemistry. Chapman and Hall; New York: 1980. pp. 77–105. [Google Scholar]
- 40.Edwards SE, Soudackov AV, Hammes-Schiffer S. J Phys Chem A. 2009;113:2117–2126. doi: 10.1021/jp809122y. [DOI] [PMC free article] [PubMed] [Google Scholar]
- 41.(a) Keifer PM, Hynes JT. J Phys Chem A. 2004;108:1179–11808. [Google Scholar]; (b) Keifer PM, Hynes JT. J Phys Chem A. 2004;108:11809–11818. [Google Scholar]
- 42.(a) Excluding 2-d3 + 3e+, the most downhill reaction, from the linear fit gives an excellent correlation, αD = 0.30(3), R2 = 0.997. Extrapolating this line predicts a KIE of ∼10 for the 2 + 3e+ reaction.; (b) Because the 2 + 3e+ reaction is highly exoergic (Erxn = 0.43 V), the stepwise ET/PT pathway may compete with CPET, particularly for the reaction of 2-d3 since its KIE will disfavor CPET relative to simple ET. Estimates of the energetics suggest that outer-sphere ET from 2 to 3e+ to yield the phenol radical cation (+•HOAr-B) is a possible if somewhat unlikely initial step.42c,35b If this pathway is contributing in the deuterium case, it would lead to a higher than expected kD and decreased KIE.; (c) The ΔG°ET involves the redox potential of for outer-sphere electron removal from 2 without proton motion, which is not experimentally accessible. This potential is estimated to be close to that of tri-tert-butylphenol, ∼1.09 V,19b which makes ΔG°ET ≅ –0.42 V.
- 43.The reaction barrier cannot be smaller than the ΔG°. The reactions may not be well described by the Eyring equation, for instance because non-adiabatic effects will reduce the pre-factor below kBT/h, but ΔG‡ is a lower limit to the actual barrier height.
- 44.As noted, α for the reactions of 2 + 3+ is significantly lower than ½, this is further evidence against the ET/PT mechanism.
- 45.Kuznetsov AM, Ulstrup J. Can J Chem. 1999;77:1085–1096. [Google Scholar]
- 46.Nagel ZD, Klinman JP. Nature Chem Biol. 2009;5:543–550. doi: 10.1038/nchembio.204. [DOI] [PubMed] [Google Scholar]
- 47.For instance, one of the compounds discussed in reference 23, a conjugated phenol-benzimidazole, has four independent molecules in two crystal structures, with dON values that vary by 0.075 Å (2.533(3)–2.6087(19)).21,47a Also in ref. 23, the structure of the phenol-CH2-benzimidazole appears to have an unusual geometry for the key O-H•••N hydrogen bond due to an additional intermolecular N•••H-N hydrogen bonding interaction; this points the basic nitrogen somewhat away from the phenolic OH leading to a longer apparent dON. Benisvy L, Bill E, Blake AJ, Collison D, Davies ES, Garner CD, McArdle G, McInnes EJL, McMaster J, Ross SHK, Wilson C. Dalton Trans. 2006:258–267. doi: 10.1039/b513221p.
- 48.Markle TF, Tenderholt AL, Mayer JM. manuscript in preparation. [Google Scholar]; (b) Reference 35b, Chapter 4.; (c) As described in these reports, the proton potential energy surfaces are highly anharmonic and vary substantially between different classes of molecules and with proton donor-acceptor distance, suggesting that the vibrational coupling terms will not simply follow a exponential dependence.
- 49.Reference 6. ΔG* is the free energy barrier, λ is the intrinsic barrier, κ is the transmission coefficient, and v is a generalized frequency factor (typically ∼1013 s-1, kBT/h in the Eyring equation).
- 50.Recasting the data found in ref. 22 as ln k vs. ln Keq gives a linear plot with a slope = 0.53 and R2 = 0.992.
- 51.When lnk correlates linearly with ΔG° for a set of reactions, as observed here, it is not possible to directly determine both λ and κυ. The Savéant derivation of λ requires a number of simplifications and external calculations. The linearization of the Marcus equation which requires α = ½ is clear in eq 24 of reference 18b.
- 52.When pathways involving vibrational excited states are important, ΔG° in eq 3 becomes ΔG° + εre1,μv, where εre1,μv is the change in ΔG° for a pathway from vibronic states μ to v.8 It then follows that ∂ΔG*/∂ΔG°=½ + (ΔG° + εre1,μv)/2 λ.
- 53.Fecenko CJ, Thorp HH, Meyer TJ. J Am Chem Soc. 2007;129:15098–10599. doi: 10.1021/ja072558d. [DOI] [PubMed] [Google Scholar]
- 54.Madhiri N, Finklea HO. Langmuir. 2006;22:10643–10651. doi: 10.1021/la061103j. [DOI] [PubMed] [Google Scholar]
- 55.Ludlow MK, Soudackov AV, Hammes-Schiffer S. J Am Chem Soc. 2010;132:1234–1235. doi: 10.1021/ja910277p. [DOI] [PubMed] [Google Scholar]
- 56.Jencks WP. Chem Rev. 1985;85:511–527. and references therein. [Google Scholar]
- 57.Williams IH. In: Hydrogen-Transfer Reactions. Hynes JT, Klinman JP, Limbach HH, Schowen RL, editors. Wiley-VCH; Weinheim: 2006. pp. 583–602. [Google Scholar]
- 58.Lee ISH, Chow KH, Kreevoy MM. J Am Chem Soc. 2002;124:7755–7761. doi: 10.1021/ja011855u. [DOI] [PubMed] [Google Scholar]
- 59.Bernasconi CF. J Phys Org Chem. 2004;17:951–956. [Google Scholar]
- 60.The parabolic and Morse potential fits only used the energies from structures with dON < dON (optimized) because structures with longer dON distorted torsionally in a way that is not related to the energy to simply distort along dON, and that is not related to the CPET process.
- 61.See for example: Doslic N, Kühn O. Zeit Phys Chem. 2003;217:1507–1524.Jezierska A, Panek JJ, Koll A, Mavri J. J Chem Phys. 2007;126:205–101. doi: 10.1063/1.2736692.
- 62.Hammes-Schiffer S. Acc Chem Res. 2006;39:93–100. doi: 10.1021/ar040199a. [DOI] [PubMed] [Google Scholar]
- 63.DeSimone RE, Drago RS. J Am Chem Soc. 1970;92:2343–2352. [Google Scholar]
- 64.Frisch MJ, et al. Gaussian 03, Revision D.02. Gaussian, Inc.; Wallingford CT: 2004. For complete citation see Supporting Information. [Google Scholar]
- 65.Using code generously provided by Heatwole E, Arnaldsson A, Prezhdo O. unpublished work.
- 66.Perrin CL, Dwyer TJ. Chem Rev. 1990;90:935–967. [Google Scholar]
- 67.Binstead RA, Zuberbühler AD, Jung B. Specfit™, version 3.0.36 (32-bit Windows) Spectrum Software Associates; Chapel Hill, NC: 2004. [Google Scholar]
- 68.(a) Noel M, Vasu KI. Cyclic Voltammetry and the Frontiers of Electrochemistry. Aspect; London: 1990. pp. 141–143. [Google Scholar]; (b) Braga TG, Wahl AC. J Phys Chem. 1985;89:5822–5828. [Google Scholar]; (c) Chan MS, Wahl AC. J Phys Chem. 1978;82:2542–2549. [Google Scholar]
Associated Data
This section collects any data citations, data availability statements, or supplementary materials included in this article.