Abstract
Purpurinimide methyl esters, bearing variable lengths of N-substitutions, were conjugated individually to a cyanine dye with a carboxylic acid functionality. The results obtained from in vitro and in vivo studies showed a significant impact of the linkers joining the phototherapeutic and fluorescence imaging moieties. The photosensitizer-fluorophore conjugate with a PEG linker showed the highest uptake in the liver, whereas the conjugate linked with two carbon units showed excellent tumor-imaging and PDT efficacy at 24 h postinjection. Whole body imaging and biodistribution studies at variable time points portrayed enhanced fluorescent uptake of the conjugates in the tumor compared to the skin. Interestingly the conjugate with the shortest linker and the one joining with two carbon units showed faster clearance from normal organs e. g., liver, kidney, spleen, lung compared to tumors. Both imaging and PDT efficacy of the conjugates were performed in BALB/c mice bearing Colon26 tumors. Compared to the others, the short linker conjugate showed poor tumor fluorescent properties and as a corollary does not exhibit the dual functionality of the photosensitizer-fluorophore conjugate. For this reason, it was not evaluated for in vivo PDT efficacy. However, in Colon26 tumor cells (in vitro), the short linker was highly effective. Among the conjugates with variable linkers, the rate of energy transfer from the purpurinimide moiety to the cyanine moiety increased with deceasing linker length, as examined by femtosecond laser flash photolysis measurements. No electron transfer from the purpurinimide moiety to the singlet excited state of the cyanine moiety or from the singlet excited state of the cyanine moiety to the purpurinimide moiety occurred as indicated by a comparison of transient absorption spectra with spectra of the one-electron oxidized and one-electron reduced species of the conjugate obtained by spectroelectrochemical measurements.
Introduction
Current treatment modalities for patients afflicted by cancer include surgery, radiation therapy, chemotherapy and a relatively novel option called photodynamic therapy (PDT)1–5. Surgery is used to excise abnormal growths and surrounding tissue, but the procedure is invasive and may be complicated by relapse of the cancer if not all of the tumor cells are removed. Chemotherapy employs different cytotoxic chemicals to attack or block specific cellular and molecular mechanisms that aid tumor growth. Unfortunately patients on chemotherapeutics suffer from side effects due to adverse drug toxicities. Radiation uses ionizing energy to attack neoplastic cells but it is non-specific, and may cause damage to surrounding healthy tissue which can lead to the occurrence of secondary cancers. PDT uses a drug known as a photosensitizer, light and oxygen to destroy tumors and their surrounding vasculature. PDT has several advantages in that (i) there is no systemic, organ or tissue toxicity, (ii) it is non-invasive and (iii) it can be used repeatedly as a primary or adjuvant treatment6–9. With the current advent of imaging technologies to monitor tumor responses to treatment, we have shown that the utilization of a certain photosensitizer-cyanine dye conjugate which contains the tumor-avid photosensitizer 3-(1’-hexyloxyethyl)-pyropheophorbide-a (HPPH) for treatment and a fluorophore cyanine dye for optical imaging could be highly advantageous to treat deeply seated tumors and monitor the treatment response10. The ability to image real time events using fluorescence has made optical imaging an attractive modality to study cellular and molecular events11 and to visualize events in vivo, especially in tumors12. Non-invasive in nature, optical imaging instruments are simpler and less expensive to operate and can allow precise assessment of the location and size of a tumor, providing information on its invasiveness in adjacent tissue13,14. The work discussed herein describes the synthesis, molecular modeling, photophysical, electrochemical, tumor-imaging and phototherapeutic potential of a series of longer wavelength photosensitizer (purpurinimides, 700 nm) joined to a cyanine dye with variable length of linkers. Among the near-infrared (NIR) dyes, cyanine dyes in general have shown enormous potential for optical imaging15–19.
Results and Discussion
A. Chemistry
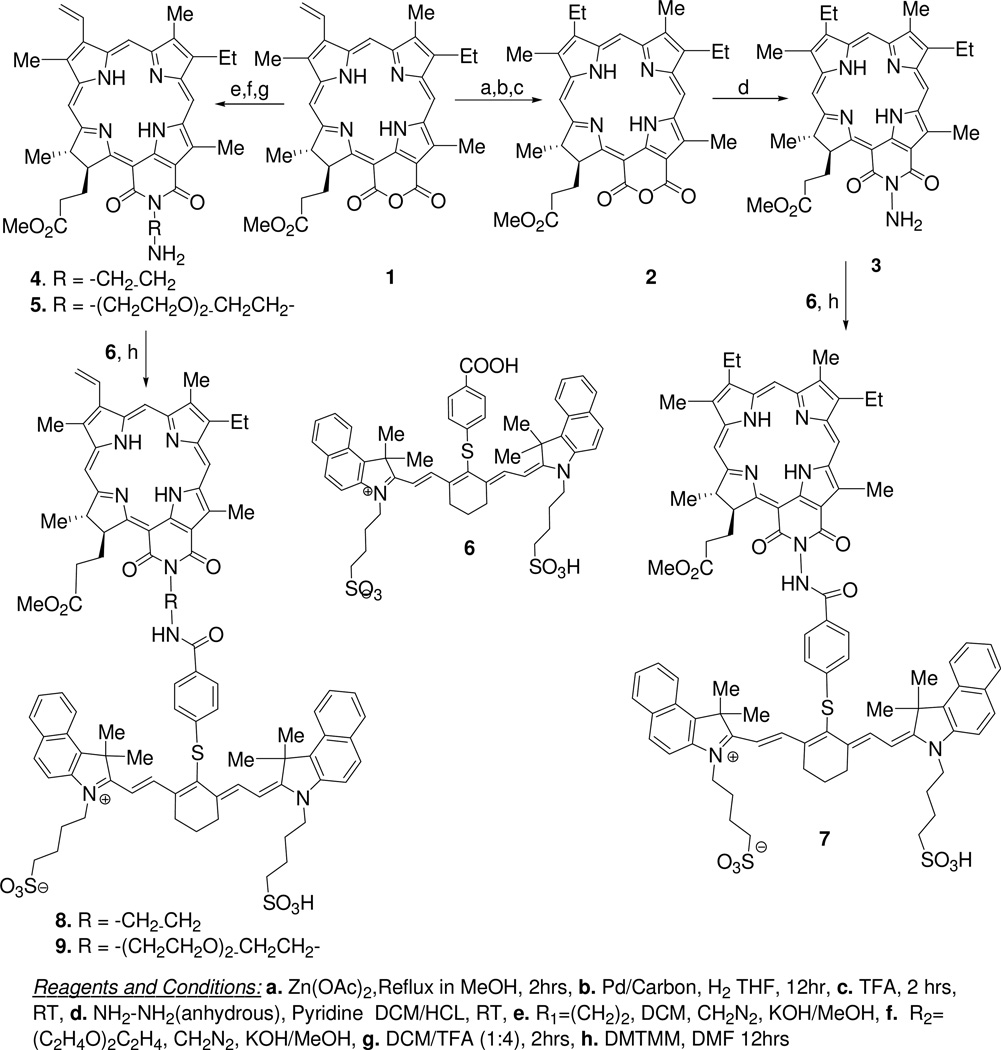
For the synthesis of purpurinimide-N-substituted cyanine dye conjugates, purpurin-18 methyl ester 1 was synthesized from chlorophyll-a by following the literature procedure, which was converted into mesopurpurin-18 methyl ester 2 by following the standard methodology20. Reaction of 2 with hydrazine hydrate gave N-amino mesopurpurin-18 methyl ester 3 in 50% yield21. By following a similar approach 1 was individually reacted with diethyl diamine and carbamic acid to produce the corresponding N-substituted analogs 4 and 5 both with 89% yield. Reaction of these N-substituted purpurin-18 methyl ester with a cyanine dye 6 containing a carboxylic acid functionality (obtained in 80% yield by reacting commercially available IR820 with p-thiol-benzoic acid gave purpurinimide-cyanine dye conjugates 7–9 in which two chromophores (photosensitizer and fluorophore) are joined at variable linker lengths with yields ranging from 32 to 37%. The reaction sequences for the preparation of the conjugates and the cyanine dyes are shown in Schemes 1 and 2.
Scheme 1.
Synthesis of purpurinimide-cyanine dye conjugates joined with variable length of linkers.
Scheme 2.
Preparation of a cyanine dye with carboxylic acid functionality.
Structures of the intermediates and the final products were confirmed by 1H NMR and CHN/mass spectrometry (including HRMS) analysis. The purity of the final conjugates (compounds 7–9) was determined by HPLC analysis.
B. Molecular Modeling
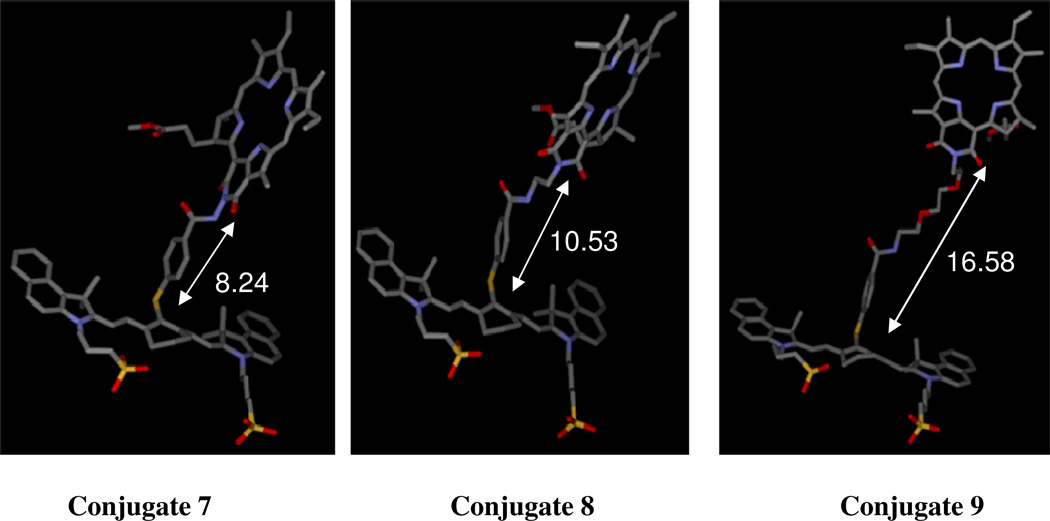
In order to examine the effects of linker lengths joining the two chromophores (conjugates 7, 8 and 9) in photophysical, electrochemical, tumor-imaging and photodynamic efficacy, a molecular modeling study was performed. The three dimensional model of the conjugates were built with the molecular modeling software SYBYL (Tripos Inc., St. Louis, MO) followed by the energy minimization with the PM3 semi-empirical molecular orbital theory using the Spartan 02 software package (Wave function Inc, Irvine, CA). Figure 1 shows the resulting structures of the conjugates 7, 8 and 9 (Scheme 1) in extended conformation. The distances between the nitrogen atom in the purpurinimide ring system and the sulfur atom adjacent to the cyanine dye of the conjugates were calculated and are displayed in Figure 1. As expected, the smaller the linker length, the shorter the observed distance between two chromophores.
Figure 1.
3D representation of the conjugates with different lengths between the cyanine dye and the purpurinimide in extended conformation obtained from molecular modeling and energy optimization with PM3.
Since the above structures are appropriate for single molecules in gas phase, they may not be relevant to the structures of the conjugates in solution, in cells or in vivo environments where physical properties and biological activities of these conjugates are examined. In order to gain some insights, the conformational flexibility of these conjugates were examined with the stochastic search module of MOE software using MMFFs force field and charges (Chemical Computing Group, Montreal, Quebec, Canada). Again, the distance between two chromophores was measured for some of the resulting low energy conformers as shown in Figure 2.
Figure 2.
a) Various conformers for conjugate 7 with limited flexibility in the linker are superimposed using purpurinimide ring as reference. Standard color for each atom type is used. The purpurinimide ring (shown in left portion of this figure) is exposed to surroundings. b) Examples of low energy conformer for conjugate 8. The purpurinimide moiety is shown in orange and the cyanine dye –thiophenol moiety in cyan, and the linker regions based on standard atom type based color. There are some overlaps between purpurinimide ring and cyanine dye ring. c) Example of low energy conformer for conjugate 9. The same color scheme as Fig 2b is used. Due to the flexibility of long linker, diverse conformations are possible and some of low energy conformer shows an extensive interaction between purpurinimide ring and cyanine dye – thiophenol moiety. Mean distance between the two moieties in a (conjugate 7) = 8.18 Å (stand. dev. 0.10); b (conjugate 8) = 8.55 Å (stand. dev. 0.51); and c (conjugate 9) = 9.85 Å (stand. dev. 2.27) respectively.
As can be seen from the Figure 2 caption, the distances between the two chromophores remain more or less constant for the conjugate 7 and 8 while it shows a large variation for the conjugate 9. It is reasonable considering the length of the linker for these conjugates. Although the mean distances are similar between conjugate 7 and 8, closer inspections reveal the significant difference between these conjugates. First, the standard deviation is much smaller for the conjugate 7 than 8, reflecting the limited flexibility of 7. Second, this limited flexibility is also the source for the limited range in the relative orientation of two chromophore for the conjugate 7 as shown in Figure 2a where various low energy conformers of the conjugate 7 are superimposed using the purpurinimide ring as a reference. It clearly shows that the cyanine dye and the linker can assume many different conformations but they cannot assume a conformation that brings two chromophores close together. Thus the purpurinimide ring remains exposed to its surroundings for this conjugate. Compared to the conjugate 7, some part of the purpurinimide ring is covered by the cyanine dye or thiophenol group in the conjugate 8, as shown in Figure 2b. Although there are a large variety of conformers for the conjugate 9, there are some conformers where a large portion of purpurinimide ring is covered by the cyanine dye and/or thiophenol group as shown in Figure 2c. Photophysical experiments clearly indicated that intramolecular energy transfer occurred from the singlet excited state of the purpurinimide moiety to the cyanine moiety with the rate of transfer increasing with decreasing linker distance. This is an opposite trend from the linker length dependence on the in vitro PDT efficacy. The photophysical results are consistent with the distance dependence of energy transfer while the conformational flexibility may explain the excellent in vitro PDT efficacy of the conjugate 7 and the decrease of efficacy with increasing linker length. If the purpurinimide rings are not exposed to the environment, the compound may not be able to produce singlet oxygen because it cannot interact with water molecules. Alternatively, even if singlet oxygen is produced, it may not reach to the cellular target, because the singlet oxygen produced may interact with the closely seated cyanine dye before it reaches the target site(s).
C. Photodynamics
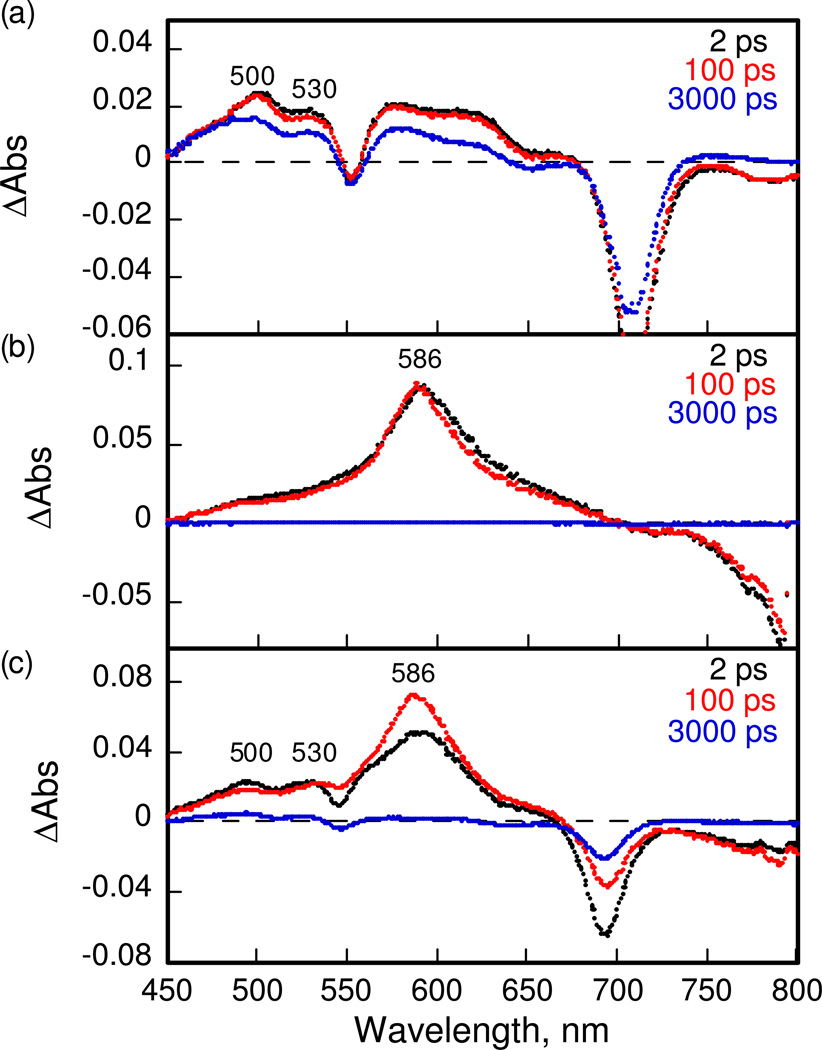
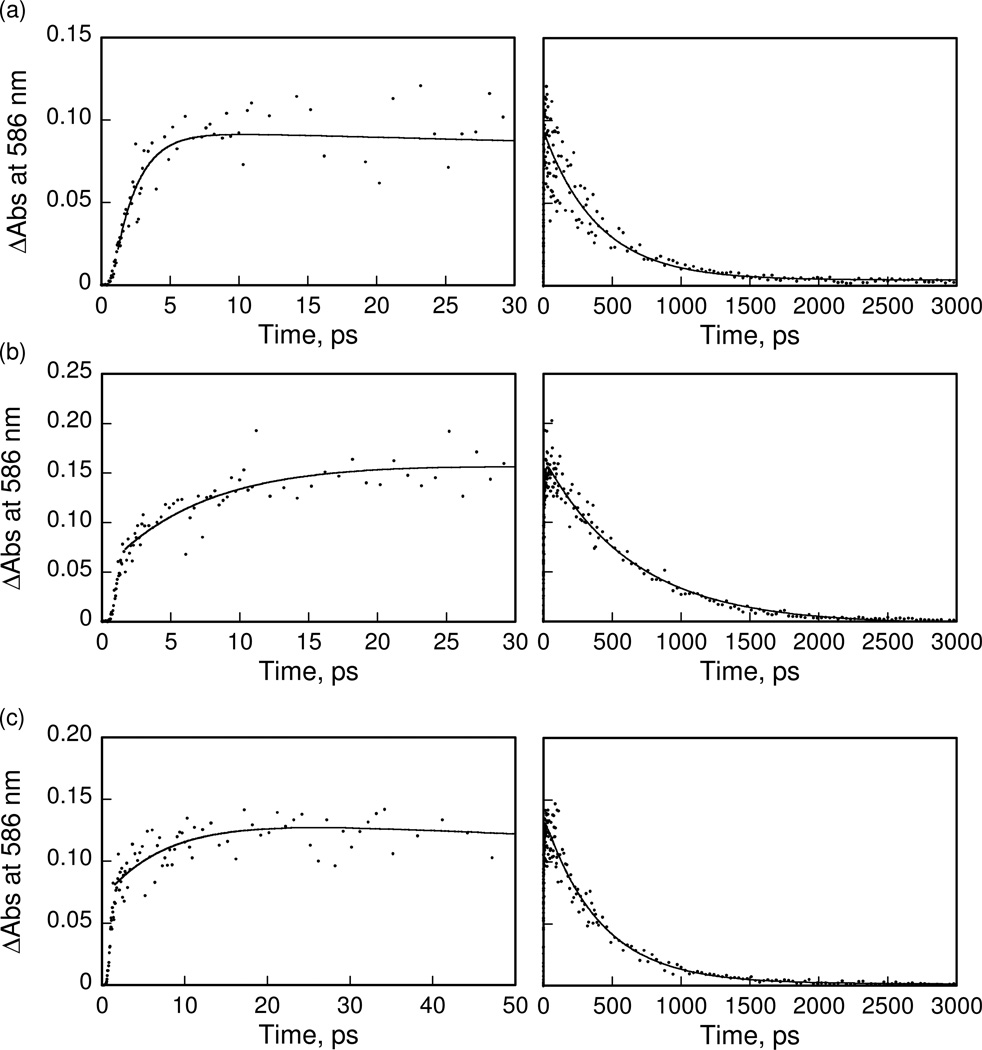
In order to examine the photodynamics of purpurinimide, cyanine and the conjugates, time-resolved transient absorption spectra were recorded by femtosecond laser flash photolysis in deaerated DMSO solutions as shown in Figure 3. Transient absorption bands of purpurinimide 4 observed at 500 and 530 nm taken at 2 ps after femtosecond laser excitation (Figure 3a) are assigned as the singlet excited state of 4 (14*). The transient absorption of 14* decreased as the absorption band of the triplet excited state of 4 appeared. The transient absorption band of the singlet excited state of cyanine 6 is observed at 586 nm as shown in Figure 3b. The lifetimes of the singlet excited state of 4 and 6 were determined from decays of the absorption at > 3 ns and 500 ps, respectively. In the case of the conjugate 7 shown in Figure 3c, the transient absorption bands due to the both singlet excited states of purpurinimide and cyanine were observed at 500, 530 and 586 nm at 2 ps because both moieties were excited by laser flash excitation at 410 nm. The absorption bands at 500 and 530 nm due to the singlet excited state of the purpurinimide moiety decreased, accompanied by an increase In the absorption band at 586 nm due to the singlet excited state of the cyanine moiety. This indicates that energy transfer from the singlet excited state of purpurinimide to the cyanine moiety occurs efficiently to afford the singlet excited state of cyanine. The energy transfer dynamics in 7 were determined from the rise of the absorption band at 586 nm as shown in the left panel of Figure 4a. The energy transfer rate constant was determined to be 6.7 × 10¹¹ s−1. Similarly, the energy transfer rate constants of conjugates 8 and 9 were also determined from the rise of absorption band at 586 nm in Figure 4b and 4c to be 1.4 × 10¹¹ and 1.3 × 10¹¹ s−1, respectively. The energy transfer rate constant increases with decreasing distance between the energy donor and acceptor estimated from the theoretical calculations (vide supra). The decay time profiles at 586 nm are shown in the right side of Figure 4. The decay rate constants of 7–9 agree well with the value of the cyanine reference 6 due to intersystem crossing to the triplet excited state. An energy transfer from the singlet excited state of the purpurinimide moiety to the cyanine moiety is feasible because the singlet energy of the purpurinimide (1.76 eV) is higher than that of the cyanine (1.41 eV) which were obtained from the absorption and fluorescence maxima, λabs = 689 nm, λfl = 720 nm for 4 and λabs = 849 nm, λfl = 915 nm for 6, respectively. Thus, in the purpurinimide-cyanine systems, intramolecular energy transfer at the singlet excited state occurs efficiently from the purpurinimide moiety to the cyanine moiety, followed by intersystem crossing to the triplet excited state of the cyanine moiety. No electron transfer from the purpurinimide moiety to the cyanine moiety was observed as expected from the disfavored energetics as indicated by the redox potentials of the conjugates (vide infra).
Figure 3.
Transient absorption spectra of purpurinimide 4, cyanine 6 and the conjugate 7 in deaerated DMSO taken at 2, 100 and 3000 ps after femtosecond laser flash excitation at 410 nm.
Figure 4.
Rise and decay time profiles of the absorbance at 586 nm of (a) 7, (b) 8 and (c) 9 in deaerated DMSO after femtosecond laser excitation at 410 nm. Left panels: short time range. Right panels: long time range.
D. Electrochemical Properties
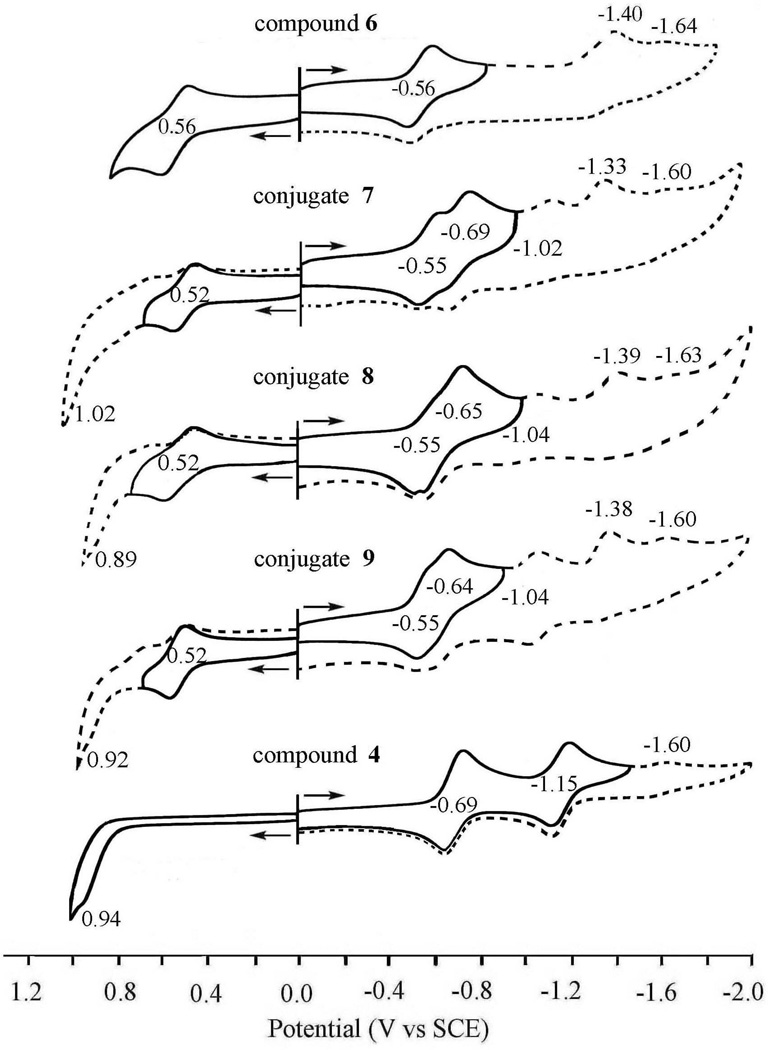
Cyclic voltamograms of 7–9 are illustrated in Figure 5 which also includes the reference compounds 4 and 6. The first one-electron oxidation potentials of 7–9 (Eox) are all located at E1/2 = 0.52 V vs SCE, which is similar to the Eox value of purpurinimide 4 (0.56 V vs SCE). The first one-electron reduction potentials of 7–9 (Ered1) are also identical at E1/2 = −0.55 V vs SCE, which agrees with the Ered1 value of cyanine 6 (−0.56 V vs SCE). The second one-electron reduction potentials of 7–9 (Ered2) are also nearly the same and range from −0.64 to −0.69 V vs SCE, which agree with the Ered1 value of cyanine dye 6 (−0.69 V vs SCE). Thus, there seems to be little or no interaction between the purpurinimide and cyanine moieties in the conjugates 7–9, irrespective of the difference in the distance between them.
Figure 5.
Cyclic voltammograms of compound 4, 6–9 in DMSO containing 0.1M TBAP at scan rate of 0.1V/s.
The second one-electron oxidation of the purpurinimide moiety of the conjugates 8 and 9 is irreversible and the peak potential ranges from 0.89 to 0.92V vs SCE, which is similar to that of 4 (10.92 V). The energy of the charge-separated state of 7–9 to be produced by electron transfer from the purpurinimide moiety to the singlet excited state of the cyanine moiety is roughly estimated to be 1.6 eV, which is higher than the energy of the singlet excited state of cyanine (1.41 eV). The energy of the charge-separated state of 7–9 in the reverse direction from the singlet excited state of the cyanine moiety to the purpurinimide moiety is also estimated to be 1.74 eV, which is lower than the energy of the singlet excited state of cyanine (1.41 eV). Thus, electron transfer from the singlet excited state of the cyanine moiety to the purpurinimide moiety is energetically feasible. However, no electron transfer occurred from the purpurinimide moiety to the singlet excited state of the cyanine moiety as shown in Figure 3. This indicates that the intersystem crossing from the singlet excited state of the cyanine moiety to the triplet excited state is much faster than the electron transfer.
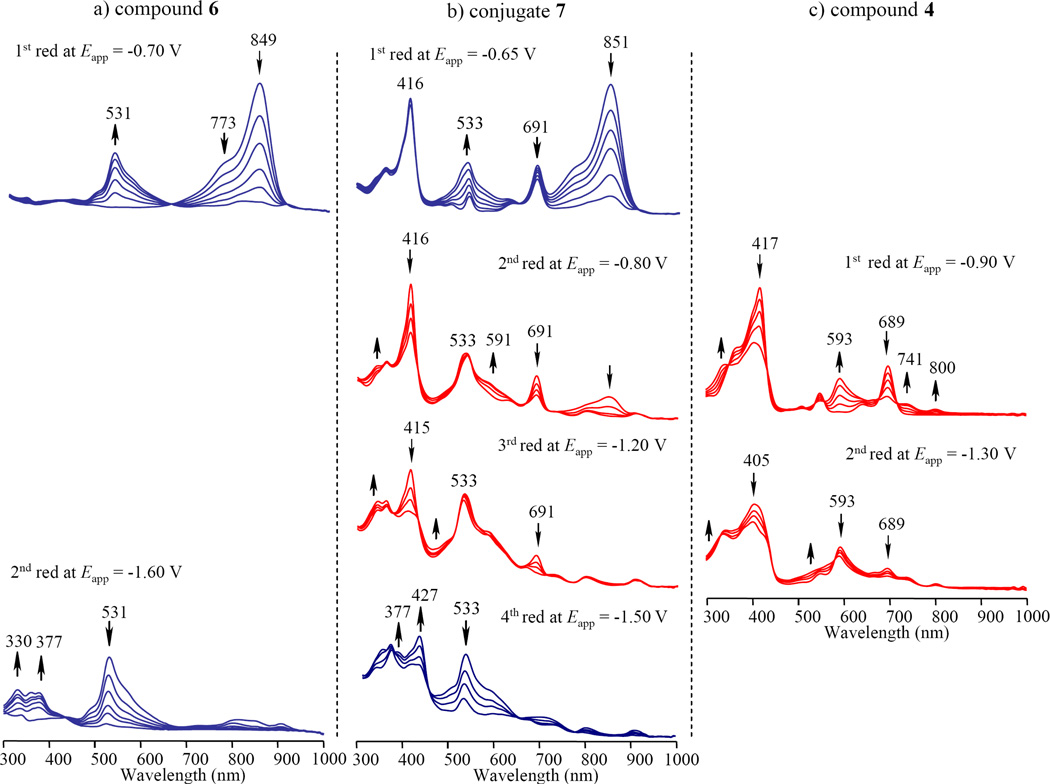
The absence of a charge-separated state of 7–9 was further confirmed by measuring the purpurinimide radical cation and the cyanine radical anion by use of a spectroelectrochemistry (vide infra). Figure 6a shows the spectral changes (in blue) which occurred during the one-electron reduction of cyanine 6 at an applied potential of −0.70 V. A new absorption maximum at 531 nm, which is assigned to the cyanine radical anion, appears and this was accompanied by a disappearance of absorption bands at 773 and 849 nm due to cyanine. A clean isosbestic point is seen in this transfer. The radical anion can be further reduced to the dianion at an applied potential of −1.60 V vs SCE. A similar spectral change is observed for the first one-electron reduction of conjugate 7 (Figure 6b), where the radial anion of the cyanine moiety has an absorption band at 533 nm. Figure 6c shows the spectral changes upon the one-electron reduction of purpurinimide 4 at an applied potential of −0.90 V, in which the Sored band at 417 nm and the visible band at 689 nm are decreased in intensity while an obvious radical band appears at 593 nm. These spectral changes shown in red are quite similar to the second reduction of conjugate 7 at −0.80 V also shown in red (see Figure 6b). A comparison of the spectral change for 6, 7 and 4 during each reduction illustrates the similarity between the conjugates 7, the cyanine 6 and the purpurinimide 4, also suggesting that the purpurinimide and cyanine moieties in 7 are almost independent each other during electron transfer processes.
Figure 6.
Thin-layer UV-visible spectra of (a) 6, (b) 7 and (c) 4 upon the controlled reducing potentials in DMSO containing 0.1 M TBAP. The blue spectral changes in conjugate 7 correspond to a reduction on the cyanine dye moiety. The red spectral changes are assigned at the reduction at the purpurinimide unit of the conjugate.
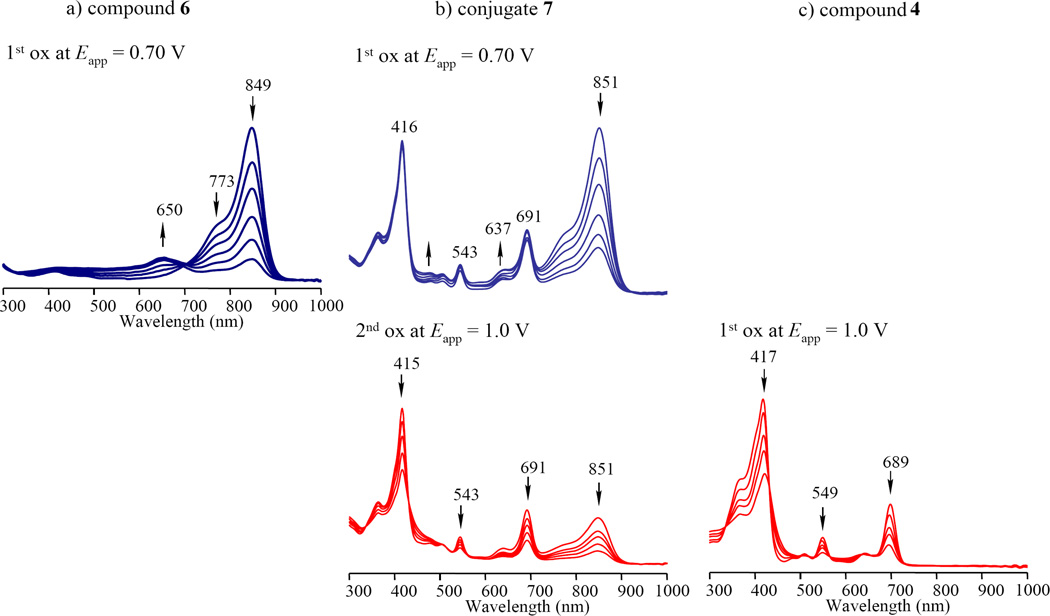
Figure 7a shows the spectral changes which occur upon the one-electron oxidation of cyanine 6 at an applied potential of 0.70 V. A new absorption maximum appears at 650 nm which is assigned as due to the cyanine radical cation. The absorption band due to the cyanine radical cation in the conjugate 7 is slightly blue-shifted to 637 nm (Figure 7b). The purpurinimide radical cation could not be observed by spectroelectrochemistry because of the irreversible oxidation as shown in Figure 7c, where the absorption band due to 4 only disappears at an applied potential of 1.0 V vs SCE.
Figure 7.
Thin-layer UV-visible spectra of (a) 6, (b) 7 and (c) 3 upon the controlled reducing potentials in DMSO containing 0.1 M TBAP.
The absence of an absorption band at 533 nm due to the radical anion of cyanine or the absorption band at 637 nm due to the radical cation of the cyanine in Figure 3c confirms that there is not an electron transfer from the purpurinimide moiety to the singlet excited state of the cyanine moiety or from the singlet excited state of the cyanine moiety to the purpurinimide moiety in the conjugate.
E. Biological Studies
(i) In vitro PDT Efficacy
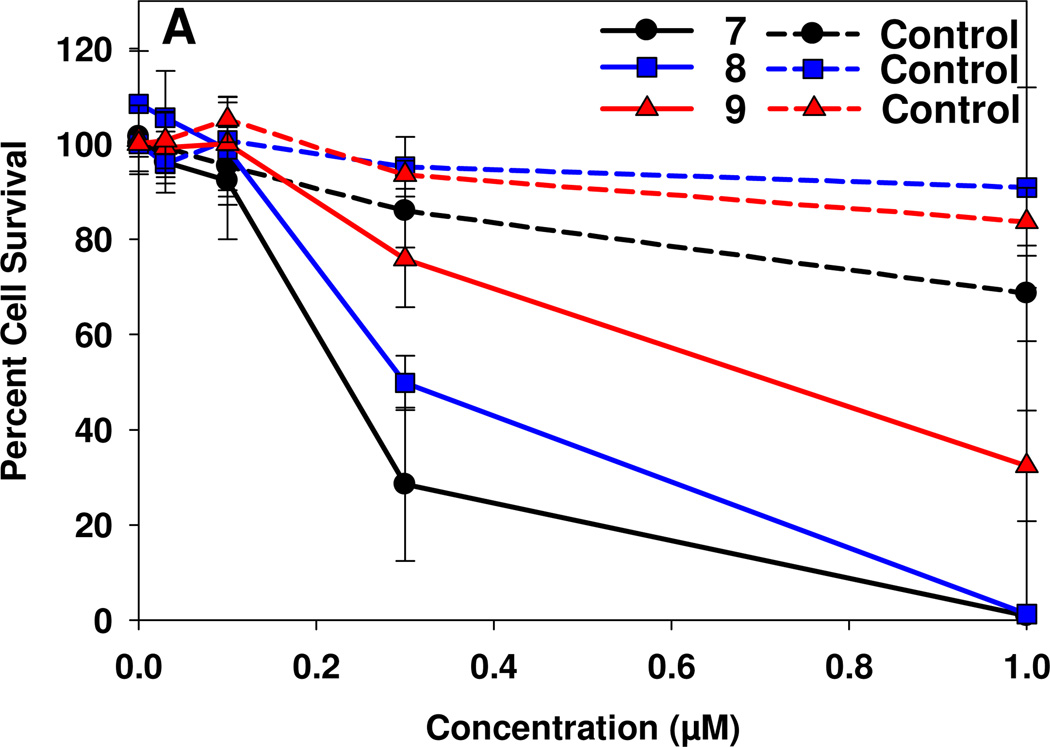
Due to insoluble nature of the conjugates 7–9, various formulations were used to dissolve the compounds in appropriate concentrations. Among all the formulations, reasonable solubility was obtained in both 1% Tween 80 in 5% dextrose-water solution22). The in vitro PDT efficacy of the conjugates 7–9 was determined in Colon26 cells by following the standard MTT assay23 (for details see the Experimental Section). In brief, the cells were incubated for 24h with 7, 8 and 9 at variable concentrations and then exposed to laser light (1.0 J/cm2) at 695 nm, 713 nm and 710 nm (the longest absorption wavelengths corresponding to the purpurinimide portion for the respective conjugates). The PDT efficacy (cell kill) was calculated from 4 replicate wells in 3 separate experiments and each standard error is representative of 3 separate experiments. The results, summarized in Figure 8 and Table 1, show that increasing the distance between the photosensitizer and cyanine dye decreases the in vitro PDT efficacy. The LD50’s of the conjugates were determined by the best fit curves (plotted in Sigmaplot) to the dose response data. The IC50 values confirmed a decreased in-vitro PDT efficacy in this series of conjugates by increasing the linker length between the purpurinimide and the cyanine dye.
Figure 8.
MTT plotted assay of 7, 8 and 9 incubated for 24 hrs at various concentrations with Colon26 cells followed by a light dose of 1.0 J/cm2 at a dose rate of 3.2 mW/cm2.
Table 1.
IC50 (50% cell kill) concentrations of conjugates 7, 8 and 9. Average distance of various conformers is shown in Fig 1 caption.
| Conjugate | IC 50 (μ) |
Distance (Å between the two moieties |
|---|---|---|
| 7 (Short Linker) | 0.22 | 8.18 |
| 8 (Medium Linker) | 0.32 | 8.55 |
| 9 (Long Linker) | 0.69 | 9.85 |
(ii). In vivo Fluorescence Imaging
Cyanine dye 6 has the required photophysical properties (long wavelength absorption with significant Stokes shift), for fluorescence imaging but was not tumor-avid24. To investigate the use of tumor-avid purpurinimides as vehicles to deliver the non-tumor-avid cyanine dye to the tumor, we used fluorescence imaging as a tool to investigate the effect of the linker in vivo25. Compared to the therapeutic dose the imaging dose was quite low and therefore we were able to evaluate the imaging potential of the three conjugates 7–9. Each conjugate was injected i.v. via tail vein at a dose of 0.03 µmole/kg into BALB/c mice (9 mice/group) bearing Colon26 tumors on the shoulder.
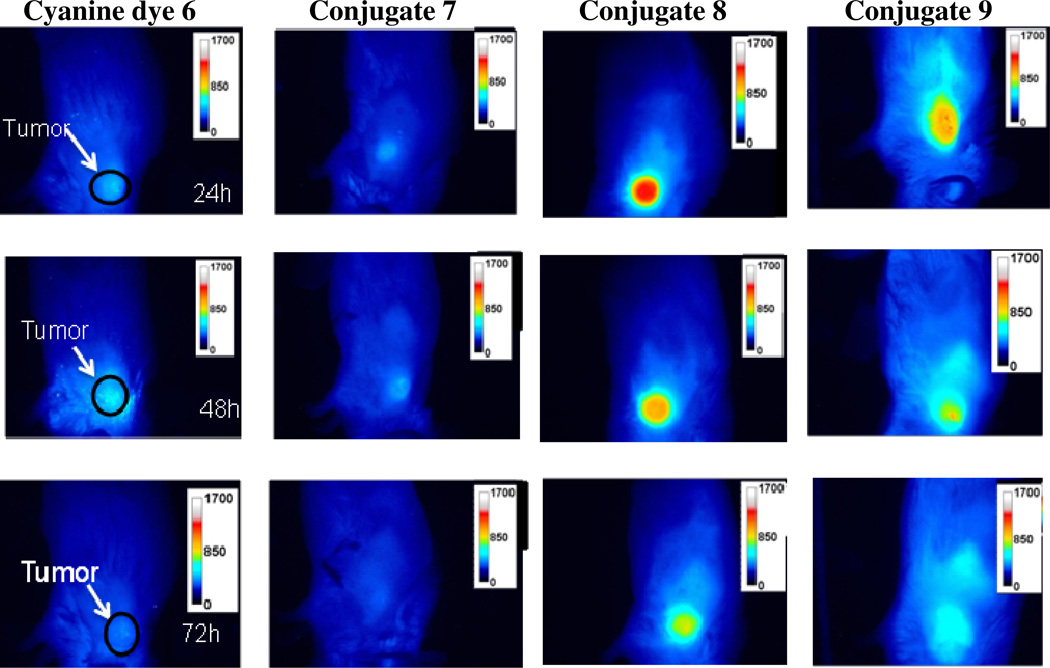
Figure 9 represents fluorescent images of the tumors at 24, 48 and 72 h post injection of conjugates 7, 8 and 9 (3 mice/time point) after each drug was injected. The color scale represents fluorescence intensity where blue being lowest intensity and red/white being highest. After imaging, the mice at each time point were sacrificed and the organs were removed and imaged ex vivo to demonstrate the distribution and clearance rates of the conjugates. Conjugate 8 exhibited the highest fluorescent intensity in the tumors of all the compounds at 24 hours and gradually clear from the tumor by 72 hours. Conjugate 9 showed a moderate but lower fluorescence ntensity than compound 8 and cleared from the tumor at a much faster rate. Interestingly conjugate 7 gave low, barely noticeable fluorescence intensity in the tumor which could either indicates poor fluorescence quantum yield for the cyanine dye portion of this compound or low tumor selectivity.
Figure 9.
Comparative whole body images of conjugates 7–9 along with cyanine dye 6 (dose: 0.03 µmole/kg) in BALB/c mice bearing Colon26 tumors. Images were taken at 24, 48 and 72h post injection using a 12 bit Nuance camera (CRI, Worburn, MA) using a 782 continuous wave laser for excitation and a 800 and 830 nm long pass filter to collect fluorescence. Images were then analyzed using Image J software.
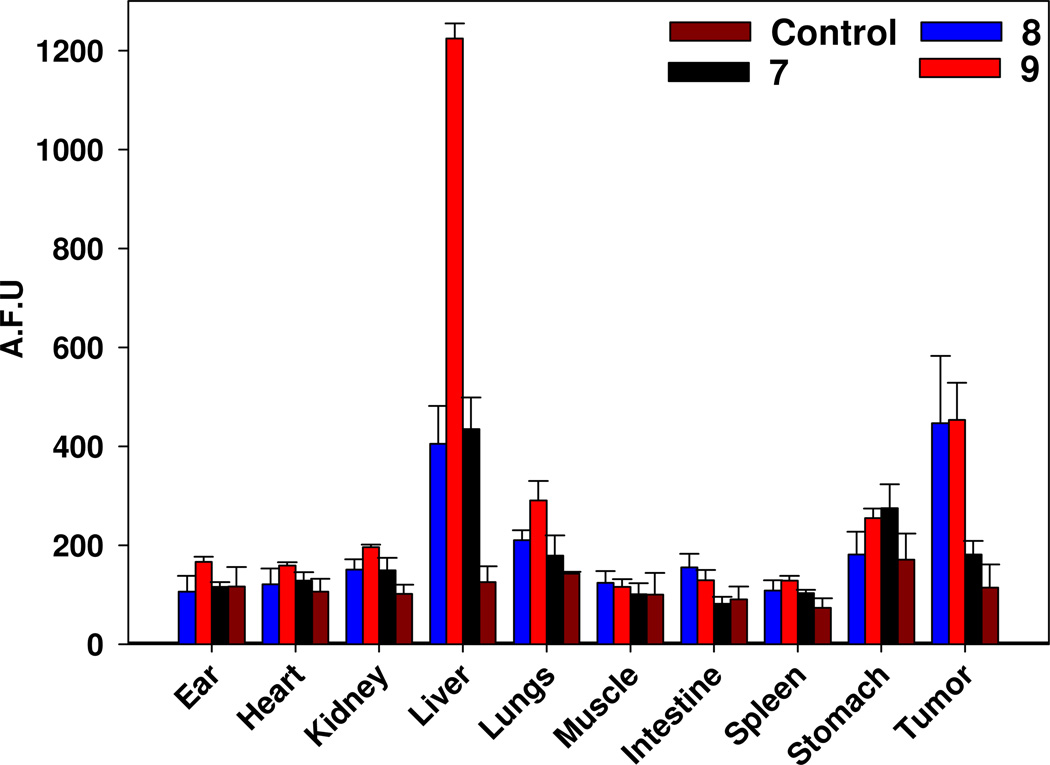
The ex vivo fluorescence intensities of various organs (ear, heart, kidney, liver, lung, muscle, small intestine, spleen, stomach and tumors) are shown in Figure 10. As expected, conjugate 9 in which the photosensitizer is joined with the cyanine dye via a PEG linker exhibited highest fluorescence (high uptake) in liver compared to 7 and 8. The high affinity for this compound to the liver could be due to the more lipophilic nature of the linker connecting the purpurinimide and cyanine dye. Interestingly the PEG linker also showed comparable tumor-avidity. Since the purpose of this study is to create a molecule that can act as both a fluorescent imaging and a therapeutic agent in vivo, conjugate 7 was not examined any further due to its weak uptake in tumor determined by fluorescence imaging compared to the other two conjugates. However, further studies at lower time points may produce improved efficacy and these studies with this and other agents are currently in progress.
Figure 10.
Fluorescence bio-distribution of conjugates 7–9 and various organs [3 mice (BALB/c bearing Colon26 tumors]. Organs from the mice were removed and then imaged/analyzed at 24h post injection (dose: 0.03µmole/kg). The fluorescence intensity of each organ was analyzed by Image J software.
(iii). Comparative In vivo Tumor Uptake of the conjugates
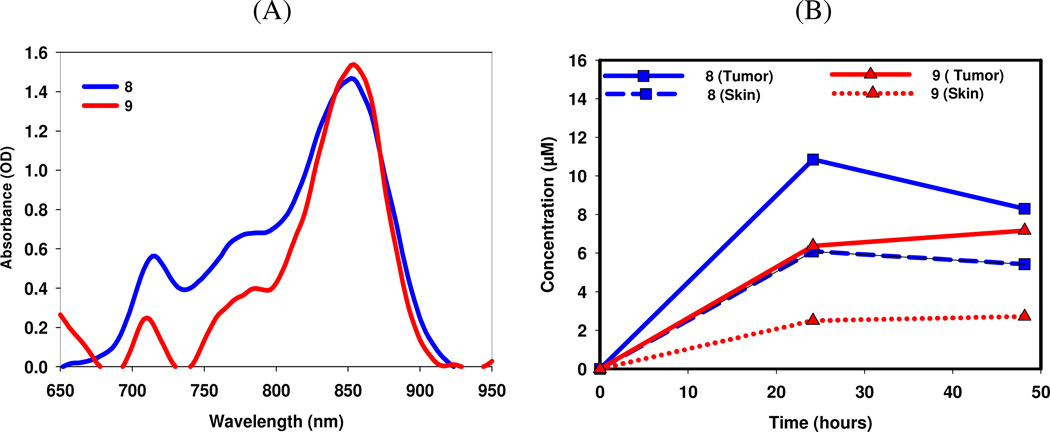
In vivo reflectance spectroscopy was used to determine the maximum uptake of the conjugates at various time points26. Mice were injected through the orbital venous plexus and the reflectance in tumor was measured at 24 and 48 h and the drug concentrations were determined (see Figure 11). This approach was extremely useful in providing the knowledge of the pharmacokinetic characteristics (especially the clearance from the tumor) of the conjugates and also the shift in their in vivo absorption. Under similar drug dose (2.5 µmole/kg) conjugate 8 showed maximum tumor uptake (BALB/c mice bearing Colon26 tumors) at 24 h post injection and decreases over the next 24 h. Conjugate 9 showed a small increase in uptake at 48 h compared to 24 h.
Figure 11.
(A): In vivo absorption spectra of conjugates 7 and 8 determined by in vivo reflectance spectroscopy in Colon 26 tumor implanted in BALB/c mice at 24 h post injection, (B): Tumor vs. skin uptake of the conjugates at 24 and 48 h post-injection (drug dose: 2.5 µmole/kg).
Comparatively, conjugate 8 showed higher tumor uptake than 9 at both 24 and 48 h. Since our objective has been to develop a candidate with both imaging and therapy capabilities and the conjugate 7 showed limited PDT efficacy, it was decided not to explore its imaging potential.
(iv). In Vivo Photosensitizing Efficacy
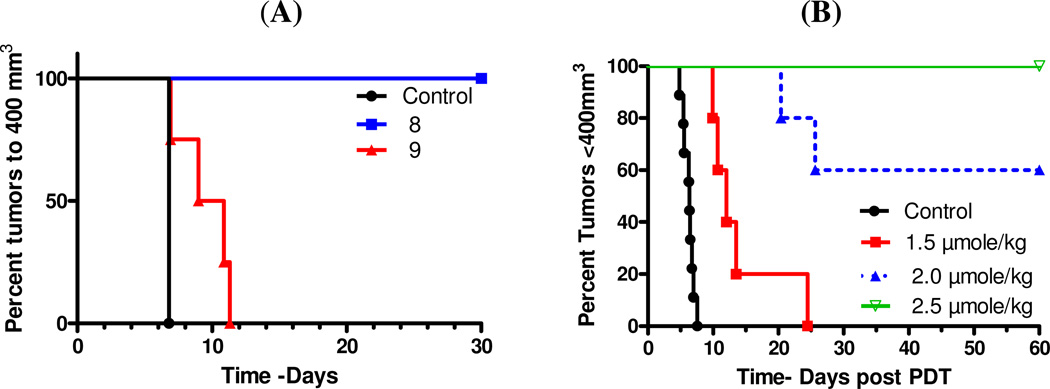
Preliminary in vivo PDT efficacy of the conjugates 8 and 9 were measured by tail vein injection into BALB/c mice (5 mice/group) bearing Colon 26 tumors (average tumor volume 27 mm3) at a dose of 2.5 µmole/kg (which gave approximately 50% tumor cure with HPPH-cyanine dye conjugate, our lead compound)10. The tumors were illuminated with light (135 J/cm2, 74 mW/cm2) at 24 h post injection, with the best time point for the maximum photosensitizer uptake in the tumor determined by fluorescence imaging and in vivo reflectance spectroscopy. From the preliminary results summarized in Figure 12A it can be seen that compared to 8, the conjugate 9 exhibited limited long-term efficacy, and all mice showed tumor regrowth at 10–12 days post treatment. Under similar treatment parameters, conjugate 8 showed 100% tumor-cure, and no tumor-growth was observed at day 60. We further investigated the efficacy of conjugate 8 at variable doses (1.5, 2.0 and 2.5 µmole/kg) and the light dose was kept the same (135 J/cm2, 75mW/cm2) days. From the results summarized in Figure 12B it can be seen that at the lowest dose of 1.5 µmole/kg, the conjugate 8 showed limited efficacy, but at higher doses a significant PDT response was observed (2.0 µmole/kg: 3/5 mice and at 2.5 µmole/kg, 5/5 mice were tumor free on day 60).
Figure 12.
(A). Comparative in vivo photosensitizing efficacy of conjugates 8 and 9 in BALB/c mice (5 mice/group) bearing Colon26 tumors at a dose of 2.5µmole/kg, and (B) In vivo efficacy of 8 at variable drug doses. The tumors were exposed to light (135 J/cm2 and 75mW/cm2) at their longest wavelength absorption at 24 h post injection (i. v.) of the photosensitizers. The tumor growth was measured daily. Under the treatment parameters used, the mice treated with conjugate 8 at a dose of 2.5 µmol/kg did not show any tumor regrowth and the tumors were flat on day 60 post-treatment.
Conclusions
An efficient synthetic pathway was developed to create purpurinimide-cyanine dye dual functional agents. In vitro results suggested that increasing the carbon chain length from a short linker to a long linker decreases the PDT efficacy of the compounds. Fluorescence imaging showed that 7, (short linker) had poor imaging capabilities compared to 8 (medium linker) and 9 (long linker) and was not studied further. Conjugate 9 exhibited the highest liver fluorescent values. This may be due to the more lipophilic nature of the linker connecting the two molecules which shows higher affinity to the liver. In vivo reflectance spectroscopy showed that conjugate 8 exhibited higher tumor uptake then 9 and should therefore produce in vivo PDT efficacy. The comparative in vivo PDT confirmed the higher efficacy of conjugate 8 over 9 and produced 100 % tumor response (5/5 BALB/c mice bearing Colon26 tumors were tumor free after day 60 post-treatment) whereas 9, under similar treatment parameters showed limited PDT activity. This study with a small number of conjugates indicates that conjugate 8 with a medium length of linker shows potential for both tumor-imaging and therapy. However further studies with a larger group of compounds should help in selecting the best candidates and the synthesis of the related analogs is underway. The low PDT and imaging capabilities of the conjugate 7 could be due to its faster in vivo clearance. Therefore, further studies with conjugate 7 at shorter time intervals between the injection of the drug and light treatment are also in progress.
Experimental
All chemicals were of reagent grade and used as such. All reagents were purchased from Aldrich chemical company and were used as received. All photophysical experiments were carried out using spectroscopic grade solvents. Solvents were dried using standard methods unless stated otherwise. Reactions were carried out under nitrogen atmosphere and were monitored by pre-coated (0.20 cm) silica TLC plastic sheet (20 cm × 20 cm) strips (POLYGRAM SIL N-HR) and or /UV-visible spectroscopy. UV-visible spectrums were recorded on Varian Cary 50 Bio UV-visible spectrophotometer using dichloromethane/methanol as solvent unless otherwise specified. 1H-NMR spectra were recorded on Varian 400 spectrometers at 303 K in CDCl3 or ~10% of CD3OD in CDCl3 or DMSO–d6. Proton chemical shifts (δ) are reported in parts per million (ppm) relative to CDCl3 (7.26 ppm), CD3OD (3.34 ppm) or TMS (0.00 ppm). Coupling constants (J) are reported in Hertz (Hz) and s, d, t, q, p, m and br refer to singlet, doublet, triplet, quartet, pentet, multiplet and broad respectively. Mass spectral data (Electro Spray Ionization, ESI by fusion) were obtained from Biopolymer Facility, Roswell Park Cancer Institute, Buffalo, NY, HRMS data were obtained from the Mass Spectrometry Facility, Michigan State University, East Lansing, MI. Elemental analysis were done at Midwest Microlab LLC., Indianapolis, IN.
N-Amino Purpurinimide Methyl Ester (3)
Mesopurpurin-18 methyl ester (2) (0.138 mmol, 80mg) was dissolved in 15 ml of anhydrous pyridine and stirred under argon. Hydrazine anhydrate (1.3 mmole, 42 mg, 42 microliters) was added to 2 ml of anhydrous pyridine, which was then added slowly to the stirring mixture. The completion of the reaction was checked by UV-Vis in regular intervals until the wavelength intensity at λmax701 nm was maximal. After 4 hrs, 1N HCl (25 mL) and dichloromethane (20 mL) were added and the stirring was continued for another1.5 hrs. The reaction mixture was then transferred into a separation funnel. Additional dichloromethane (200 mL) was added, the organic layer was washed with water (200 mL × 3). The dichloromethane (DCM) layer was separated, dried over anhydrous sodium sulfate and filtered.. The crude reaction product obtained after evaporating DCM was purified on an alumina column by eluting with 1% MeOH/DCM solvent system to afford a purple/magenta crystal of 3.26 (42.4 mg, 50% yield) UV-Vis λmax (in CH2Cl2): ): 359 nm (ε = 5.8 × 10⁴), 416 (ε = 10.0 × 10⁵), 548 (ε = 1.9 × 10⁵), 643 (ε = 8.60 × 10³), 700 (ε = 4.94 × 10⁴). 1H-NMR (400 MHz, 3 mg/1 mL CDCl3, δ ppm) 9.07, 8.95 and 8.42 (each s, 1H for 5H, 10H and 20H), 5.72 (broad s, N-NH2), 5.29 (m, 1H, for 17H), 4.33 (m, 1H for 18H), 3.63 (q, 2H for 81CH2) 3.62 (s, 3H for 12CH3), 3.61 (s, 3H for 172CO2CH3), 3.33 (m, 2H for 31CH2) 3.18 (s, 3H for 2CH3), 3.00 ( s, 3H for 7CH3), 2.78 and 1.978 (m, 2H for 171 CH2), 2.46 (m, 2H for 172 CH2) 1.76 (d J = 7.2 Hz, 3H for 18CH3), 1.66 (t, J = 7.2 Hz ,3H for 82CH3), 1.50 (m, 3H for 32CH3). EIMS (m/z): 595 (M+H). Elemental Anal. Calcd for C34H38N6O4: C, 68.67; H, 6.44; N, 14.13. Found: C, 68.70; H, 6.43; N, 14.01.
N-Boc Diethlyene Purpurinimide Methyl ester (4a)
Purpurin-18 methyl ester (50 mg, 0.0865 mmole) (1) was added to a dry 100 ml round bottomed flask and put under house vacuum for 20 mins. N-Boc ethylenediamine (48.50 mg, 0.30275 mmol) was put under nitrogen for 10 min and then added to the flask containing Purpurin-18 using a long needle. Under a nitrogen atmosphere, 5–10 ml of anhydrous DCM was added to the reaction mixture, which was stirred for 39 h monitoring with UV-Vis. A wavelength of 665 nm indicated the opening of the six member anhydride ring system. It was then treated with diazomethane/, the intermediate amide as methyl ester was not isolated and immediately treated with a catalytic amount of KOH/MeOH. The base catalyzed intramolecular cyclization afforded the desired ananlog exhibiting the long wavelength absorption at 707 nm. The reaction mixture was purified by preparative plates using 5% MeOH/DCM solvent system and the desired band was scratched off, re-suspended in 5% methanol/dichloromethane. The silica was removed by filtration. Solvents were evaporated and the residue 4a was precipitated with DCM/n-hexane (60 mg, 86% yield) UV-Vis λmax (in CH2Cl2: 365 nm, 418 nm, 550 nm, 707 nm. 1H-NMR (400 MHz, 3 mg/1 mL CDCl3, δ ppm) 9.40, 9.20 and 8.56 (each s, 1H for 5H, 10H and 20H); 7.83 (dd, J = 11.6, 5.2 Hz 1H, 31CH=CH2); 6.24 (d, J = 16.4 Hz, 1H, trans 32CH=CH2), 6.12, (d, J = 8.4 Hz,1H cis 32CH=CH2); 5.46 (br s,1H, N-H-CH2-CH2-N-Boc); 5.37 (d, J = 4 Hz,1H for 17H), 4.62 (m, 2H, NH-CH2-CH2-N-Boc); 4.37 (q,1H for 18H); 3.59 (s, 3H, 172CO2CH3); 3.49 (q, 2H for NH-CH2-CH2-N-Boc); 3.79 (d, J = 5.2 Hz,1H for 81CH2); 3.73 ( s, 3H for 12CH3) ; 3.33 (s, 3H for 2CH3); 3.04 (s, 3H for 7 CH3); 2.72, 2.46, 2.44 and 2.06 (each m, 1H for 2 × 171H and 2 × 172H); 1.79 (d, J = 8 Hz, 3H for 181 CH3); 1.60 (t, J = 7.6 Hz 3H for 82 CH3); −0.128 and −0.215 (br s, 1H for 2NH). EIMS (m/z): 721 (M+H)
Diethlyene Amino Purpurinimide Methyl ester (4)
N-Boc diethlyene purpurinimide Methyl ester (4a) was treated with a 4:1 ratio of TFA/Dry DCM and stirred for 2 h. The TFA was removed by high vacuum for 5 hrs and the remainder was purified on an alumina column with 5% MeOH/DCM as the solvent system. The resulting compound was isolated as a dark purple liquid, compound 4, which was concentrated by evaporating the liquid under vacuum to afford dark purple crystals (54 mg, 89% yield) UV-Vis λmax (in CH2Cl2): 365 nm (ε = 4.5 × 10⁴), 419 nm (ε = 1.18 × 10⁵), 551 nm (ε = 4.6 × 10⁴), 706 nm (ε = 4.2 × 10⁴) 1H-NMR (400 MHz, 3 mg/1 mL CDCl3, δ ppm) 9.65, 9.44, 8.78 (each s, 1H for 5 H, 10H and 20H) ; 8.03 (dd, J = 17.6, 11.6 Hz, 1H, 31CH=CH2), 6.45 (d, J = 18.0, 1H, trans 32CH=CH2), 6.34 (d, J = 11.6, 1H cis 32CH=CH2), 5.58 (d, J = 8.4 Hz, 1H for 17H); 4.81 (t, J = 6.8 Hz, 2H for N-CH2-CH2-N), 4.58 (q, J = 7.2 Hz, 1H for 18H), 3.95 (s, 3H, 12CH3), 3.81 (s, 3H, 172CO2CH3), 3.80 (q, J = 7.6 Hz, 2H, 81CH2), 3.54–3.59 (m, 5H, 2CH3 and N-CH2-CH2-N), 3.27 (s, 3H, 7CH3), 2.96, 2.67, 2.62 and 2.22 (each m, 1H, 2 × 171H and 2 × 172H), 2.00 (d, J = 7.2 Hz, 3H, 18CH3), 1.82 (t, J = 7.6 Hz, 3H, 82CH3) 0.08 and 0.00 (each br s, 1H, 2NH). EIMS (m/z): 621.1 (M+H); Elemental Anal. Calcd for C40H48N6O6: C, 69.66; H, 6.50; N, 13.54. Found: C, 68.63; H, 6.51; N, 12.88.
N-Boc Glycol Purpurinimide Methyl Ester (5a)
N-Boc-2,2’-(ethylene-1,2-dioxy) bisethylamine was prepared by following the literature procedure10. It (50 mg, 0.2015 mmole and dissolved in 5 mL of dry DCM. This was added to a stirring mixture of Purpurin-18 methyl ester (50 mg, 0.0865 mmole) in 10 mL of dry DCM. The reaction was stirred for 39 hrs under a nitrogen atmosphere with UV-Vis monitoring (a shift from 700 nm to 665nm). The reaction was then treated with diazomethane/KOH/MeOH until a red shift to 707 nm indicated the reaction was completed. A preparation scale TLC separation was done with a 5% MeOH/ DCM solvent system and the desired band was scratched off and the desired product was isolated by following the method as discussed above to yield compound 5a (60 mg, 86% yield) UV-Vis λmax (in CH2Cl2): 365.1 nm, 419 nm, 549 nm, 707 nm. 1H-NMR (400 MHz, 3 mg/1 mL CDCl3, δ ppm) 9.58, 9.32 and 8.56 (each s, 1H for 5 H, 10H and 20H), 7.88 (dd, J = 8.0, 10.4 Hz 1H, 31CH=CH2); 6.24 (d, J = 16.0 Hz, 1H, trans 32CH=CH2); 6.14 (d, J = 11.6, 1H cis 32CH=CH2);5.32 (m, 1H for 17H); 5.10 (br s, 1H for N-CH2-CH2-(O-CH2)2-NHBoc); 4.73 (t, J = 8.0 Hz, 2H for N-CH2-CH2-(O-CH2)2-NHBoc); 4.34 (q, 1H for 18H); 2.70, 2.40, 2.35 and 1.98 (each m 1H, 2 × 171H and 2 × 172H); −0.05 and −0.15 (br s, 1H for 2NH). EIMS (m/z): 809 (M+H).
N-Glycol Purpurinimide Methyl Ester (5)
Purpurin-18-N-Boc-glycol-imide (5a) was treated with a 4:1 ratio of TFA/Dry DCM and stirred for 2 hrs. The reaction was concentrated by evaporating under vacuum. The crude mixture was purified on an alumina column with 5% MeOH/DCM as the solvent system. The resultant compound after the standard workup afforded dark purple crystals of 5. (54 mg, 89% yield). UV-Vis λmax (in CH2Cl2): 365 nm (ε = 4.5 × 10⁴), 419 nm (ε = 1.18 × 10⁵), 551 nm (ε = 2.1 × 10⁵), 707 nm (ε = 4.30 × 10⁴). 1H-NMR (400 MHz, 3 mg/1 mL CDCl3, δ ppm) 1H-NMR (400 MHz, 3 mg/1 mL CDCl3, δ ppm) 9.58, 9.34 and 8.56 (each s, 1H for 5H, 10H and 20H); 7.90 (dd, J = 11.6, 11.6 Hz, 1H for 31CH=CH2); 6.30 (d, J = 16.4 Hz, 1H for trans-32CH=CH2); 6.15(d, J = 10.4 Hz, 1H for trans-32CH=CH2); 5.33 (m, 1H for 17H); 4.73 (t, J = 1.6 Hz, 2H for N-CH2-CH2-(O-CH2)2-NH2); 4.63 (q, 1H for18H); 4.07 (m, 2H for N-CH2-CH2-(O-CH2)2-NH2); 3.85 (m, 2H for N-(O-CH2)2-CH2-CH2-NH2); 3.79(s, 3H for 12CH3); 3.70 (t, J = 36 Hz, N-(CH2)2-O-CH2-CH2-O-(CH2)2NH2); 3.62 (q, 2H for 81CH2); 3.56 (s, 3H for 172CO2CH3) ; 3.51 (m, 2H for N-(CH2)2-O-CH2-CH2-O-(CH2)2NH2); 3.34 (s, 3H for 18 CH3); 3.14 (s, 3H for 7CH3); 2.80, 2.70, 2.40 and 1.99 ( each m 1H, 2 × 171H and 2 × 172H); 1.95 (m, 2H for N-(O-CH2)2-CH2-CH2-NH2); 1.86 (broad s, 2H for NH2); 1.74 (d, J = 7.2 Hz, 3H for 18CH3); 1.65 (t, J = 7.6 Hz, 3H for 82 CH3); 0.059 and −0.146 (broad s, 1H for 2NH). EIMS (m/z): 709 (M+H); Elemental Anal. Calcd for C40H48N6O6: C, 67.78; H, 6.83; N, 11.86. Found: C, 67.59; H, 6.60; N, 10.90.
Cyanine Dye (6)
To a dry round bottomed flask containing IR-820 (342 mg, 0.402 mmol) stirring in anhydrous DMF, was added 4-carboxythiophenol (186.2 mg, 1.20 mmol) and the mixture was stirred overnight under a nitrogen atmosphere. The crude reaction product obtained after the standard workup was purified over a silica column using a 5–25% DCM/MeOH solvent system and a green liquid was collected. The liquid was concentrated by evaporation under vacuum and scratched to afford dark green crystals of 6, Yield (270 mg, 80 %). UV-Vis λmax (in MeOH) 835nm (ε = 1.96 × 10⁵); 1H-NMR (400 MHz, 3 mg/1 mL MeOH, δ ppm) 8.87 (d, 2H, J = 14 Hz), 8.15 (d, 2H, J = 14 Hz), 8.79-7.99(m, 6H), 7.57–7.63 (m,4H), 7.44 (t, 2H, J = 7.2 Hz), 7.36 (d, 2H, J = 8.4 Hz), 6.40 (d, 2H, J = 14 Hz), 4.27 (t, 4H, J = 7.6 Hz), 2.85–2.92(m, 8H), 1.93–2.10 (m, 10 H), 1.77 (s, 12H). EIMS (m/z): 989.4 (M+ + 2Na). HRMS: Calcd. For C53H56N2O8S3Na: 967.3097; Found: 967.3127.
Conjugate 7
In a dry round bottomed flask containing cyanine dye 6 (121.62 mg, 0.1289 mmole), DMTMM (39.25 mg, 1.1 eq) was stirred in 5 ml of anhydrous DMF under a nitrogen atmosphere for 2 h. N-amino purpurinimide methyl ester 3 (80 mg, 0.1289 mg) was stirred in 5 ml of anhydrous DMF in a separate round bottomed flask and was added to the flask containing the cyanine dye after 2h. The reaction was stirred overnight and was purified by preparative silica TLC plate using a 20% MeOH/DCM solvent system. The desired band was collected, re-suspended in 5% methanol dichloromethane. It was then filtered and the solvents were concentrated. The residue was crystallized/precipitated as dark purple crystals. Yield (40 mg, 32 %) UV-Vis λmax (in MeOH):361 nm (ε = 3.9 × 10⁴), 412(ε = 9.6 × 10⁴), 544 (ε = 1.7 × 10⁴), 693 (ε = 4.5 × 10⁴), 837 (ε = 1.5 × 10⁵). 1H-NMR (400 MHz, 3 mg/1 mL MeOH, δ ppm) 9.72, 9.37, 8.81 (each s, 1H, for 5H, 10H and 20H); 8.78 (d, J = 2.4 Hz, 2H, cyanine dye F); 8.29 (d, J = 8 Hz, 2H, cyanine dye B); 8.09 (m, 6H, cyanine dye H and D); 7.81 (d, J = 8.8 Hz, 2H, cyanine dye G); 7.64 (t, J = 12 Hz, 4H, cyanine dye C); 7.51(t, J = 8 Hz, 2H, cyanine dye A); 6.50 (d, J = 16 Hz, 3H, cyanine dye E); 5.01 (m, 2H cyanine dye SO3H), 4.91 (m, 1H for 17H); 4.35 (m, 4H for cyanine dye H and 1H for 18H); 3.80(br doublet,4H, 2H for 31 CH2 and 2H for 81CH2); 3.75 (d, 7H, 4H for 172CO2CH3 and 3H); 3.35 (H20 peak and hidden 3H for 12CH3 singlet peak); 3.335 and 3.225 (s, 4H, 3 for 7CH3 and 1H); 2.90(m, 5H for cyanine dye K and L); 2.50 (m, 2H, 172CH3 within DMSO peak); 2.32 (m, 2H for 171CH2); 2.06-1.52 (many multiplets, 41H, 12H for cyanine dye J and N, 3H for cyanine dye M, 9H for 32CH3, 181CH3 and 82CH3, and 17 H). EIMS (m/z): 1520 (M−H); HRMS: Calcd. For C87H92N8O11S3: 1520.6048; Found: 1520.6048.
Conjugate 8
In a dry round bottomed flask, cyanine dye 6 (92.4 mg, 0.098 mmol), DMTMM (30 mg, 0.1078 mmole) was stirred in 5ml of anhydrous DMF in a nitrogen atmosphere for 2 h. diethlyeneaminopurpurinimide methyl ester 4 (70 mg, 0.098 mmol) was stirred in 5 ml of anhydrous DMF in a separate round bottomed flask and was added into the flask containing the cyanine dye after 2h. The reaction was stirred overnight and was purified on a preparation scale TLC plate using a 20% MeOH/DCM solvent system. The desired fraction was collected and the residue obtained after evaporating the solvent was crystallized/precipitated with DCM/hexane as dark purple crystals. Yield (35 mg, 37 %) UV-Vis λmax (in MeOH): 365 nm (ε = 3.8 × 10⁴), 418 nm (ε = 8.2 × 10⁴), 549 nm (ε = 1.6 × 10⁴), 707 nm (ε = 4.6 × 10⁴), 842 nm (ε = 1.6 × 10⁵) 1H-NMR (400 MHz, 3 mg/1 mL MeOH, δ 9.59, 9.42 and 8.86 (each s, 1H for 5H, 10H and 20H); 8.61 (d, 2H for cyanine dye f, J=14 Hz); 8.16 (dd, J = 8 Hz,40 Hz, 1H, 31CH=CH2); 8.06 (d, 2H for cyanine dye B, J=8.4 Hz); 7.98-7.95 (m, 4H for cyanine dye H and D); 7.73-7.67(m, 4H for cyanine dye G and C); 7.47 (t, 2H for cyanine dye A, J =7.2 Hz); 7.34 (d, 2H for cyanine dye E, J = 8.4 Hz); 6.38 (t, 3H, 2H for cyanine dye E, 1H for trans 32CH=CH2, J=14 Hz); 6.20 (d, 1H for cis 32CH=CH2, J=11.6); 5.12 (d, 1H for 17H, J= 1.2 Hz); 4.53-4.40( m, 3H, 1H for 18H and 2H for N-CH2-CH2-N); 4.24 (broad s,3H for cyanine dye I); 3.81 (s, 3H for 12 CH3); 3.69 (m, 1H for NH); 3.60 (s, 3H for 172CO2CH3); 3.39-3.31 (m, 2H for 81CH2, 3H for 2CH3 and 2H for N-CH2-CH2-N, 8H for cyanine dye K and L); 3.13( s, 3H for 7 CH3); 2.33-2.20 (each m, 1H for, 2×171H and 2×172H); 2.10-2.08 (each m, 8H for cyanine dye J and N); 1.925 (m, 3H for 18 CH3); 1.74-1.52 (m, 15 H, 3H for 82CH3 and 12 H for cyanine dye M); −0.35 and −0.41 (each br s, 1H for 2NH). EIMS (m/z): 1546 (M−H); HRMS: Calcd. For C89H94N8O11S3: 1546.6204; Found: 1546.6244.
Conjugate 9
In a dry round bottomed flask, cyanine dye 6 (142.7 mg, 0.151mmole), DMTMM (45.96 mg, 0.1661 mmole) was stirred in 5ml of anhydrous DMF in a nitrogen atmosphere for 2 h. N-Glycolpurpurinimide methyl ester 5 (90 mg, 0.151mmol) stirred in 5 ml of anhydrous DMF in a separate round bottomed flask was added to the flask containing the cyanine dye after 2h. The reaction was stirred overnight and was purified on a preparation scale TLC plate using a 20% MeOH/DCM solvent system as discussed for the foregoing compound. The desired fraction was collected and concentrated, crystaliized with DCM/hexane to afford dark purple crystals. Yield (40 mg, 32 %) UV-Vis λmax (in MeOH): 366 nm (ε = 4.5 × 10⁴), 416 nm(ε = 1.0 × 10⁵), 549 nm (ε = 2.7 × 10⁴), 707 nm (ε = 5.8 × 10⁴), 842 nm (ε = 2.1 × 10⁵) 1H-NMR (400 MHz, 3 mg/1 mL MeOH): δ 9.67,9.46 and 8.88 (each s, 1 H for 5H, 10H and 20H);8.62 (d, 2H for cyanine dye f, J= 14 Hz); 8.10 ( d, 4H, cyanine dye j, J=11.6 Hz);7.85 (m, 4H, cyanine dye M); 7.79 (d, 2H for cyanine dye a, J=7.2 Hz); 7.40 (d, 2H for cyanine dye b, J=7.2 Hz); 6.39 (m, 3H, 1H for 31CH=CH2 and 2H for cyanine dye e); 6.19 (d, 1 H for 32CH=CH2, J=7.6 Hz); 5.18 (m, 1H for cis 32CH=CH2); 4.4( m, 1H for 18H); 4.2 (m,1H for 17H); 3.75 (s,3H for 12 CH3);3.51 (s, 3H for 2 CH3); 3.30(s, 3H for 172CO2CH3);3.15 (s, 3H for 7 CH3); 2.80 (m, 8H for cyanine dye i and j); 2.60, 2.55, 2.40 and 2.36 (each m, 1H for, 2×171H and 2×172H);1.90 (m, 5H for cyanine dye c and h); 1.63(s, 3H for 18 CH3);1.50 (t, 3H for 82CH3, J=7.2 Hz); −0.35 and −0.41 (each br s, 1H for 2NH). EIMS (m/z): 1634 (M−H); HRMS: Calcd. For C93H103N8O13S3: 1634.6746; Found: 1634.6729.
In Vivo Fluorescence Imaging
Fluorescence imaging was performed using approved protocols in accordance with the Guide for the Use of Laboratory Animals. A 12 bit Nuance camera (CRI, Worburn, MA) shown in Figure 14, was used to image the conjugates in vivo using a 782 continuous wave laser for an excitation source. The fluorescence was collected after filtering through two 600 nm long pass filters in series and 800 and 830 nm long pass filters. Prior to imaging, BALB/c mice bearing Colon26 tumors on the shoulder with a average diameter of 4–5 mm were shaved and depilated with Nair cream to remove hair over the tumor and the surrounding skin. Conjugates 7, 8 and 9 were injected via tail vein at 0.03 µmole/kg. At 24, 48 and 72 h post injection, mice were anesthetized with ketamine/xylene (100/10 mg/kg) placed in the light box and imaged. The localization and biodistribuition of the conjugates were determined by sacrificing 3 mice/time points and imaging the organs. The images were processed using image calculator27.
In Vivo Photosensitizing Efficacy
BALB/c mice (5 mice/group) were implanted subcutaneously in the right shoulder with 1 × 10⁶ Colon 26 cells per 50 µl of RPMI-1640 medium. When tumors grew to 4–5 mm diameter, mice were injected with 2.5 µmole/kg of 8 and 9 via tail vein injection. 24 h post injection the mice were restrained within Plexiglas holders and exposed tumors were treated with laser light for 135 J/cm2 at 75mW/cm2. Following treatment, tumor growth was monitored daily and measured with calipers along the length and width of the tumors. Tumor volumes were calculated by using the formula V=L × W2/2. Mice were considered cured if no palpable tumor grew within 30 days of being treated or they were euthanized when the tumor volume reached 400 mm3.
Molecular Modeling
A. Conjugate Structures
The three dimensional structures of purpurinimide – cyanine dye conjugates (7–9) were built with SYBYL molecular modeling software version 8.0 (Tripos Inc., St. Louis, MO). Purpurinimide moiety was taken from previous studies28 utilizing appropriate crystal structure. Cyanine dye moiety was built from SYBYL fragment library and standard geometry using the extended conformation. Both moieties were fully energy optimized with a semi-empirical molecular orbital method, PM3, using the Spartan 02 software (Wave function Inc, Irvine, CA). Finally, energy optimized moieties were joined with specific linkers with standard geometry using SYBYL software. Each conjugate as a whole was again energy optimized with PM3 using Spartan software.
B. Conjugate Conformations
The PM3 energy optimized structure for each conjugate was used as the initial conformation for limited conformational search to explore the conformational flexibility of these conjugates. Due to the size of molecules, molecular mechanics instead of molecular orbital method was used for this study. The stochastic conformational search was performed using Molecular Operating Environment (MOE) software, version 2010.10, from Chemical Computing Group (Montreal, Quebec, Canada). Standard MMFFs force field and charges were used for the stochastic conformational search where the dihedral angles were randomly modified, followed by the energy minimization in dihedral angles first, then energy minimization in Cartesian space. During the conformational search the chiral centers were maintained as the original structure. No attempt was made to perform exhaustive conformational search due to uncertainly in environment of the conjugate in cell or in vivo situation.
Photophysical Properties
Femtosecond transient absorption spectroscopy experiments were conducted using an ultrafast source: Integra-C (Quantronix Corp.), an optical parametric amplifier: TOPAS (Light Conversion Ltd.) and a commercially available optical detection system: Helios provided by Ultrafast Systems LLC. The source for the pump and probe pulses were derived from the fundamental output of Integra-C (780 nm, 2 mJ/pulse and fwhm = 130 fs) at a repetition rate of 1 kHz. 75% of the fundamental output of the laser was introduced into TOPAS which has optical frequency mixers resulting in tunable range from 285 to 1660 nm, while the rest of the output was used for white light generation. Prior to generating the probe continuum, a variable neutral density filter was inserted in the path in order to generate stable continuum, then the laser pulse was fed to a delay line that provides an experimental time window of 3.2 ns with a maximum step resolution of 7 fs. In our experiments, a wavelength between 350 to 450 nm of TOPAS output, which are fourth harmonic of signal or idler pulses, was chosen as the pump beam. As this TOPAS output consists of not only desirable wavelength but also unnecessary wavelengths, the latter were deviated using a wedge prism with wedge angle of 18 degree. The desirable beam was irradiated at the sample cell with a spot size of 1 mm diameter where it was merged with the white probe pulse in a close angle (< 10 degree). The probe beam after passing through the 2 mm sample cell was focused on a fiber optic cable, which was connected to a CCD spectrograph for recording the time-resolved spectra (410–1600 nm). Typically, 2500 excitation pulses were averaged for 5 seconds to obtain the transient spectrum at a set delay time. Kinetic traces at appropriate wavelengths were assembled from the time-resolved spectral data. All measurements were conducted at room temperature, 295 K.
The fluorescence measurements were carried out with an absolute PL quantum yield measurement system (Hamamatsu photonics Co., Ltd., C9920-02) with excitation at 680 nm.
Electrochemical Measurements
Cyclic voltammetry was carried out with an EG&G Model 173 potentiostat/galvanostat. A homemade three-electrode cell was used and consisted of a platinum button or glassy carbon working electrode, a platinum wire counter electrode and a saturated calomel reference electrode (SCE). The SCE was separated from the bulk of the solution by a fritted-glass bridge of low porosity which contained the solvent/supporting electrolyte mixture. All potentials are referenced to the SCE.
UV-visible spectroelectrochemical experiments were performed with an optically transparent platinum thin-layer electrode of the type described in the literature29. Potentials were applied with an EG&G Model 173 potentiostat/galvanostat. Time-resolved UV-visible spectra were recorded with a Hewlett Packard Model 8453 diode array rapid-scanning spectrophotometer.
Tetra-n-butylammonium perchlorate (TBAP, ≥ 99%) was recrystallized from ethyl alcohol, and dried under vacuum at 40 °C for at least one week prior to use. Dimethylsulfoxide (DMSO, ≥ 99.9 %) were obtained from Sigma-Aldrich Chemical Co. and used without further purification
Supplementary Material
Acknowledgments
This research was supported by Grants-in-Aid (Nos. 20108010 and 23750014) and the Global COE program “Global Education and Research Center for Bio-Environmental Chemistry” of Osaka University from the Ministry of Education, Culture, Sports, Science and Technology, Japan and KOSEF/MEST through WCU project (R31-2008-000-10010-0) from Korea to S.F. and The Robert Welch Foundation (Grant E-680) to K.M.K and CA 127369 (NIH) to RKP.
Footnotes
Supporting Information Available: The NMR /Mass spectra of compounds 3–9, the HPLC profiles of conjugates 7–9 and the experimental details of MTT assay and in vivo reflectance spectroscopy. This material is available free of charge via the Internet at http://pubs.acs.org.
References
- 1.Dougherty TJ. A brief history of clinical photodynamic therapy development at Roswell Park Cancer Institute. J. Clin. Laser Med. Surg. 1996;14:219–221. doi: 10.1089/clm.1996.14.219. [DOI] [PubMed] [Google Scholar]
- 2.Pandey RK, Goswami LN, Chen Y, Gryshuk A, Missert JR, Oseroff A, Dougherty TJ. Nature: A rich source for developing multifunctional agents. Tumor-imaging and photodynamic therapy. Lasers Surg. Med. 2006;38:445–467. doi: 10.1002/lsm.20352. [DOI] [PubMed] [Google Scholar]
- 3.Celli JP, Bryan Q, Spring BQ, Rizvi I, Evans CL, Samkoe KS, Verma S, Pogue BW, Hasan T. Imaging and Photodynamic Therapy: Mechanisms, Monitoring, and Optimization. Chem. Rev. 2010;110:2795–2838. doi: 10.1021/cr900300p. [DOI] [PMC free article] [PubMed] [Google Scholar]
- 4.Ethirajan M, Saenz C, Dobhal M, Pandey RK. The role of porphyrin chemistry in tumor imaging and photodynamic therapy. In: Hamblin MR, Mroz P, editors. Photodynamic Therapy in Advances in Photodynamic Therapy. Boston: Artech House; 2008. [Google Scholar]
- 5.Ethirajan M, Chen Y, Joshi P, Pandey RK. The role of porphyrin chemistry in tumor imaging and photodynamic therapy. Chem. Soc. Rev. 2011;40:340–362. doi: 10.1039/b915149b. [DOI] [PubMed] [Google Scholar]
- 6.Dougherty TJ, Gomer CJ, Henderson BW, Jori G, Kessel D, Korbelik M, Moan J, Peng Q. Photodynamic Therapy. J. Natl. Cancer Inst. 1998;90:889–905. doi: 10.1093/jnci/90.12.889. [DOI] [PMC free article] [PubMed] [Google Scholar]
- 7.Henderson BW, Dougherty TJ. How does photodynamic therapy work? Photochem.Photobiol. 1992;55:145–157. doi: 10.1111/j.1751-1097.1992.tb04222.x. [DOI] [PubMed] [Google Scholar]
- 8.Macdonald I, Dougherty TJ. Basic principles of photodynamic therapy. J. Porphyrins Phthalocyanines. 2001;5(105):2001–2011. [Google Scholar]
- 9.Gryshuk A, Chen Y, Goswami LN, Pandey S, Missert JR, Ohulchanskyy T, Potter W, Prasad PN, Oseroff A, Pandey RK. Structure-Activity relationship among purpurinimides and bacteriopurpurinimides: Trifluoromethyl Substituent Enhanced the photosensitizing efficacy. J. Med. Chem. 2007;50:1754–1767. doi: 10.1021/jm061036q. [DOI] [PubMed] [Google Scholar]
- 10.Chen Y, Gryshuk A, Achilefu S, Ohulchansky T, Potter W, Zhong T, Morgan J, Chance B, Prasad PN, Henderson BW, Oseroff A, Pandey RK. A novel approach to a bifunctional photosensitizer for tumor imaging and phototherapy. Bioconjugate Chem. 2005;16:1264–1274. doi: 10.1021/bc050177o. [DOI] [PubMed] [Google Scholar]
- 11.Massound TF, Gambhir SS. Molecular imaging in living subjects: seeing fundamental biological process in a new light. Genes & Development. 2003;17:545–580. doi: 10.1101/gad.1047403. [DOI] [PubMed] [Google Scholar]
- 12.Brindle K. New approaches for imaging tumor responses to treatment. Nat. Rev. Cancer. 2008;8:94–107. doi: 10.1038/nrc2289. [DOI] [PubMed] [Google Scholar]
- 13.Pandey RK, James N, Chen Y, Dobhal MP. Cyanine Dye based Compounds for Tumor Imaging with and without Photodynamic Therapy. Top. Heterocycl. Chem. 2008;14:41–74. [Google Scholar]
- 14.Jager HR, Taylor MN, Theodossy T, Hopper C. MR imaging-guided interstitial photodynamic laser therapy for advanced head and neck tumors. Am. J. Neuroradiol. 2005;26:1193–1200. [PMC free article] [PubMed] [Google Scholar]
- 15.Mishra A, Behera RK, Behera PK, Mishra BK, Behera GB. Cyanines during the 1990s: A review. Chem. Rev. 2000;100:1973–2012. doi: 10.1021/cr990402t. [DOI] [PubMed] [Google Scholar]
- 16.Ornelas C, Lodescar R, Durandin A, Canary JW, Pennell R, Liebes LF, Weck M. Combining Aminocyanine Dyes with Polyamide Dendrons: A Promising Strategy for Imaging in the Near-Infrared Region. Chem. Eur. J. 2011;17:3619–3629. doi: 10.1002/chem.201002268. [DOI] [PubMed] [Google Scholar]
- 17.Narayanan N, Patonay G. A new method for the synthesis of Heptamethine Cyanine Dyes: Synthesis of a New Near-Infrared Fluorescent Labels. J. Org. Chem. 1995;60:2391–2395. [Google Scholar]
- 18.Majumdar SR, Majumdar RB, Grant CM, Waggoner AS. Cyanine-labeling reagents: sulfobenzindocyanine succinimidyl esters. Bioconjugate Chem. 1996;7:356–362. doi: 10.1021/bc960021b. [DOI] [PubMed] [Google Scholar]
- 19.Strekowksi L, Mason CJ, Lee H, Gupta R, Sowell J, Patonay G. Synthesis of water-soluble near infrared cyanine dyes functionalized with 9 succiniimdioxyl- carbonyl group. J. Heterocycl. Chem. 2003;40:913–916. [Google Scholar]
- 20.Zheng G, Potter RW, Camacho SH, Missert JR, Wang G, Bellnier DA, Henderson BW, Rodgers MA, Dougherty TJ, Pandey RK. Synthesis, photophysical properties, tumor uptake, and preliminary in vivo photosensitizing efficacy of a homologous series of 3-(1’-Alkyloxy)ethyl-3-devinylpurpurin-18-N-alkylimides with variable lipophilicity. J. Med. Chem. 2001;44:1540–1559. doi: 10.1021/jm0005510. [DOI] [PubMed] [Google Scholar]
- 21.Mironov AF, Grin MA, Tsiprovskiy AG, Kachala VV, Karmakova TA, Pltyutinskaya AD, Yakubovskaya RI. New bacteriochlorin derivatives with a fused N-aminoimide ring. J. Porphyrins Phthalocyanines. 2003;7:725–730. [Google Scholar]
- 22.Pandey SK, Gryshuk AL, Sajjad M, Zheng X, Chen Y, Abuzeid MM, Morgan J, Charamisinau I, Nabi HA, Oseroff A, Pandey RK. Multimodality agents for tumor imaging and PDT: A possible see and treat approach. J. Med. Chem. 2005;48:6286–6295. doi: 10.1021/jm050427m. [DOI] [PubMed] [Google Scholar]
- 23.Kawada K, Yonei T, Ueoka H, Kiura K, Tabata M, Takigawa N, Harada M, Tanimoto M. Comparison of chemosensitivity tests. Clonogeneic assay versus MTT assay. Acta med. Okayama. 2002;56(3):129–134. doi: 10.18926/AMO/31714. [DOI] [PubMed] [Google Scholar]
- 24.Patterson MS, Schwartz E, Wilson BC. SPIE. Vol.1065. Photodynamic Therapy: Mechanisms; 1989. Quantitative reflectance spectrophotometry for the noninvasive measurement of photosensitizer concentration in tissue during photodynamic therapy; pp. 115–122. [Google Scholar]
- 25.Potter WR, Bellnier DA, Pandey R, Parsons JR, Dougherty TJ. Sensitizer pharmacokinetics by in vivo Reflection Spectroscopy. Unpublished results [Google Scholar]
- 26.Zeng G, Chen Y, Intes X, Chance B, Glickson JD. Contrast-enhanced near IR optical imaging for subsurface cancer detection. J. Porphyrins pthalocyanines. 2004;8:1106–1117. [Google Scholar]
- 27. http://rsb.info.nih.gov/ij/
- 28.Pandey Sk, Zheng X, Morgan J, Missert JR, Liu TH, Shibata M, Bellnier DA, Oseroff AR, Henderson BW, Dougherty TJ, Pandey RK. Purpurinimide carbohydrate conjugates: effect of the position of the carbohydrate moiety in photosensitizing efficacy. Mol Pharm. 2007;4:448–464. doi: 10.1021/mp060135x. [DOI] [PubMed] [Google Scholar]
- 29.Lin XQ, Kadish KM. Vacuum-tight thin-layer spectroelectrochemical cell with a doublet platinum gauze working electrode. Anal. Chem. 1985;57:1498–1501. doi: 10.1021/ac00284a079. [DOI] [PubMed] [Google Scholar]
Associated Data
This section collects any data citations, data availability statements, or supplementary materials included in this article.


