

Abstract
Homeostatic control of endocrine systems proceeds via feedforward (agonistic, stimulatory) and feedback (antagonistic, inhibitory) interactions mediated via implicit dose-response functions. However, neither the feedback/feedforward pathways nor the dose-response interfaces are directly observed in vivo. Thus, the goal was to formulate and estimate an ensemble construct of time-varying feedback/feedforward interactions among GnRH, LH, and testosterone (T) in the male gonadal axis. The new analytical model revises and extends an earlier construct by: 1) allowing systemic T concentrations to inhibit hypothalamic GnRH output; 2) estimating GnRH outflow after injection of a calibrating pulse of biosynthetic GnRH; 3) framing the pituitary response to GnRH as a secretory burst, rather than continuous LH release; and 4) regressing feedback and feedforward ensemble parameters on age, rather than evaluating age dichotomously. Application of this methodology in 21 men aged 23–72 yr unveiled age-related 1) diminution of GnRH efficacy normalized for the decline in free T with age (P = 0.016), 2) potentiation of maximal T feedback onto (inhibition of) GnRH secretion (P = 0.006), and 3) accentuation of hypothalamic GnRH's sensitivity to T repression (P = 0.003). Outcomes were specific, because injected GnRH agonist and antagonist concentrations were invariant of age. We conclude that combining experimental and analytical strategies may provide a noninvasive means to investigate and decipher feedback determinants of unobserved endocrine signal(s).
In humans and animals, one of the earliest markers of pathophysiology is subtle erosion of interlinked physiological processes, reflecting impairment of homeostatic control (1). Thus, early quantification of regulatory failure in vivo is fundamental to interventional medicine and restorative therapy. A major technical hurdle is the inability to measure all key components of the regulatory system directly except via invasive procedures, which may disrupt the interactions being studied (2). In endocrine axes, one or more unobserved central nervous system signals often constitute primary regulatory components, which supervise observed (measurable) peripheral signals. The male gonadal axis represents such a system, wherein the GnRH secretory burst is a crucial but unobserved brain signal that evokes pituitary LH pulses and, thereby, secondarily testicular testosterone (T) secretion (3). Rising T concentrations in turn repress GnRH outflow. The present work uses the male hypothalamo-gonadotrope-Leydig cell axis as a prototype to model unobserved GnRH signals based upon observed LH and T pulses.
The methodology introduced here revises and complements an earlier GnRH-LH-T construct (4, 5). Data from the rat, mouse, monkey, and in less measure human collectively motivate several pivotal innovations. First, we extend the original paradigm of graded competitive GnRH-receptor antagonism to include simultaneous injection of a fixed, submaximally effective GnRH pulse as an external calibrating signal. The objective is normalized estimation of endogenous GnRH outflow and action, rather than mathematical construction of a virtual (unscaled or relative) GnRH signal (4). Second, T or its metabolites, rather than exclusively inhibiting GnRH action at the pituitary level via the estrogen receptor, are here formulated as repressing pulsatile GnRH release at the hypothalamic level (6–12). Third, instead of attempting to quantify GnRH's drive of sample-by-sample LH secretion rates, a GnRH pulse is formulated as amplifying LH secretory-burst mass (size). Analogously, T is rendered as repressing GnRH secretory-burst mass. And fourth, by measuring serum concentrations of graded doses of a competitive GnRH-receptor antagonist [ganirelix (GRX)] (13) and a fixed dose of agonist (injected GnRH), we incorporate relevant right-shifts in GnRH potency across four strata of partial GnRH-receptor block in each individual. The resultant analyses provide a possible basis for explaining previously conflicting data in the endocrine literature, which allege both attenuated and augmented T feedback in the aging male (4, 14–19).
Materials and Methods
The methodology introduces the strategy of calibrating analytical estimates of unobservable endocrine signals by combining administration of a competitive agonist and antagonist within a suitable analytical framework. Only deconvolution analysis of 18-h baseline LH and T profiles (without GnRH injection) was presented earlier in 10 young and eight older men (4). Three other individuals were studied but not analyzed at that time, which brought the cohort size to 21 men ages 23–72 yr. The cohort of 21 subjects was defined by the existence of previously unanalyzed data, which had been obtained every 10 min for 90 min after bolus iv GnRH injection given immediately after the 18-h baseline. The additional data were measured concentrations of GnRH, LH, and T. In the case of GnRH, a 10-min sampling was supplemented by adding samples also at 1, 2.5, 5, 7.5, 12.5, and 15 min after the GnRH bolus. LH and T were assayed as described (4) and GnRH as published (20). GRX was measured by immunoassay as reported (21).
Sampling protocol
After approval by Mayo institutional review board, in all 21 subjects, forearm blood was sampled every 10 min for 18 h (1800–1200 h) as a baseline, after which a fixed bolus of 100 ng/kg GnRH was administered iv over 1 min (squarewave injection). This was followed by 1.5 h of additional frequent sampling (total 19.5 h). The GnRH dose was selected to be submaximal (22, 23). The assumed GnRH dissociation constant (kd) was 0.85 nm (13, 24). Each session was repeated four times at one of four different GnRH antagonist, GRX, doses: k = 0, 1, 2, 3 (saline, 0.1, 0.3, and 1.0 mg/m2), and the same GnRH bolus (yielding a total of 84 infusion sessions). GRX was administered sc 120 min after time zero (thus, at 2000 h). The GRX kd was 0.69 nm (13). The concentrations of GRX, sex hormone-binding globulin (SHBG), and albumin were measured in a 2-h serum pool collected just before GnRH injection.
Analytic model: overview
The post-GnRH measurements of LH, T, and GnRH have never been reported, pending the development of an adequate analytical model. The current work presents such a model. Earlier analysis of the 18-h portion of the data in 18 men provided estimates of LH pulse times, LH and T secretion rates, and sample-by-sample concentrations of SHBG-bound T, albumin-bound T, and free T (4). Given these data and 10-min LH, T, and GnRH measurements obtained for 1.5 h after bolus GnRH injection in 21 men, the present objective was to formulate a methodology to calibrate endogenous GnRH pulses using measured bolus GnRH concentrations, time-varying LH secretory-burst sizes resulting from endogenous and exogenous GnRH action, matching free T concentrations, and serum GRX concentrations. The model outcomes comprise estimates of unobserved GnRH pulse sizes 1) under feedback repression by T and 2) driving endogenous LH secretory bursts over the 18 h before GnRH injection. Figure 1 shows the model structure schematically.
Fig. 1.

Construct of simplified male hypothalamo-pituitary-gonadal Leydig cell (GnRH-LH-T) interconnections. Arrows denote feedback [inhibitory (−)] and feedforward [stimulatory (+)] actions of GnRH, LH, and/or T concentrations on key gonadal-axis components. Stimulation of pulsatile pituitary LH secretion by hypothalamic GnRH pulses is unobserved (arrow leaving the dashed box). Systemic T's inhibition of GnRH secretion is also unobserved (arrow entering the dashed box). The interrupted curved line for E2's action is not modeled here.
The general analytical strategy was as follows: 1) LH secretory-burst-mass values were obtained over each 90-min interval of the full 1170 min [1080-min (18-h) baseline and 90-min bolus] period for each of the four GRX strata, yielding a total of 52 (48 + 4) LH burst-mass values per subject; 2) mean free T concentrations were estimated as described (4) over successive 90-min intervals; 3) measured GRX concentrations were used to estimate dose- and time-varying GRX concentration profiles in 90-min windows; 4) logistic dose-response functions were estimated for GnRH-stimulated and GRX-inhibited LH secretory-burst-mass values during each 18-h period; 5) the sizes of unobserved subject-by-subject GnRH secretion bursts (modal values) were negatively related to concomitant 90-min free T concentrations; and 6) parameter estimates in the 21 subjects were regressed linearly on age. A priori estimable parameters of interest were GnRH sensitivity, defined as the inhibitory slope of the GnRH secretory-burst mode regressed on free T concentrations; GnRH efficacy, defined as maximal GnRH secretion at low (near zero) T suppression; and T feedback efficacy, defined as the free T concentration required to repress GnRH secretion nearly completely. Strategic aspects 1–4, above, are analytically developed in subsections 1–4 below.
1. Model of LH secretion over the 18-h baseline and 1.5-h GnRH bolus
Successive LH secretory-burst-mass values (IU/liter per 90 min) were estimated from 10-min LH concentration data and candidate LH pulse times by deconvolution analysis, as described (4, 25). Briefly, if pulse times are denoted as: Tk,1, Tk,2, …, Tk,m, where the number of pulses, m, depends on k (GRX dose), then LH secretion rates ZL(k)(t) are estimated by the model:
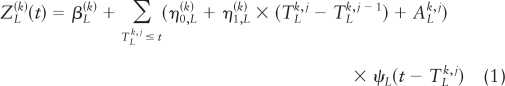 |
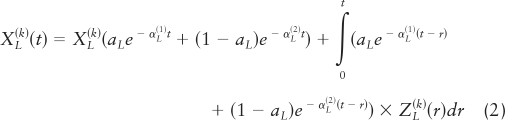
where the amount (mass) of LH secreted per burst (superimposed upon constant basal secretion, β) is taken as constitutive unvarying basal accumulation (designated by the constant η nought) plus a weak linear function (designated by the coefficient η one) of the preceding interpulse interval (equation 1), plus a random effect (A) that allows for biological variability in individual burst mass. Secretory-burst shape is defined as the instantaneous normalized rate of secretion over time, ψL, formulated as a three-parameter generalized Gamma (probability density) function. Then, resultant LH concentrations are given as a convolution of the secretion rates with simultaneously estimated biexponential kinetics.
 |
The observed (measured) LH concentration is the sum of the true concentrations and random variability: YL,i(k) = XL(k)(ti) + εL,i(k), 1 = 1, …, n, where the ε's are independently and identically distributed (IID) Gaussian variables. This yields a Gaussian likelihood, in which there is an increasing number of random effects (m, a function of n). The asymptotic consistency and normality of the maximum likelihood estimate (MLE) was established in Ref. 26. Sample LH secretion rates are estimated as conditional expectations evaluated at the MLE: ẐL,i(k) (i = 1, …, n) = Eθ̂[ZL(k)(ti), i = 1, …, n|YL,i(k), i = 1, …, n]. Secretory-burst mass is defined as the integral of the LH secretion rate over 90 min.
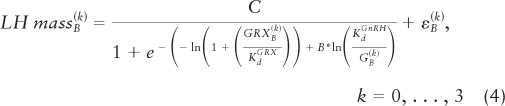
In each subject, fast and slow LH half-lives and LH secretory-burst parameters estimated from the 18-h concentration data were used to calculate LH secretion rates during the 1.5 h after the GnRH bolus: ẐL,i(k) (i = 1, …, N) = Eθ̂[ZL(k)(ti), i = 1, …, N|YL,i(k), i = 1, …, N], for n = 10 observations with each bolus. Thus, one is able to calculate (for each subject) LH secretory-burst mass over each 90-min interval of the 0–18 h: LHmassi(k), i = 1, …, 12, and over the 90-min bolus period: LHmassB(k), k = 0, 1, 2, 3.
2. Model of T concentrations over the 18-h period
Assuming that plasma T associates with SHBG (S) and albumin (A) and that nominal protein-association constants are KaS = 1.0 × 10⁹ m−1 and (apparent) nAKaS= 4.06 × 10⁴ m−1 (27), we calculate forward binding rates (κ̃1) using subject-specific and GRX stratum (k)-specific SHBG and albumin concentrations (28). Thereby total T measurements in each sample yield mean free T concentrations over each 90-min interval from time 0 to 18 h (12 intervals for each GRX stratum), denoted as: FrTi(k), i = 1, …, 12, k = 0, 1, 2, 3.
3. Estimation of the time-varying GRX profile during the 18-h period
GRX was measured in each of the 84 sessions in serum pooled over 17 and 18 h (29). Known amounts of GRX were injected sc at h 2. From the measured value, the time k, j course k, j of GRX concentrations was estimated. Given the long half-life of removal (approximately 15 h), GRX absorption should first increase, then decrease gradually (2, 30). Thus, we assume that the rate of release is a two-parameter Gamma density (area equal to one), multiplied by an unknown GRX mass per unit volume. If the peak time of GRX release is 66 ± 12 min (31), then the two Gamma parameters are β1= 30.25 and β2= 2.18. For a single half-life of elimination of 15 h (900 min), we estimated by convolution time-varying GRX concentrations resulting in the measured value just before GnRH injection. Because of the long GRX half-life, we can assume the mean value over the bolus period to be the assayed value. One can thus calculate (for each subject) the mean GRX concentration over each 90-min interval of the 0–18 h: GRXi(k), i = 1, …, 12, and over the 90-min bolus period: GRXB(k), k = 0, 1, 2, 3.
4. Construction of LH secretory-burst mass as a joint function of GnRH and GRX concentrations and estimation of endogenous GnRH release
Using calculated values in subsections 1–3, as well as the observed bolus GnRH modal (peak) concentration, one can estimate GnRH outflow (concentrations and drive on LH secretion). According to classical concepts of a competitive ligand-receptor interaction, the magnitude of an observed biological response is determined by concentration(s) of the agonist and any competing antagonist and properties of the receptor-effector response pathway (32). These minimal assumptions are satisfied here, because: 1) GnRH is the exclusive or predominant physiological agonist of the cognate human pituitary receptor (kd = 0.85 nm) and 2) GRX (kd = 0.69 nm) acts strictly competitively in vitro and in vivo (13).
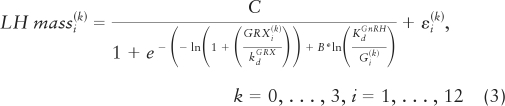
Over the 18-h baseline (pre-GnRH injection) period for each of 21 subjects and for each of four GRX strata, there are 12 LH secretory-burst-mass values and 12 corresponding mean 90-min free T and GRX concentrations. In any one subject, the 48 (4 × 12) T values obtained across the four GRX levels can be arranged in increasing order. Because of the inhibitory nature of T on GnRH release, we assume that the conditional mean of free T-inhibited GnRH release decreases as a function of T. This is formalized below (equation 5), where we suppose that there is an unknown function, denoted by H, which describes GnRH (in ln nm units) as a monotone decreasing function of increasing free T. One aspect of the estimation of the unobserved GnRH values will involve the estimation of the function H. Thus, a plausible model for the system consists of three equations (equations 3–5) describing the GRX-displaced endogenous GnRH-LH dose-response process as well as FrT's inhibition of endogenous GnRH release. Below, the as εi(k) and εB(k) are IID Normal (0, σε,18h2) and Normal (0, σε,Bolus2), respectively, and independent of one another. The letter C denotes GnRH-feedforward efficacy, and B T-feedback sensitivity (slope) term.
 |
 |
We assume that the function H is monotone decreasing. Because the FrTi(k) values are fairly evenly spread throughout the range of 0.02–0.45 nm, the estimated H will tend to be approximately linear (e.g. as ln Gi(k) = α0 + α1 FrTi(k), where α1 < 0). In general, if one only had equation 3, with Gi(k) unknown, the problem would be ill-posed and not solvable. The ordinary solution in such a case is to regularize the problem by requiring that the number of unknowns (parameters) be of lower order than the number of observations. However, the required monotonicity of the 48 GnRH modal values with respect to the corresponding free T values is itself a highly regularizing restriction, which keeps the problem from being overparameterized. The first instance of such monotonicity regularization was the (asymptotic) statistical verification by Grenander in 1956 that a monotonically decreasing probability density function, assumed only to be continuously differentiable, could be estimated without any further restrictions (33, 62), i.e. monotonicity confers sufficient regularization that no reduction in parameter dimension is needed. In the present case, the 48 (unobserved) GnRH modes Gi(k) are required to be monotonically decreasing relative to their corresponding monotonically increasing 48 free T values, wherein the action of free T reflected only through its modulation of (unmeasured) endogenous GnRH concentrations.
To obtain starting estimates for the 48 (endogenous) ln GnRH modes, ln Gi(k), we first create a uniform range of ln GnRH values from ln (0.1 × GB(k)) to ln (2 × GnRH kd). This range is then related to 48 corresponding FrTi(k) values, 48 matching LH secretory-burst-mass values, and 48 GRX concentrations in each subject. In addition, there are four observed bolus-period ln GB(k) and LHmassB(k) values in each individual. The GnRH kd (in ln units), for any given fixed GnRH dose-response sensitivity (B) and efficacy (C), and the competing GRX concentration and kd together determine the degree of rightward-horizontal shift of the dose-response function (equations 3 and 4). Estimation proceeds by allowing the 48 ln GnRH modes (independent variable) to move horizontally (along the x-axis of the dose-response relationship to LH mass) while preserving the monotonic relationship with the 48 free T concentrations in each person. The horizontal ln GnRH movements will be such as to align, as closely as possible, their associated LH mass values (which are on the y-axis) with the corresponding GRX-shifted dose-response curves. That is, the estimation goal comprises the least-squares GnRH modes (in ln units) that minimize the vertical distances between measured and observed LH burst-mass values of the dose-response function while adhering to the T monotonicity constraint. Technically, MLE estimation is implemented with Gaussian likelihoods (equations 3 and 4), where θ is the parameter set: θ = ({Gi(k)), B, C, σε,18h2, σε,Bolus2), and the likelihood functions for the 18 h and bolus are: L18h(θ|18h data), LBolus(θ|Bolus data). For the −log likelihood functions: l18h (θ|18h data) = −ln(L18h(θ|18h data) and lBolus(θ|Bolus data) = −ln(LBolus(θ|Bolus data), the following combined objective function is minimized:
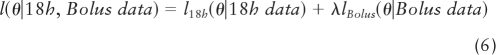 |
where λ is a weight that reflects the relative importance of the bolus data and the18-h data, recognizing that GnRH data are observed directly only in the bolus period. On the likelihood scale, the weighting corresponds to having raised the bolus likelihood contribution to the λ power. Because there are 12 times more values of LH and GRX in the 18-h baseline than in the 1.5-h bolus period, one might expect that a value of λ on the order of 12 is reasonable. However, inasmuch as the bolus period uniquely contains measured GnRH values on which the calibration rests, a value larger than 12 may be more appropriate. To determine the value of λ objectively, MLE of θ was performed on the function l(θ|18h, Bolus data) and the sum of the residual variances σε,18h2 + σε,Bolus2 calculated for each integer value of λ from 1 to 50 in each of the 21 subjects. The grand sum of the variances was then computed over all subjects, and the value of λ estimated at which the grand sum was minimized. This yielded λ=16. The iterative endpoint is maximal correspondence between 48 observed and 48 estimated LH secretory burst-mass values. The final estimated values of ln Gi(k) are then regressed on corresponding Gi(k) values. The resultant 21 slopes, one for each subject, are then related to age.
Results
Supplemental Table 1, published on The Endocrine Society's Journals Online web site at http://endo.endojournals.org, summarizes subject characteristics at baseline. Age and body mass index ranges were 23–72 yr and 20–30 kg/m2, respectively. LH, FSH, T, estradiol (E2), SHBG, and prolactin measurements are given. Only bioavailable and free T concentrations declined with age. Age did not significantly affect 0–18 h baseline (saline stratum) mean LH concentrations (two-sided P = 0.23 for slope) or mean total T concentrations (two-sided P = 0.24 for slope), but was a strong negative correlate of free T concentrations (two-sided P = 0.016 for slope). Age was unrelated to measured GnRH concentrations after bolus GnRH injection (two-sided P = 0.21 for slope) or measured GRX concentrations at any GRX dose [e.g. at the highest dose (GRX = 1.0), two-sided P = 0.13 for slope].
In Materials and Methods, a strategy was presented by which statistical conclusions could be drawn concerning unobserved GnRH outflow. In 21 subjects, LH and T concentrations were measured every 10 min for 18 h. At time 120 min, GRX was administered sc at each of four doses. At 18 h (i.e. at 1080 min), a GnRH bolus was administered iv over 1 min, and LH, T, GRX, and GnRH were measured every 10 min for an additional 90-min period. The combination of the competitive antagonist and agonist allows calibration of unobserved endogenous GnRH signaling during 0–18 h. The first step of the strategy is the recovery of the unobserved time-varying LH and T secretion rates and fitted concentrations via deconvolution. The time-varying free T concentration was estimable as the reconvolution curve (Materials and Methods subsections 1 and 2). Figure 2, A and B, illustrates deconvolution analysis of LH time series in a 27- and 68-yr-old man. The first row displays measured (solid) and fitted (dashed) LH concentrations; the second row gives deconvolved LH secretion rates over the 18-h plus the 90-min bolus period for the four GRX doses; and the third row depicts measured bolus GnRH concentrations. Figure 3, A and B, first and second rows, presents measured total T and calculated free T concentrations in the 27- and 68-yr-old men. The statistical procedure by which to estimate the GRX absorption/release time profile was described in Materials and Methods subsection 3. Figure 3, A and B, third rows, illustrates the estimated time-varying GRX concentrations due to GRX absorption/release after sc injection. The asterisks at 1080 min denote the assayed GRX concentrations.
Fig. 2.

Ten-minute measured LH concentration (top), calculated LH secretion (middle), and injected GnRH concentration (bottom) profiles over 1170 min in a young (27 yr) (A) and older (68 yr) (B) man. Columns give data (left-to-right) at GRX doses of 0, 0.1, 0.3, and 1.0 mg/m2 injected sc at 120 min. The interrupted boldface lines (top) are deconvolution-based fits of the measured LH concentrations (continuous thin lines). GnRH was injected iv at a dose of 100 ng/kg at time 1080 min. Note differences in absolute y-axis scales in the rows, to enhance visualization of the LH patterns for concentrations vs. secretion rates for the two ages shown.
Fig. 3.

A and B illustrate data respectively obtained in younger and older men. Measured T concentration (top), calculated T secretion rate (middle), and time-varying extrapolated GRX concentration (bottom) profiles matching the LH profiles of Fig. 2.
The next step of the strategy was to estimate unobserved GnRH concentrations and GnRH-LH dose-response curves. LH secretory-burst-mass values, mean free T concentrations, and mean GRX concentrations were obtained over each 90-min interval of the full 1170 min [1080-min (18-h) baseline and 90-min bolus] period for each of the four GRX strata, yielding a total of 52 (48 + 4) LH burst-mass values, 52 mean T concentrations, and 52 mean GRX concentrations per subject. In addition, for the 90-min bolus period, a measured modal GnRH concentration is obtained for each of the four GRX levels. The four 90-min T concentrations during the bolus period are not used, because there is no T inhibition of the injected GnRH bolus.
In the present study, systemic free T concentration is assumed to inhibit hypothalamic GnRH output. Materials and Methods presented a logistic model (equations 3 and 4), which describes LH secretory-burst mass as a function of modal GnRH concentration (on natural-log scale). The logistic function then being horizontally shifted to the left due to the level of the competitive agonist GRX (on a natural-log scale). The model concentration of GnRH that feeds forward on LH is defined as the T-inhibited GnRH value. That is, the regulatory dynamics specify that GnRH feeds forward on LH, LH feeds forward on T, and T inhibits GnRH release. To represent such dynamics requires a collection of curves with each point on a curve representing a realizable combination of LH, T-inhibited GnRH, and injected GRX (thus, the conditional mean of LH is a function of T-inhibited GnRH and injected GRX). If one observed the entire system, one could estimate all of the components: LH secretory-burst mass, modal GnRH concentration, free T concentration and GRX concentration. One can then estimate the above logistic dose-response parameters and the negative dependency of GnRH on free T.
To obtain starting estimates for the 48 unobserved endogenous ln modal GnRH concentrations, we first created a uniform range of ln GnRH values from ln (0.1 × GB(k)) to ln (2 × GnRH kd), where GB(k), k = 0, 1, 2, 3 are the modal GnRH concentration observed during the bolus period, under GRX level k. Figure 4 presents these values (as asterisks) on the y-axes in the first row. The range of 48 modes is then related to 48 corresponding free T concentrations, 48 matching LH secretory-burst-mass values and 48 GRX concentrations in each subject. The 48 free T concentrations are first arranged in increasing order, as displayed (by asterisks) on the x-axes of the first row. The 48 decreasing ln GnRH modes (y-axes) are matched to the 48 increasing free T concentrations (x-axes) via a joint plot (as asterisks given in the x-y plane), preserving the required reverse monotonicity. The four observed pairs of bolus-period ln modal GnRH concentrations and LH burst-mass values are given in the second row as rhomboids. In addition, each of the 48 starting ln GnRH modes is assigned to one of the 48 observed free T concentrations, which also have corresponding LH burst-mass and GRX values. The 48 LH secretory-burst masses are plotted against their corresponding 48 starting ln GnRH modes in the second row as asterisks. This procedure creates an initial mapping of 48 ln GnRH modes to 48 LH mass values in a manner such that the corresponding free T values are consistent with the assumed reverse monotonicty between GnRH and free T. The circle on the x-axis designates the GnRH kd.
Fig. 4.

Estimation of T's feedback onto GnRH secretion in a young (age 27 yr) (left) and older (age 68 yr) (right) man. If one observed all the components (LH secretory-burst mass, modal GnRH concentration, free T concentration, and GRX concentration), one could then estimate the logistic dose-response parameters and the negative dependency of GnRH on free T. If one does not observe GnRH, the estimation can still be performed if one additionally requires that the estimated GnRH values have a reverse monotonicity to free T. The details are given in Materials and Methods and Results. The top two rows are steps in the construction of starting values for model estimation, whereas rows three and four are the result of such GnRH and dose-response parameter estimation (for two subjects). First row, The y-axis gives the 48 starting values (90-min time blocks) for endogenous ln GnRH concentrations (asterisks on the y-axis line), assuming initially that values are uniformly distributed between ln (0.1 × GnRH bolus mode) and ln (2 × GnRH kd). The x-axis gives the 48 calculated free T concentrations in the same 90-min time blocks (asterisks on x-axis line) maintaining an inverse monotonicity with ln GnRH. The middle-two rows give regressions of deconvolution-calculated LH secretory-burst mass (IU/liter per 90 min) on measured ln GnRH (nm) modal concentrations. Second row, Exogenous GnRH-driven LH secretory-burst responses are identified by rhomboids (x-axis values are directly measured peak GnRH concentrations after iv injection), and the GnRH kd is marked by the x-axis circle. Initial estimates of endogenous GnRH-driven LH responses are denoted by y-axis asterisks (n = 48). Rows three and four, 1) The family of GRX-shifts of the estimated logistic dose-response function of LH burst mass regressed nonlinearly on ln GnRH (T-inhibited) concentration, and 2) a plot (and linear regression) of ln GnRH against free T concentration. The model estimates the right-shifted dose-response functions linking ln modal GnRH concentrations (x-axis) with LH secretory-burst mass (y-axis) at each of four GRX concentrations (row three, multilined curved bands). Linear regression relates ln modal GnRH concentration ranked in descending order to free T concentration ranked in ascending order (row four, lines). The slope of this regression is a measure of hypothalamic GnRH's sensitivity to T inhibition, and the y-intercept is a measure of maximal (ln) GnRH secretion as free T concentrations approach zero. The slope and the y-intercept terms are regressed on age in Figs. 6 and 7. conc, Concentration.
The model equations 3–5 describe the relationships between LH burst mass and free T, GRX, and GnRH concentration. The GnRH kd (in ln units), any given fixed GnRH dose-response sensitivity (B) and efficacy (C), and the competing GRX concentration and its kd together determine the degree of rightward-horizontal shift of the dose-response function (equations 3 and 4). Because the most direct evidence is from the bolus period (the four rhomboids), in which the ln GnRH value is observed along with the corresponding LH mass, free T and GRX values, the estimation method permits a differential weighting of the information from the 18-h period and the bolus period, allowing for optimal simultaneous estimation of the overall information concerning ln GnRH. That is, the four rhomboids, which denote the observed ln GnRH and LH mass pairs one for each GRX value, are given additional weight in estimating the dose-response parameters, and that weight itself is simultaneously estimated. The details are fully presented in Materials and Methods subsection 4.
In terms of the second row plots of Fig. 4, estimation proceeds by allowing the asterisks to shift horizontally. More particularly, the 48 ln GnRH modes (independent variable) are allowed to move horizontally along the x-axis of the dose-response relationship yielding LH mass (dependent variable) while preserving the monotonic relationship with the 48 free T concentrations in each person. The horizontal ln GnRH movements will be such as to align, so closely as possible, the associated LH mass values (which are on the y-axis) with the corresponding GRX-shifted dose-response curves. Thus, the estimation goal comprises the least-squares GnRH modes (in ln units) that minimize the vertical distances between measured and observed LH burst-mass values of the dose-response function while 1) adhering to the free T monotonicity constraint and 2) using the calibration due to the observed bolus-period ln GnRH modes and LH burst masses.
Figure 4, third row, illustrates the results of simultaneous estimation of the GnRH-LH dose-response function (sensitivity and efficacy parameters, B and C) and the unobserved endogenous (0–18 h) modal GnRH concentrations (the subjects are a 27 and a 68 yr old). The results consist of estimated GRX-displaced endogenous GnRH-LH dose-response curves. Specifically, row three displays the family of GRX-shifted logistic dose-response functions of LH burst mass regressed on ln GnRH (T inhibited) concentration; the asterisks denote the joint LH and ln GnRH pair, which differ vertically from their corresponding GRX-shifted values due to randomness and measurement error. If one did not observe T or GnRH, estimation of the underlying structure would not be possible (the problem is not well posed). However, because one does observe T, and one requires that the reconstruction of the unobserved GnRH values (corresponding to the observed LH and T values) have a reverse monotonicity to free T (equation 5, see Materials and Methods), then the GnRH values can be estimated, if there is a way to properly calibrate them (for example, via the use of an injected GnRH bolus).
Figure 4, fourth row, gives estimated ln GnRH concentrations regressed on corresponding free T concentrations with the least-squares regression line shown. The changes from the plots in the first row to those of the bottom row reflect the estimation process (Materials and Methods). When the 48 GnRH modes are required to decrease monotonically with respect to the 48 monotonically increasing free T concentrations, the constraint enforces approximate linearity. The regression slope and y-intercept serve as respective measures of GnRH's inhibitory sensitivity to T and maximal GnRH secretion (as T inhibition approaches zero). Figure 5 displays the resultant linear regressions of estimated endogenous ln GnRH modes on calculated free T concentrations for all 21 subjects, with the age of the corresponding subject displayed on the right-hand side. The full details of the above estimation method, and their justification, are presented in Materials and Methods.
Fig. 5.

Least-squares regression lines for endogenous modal (peak) GnRH concentration and free T concentration in all 21 subjects. Ages are given on the right. The slopes of these lines are regressed on age in Fig. 8. conc, Concentration.
As a consequence of the estimation procedure for each subject, one obtains 21 estimates of the logistic dose-response sensitivity and efficacy parameters, B and C, unobserved endogenous (0–18 h) modal GnRH concentrations, and regression (slope, y-intercept) parameters from the regression of ln GnRH on free T concentrations. This allows one to test the effects of age on dose-response feedback (T-GnRH) parameter estimates. The four-panel plots in Fig. 6 relate near-maximal GnRH modal values estimated at 70, 80, 90, and 95% of individual maximal GnRH secretion to age (all two-sided P ≥ 0.28 for slope). In each plot, the GnRH modes (asterisks) were estimated at a fraction (0.7, 0.8, 0.9, 0.95) of the maximum of 48 estimated GnRH values in each subject. By formulation, the maximal GnRH mode (single highest value) corresponds to the minimal free T concentration. Even at this extremum (data not shown), two-sided P was 0.10 for the slope on age.
Fig. 6.

Estimated relationships between near-maximal modal GnRH concentrations (nm) calculated at near-zero suppression (low feedback) by free T and age in 21 subjects. Free T is viewed as repressing GnRH secretion noncompetitively. Degree of inhibition of GnRH secretion was defined by multiplying T's inhibitory efficacy by a percentage between zero (complete suppression) and 100 (no suppression). Each GnRH mode (y-axis value) was calculated at four designated values of 70, 80, 90, and 95% of GnRH efficacy. Resultant modal GnRH values in the 21 subjects were then regressed against age, yielding the four panels. None of the four slopes is significantly different from zero (P values are two sided), indicating that the level of GnRH resulting from near-zero free-T suppression is independent of age.
We next assessed the effects of age on the efficacy of T's suppression of GnRH release. The four-panel plots in Fig. 7 relate free T concentrations causing near-maximal suppression of GnRH to age. Four levels of near-minimal GnRH modes, viz. 7.5, 5, 2.5, and 1% of the GnRH kd (0.85 nm), were regressed on age. For near-maximal suppression to 2.5 and 1% of the GnRH kd, there are highly significantly negative slopes on age (two-sided P = 0.03 and P = 0.01 for nonzero slope). Thus, the inhibitory efficacy of T increases with age.
Fig. 7.

Concentrations of free T (nm) that suppress GnRH secretion nearly completely, as a measure of T's inhibitory efficacy. Free T concentrations corresponding to GnRH modes of 7.5, 5, 2.5, and 1% of the GnRH kd (0.85 nm) were calculated in each of 21 subjects and regressed on age in the corresponding panels. P values are two sided. Regressions at the 2.5 and 1% reveal strong age dependence.
Lastly, we evaluated GnRH's sensitivity to T feedback as a function of age. This required regressing the 21 individual slopes obtained by linear regression of each subject's GnRH modes on his free T concentrations on age (Fig. 8). Age strongly heightened (increased the absolute slope of) this negative relationship (two-sided P = 0.003 for nonzero slope). The outcome denotes augmented age-related sensitivity of GnRH release to inhibition by each unit increment in free T concentrations. The results are selective, because least-squares regression of GnRH dose-LH secretory-burst-mass-response parameters on age was nonsignificant for pituitary sensitivity to GnRH (B) (two-sided P = 0.17 for slope), as well as for the mean (two-sided P = 0.19), median (two-sided P = 0.19), and sd (two-sided P = 0.19) of estimated GnRH release. In contradistinction, GnRH's stimulatory efficacy (C) declined significantly with age (two-sided P = 0.01 for nonzero negative slope).
Fig. 8.

Age heightens the sensitivity of GnRH release to T feedback in 21 healthy men. Values are the slopes of the regression of ln GnRH mode on free T concentrations obtained in Fig. 5. The P value is two sided.
Discussion
A previous model of gonadal-axis dynamics predicted attenuation of systemic T's inhibitory feedback onto virtual GnRH-stimulated pituitary LH secretion in the aging male (4). The present revised analytical model quantifies augmentation (heightening) of T feedback onto estimated (externally calibrated) hypothalamic GnRH release in older individuals. These two conclusions are complementary rather than contradictory. In particular, the first model evaluated a virtual (scale independent) continuous GnRH signal defined by its net drive of the LH secretion rate under negative feedback by T and/or its metabolites acting on the combined hypothalamic release and pituitary effect of endogenous GnRH (4, 5). To obviate this duality of interpretation, we here introduce a complementary ensemble construct of T-related feedback onto hypothalamic GnRH release with no direct T effect on pituitary GnRH action. The new analysis of T feedback at the hypothalamic level indicates that age strongly augments T's inhibition of brain GnRH secretion, thereby putatively reducing GnRH's availability at the pituitary to stimulate LH pulses. In conjunction with the earlier outcome (4), the new findings provide a logical explanation for previously conflicting conclusions in the literature that age both reduces and accentuates suppression of LH secretion by systemic concentrations of T or its metabolites (see introductory section). The emergent concept would be that age attenuates T feedback at the pituitary level and augments T feedback on the hypothalamus.
From a mechanistic perspective, untransformed T and 5 α-reduced dihydrotestosterone are both capable of inhibiting hypothalamic GnRH release without blocking GnRH's direct actions on the pituitary in vivo in the ram, monkey, and human (8, 9, 12, 34–37). In contrast, T's aromatization to E2 can mediate inhibition of both pituitary GnRH action and hypothalamic GnRH release (37–41). Although precise sites of sex-steroid feedback in the human gonadal axis are more difficult to establish, the present and earlier data (4) together allow the integrative hypothesis that age-related factors may regulate local hypothalamo-pituitary biotransformation of T to E2 or to dihydrotestosterone and thereby augment or mute hypothalamic and pituitary feedback. For example, reduced pituitary aromatase activity and increased hypothalamic androgen receptor or 5 α-reductase activity in older men could in principle explain age-associated differences in T's feedback onto GnRH and LH outflow (42, 43). The predominance of one mechanism over the other may depend upon estrogen receptor-isoform or membrane-receptor expression, body composition, age, fasting, metabolic stress, or other factors that modulate multipathway feedback adaptations (10, 41, 44–46).
Increased age was associated with highly specific findings. First, estimates of the free T concentration necessary to suppress GnRH outflow nearly maximally (to 2.5 or 1% of the GnRH kd) were strongly age dependent (P = 0.03 and P = 0.01, respectively). At (extrapolated) age 20 yr, the 1%-kd suppression threshold was 3.2 nm free T; and at age 80 yr, the threshold fell to 1.4 nm free T. These estimates of inhibitory efficacy can be compared with a mean free T concentration at baseline in the overall cohort of 0.36 nm, thus signifying physiological relevance.
A second major outcome was age-related heightening of hypothalamic sensitivity to T's suppression of estimated GnRH secretory-burst size (defined by its mode). This outcome must be distinguished from the inferred age independence of pituitary sensitivity to GnRH. By construction, the natural logarithms of peak GnRH concentrations (GnRH modes) varied negatively with free T concentrations, thereby defining negative feedback. Regression analysis showed that the slopes of these relationships in the 21 subjects became more negative with age, denoting greater sensitivity to feedback inhibition by free T with age (P = 0.003). This means that older age is marked by heightened sensitivity of hypothalamic GnRH release to inhibition by any given unit increase in free T concentrations. How this occurs is not known. However, reports in experimental animals have suggested that age reduces brain, pituitary, prostate, or skin concentrations of androgen receptor and estrogen receptor and hypothalamic GnRH neuroterminal and tanycyte numbers (47–51). In some species, age might also affect neurotransmitter pathways that modulate or mediate T's feedback onto GnRH secretion (8, 9, 34, 52).
A third prominent analytical finding was that maximal GnRH action at the pituitary level (GnRH efficacy) declines with age (P = 0.01). This was especially evident at low free T concentrations, consistent with the fact that GnRH efficacy in the human depends upon systemic T availability (42). A decrease in GnRH efficacy with age has been inferred in some but not all other studies in animals and humans (1, 23, 53, 54). A limitation of earlier investigations is that none was analyzed across multiple strata of free T concentrations under a calibrating exogenous GnRH pulse. Attenuated maximal GnRH action on the pituitary should be distinguished from reduced GnRH release to the pituitary, as inferred in the rat and monkey, respectively (55, 56).
Feedback estimates presented here used free T concentrations, according to the free hormone hypothesis (57). Earlier we showed that estimates of T feedback at the pituitary level decrease with age independently of using total, bioavailable, or free T concentrations as the feedback signal (4). We have not reevaluated this point in the present hypothalamic-feedback model, because for a 10-min sampling, the relative concentrations of various T moieties remain strongly correlated.
Caveats include the relatively small sample size of 21 individuals, although each was studied four times over an interval of 19.5 h (yielding 9828 LH and 9828 T measurements). Analyses assumed literature-based association constants for receptor binding by GnRH and GRX, and plasma-protein binding by T. The possibility that human GnRH-receptor affinities and T protein-binding equilibrium constants vary with age cannot be excluded. Although there is no direct precedence for this notion (58, 59), a model to estimate such constants in individual subjects would be helpful. T measurements in peripheral blood may not be representative of hypothalamo-pituitary interstitial T concentrations. In situ microdialysis could provide a way to make such estimates in animal models (60). Binding to and signaling by a receptor may have different concentration dependencies; e.g. for the in vitro-expressed human GnRH receptor, midmaximal binding occurs at 2.8 nm and midmaximal phospholipid signaling at 0.7 nm (61). Ultimately, direct measurements of GnRH, LH and T in hypothalamo-pituitary portal blood as a function of age in a longitudinal setting will be important to appraise causality.
In conclusion, a combined experimental and analytical strategy to quantify systemic T-dependent feedback onto hypothalamic GnRH secretion provides regulatory insights in the male gonadal axis strongly complementary to inferences achieved with a pituitary-feedback construct (4). A unifying hypothesis would be that age attenuates T feedback onto pituitary LH secretion (4) while potentiating T feedback onto hypothalamic GnRH secretion (present data). Further model development will be required to quantify simultaneous contributions of hypothalamic and pituitary T feedback to pulsatile GnRH and LH secretion.
Acknowledgments
We thank Jill Smith for support of manuscript preparation, Ashley Bryant for data analysis and graphics, the Mayo Immunochemical Laboratory for assay assistance, and the Mayo research nursing staff for implementing the protocol.
This work was supported in part by the National Center for Research Resources Grant 1 UL 1 RR024150 via the Center for Translational Science Activities and by National Institutes of Health Grants R01 AG023777, R01 AG031763, and DK50456 (Metabolic Studies Core of the Minnesota Obesity Center).
Disclosure Summary: The authors have nothing to disclose.
Footnotes
- E2
- Estradiol
- GRX
- ganirelix
- kd
- dissociation constant
- MLE
- maximum likelihood estimate
- SHBG
- sex hormone-binding globulin
- T
- testosterone.
References
- 1. Urban RJ, Evans WS, Rogol AD, Kaiser DL, Johnson ML, Veldhuis JD. 1988. Contemporary aspects of discrete peak detection algorithms. I. The paradigm of the luteinizing hormone pulse signal in men. Endocr Rev 9:3–37 [DOI] [PubMed] [Google Scholar]
- 2. Veldhuis JD, Keenan DM, Pincus SM. 2008. Motivations and methods for analyzing pulsatile hormone secretion. Endocr Rev 29:823–864 [DOI] [PMC free article] [PubMed] [Google Scholar]
- 3. Keenan DM, Alexander S, Irvine CH, Clarke I, Scott C, Turner A, Tilbrook AJ, Canny BJ, Veldhuis JD. 2004. Reconstruction of in vivo time-evolving neuroendocrine dose-response properties unveils admixed deterministic and stochastic elements. Proc Natl Acad Sci USA 101:6740–6745 [DOI] [PMC free article] [PubMed] [Google Scholar]
- 4. Keenan DM, Takahashi PY, Liu PY, Roebuck PD, Nehra AX, Iranmanesh A, Veldhuis JD. 2006. An ensemble model of the male gonadal axis: illustrative application in aging men. Endocrinology 147:2817–2828 [DOI] [PubMed] [Google Scholar]
- 5. Keenan DM, Veldhuis JD. 2009. Age-dependent regression analysis of male gonadal axis. Am J Physiol Regul Integr Comp 297:R1215–R1227 [DOI] [PMC free article] [PubMed] [Google Scholar]
- 6. Shin SH, Howitt C. 1975. Effect of castration on luteinizing hormone and luteinizing hormone releasing hormone in the male rat. J Endocrinol 65:447–448 [DOI] [PubMed] [Google Scholar]
- 7. Ellis GB, Desjardins C. 1984. Orchidectomy unleashes pulsatile luteinizing hormone secretion in the rat. Bio Reprod 30:619–627 [DOI] [PubMed] [Google Scholar]
- 8. Veldhuis JD, Urban RJ, Dufau ML. 1992. Evidence that androgen negative-feedback regulates hypothalamic GnRH impulse strength and the burst-like secretion of biologically active luteinizing hormone in men. J Clin Endocrinol Metab 74:1227–1235 [DOI] [PubMed] [Google Scholar]
- 9. Tilbrook AJ, Clarke IJ. 2001. Negative feedback regulation of the secretion and actions of gonadotropin-releasing hormone in males. Biol Reprod 64:735–742 [DOI] [PubMed] [Google Scholar]
- 10. Shakil T, Hoque AN, Husain M, Belsham DD. 2002. Differential regulation of gonadotropin-releasing hormone secretion and gene expression by androgen: membrane versus nuclear receptor activation. Mol Endocrinol 16:2592–2602 [DOI] [PubMed] [Google Scholar]
- 11. Jackson GL, Kuehl D, Rhim TJ. 1991. Testosterone inhibits gonadotropin-releasing hormone pulse frequency in the male sheep. Bio Reprod 45:188–194 [DOI] [PubMed] [Google Scholar]
- 12. Kerrigan JR, Veldhuis JD, Rogol AD. 1994. Androgen-receptor blockade enhances pulsatile luteinizing hormone production in late pubertal males: evidence for a hypothalamic site of physiological androgen feedback action. Pediatr Res 35:102–106 [DOI] [PubMed] [Google Scholar]
- 13. Beckers T, Bernd M, Kutscher B, Kühne R, Hoffmann S, Reissmann T. 2001. Structure-function studies of linear and cyclized peptide antagonists of the GnRH receptor. Biochem Biophys Res Commun 289:653–663 [DOI] [PubMed] [Google Scholar]
- 14. Winters SJ, Sherins RJ, Troen P. 1984. The gonadotropin-suppressive activity of androgen is increased in elderly men. Metabolism 33:1052–1059 [DOI] [PubMed] [Google Scholar]
- 15. Mulligan T, Iranmanesh A, Johnson ML, Straume M, Veldhuis JD. 1997. Aging alters feedforward and feedback linkages between LH and testosterone in healthy men. Am J Physiol 273:R1407–R1413 [DOI] [PubMed] [Google Scholar]
- 16. Muta K, Kato K, Akamine Y, Ibayashi H. 1981. Age-related changes in the feedback regulation of gonadotrophin secretion by sex steroids in men. Acta Endocrinol 96:154–162 [DOI] [PubMed] [Google Scholar]
- 17. Deslypere JP, Kaufman JM, Vermeulen T, Vogelaers D, Vandalem JL, Vermeulen A. 1987. Influence of age on pulsatile luteinizing hormone release and responsiveness of the gonadotrophs to sex hormone feedback in men. J Clin Endocrinol Metab 64:68–73 [DOI] [PubMed] [Google Scholar]
- 18. Veldhuis JD, Iranmanesh A, Keenan DM. 2004. Erosion of endogenous testosterone-driven negative feedback on pulsatile LH secretion in healthy aging men. J Clin Endocrinol Metab 89:5753–5761 [DOI] [PubMed] [Google Scholar]
- 19. Liu PY, Takahashi PY, Roebuck PD, Veldhuis JD. 2006. Age or factors associated with aging attenuate testosterone's concentration-dependent enhancement of the regularity of luteinizing hormone secretion in healthy men. J Clin Endocrinol Metab 91:4077–4084 [DOI] [PubMed] [Google Scholar]
- 20. Clarke IJ, Cummins JT. 1982. The temporal relationship between gonadotropin-releasing hormone (GnRH) and luteinizing hormone (LH) secretion in ovariectomized ewes. Endocrinology 111:1737–1739 [DOI] [PubMed] [Google Scholar]
- 21. Liu PY, Pincus SM, Takahashi PY, Roebuck PD, Iranmanesh A, Keenan DM, Veldhuis JD. 2006. Aging attenuates both the regularity and joint synchrony of LH and testosterone secretion in normal men: analyses via a model of graded GnRH receptor blockade. Am J Physiol 290:E34–E41 [DOI] [PubMed] [Google Scholar]
- 22. Veldhuis JD, O'Dea LS, Johnson ML. 1989. The nature of the gonadotropin-releasing hormone stimulus-luteinizing hormone secretory response of human gonadotrophs in vivo. J Clin Endocrinol Metab 68:661–670 [DOI] [PubMed] [Google Scholar]
- 23. Zwart AD, Urban RJ, Odell WD, Veldhuis JD. 1996. Contrasts in the gonadotropin-releasing dose-response relationships for luteinizing hormone, follicle-stimulating hormone, and α-subunit release in young versus older men: appraisal with high-specificity immunoradiometric assay and deconvolution analysis. Eur J Endocrinol 135:399–406 [DOI] [PubMed] [Google Scholar]
- 24. Sealfon SC, Weinstein H, Millar RP. 1997. Molecular mechanisms of ligand interaction with the gonadotropin-releasing hormone receptor. Endocr Rev 18:180–205 [DOI] [PubMed] [Google Scholar]
- 25. Liu PY, Keenan DM, Kok P, Padmanabhan V, O'Byrne KT, Veldhuis JD. 2009. Sensitivity and specificity of pulse detection using a new deconvolution method. Am J Physiol Endo Metab 297:E538–E544 [DOI] [PMC free article] [PubMed] [Google Scholar]
- 26. Chattopadhyay S, Veldhuis JD, Keenan DM. 2008. Probabilistic recovery of pulsatile, secretory and kinetic structure: an alternating discrete and continuous schema. Quarterly Appl Math 66:401–421 [Google Scholar]
- 27. Sodergard R, Backstrom T, Shanbhag V, Carstensen H. 1982. Calculation of free and bound fractions of testosterone and estradiol-17 β to human plasma proteins at body temperature. J Steroid Biochem Mol Biol 16:801–810 [DOI] [PubMed] [Google Scholar]
- 28. Keenan DM, Veldhuis JD. 2004. Divergent gonadotropin-gonadal dose-responsive coupling in healthy young and aging men. Am J Physiol 286:R381–R389 [DOI] [PubMed] [Google Scholar]
- 29. Takahashi PY, Liu PY, Roebuck PD, Iranmanesh A, Veldhuis JD. 2005. Graded inhibition of pulsatile LH secretion by a selective GnRH-receptor antagonist in healthy men: evidence that age attenuates hypothalamic GnRH outflow. J Clin Endocrinol Metab 90:2768–2774 [DOI] [PMC free article] [PubMed] [Google Scholar]
- 30. Pechstein B, Nagaraja NV, Hermann R, Romeis P, Locher M, Derendorf H. 2000. Pharmacokinetic-pharmacodynamic modeling of testosterone and luteinizing hormone suppression by cetrorelix in healthy volunteers. J Clin Pharmacol 40:266–274 [DOI] [PubMed] [Google Scholar]
- 31. Gillies PS, Faulds D, Balfour JA, Perry CM. 2000. Ganirelix. Drugs 59:107–111; discussion 112–113 [DOI] [PubMed] [Google Scholar]
- 32. Keenan DM, Veldhuis JD. 2003. Mathematical modeling of receptor-mediated interlinked systems. Encyclopedia of hormones. San Diego: Academic Press; 286–294 [Google Scholar]
- 33. Grenander U. 1956. On the theory of mortality measurement, I. Skand Aktuarietidskrift 39:70–96 [Google Scholar]
- 34. Veldhuis JD, Rogol AD, Samojlik E, Ertel NH. 1984. Role of endogenous opiates in the expression of negative feedback actions of estrogen and androgen on pulsatile properties of luteinizing hormone secretion in man. J Clin Invest 74:47–55 [DOI] [PMC free article] [PubMed] [Google Scholar]
- 35. Scott CJ, Clarke IJ, Rao A, Tilbrook AJ. 2004. Sex differences in the distribution and abundance of androgen receptor mRNA-containing cells in the preoptic area and hypothalamus of the ram and ewe. J Neuroendocrinol 16:956–963 [DOI] [PubMed] [Google Scholar]
- 36. Kawakami S, Winters SJ. 1999. Regulation of lutenizing hormone secretion and subunit messenger ribonucleic acid expression by gonadal steroids in perifused pituitary cells from male monkeys and rats. Endocrinology 140:3587–3593 [DOI] [PubMed] [Google Scholar]
- 37. Schnorr JA, Bray MJ, Veldhuis JD. 2001. Aromatization mediates testosterone's short-term feedback restraint of 24-hour endogenously driven and acute exogenous GnRH-stimulated LH and FSH secretion in young men. J Clin Endocrinol Metab 86:2600–2606 [DOI] [PubMed] [Google Scholar]
- 38. Spratt DP, Herbison AE. 1997. Regulation of preoptic area gonadotrophin-releasing hormone (GnRH) mRNA expression by gonadal steroids in the long-term gonadectomized male rat. Brain Res Mol Brain Res 47:125–133 [DOI] [PubMed] [Google Scholar]
- 39. T'Sjoen GG, Giagulli VA, Delva H, Crabbe P, De Bacquer D, Kaufman JM. 2005. Comparative assessment in young and elderly men of the gonadotropin response to aromatase inhibition. J Clin Endocrinol Metab 90:5712–5722 [DOI] [PubMed] [Google Scholar]
- 40. Belsham DD, Evangelou A, Roy D, Duc VL, Brown TJ. 1998. Regulation of gonadotropin-releasing hormone (GnRH) gene expression by 5 α-dihydrotestosterone in GnRH-secreting GT1-7 hypothalamic neurons. Endocrinology 139:1108–1114 [DOI] [PubMed] [Google Scholar]
- 41. Ng Y, Wolfe A, Novaira HJ, Radovick S. 2009. Estrogen regulation of gene expression in GnRH neurons. Mol Cell Endocrinol 303:25–33 [DOI] [PMC free article] [PubMed] [Google Scholar]
- 42. Veldhuis JD, Iranmanesh A, Mulligan T. 2005. Age and testosterone feedback jointly control the dose-dependent actions of gonadotropin-releasing hormone in healthy men. J Clin Endocrinol Metab 90:302–309 [DOI] [PMC free article] [PubMed] [Google Scholar]
- 43. Kaufman JM, Giri M, Deslypere JM, Thomas G, Vermeulen A. 1991. Influence of age on the responsiveness of the gonadotrophs to luteinizing hormone-releasing hormone in males. J Clin Endocrinol Metab 72:1255–1260 [DOI] [PubMed] [Google Scholar]
- 44. Zhang C, Bosch MA, Levine JE, Rønnekleiv OK, Kelly MJ. 2007. Gonadotropin-releasing hormone neurons express K(ATP) channels that are regulated by estrogen and responsive to glucose and metabolic inhibition. J Neurosci 27:10153–10164 [DOI] [PMC free article] [PubMed] [Google Scholar]
- 45. Noel SD, Keen KL, Baumann DI, Filardo EJ, Terasawa E. 2009. Involvement of G protein-coupled receptor 30 (GPR30) in rapid action of estrogen in primate LHRH neurons. Mol Endocrinol 23:349–359 [DOI] [PMC free article] [PubMed] [Google Scholar]
- 46. Smith JT, Dungan HM, Stoll EA, Gottsch ML, Braun RE, Eacker SM, Clifton DK, Steiner RA. 2005. Differential regulation of KiSS-1 gene expression by sex steroids in the brain of the male mouse. Endocrinology 146:2976–2984 [DOI] [PubMed] [Google Scholar]
- 47. Shain SA, Axelrod LR. 1973. Reduced high affinity 5 α-dihydrotestosterone receptor capacity in the ventral prostate of the aging rat. Steroids 21:801–812 [DOI] [PubMed] [Google Scholar]
- 48. Haji M, Kato KI, Nawata H, Ibayashi H. 1981. Age-related changes in the concentrations of cytosol receptors for sex steroid hormones in the hypothalamus and pituitary gland of the rat. Brain Res 204:373–386 [DOI] [PubMed] [Google Scholar]
- 49. Rajfer J, Namkung PC, Petra PH. 1980. Identification, partial characterization and age-related changes of a cytoplasmic androgen receptor in the rat penis. J Steroid Biochem 13:1489–1492 [DOI] [PubMed] [Google Scholar]
- 50. Zoli M, Ferraguti F, Frasoldati A, Biagini G, Agnati LF. 1995. Age-related alterations in tanycytes of the mediobasal hypothalamus of the male rat. Neurobiol Aging 16:77–83 [DOI] [PubMed] [Google Scholar]
- 51. Yin W, Wu D, Noel ML, Gore AC. 2009. Gonadotropin-releasing hormone neuroterminals and their microenvironment in the median eminence: effects of aging and estradiol treatment. Endocrinology 150:5498–5508 [DOI] [PMC free article] [PubMed] [Google Scholar]
- 52. Miller GM, Gibson MJ. 1994. Opioidergic modulation of N-methyl-D,L-aspartic-acid-stimulated LH release in young adult but not older male mice. Neuroendocrinol 59:277–284 [DOI] [PubMed] [Google Scholar]
- 53. Mulligan T, Iranmanesh A, Kerzner R, Demers LW, Veldhuis JD. 1999. Two-week pulsatile gonadotropin releasing hormone infusion unmasks dual (hypothalamic and Leydig-cell) defects in the healthy aging male gonadotropic axis. Eur J Endocrinol 141:257–266 [DOI] [PubMed] [Google Scholar]
- 54. Iranmanesh A, Mulligan T, Veldhuis JD. 2010. Age in men does not determine GnRH's dose-dependent stimulation of luteinizing hormone secretion under an exogenous testosterone clamp. J Clin Endocrinol Metab 95:2877–2884 [DOI] [PMC free article] [PubMed] [Google Scholar]
- 55. Gore AC, Windsor-Engnell BM, Terasawa E. 2004. Menopausal increases in pulsatile gonadotropin-releasing hormone release in a nonhuman primate (Macaca mulatta). Endocrinology 145:4653–4659 [DOI] [PubMed] [Google Scholar]
- 56. Rubin BS, Bridges RS. 1989. Alterations in luteinizing hormone-releasing hormone release from the mediobasal hypothalamus of ovariectomized, steroid-primed middle-aged rats as measured by push-pull perfusion. Neuroendocrinol 49:225–232 [DOI] [PubMed] [Google Scholar]
- 57. Mendel CM. 1989. The free hormone hypothesis: a physiologically based mathematical model. Endocr Rev 10:232–274 [DOI] [PubMed] [Google Scholar]
- 58. Limonta P, Dondi D, Maggi R, Martini L, Piva F. 1988. Effects of aging on pituitary and testicular luteinizing hormone-releasing hormone receptors in the rat. Life Sci 42:335–342 [DOI] [PubMed] [Google Scholar]
- 59. Sonntag WE, Forman LJ, Fiori JM, Hylka VW, Meites J. 1984. Decreased ability of old male rats to secrete luteinizing hormone (LH) is not due to alterations in pituitary LH-releasing hormone receptors. Endocrinology 114:1657–1664 [DOI] [PubMed] [Google Scholar]
- 60. Remage-Healey L, Maidment NT, Schlinger BA. 2008. Forebrain steroid levels fluctuate rapidly during social interactions. Nat Neurosci 11:1327–1334 [DOI] [PMC free article] [PubMed] [Google Scholar]
- 61. Lu ZL, Gallagher R, Sellar R, Coetsee M, Millar RP. 2005. Mutations remote from the human gonadotropin-releasing hormone (GnRH) receptor-binding sites specifically increase binding affinity for GnRH II but not GnRH I: evidence for ligand-selective, receptor-active conformations. J Biol Chem 280:29796–29803 [DOI] [PubMed] [Google Scholar]
- 62. Grenander U. 1957. On the theory of mortality measurement, II. Skand Aktuarietidskrift 39:125–153 [Google Scholar]