

Abstract
During their development, B lymphocytes undergo V(D)J recombination events and selection processes that, if successfully completed, produce mature B cells expressing a non-self-reactive B-cell receptor (BCR). Primary V(D)J rearrangements yield self-reactive B cells at high frequency, triggering attempts to remove, silence, or reprogramme them through deletion, anergy induction, or secondary V(D)J recombination (receptor editing), respectively. In principle, expressing a catalytically inactive V(D)J recombinase during a developmental stage in which V(D)J rearrangement is initiated may impair this process. To test this idea, we generated transgenic mice expressing a RAG1 active site mutant (dnRAG1 mice); RAG1 transcript was elevated in splenic, but not bone marrow, B cells in dnRAG1 mice relative to wild-type mice. The dnRAG1 mice accumulate splenic B cells with a B1-like phenotype that exhibit defects in B-cell activation, and are clonally diverse, yet repertoire restricted with a bias toward Jκ1 gene segment usage. The dnRAG1 mice show evidence of impaired B-cell development at the immature-to-mature transition, immunoglobulin deficiency, and poorer immune responses to thymus-independent antigens. Interestingly, dnRAG1 mice expressing the anti-dsDNA 3H9H56R heavy chain fail to accumulate splenic B1-like cells, yet retain peritoneal B1 cells. Instead, these mice show an expanded marginal zone compartment, but no difference is detected in the frequency of heavy chain gene replacement. Taken together, these data suggest a model in which dnRAG1 expression impairs secondary V(D)J recombination. As a result, selection and/or differentiation processes are altered in a way that promotes expansion of B1-like B cells in the spleen.
Keywords: 3H9H56R, anti-dsDNA, B1 B cell, marginal zone B cell, receptor editing, V(D)J recombination
Introduction
A key hallmark of B-cell and T-cell maturation is the acquisition of a unique antigen-binding receptor. The antigen-binding regions of these receptors are encoded in germ-line arrays of variable (V), diversity (D) and joining (J) gene segments that undergo rearrangement by the RAG1 and RAG2 proteins during lymphocyte development though a process known as V(D)J recombination to generate functional antigen receptor genes.1 In B cells, primary V(D)J rearrangements of immunoglobulin heavy and light chain genes yield B-cell receptors (BCRs) of diverse antigenic specificity, some of which exhibit self-reactivity. Three mechanisms are known to help control B-cell autoreactivity.2 In one mechanism, those cells whose BCRs recognize (typically multivalent) self-antigen can undergo developmental arrest and initiate secondary V(D)J rearrangements to ‘edit’ receptor specificity away from autoreactivity (receptor editing). Alternatively, autoreactive B cells may be removed from the repertoire via clonal deletion or silenced through induction of anergy. In this way, the mature naive B-cell repertoire is rendered self-tolerant. V(D)J recombination may also be re-initiated to ‘revise’ the antigenic specificity of B cells in response to immunization or infection, or under conditions of autoimmunity (receptor revision).3,4
Extensive mutagenesis of the RAG proteins has identified three carboxylate residues comprising a ‘DDE motif’ in RAG1 that, when mutated, reduce cleavage and recombination activity dramatically, without perturbing protein–DNA complex formation.5–7 Co-expression of RAG1 bearing mutations in the DDE motif (one, two or three residues) inhibits wild-type RAG1 activity in a dose-dependent manner in a cell-culture-based plasmid V(D)J recombination assay.8 These data led us to hypothesize that over-expressing a catalytically inactive form of RAG1 in vivo could interfere with the ability of the endogenous RAG proteins to mediate primary or secondary rearrangements through a dominant negative effect. To test this hypothesis, we generated transgenic mice expressing a full-length form of RAG1 containing a fully alanine-substituted DDE motif using an H-2Kb promoter and an IgH-μ enhancer construct9 to preferentially drive transgene expression in lymphocytes (dnRAG1 mice). Interestingly, we obtained two independently derived founder lines that reproducibly accumulate a clonally diverse, yet repertoire-restricted, B220lo CD19+ B-cell population. These cells display phenotypic and functional properties similar to the splenic B1 B cell, including the expression of CD5. The dnRAG1 mice show no apparent defects in T-cell development or in early B-cell development, but B-cell progression past the transitional T1 stage in the spleen is impaired, which correlates with the selective over-expression of the dnRAG1 transgene (relative to endogenous RAG1) in the spleen compared with bone marrow or thymus. The dnRAG1 mice exhibit a moderate deficiency in serum IgM and IgG levels, and impaired immune responses to thymus-independent antigens. Notably, when receptor specificity is enforced in dnRAG1 mice by the expression of a functionally rearranged heavy chain transgene reactive to dsDNA that is normally subjected to receptor editing in the bone marrow, B1-like B-cell accumulation and B-cell progression through the immature and T1 stages of development are substantially impaired, and are associated with expansion of the marginal zone B-cell compartment. Taken together, these data support a model in which peripheral over-expression of catalytically inactive RAG1 impairs receptor editing during the immature/transitional T1 stage, resulting in abnormal progression to a B1-like B-cell.
Materials and methods
Transgenic mice
A cDNA encoding untagged, full-length murine RAG1 containing alanine substitutions in all three residues of the DDE motif (dnRAG1) was derived by subcloning DNA fragments from published mutant RAG1 expression constructs generated using recombination PCR mutagenesis10 into the mammalian RAG1 expression construct pcRAG1.11 Diagnostic restriction sites have been engineered into the DNA sequence for each corresponding alanine substitution (D600A, FspI; D708A, AgeI; E962A, NsiI). A BamHI fragment containing the dnRAG1 cDNA sequence was subcloned into the BamHI site of the vector pHSE3’9, placing the transgene under the transcriptional control of an H-2Kb promoter and the Eμ enhancer (see Fig. 1a). The pHSE3’ dnRAG1 was digested with XhoI to liberate the transgene construct, which was introduced into B6SJL/F2 eggs by pronuclear microinjection using a commercial vendor (Xenogen Biosciences, Cranbury, NJ). The dnRAG1 transgene-positive founder animals were identified by Southern hybridization and were bred with normal C57BL/6 mice to generate individual mouse lines. The lines used in this study have been back-crossed to C57BL/6 mice for over 10 generations. Homozygous 3H9H56R transgenic (56Rki) mice12 on a C57BL/6 background were kindly provided by Dr Martin Weigert (University of Chicago). Animals used for these studies were maintained in individually ventilated microisolator cages in an AAALAC certified animal facility at Creighton University. Experimental procedures were reviewed and approved by the Creighton Institutional Animal Care and Use Committee.
Figure 1.
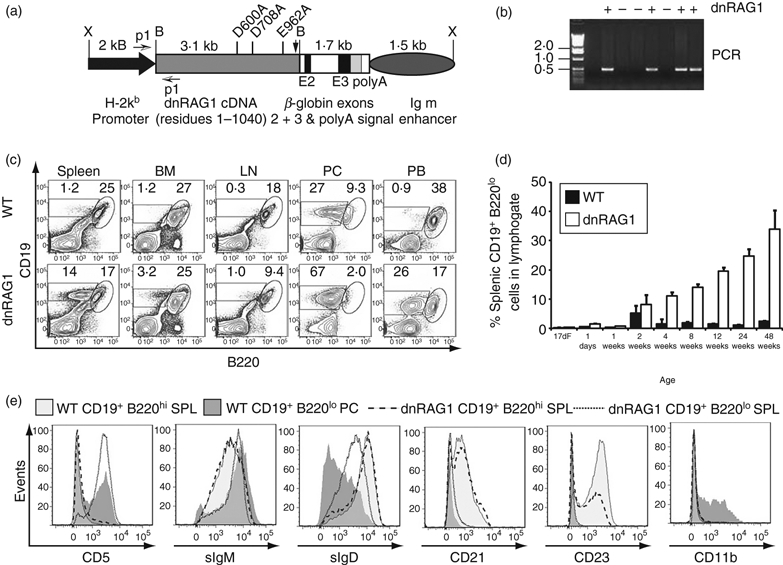
B1-like B cells accumulate in dnRAG1 mice. (a) Diagram of the transgene construct used in this study showing the mutant full-length RAG1 cDNA [including the position of codons encoding alanine substitutions in the DDE motif as well as the stop codon (arrow)], all regulatory elements, and the BamHI (B) and XhoI (X) sites used for releasing the RAG1 cDNA or the entire transgene for generating transgenic mice. Primers used for genotyping are indicated by arrows (p1). (b) PCR genotyping of transgenic mice. (c) An expanded CD19+ B220lo B-cell population is detected in spleen, bone marrow (BM), mesenteric lymph nodes (LN), peritoneal cavity (PC) and peripheral blood (PB) of dnRAG1 mice compared with wild-type (WT) mice at 12 weeks of age by flow cytometry. Percentages of cells in the indicated B220lo and B220hi gates are shown. (d) The percentage of splenic CD19+ B220lo B cells was evaluated in WT and dnRAG1 mice as a function of time from fetal day 17 (17dF) to 48 weeks of age. Differences are highly significant from 4 weeks of age onward (P<0·001). (E) The expression of CD5, sIgM, sIgD, CD21, CD23 and CD11b were compared between gated WT and dnRAG1 splenic CD19+ B220hi B cells (light grey shading or dashed line, respectively), WT PC CD19+ B220lo B cells (dark grey shading), and dnRAG1 CD19+ B220lo B cells (dotted line). Notice that the expression pattern of splenic CD19+ B220lo B cells from dnRAG1 mice more closely resembles WT PC CD19+ B220lo B cells than WT splenic CD19+ B220hi B cells.
Genotyping
Genomic DNA obtained from tail biopsies (10 μg) was digested with BamHI and subjected to Southern hybridization using a digoxigenin-labelled RAG1 BsrGI restriction fragment encoding residues 484–727 (RAG1 probe). Hybridization was visualized using the digoxigenin-High Prime reagent (Roche Molecular Biochemicals, Mannheim, Germany). Alternatively, genotype was determined by PCR using primers specific for sequences in the H2Kb promoter and RAG1 [H2Kb For (5′-GATCAGAACTCGGAGACGAC-3′) and R1187 Rev (5′-ACCAGGCTTCTCTGGAACTAC-3′), respectively).
Transgene expression analysis
RNA was isolated from the thymus, spleen, lymph node, bone marrow and liver of 12-week-old transgenic and non-transgenic littermate mice using the RNAgents total RNA isolation system (Promega, Madison, WI). First-strand cDNA was prepared from total RNA using the TaqMan Reverse Transcription Reagents (Applied Biosystems, Foster City, CA) according to the manufacturer's instructions, and subjected to quantitative PCR (qPCR) to compare RAG1 expression levels between dnRAG1 transgenic and non-transgenic mice. RNA was prepared from thymus, spleen and liver of 1-week-old mice, or FACS-isolated B cells using Tri-Reagent (Ambion, Austin, TX) and bromochloropropane by phase separation, and precipitated with isopropanol.13 Samples for qPCR were assembled in duplicate using the SYBR Green PCR Master Mix (Applied Biosystems) with various primer sets. Endogenous and transgene-specific RAG1 transcripts were detected using RAG1-specific primers (5′-ATGGCTGCCTCCTTGCCGTCTACC-3′, RAG1 sense; and 5′-CTGAGGAATCCTTCTCCTTCTGTG-3′, RAG1 antisense), and transgene-specific primers (5′-TGGGCATTGAGGACTCTCTGGAAA-3′, RAG1 sense; and 5′-GTCCCATAGACTCACCCTGAAGTT-3′, antisense human β-globin), respectively. β-Actin transcripts were detected using primers described previously.14 The qPCR was performed on an ABI PRISM 7700 Sequence Detector running the Sequence Detection System software (Applied Biosystems) according to the following thermal cycling protocol: 50° for 2 min, followed by 95° for 10 min, and then 35 cycles of amplification (95° for 15 seconds and 60° for 1 min). Dissociation curve analysis and agarose gel electrophoresis were used to verify the presence of a PCR product in each reaction in which amplification was observed. RAG1 expression levels were compared between transgenic and non-transgenic animals using the comparative threshold approach, using β-actin as a calibrator.15
Flow cytometry
Single-cell suspensions were prepared from thymus, spleen, bone marrow, lymph nodes, peripheral blood and peritoneal lavage fluid, depleted of red blood cells, and stained on ice with various antibodies at appropriate dilutions as previously described.16 The following mouse-specific antibodies used for flow cytometric analysis were obtained from BD Biosciences (San Jose, CA), eBioscience (San Diego, CA), or Southern Biotech (Birmingham, AL): FITC-anti-IgD (11-26c.2a), -T-cell receptor-β (TCR-β; H57-597), -λ (R26-46), or -IgMa (DS-1), phycoerythrin (PE) -anti-CD21/CD35 (7G6); PE-Texas Red-anti-B220 (RA3-6B2); PE-Cy7-anti-DX5 or -CD93 (AA4.1); eFluor650- or allophycocyanin (APC) -anti-IgM (II/41), or -CD3 (145-2C11); APC-Cy7-anti-CD4 (GK1.5), -CD19 (1D3); AlexaFluor 700-anti-CD8 (53-6.7) or -CD4 (GK1.5); peridinin chlorophyll protein (PerCP) -Cy5.5-anti-Ly6C or -kappa (187.1); Spectral Red anti-CD24 (30-F1); and biotin-anti-CD43 (S7), -CD23 (B3B4), or IgMb (AF6-78). Biotinylated antibodies were revealed with streptavidin conjugates to PerCP (BD Biosciences) or QDot 585 (Invitrogen, Carlsbad, CA).
Flow cytometry data were collected on either a FACSCalibur or a FACSAria flow cytometer (BD Biosciences) with gates set for viable lymphocytes according to forward and side scatter profiles, and analysed using CellQuestPro (BD Biosciences) or FlowJo (TreeStar, San Carlos, CA) software. Cell sorting was performed using the FACSAria.
To evaluate cell cycle status, cells were resuspended in Vindelov's reagent [75 μg/ml propidium iodide, 3·5 U ribonuclease A, 0·1% Nonidet P-40 (IGEPAL CA-630) in Tris-buffered saline (3·5 mm Tris–HCl and 10 mm NaCl)],17 and incubated overnight at 4° before analysis by flow cytometry. A minimum of 10 000 events were collected and the data were analysed using ModFit LT software (Verity Software House, Topsham, ME). To evaluate apoptosis, cells were stained with annexin-V–FITC and propidium iodide using a commercially available kit (BD Biosciences) according to the manufacturer's instructions and analysed within 1 hr of staining.
Antigen-induced stimulation in vitro
Sorted splenic B220lo CD19+ and B220hi CD19+ B cells obtained from transgenic and non-transgenic animals (0·5 × 106/ml) were cultured in triplicate in complete RPMI-1640 medium (RPMI-1640 supplemented with 10% heat inactivated fetal bovine serum, 2 mm l-glutamine, 50 μm 2-mercaptoethanol and 0·01% penicillin-streptomycin) in the absence or presence of 30 μg/ml lipopolysaccharide (LPS, Sigma), 20 μg/ml F(ab’)2 goat anti-mouse IgM, or 20 μg/ml goat-IgG F(ab’)2 (Jackson ImmunoResearch Laboratories, West Grove, PA) at 37° for 72 hr. Cellular metabolic activity was then measured using the MTT assay.18 Briefly, 25 × 103 antigen-stimulated cells were plated in triplicate in RPMI-1640 culture medium supplemented with 10% fetal bovine serum (total volume, 0·1 ml), and then 3-(4,5-dimethylthiazol-2-yl)-2,5-diphenyl tetrazolium bromide (MTT) was added to each well (10 μl of 5 mg/ml stock). Cell cultures were incubated at 37° in a humidified atmosphere containing 5% CO2 for 4 hr and then developed by adding acid isopropanol (0·1 ml). Absorbance was measured at 595 nm using the GENios ELISA plate reader running the Magellan reader control and data reduction software (Tecan Austria GmbH, Salzburg, Austria).
Analysis of antigen receptor gene rearrangements and repertoire diversity
The abundance and distribution of IgH, Igκ, and TCR-β rearrangements in genomic DNA isolated from splenocytes (IgH and Igκ) or thymocytes (TCR) were analysed by semi-quantitative PCR using sense primers specific for a given VH,19 Vκ,20 and TCR-β21 family member and anti-sense primers located 3′ of a given joining segment: JH4,19 Jκ5,22 and Jβ1.6 and Jβ2.7,21 respectively. Briefly, samples for PCR (100 μl) contained 200, 50, 12·5 and 3·125 ng of genomic DNA (fourfold dilutions), 20 pmol of each primer, 0·2 mm dNTPs, 20 mm Tris–HCl (pH 8·4), 50 mm KCl, 1·5 mm MgCl2, and 2 units Taq polymerase. Samples were subjected to 30 cycles of amplification (94° for 1 min, 60° for 1 min, and 72° for 1·75 min) followed by a final extension (72° for 10 min). A fragment from the CD14 locus was amplified as a DNA loading control.23 The PCR products were fractionated by agarose gel electrophoresis, transferred to ZetaProbe membrane, and probed with 32P-labelled nested oligonucleotides to JH4 (5′-GCAGACTAATCTTGGATATTTGCCCTGAGGGAGCCGGCTGAGAGAAGTTG-3′), Jκ5 (5′-GCTCACGTTCGGTGCTGGGACCAAGCTGGAGCTGAAACGTAAGTAC-3′), Jβ1.6 (5′-TTCCTATAATTCGCCCCTCTACTTTGCGGCAGGCACC-3′) and Jβ2.7.21
IgH CDR3 spectrotyping was performed on genomic DNA isolated from spleens of transgenic mice and their non-transgenic littermates using a sense primer specific for a given VH gene family (VHJ558, VH7813, or VHQ52) and a μ enhancer-specific antisense primer, as described elsewhere.24 Briefly, samples for PCR (100 μl) contained 1 μg genomic DNA, 25 pmol of each primer, 0·2 mm dNTPs, 20 mm Tris–HCl (pH 8·4), 50 mm KCl, 1·5 mm MgCl2, and 2·5 units Taq polymerase. Samples were subjected to an initial denaturation (94° for 2 min), 40 cycles of amplification (94° for 30 seconds, 65° for 25 seconds and 72° for 25 seconds), followed by a final extension (72° for 4 min). Amplification products were subjected to 10 additional cycles of runoff elongation using a radiolabelled nested antisense primer specific for JH4.24 Runoff reaction products were separated on a sequencing gel, subjected to storage phosphor autoradiography using Storm 860 gel and blot imaging system, and line graphs were generated and analysed using the ImageQuaNT software.
Immunoglobulin gene sequence analysis
Total mRNA was isolated from FACS-purified splenic B220lo CD19+ and B220hi CD19+ B cells obtained from WT and dnRAG1 B cells using the Novagen Straight A's mRNA Isolation System (Darmstadt, Germany) according to the manufacturer's instructions. Complementary DNA was prepared from 0·5 μg mRNA using the Novagen First Strand cDNA Synthesis kit with the oligo-dT primer, and immunoglobulin light chain kappa (Igκ) genes were amplified by hot-start PCR using the Novagen Mouse immunoglobulin Primer Set kit. The PCR samples (100 μl final volume) contained 5 μl cDNA, 0·2 mm dNTPs, 1·5 mm MgCl2, 20 pmol Igκ-5′ primer, 10 pmol Igκ-3′ primer, and 0·5 μl Taq polymerase (5 U/μl) (Invitrogen). Primer sequences are provided in Supplementary material, see Table S1. Thermal cycling conditions were as follows: 94° for 1 min; 60° for 2 min and 72° for 2 min for 30 cycles, followed by a final extension at 72° for 6 min. Amplified cDNAs were cloned using the TOPO-TA cloning kit (Invitrogen), and individual clones were sequenced. To identify Vκ segment usage in the cloned cDNA, the NCBI database was queried using IgBLAST.
Immunizations
Cohorts of 8-week-old wild-type and dnRAG1 mice were immunized with the hapten NP (4-hydroxy-3-nitrophenylacetyl) conjugated to either chicken gamma-globulin (NP-CGG; Biosearch Technologies, Novato, CA) or aminoethylcarboxylmethyl-FICOLL (NP-AECM-FICOLL; Biosearch Technologies), essentially as described elsewhere.25 To prepare the immunogen, NP-CGG or NP-Ficoll (100 μg) was dissolved in 10% aluminium potassium sulphate and precipitated by adjusting the pH to 6·2 with 1 m potassium hydroxide. Alum precipitates were washed three times with PBS, and resuspended in 200 μl PBS. Wild-type and dnRAG1 mice were injected intraperitoneally with either NP-CGG or NP-Ficoll. Some animals received a booster injection of antigen at day 7 (10 μg intravenously). Animals receiving no injection or alum only served as controls. Levels of NP-specific antibodies were measured by ELISA in peripheral blood collected at day 7 (primary) or day 21 (secondary).
ELISA
Serum IgM and IgG levels were quantified using a commercially available sandwich ELISA according to the manufacturer's instructions (IMMUNO-TEK mouse IgM and IgG immunoglobulin ELISA kit; ZeptoMetrix, Buffalo, NY). The NP-specific antibodies were detected as described by von Bulow et al.26 Optical density was measured at 450 nm using the GENios ELISA plate reader running the Magellan reader control and data reduction software (Tecan Austria Gmbh).
Results
Generation and preliminary characterization of dnRAG1 mice
To generate dnRAG1 mice, we prepared a construct containing a RAG1 cDNA encoding a full-length catalytically inactive form of RAG1 under the transcriptional control of an H-2kb promoter, a genomic fragment of the human β globin gene to provide RNA splice donor sites and a polyadenylation signal, and an immunoglobulin heavy chain enhancer element (IgH Eμ) (Fig. 1a). RAG1 expressed from this construct lacked an epitope tag to avoid potential tag-associated artefacts that could alter RAG protein localization, regulation, or activity. Previous studies have shown that this promoter–enhancer combination supports transgene expression in the B-cell and/or T-cell lineage in founder-specific manner.9 Using PCR and Southern blotting approaches to screen founder lines (Fig. 1b), we identified two lines in which B cells with a B220lo CD19+ phenotype were reproducibly observed in the spleen at elevated levels (data not shown). We confirmed that residual catalytic activity of dnRAG1 could not account for this accumulation as dnRAG1 mice bred to a RAG1-deficient background show no evidence of B-cell or T-cell development beyond what is observed in RAG1−/− mice (see Supplementary material, Fig. S1).
Follow-up studies on one of these lines, no. 15, show that in 12-week-old mice, the percentage and absolute number of B220lo CD19+ B cells is significantly higher in dnRAG1 mice than in wild-type (WT) mice in spleen, bone marrow (BM), lymph node (LN), peritoneal cavity (PC), and peripheral blood (PB), but the relative abundance of these cells compared with more conventional B220hi CD19+ B cells varies depending on tissue origin (Fig. 1c; see Supplementary material, Fig. S2a). The abundance and distribution of T-cell subsets is not significantly different between WT and dnRAG1 animals in the thymus or spleen (see Supplementary material, Fig. S2b,c). In lymph nodes, CD4+ T cells show a modest, but statistically significant increase in dnRAG1 mice compared with WT mice (see Supplementary material, Fig. S2b,c). As the B220lo CD19+ B-cell phenotype in dnRAG1 mice was so striking, we focused our efforts to characterize the accumulation of these cells and did not investigate T-cell subsets further.
Examining the ontogeny of these cells demonstrated that the frequency of B220lo CD19+ B cells steadily increases with age, with significant differences detected in the spleen by 4 weeks of age, eventually comprising ∼ 35% of splenic lymphocytes by about 12 months of age (Fig. 1d). Other than a mild splenic hyperplasia, older dnRAG1 exhibited no obvious indications of disease that would distinguish them from their normal littermates, suggesting that B220lo CD19+ B-cell accumulation has no significant impact on the health of the animals.
Because peritoneal B1 B cells display a B220lo CD19+ phenotype,27 we speculated that splenic B220lo CD19+ B cells in dnRAG1 mice may express other surface markers indicative of a B1 B cell. A hallmark of the B1a B cell is the expression of CD5.27 Extensive flow cytometric analysis revealed that splenic B220lo CD19+ cells in dnRAG1 mice also express CD5, and have a surface phenotype characterized as sIgMhi sIgDint CD21− CD23− CD24−CD43lo AA4.1− CD11b− (Fig. 1e, and data not shown). This immunophenotype is quite similar to peritoneal B1a B cells, except that the peritoneal subset expresses slightly lower levels of sIgD and also expresses CD11b (Fig. 1e). The lack of CD11b expression is also consistent with the reported phenotype of splenic B1 cells from wild-type BALB/cByJ mice reported by others.28
To determine whether dnRAG1 mice exhibit defects in B-cell maturation, we stained bone marrow and spleen with antibodies to differentiate the various stages of B-cell development. In the bone marrow, developing B cells can initially be divided into two subsets based on B220 and CD43 expression: a B220+ CD43+ fraction that includes pre/pro-B and pro-B cells, and a B220+ CD43− fraction consisting of more mature B cells29 (Fig. 2a). The B220+ CD43− fraction can be further subdivided based on surface IgM and IgD expression into pre-B (IgM− IgD−), immature (IgM+ IgD−) or mature (IgM+ IgD+) B cells29 (Fig. 2a). We found that WT and dnRAG1 mice exhibited a similar percentage and absolute number of B220+ CD43+ B cells, but the more mature B220+ CD43− B-cell subset was slightly lower in dnRAG1 mice compared with WT mice because of a significant reduction of mature B cells (Fig. 2a,b; see Supplementary material, Table S2). Taken together, these data suggest that dnRAG1 expression impairs B-cell development in the bone marrow at the immature-to-mature B-cell transition.
Figure 2.
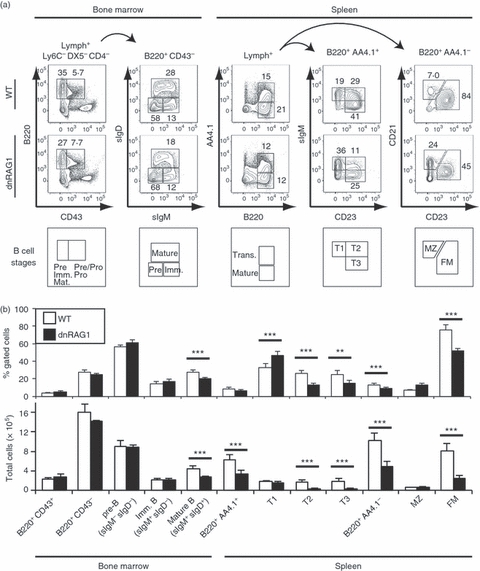
The dnRAG1 mice show evidence of impaired B-cell development at the immature-to-mature transition. (a) Cells prepared from wild-type (WT) or dnRAG1 bone marrow or spleen and identified by the gating parameters shown above each column were analysed for the expression of B220, CD43, sIgM, sIgD, CD21, and CD23. B-cell developmental subsets specified by the staining pattern are indicated below each column with corresponding gates. The percentage of cells within the identified gates is shown for representative animals. (b) Statistical analysis of data obtained from n = 3 to n = 7 WT and dnRAG1 mice for the various B-cell populations identified in (a). The percentage and absolute number of cells of each population is presented in bar graph format; significance determined from post-hoc analysis following one-way anova (*P<0·05; **P<0·01; ***P <0·005) (see Table S2).
Upon reaching the immature stage, B cells migrate to the spleen to complete their maturation, progressing through phenotypically and functionally distinct transitional stages during this process.30,31 Splenic B220hi B cells can be initially segregated based on the differential expression of AA4.1 (CD93) into transitional (B220hi AA4.1+) and mature (B220hi AA4.1−) subsets. Transitional cells can be further classified into subsets based on the differential expression of surface IgM and CD23.32 T1 B cells (IgMhi CD23lo) are considered as immature B cells that have recently emigrated from the bone marrow, which can differentiate into T2 B cells (IgMhi CD23hi).32 A third transitional B-cell subset, T3 (IgMlo CD23+), is thought to consist of immature B cells that have been rendered anergic by encounter with self-antigen.31,33 The mature B-cell population can be further subdivided by the differential expression of CD21 and CD23 into follicular (CD21int CD23−) and marginal zone (MZ; CD21hi CD23+) B-cell subsets.31 Consistent with observations in the bone marrow, dnRAG1 mice exhibit a significant reduction in the number of splenic transitional (B220hi AA4.1+) B cells compared with WT mice, because of a significant loss of cells in the T2 and T3 subsets (Fig. 2a,b; see Supplementary material, Table S2). In dnRAG1 mice, the mature B220hi AA4.1−subset is also significantly reduced relative to WT mice, with most of the difference attributed to a significant decrease in follicular B cells, but not MZ B cells (Fig. 2a,b).
To explain the lack of an apparent defect in early B-cell maturation and in T-cell development in dnRAG1 mice, we used qPCR to detect total RAG1 transcript in various tissues and compare the relative abundance of RAG1 transcript between normal and dnRAG1 mice after normalizing to an internal calibrator (β-actin). From these experiments, we found that splenic RAG1 transcript levels are about 120-fold higher in dnRAG1 mice compared with normal littermates, but little difference was observed in thymus, bone marrow, lymph node, or liver (Fig. 3a,b). Similar, but smaller, differences were also observed in 1-week-old animals, suggesting that the pattern of transgene expression is consistent during ontogeny (Fig. 3b) (bone marrow and lymph nodes were not analysed because of the young age of the mice). Endogenous RAG1 is expressed in primary lymphoid organs, such as thymus and bone marrow, but is not highly expressed in secondary lymphoid organs, such as spleen and lymph nodes; these data suggest that levels of dnRAG1 transcript exceed endogenous RAG1 transcript only in the spleen, and not in other primary and secondary lymphoid organs. Consistent with this result, we detected high levels of transgene-encoded dnRAG1 transcript in the spleen of dnRAG1 mice, but not in normal animals, using primers specific for the mutant RAG1 cDNA and exon 2 of the β-globin splice donor (Fig. 3a). To evaluate RAG1 expression more specifically in the B-cell lineage, bone marrow and splenic B-cell subsets were purified by FACS and RNA isolated from these cells was subjected to qPCR analysis to measure RAG1 transcript levels. Consistent with data obtained from unfractionated cells, total RAG1 transcript levels in dnRAG1 mice were not elevated in bone marrow B220+ CD43+ or B220+ CD43− B-cell subsets compared with WT mice, but were higher in all splenic B-cell subsets analysed, including B220hi AA4.1+ and B220hi AA4.1− subsets, as well as B220lo B cells (Fig. 3c).
Figure 3.
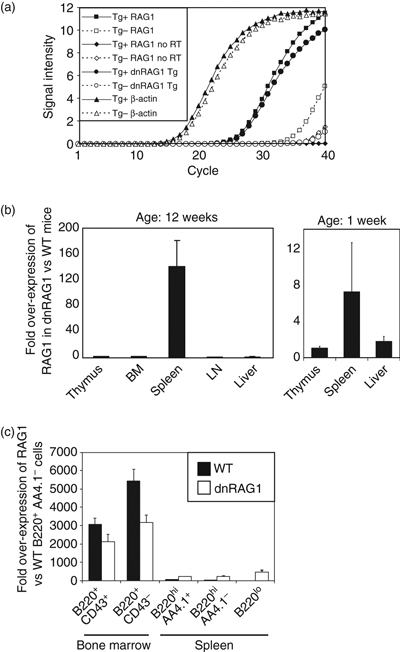
The dnRAG1 is over-expressed relative to endogenous RAG1 in the spleen. (a) Representative quantitative PCR experiment using cDNA prepared from wild-type (WT; Tg−; open shapes) and dnRAG1 (Tg+; filled shapes) spleens and primers specific for RAG1 (squares), the 3′-end of RAG1 and the β-globin splice donor sequence (circles), or β-actin (triangles). As a control, samples in which reverse transcriptase was omitted were similarly subjected to quantitative PCR using RAG1-specific primers (diamonds). (b) Mean fold over-expression of RAG1 transcript in dnRAG1 mice relative to WT littermates (n = 3) in various organs from 12-week-old mice (left panel) or 1-week-old mice (right panel) as calculated by the comparative Ct approach using β-actin as an internal calibrator. (c) Mean fold over-expression of RAG1 transcript in sorted B-cell populations from WT or dnRAG1 mice relative to WT B220hi AA4.1− B cells calculated as in (b).
B1-like B cells in dnRAG1 mice are clonally diverse, but repertoire restricted
The steady accumulation of splenic B220lo CD19+ B cells in dnRAG1 mice led us to consider several possibilities to explain this phenomenon. One possibility is that these cells are actively proliferating, which may be indicated by a higher frequency of cells undergoing DNA replication. However, sorted splenic B220hi and B220lo B cells from WT and dnRAG1 mice show a similar percentage of cells in the G1, S and G2 phases of the cell cycle (see Supplementary material, Fig. S3a), which demonstrates that B220lo CD19+ B cells in dnRAG1 mice do not comprise a highly proliferating population. A second possibility is that B220lo CD19+ B cells accumulate because of a defect in apoptosis. However, the frequency of early apoptotic cells identified by positive staining with annexin V, but not propidium iodide, is in fact slightly higher for both B220hi and B220lo B cells from dnRAG1 mice compared with WT B220hi B cells (see Supplementary material, Fig. S3b), suggesting that there is no intrinsic defect in the pathways leading to apoptosis. A third possibility is that B220lo B cells accumulating in dnRAG1 mice arise through slow division of a unique clone by analogy to monoclonal B-cell lymphocytosis or an indolent form of chronic lymphocytic leukaemia.34 However, genomic DNA prepared from spleens of dnRAG1 mice showed no evidence of clonality as assessed by Southern hybridization using heavy or light chain-specific probes (data not shown). To further confirm this finding, we examined patterns of immunoglobulin gene rearrangement using a PCR-Southern hybridization approach. In bulk splenocytes, we observed similar patterns of DH-to-JH, VH-to-DJH, and Vκ-to-Jκ rearrangements between 12-week-old WT and dnRAG1 mice, suggesting that B cells in dnRAG1 mice are clonally diverse at this age (Fig. 4a).
Figure 4.
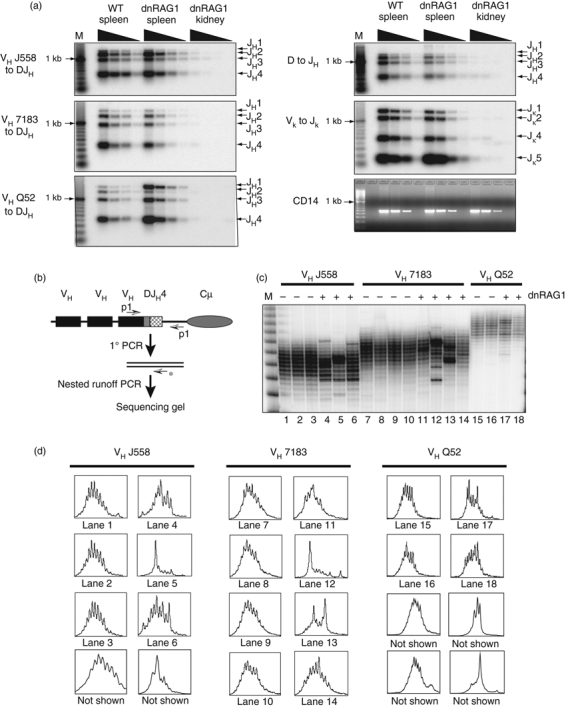
Peripheral B cells in dnRAG1 mice are clonally diverse, but repertoire restricted. (a) VH to DJH rearrangements involving J558, 7183 or Q52 gene family segments, as well as D to JH and Vκ to Jκ rearrangements were amplified from fourfold serially diluted genomic DNA (100 ng to 12·5 ng) obtained from wild-type (WT) and dnRAG1 spleen, or dnRAG1 kidney as a negative control and detected by Southern hybridization. Rearrangements to a given J segment are shown at right. The non-rearranging CD14 locus was amplified from the diluted genomic DNA templates as a loading control. (b) Strategy for CDR3 spectratyping. VH to DJH rearrangements were amplified using a VH family-specific primer (J558, 7183 or Q52) and an antisense primer specific for the IgH enhancer region, and then subjected to a runoff PCR using a radiolabelled antisense primer specific for JH4. (c) Autoradiograph of a sequencing gel used to resolve runoff reaction products for the three sets of VH to DJH rearrangements. (D) Line graphs were drawn through each of the lanes in (c) (identified below the graph) or from additional gels (not shown).
Given these results, and the delay in B-cell maturation suggested by flow cytometric analysis of the bone marrow, we next considered the possibility that over-expression of the dnRAG1 transgene might render V(D)J recombination inefficient, resulting in a restricted B-cell repertoire. To test this possibility, we examined the immunoglobulin heavy chain repertoire by amplifying VH-D-JH junctions from genomic DNA isolated from WT and dnRAG1 mouse spleens, and analysing nested runoff PCR products by sequencing gel electrophoresis as illustrated in Fig. 4(b).24 Three different VH gene families (J558, 7183, and Q52) were evaluated using this approach. In this assay, small differences in fragment length among amplicons from a given gene family reflect junctional diversification of CDR3 that occurs during V(D)J recombination: the pattern of the CDR3 length distribution is proportional to the fractional abundance of each rearrangement in the original sample. We found that the profile of runoff products from several WT animals shows a largely Gaussian distribution for all three VH families tested, indicative of a highly diverse repertoire. In contrast, the CDR3 length distributions of all three VH gene families from three different dnRAG1 mice are clearly skewed toward a smaller number of fragment lengths (Fig. 4c,d). These data suggest that while splenic B cells in dnRAG1 mice are clonally diverse, the CDR3 repertoire among these cells is more restricted than in their normal counterparts.
Because B220lo CD19+ B cells in 12-week-old dnRAG1 mice account for about 20% of splenic B cells at this age, we considered the possibility that the molecular features of the B220hi CD19+ B cells may partly mask those of the B220lo CD19+ B-cell population in a bulk splenic B-cell preparation. To address this issue, we sorted the two populations (Fig. 5a), and isolated genomic DNA or total RNA to compare immunoglobulin gene rearrangement patterns and immunoglobulin light chain gene sequences (Fig. 5b,c). Consistent with results obtained with bulk splenocytes, B220hi CD19+ B cells from WT and dnRAG1 mice showed fairly similar patterns of VH-to-DJH and Vκ-to-Jκ rearrangements (Fig. 5b). Interestingly, however, skewing was clearly evident in the rearrangement patterns detected from B220lo CD19+ B cells, particularly in the Igκ locus, where Jκ1 segment usage predominates over other Jκ rearrangements (Fig. 5b). This finding is confirmed by the preponderance of light chain genes containing the Jκ1 segment cloned from B220lo CD19+ B cells (11/15 clones sequenced), whereas Jκ usage is more evenly distributed between Jκ1, Jκ2 and Jκ5 segments among clones sequenced from B220hi CD19+ B cells sorted from WT and dnRAG1 mice (Fig. 5c, lower left panel).
Figure 5.
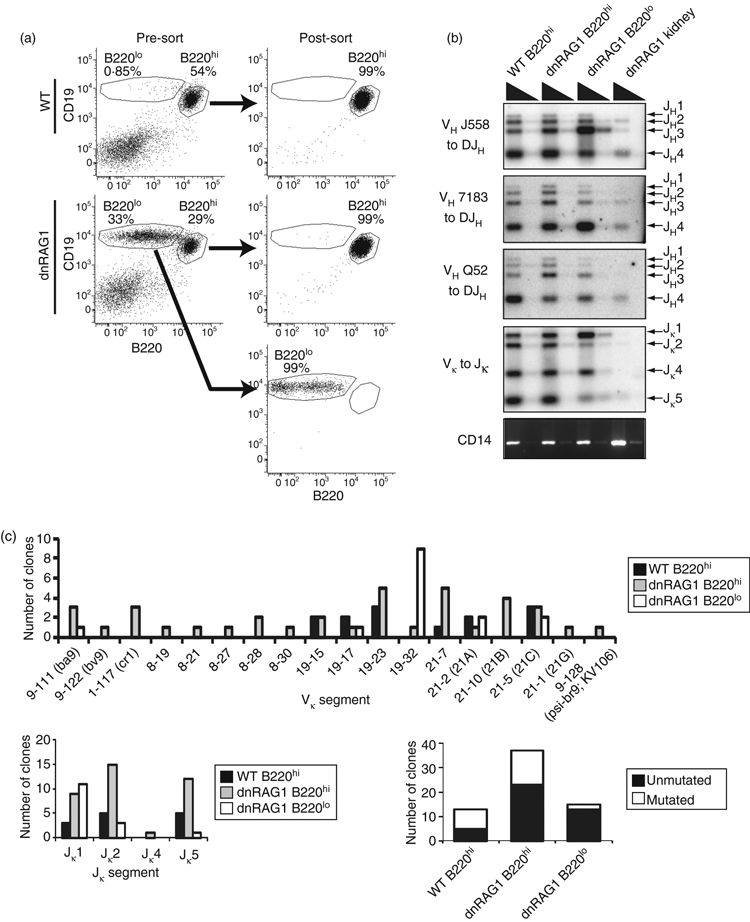
The dnRAG1 CD19+ B220lo B-cell repertoire is largely unmutated and exhibits biased usage of Vκ19–32 and Jκ1 gene segments. (a) Wild-type (WT) and dnRAG1 splenic CD19+ B220hi and CD19+ B220lo B cells were isolated by FACS for preparation of genomic DNA or total RNA. Post-sort purity was routinely > 97%. (b) Genomic DNA prepared from sorted B cells shown in (a) was analysed for VH to DJH and Vκ to Jκ rearrangements as in Fig. 4. (c) Igκ cDNAs prepared from total RNA isolated from sorted B cells indicated in (a) were amplified, cloned, and sequenced to determine Vκ and Jκ gene usage (top panel and lower left panel, respectively) and mutation status (lower right panel).
Sequence analysis revealed that Vκ gene segments amplified from B220hi CD19+ B cells are diverse and broadly distributed, representing six different Vκ segments among 13 clones sequenced from WT mice, and 19 different Vκ segments among 38 clones sequenced from dnRAG1 mice (Fig. 5c, top panel; see Supplementary material, Table S3). Although five Vκ segments were represented among 15 clones sequenced from B220lo CD19+ B cells, the 19–32 Vκ segment was highly over-represented among these clones, being identified in 9/15 clones (60%) sequenced (Fig. 5c, top panel). Notably, 13/15 (87%) of these clones show a germ-line configuration, suggesting that the B220lo CD19+ B cells have not undergone somatic hypermutation in the germinal centre (Fig. 5c, lower right panel; see Supplementary material, Table S3). By contrast, the frequency of unmutated clones derived from B220hi CD19+ B cells is much lower, both in normal mice (5/13 clones; 38%) and dnRAG1 mice (19/38 clones; 50%).
dnRAG1 mice exhibit defects in immunoglobulin production and immune response toward thymus-independent antigens
Accumulating B220lo CD19+ B cells resemble B1a B cells that are thought to be responsible for the production of natural antibodies, so we wondered whether dnRAG1 mice might exhibit elevated levels of serum immunoglobulin. Surprisingly, however, measurements of serum IgM and IgG levels from unimmunized normal and dnRAG1 mice revealed that dnRAG1 mice have significantly lower levels (approximately threefold) of serum IgM and IgG than their WT counterparts (Fig. 6a).
Figure 6.
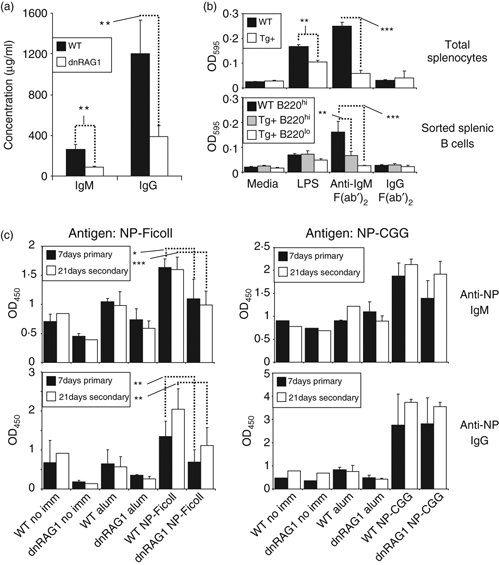
The dnRAG1 mice exhibit moderate immunoglobulin deficiency, decreased B-cell responsiveness in vitro, and an impaired immune response toward thymus-independent antigens in vivo. (a) Serum IgM and IgG concentrations in wild-type (WT) and dnRAG1 mice (n = 13 to n = 15 animals) were measured by ELISA. (b) Total splenocytes or splenic CD19+ B220hi and sorted CD19+ B220lo B cells from WT or dnRAG1 mice were cultured for 72 hr with media alone, lipopolysaccharide (LPS), anti-IgM F(ab’)2 or control IgG F(ab’)2 and analysed for their proliferative response using the MTT assay. (c) WT and dnRAG1 mice (8-weeks old) were immunized intraperitoneally with 100 μg NP-Ficoll or NP-CGG and blood was collected 7 days post-immunization (7 days primary) or animals were given a second injection (10 μg) intravenously at day 7 and blood was collected 14 days later (21 days secondary). Serum anti-NP IgM and IgG antibodies were analysed by ELISA. Unimmunized (no imm) or sham-treated (alum) animals were analysed in parallel as controls. Notice that anti-NP IgM and IgG levels were significantly lower in dnRAG1 mice immunized with NP-Ficoll, but not NP-CGG, than WT mice (*P <0·05; **P <0·01; ***P <0·005).
To determine whether this outcome might be the result of defects in B-cell responsiveness toward antigenic stimulation, we measured the activation of WT or dnRAG1 splenocytes or sorted B220lo CD19+ B cells and B220hi CD19+ B cells using an MTT assay after mitogen treatment with lipopolysaccharide or BCR cross-linking using anti-IgM F(ab’)2 antibody. We found that both treatments stimulate splenocytes isolated from WT and dnRAG1 mice more than media alone, but dnRAG1 splenocytes showed a significantly diminished responsiveness toward stimulation by lipopolysaccharide or anti-IgM cross-linking than those isolated from WT mice (Fig. 6b, upper panel). Indeed, the level of stimulation of dnRAG1 splenocytes by anti-IgM was not significantly different than a control F(ab’)2 antibody. Similar experiments conducted with sorted B220lo and B220hi B cells from WT and dnRAG1 mice revealed that while the B220hi and B220lo subsets are both stimulated by lipopolysaccharide, the level of stimulation is not significantly different between the subsets (Fig. 6b, lower panel). In contrast, B220hi B cells from WT mice responded significantly better to anti-IgM treatment than both B220hi and B220lo cells from dnRAG1 mice, with the difference being slightly greater for B220lo B cells (which showed no significant difference relative to treatment with a control F(ab’)2 antibody). The difference between WT and dnRAG1 B220hi B-cell responses is somewhat surprising, but it is likely that there is some heterogeneity in B220 expression levels among cells that are poorly responsive toward antigenic stimulation.
The defects observed in dnRAG1 mouse B-cell responsiveness raised the possibility that these mice might exhibit impaired humoral immune responses. To test this possibility, we immunized a cohort of WT and dnRAG1 mice with either NP-AECM-FICOLL or NP-CGG, which serve as models for thymus-independent and thymus-dependent antigens, respectively,35,36 and analysed NP-specific IgM or IgG antibody responses either 7 days after primary immunization or 14 days after a subsequent booster immunization (day 21). We find that both IgM and IgG anti-NP responses to NP-AECM-FICOLL, but not NP-CGG, are significantly reduced in dnRAG1 mice compared with their WT counterparts (Fig. 6c). These data suggest that dnRAG1 mice have a selective defect in responding to thymus-independent antigens, but are capable of mounting robust immune responses to thymus-dependent antigens.
dnRAG1 mice expressing a rearranged immunoglobulin heavy chain specific for dsDNA show evidence of impaired B1-like B-cell accumulation, light chain receptor editing, and expansion of the splenic MZ B-cell compartment
The impaired progression of B-cell development at the immature-to-mature transition observed in dnRAG1 mice suggests that dnRAG1 expression interferes with the receptor editing process that occurs during this important stage of B-cell development.37 To test this possibility more directly, we bred dnRAG1 mice to mice bearing an anti-dsDNA specific immunoglobulin heavy chain transgene, called 3H9H56R, knocked into the endogenous heavy chain locus (56Rki mice) to determine whether dnRAG1 expression impedes the extensive light chain receptor editing that occurs in 56Rki mice to obtain an ‘editor’ light chain capable of neutralizing the anti-dsDNA reactivity of the heavy chain.12 The 56ki model has the added feature of allowing us to determine whether editing of the 3H9H56R transgene through heavy chain gene replacement,38 which is thought to occur earlier in B-cell development,39 is also impaired by dnRAG1 expression, and whether CD19+ B220lo B-cell accumulation in dnRAG1 mice depends on BCR specificity.
A comparison of the various B-cell subsets in WT, dnRAG1, 56Rki and double-transgenic (DTG) mice revealed several interesting results (see Supplementary material, Table S2). First, in contrast to dnRAG1 mice, DTG mice failed to accumulate splenic B220lo CD19+ B cells (Fig. 7a), clearly indicating that this population arises in dnRAG1 mice through selection based on BCR specificity. Interestingly, however, B1a B cells are still evident in the peritoneal cavity of DTG mice (Fig. 7a). Second, compared with both dnRAG1 and 56Rki mice, DTG mice show a significantly lower percentage and absolute number of IgM+ IgD+ mature B cells in the bone marrow (Fig. 7b; see Supplementary material, Fig. S4a). Third, DTG mice resemble 56Rki mice more closely than dnRAG1 mice in terms of the absolute number of cells in each of the transitional and mature B-cell subsets in the spleen, except for MZ B cells, which are significantly more abundant in DTG mice than in 56Rki mice (Fig. 7b).
Figure 7.
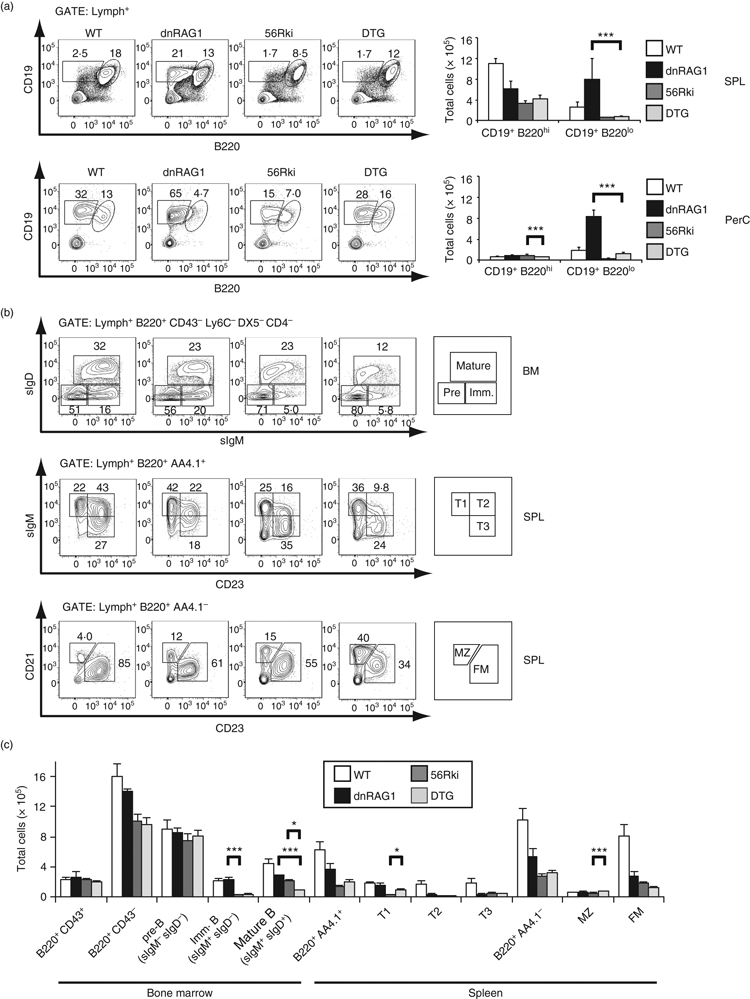
Expression of an anti-DNA heavy chain transgene in dnRAG1 mice blocks B1-like B-cell accumulation, impairs B-cell development at the transitional T1 stage, and promotes marginal zone (MZ) B-cell differentiation. (a) Lymphocyte-gated cells prepared from wild-type (WT), dnRAG1, 56Rki, and double-transgenic (DTG) spleen (SPL) and peritoneal cavity (PerC) were analysed for the expression of CD19 and B220 as in Fig. 1(c). The absolute number of cells in each population is shown at right (***P <0·005). (b) Cells prepared from WT, dnRAG1, 56Rki, and DTG bone marrow or spleen and identified by the gating parameters shown above each row were analysed as in Fig. 2. (c) The absolute number of cells within the identified gates is shown as in Fig. 2. Significant differences are shown only for comparisons between dnRAG1 or 56Rki mice and DTG mice. See Table S2 for summary.
To more directly examine the effect of dnRAG1 expression on receptor editing in 56Rki mice, we compared the frequency of B cells that express the IgMb allele, which arises through heavy chain gene replacement of the IgMa allele encoding the 3H9H56R transgene in 56Rki and DTG mice,38,39 and the percentage of B cells that express λ light chain, which may arise after all attempts to obtain productive, non-autoreactive κ rearrangements are exhausted. We observed no significant difference in the number of B cells expressing the IgMa and IgMb alleles, nor in the number of κ+ and λ+ B cells, between 56Rki and DTG mice (see Supplementary material, Fig. S4b and Table S2).
Discussion
dnRAG1 mice exhibit defects in B-cell maturation consistent with impaired receptor editing
B cells undergo a series of RAG-mediated V(D)J rearrangement events and selection processes during their development to obtain a combination of functionally rearranged immunoglobulin heavy and light chain genes that encode a BCR with an antigenic specificity that is either non-autoreactive or possesses a level of self-reactivity that is tolerated by the host.40 Primary V(D)J rearrangements occur during the pro-B-cell and pre-B-cell stages to generate an initial antigen receptor specificity that is subsequently tested for self-reactivity. Should the primary rearrangements yield an antigenic specificity that is not tolerated by the host, the cell may be rendered anergic or undergo developmental arrest to initiate secondary V(D)J rearrangements (generally involving the light chain loci) to edit receptor specificity far enough away from self-reactivity to become innocuous to the host. Should these attempts fail to achieve a tolerated specificity, the cell will typically be deleted from the repertoire. The anatomical sites and developmental stages that support secondary V(D)J rearrangement to edit self-reactivity may be diverse, depending on the antigenic specificity of the heavy chain and light chain (with a strongly self-reactive heavy chain possibly eliciting editing earlier in B-cell development than self-specificity imparted by both heavy and light chains),41 whether editing involves transgene-encoded immunoglobulin genes (which may be subject to antigen-independent as well as antigen-dependent editing),39 and where the antigen is encountered (centrally, as self-antigen, or peripherally, to suppress autoreactivity generated during an immune response 42).
In principle, expressing catalytically inactive RAG1 in an otherwise RAG-competent host may impair either primary or secondary V(D)J rearrangement events. Which events are impaired would depend on whether inactive RAG1 is expressed in sufficient excess over the endogenous protein to function as a dominant negative at the developmental stages that support primary or secondary V(D)J rearrangements. The dnRAG1 mice described in this study do not exhibit an obvious impairment in primary V(D)J recombination, as evidenced by a normal abundance and distribution of thymocyte populations and bone marrow pre-B-cell and pro-B-cell subsets (Fig. 2a, see Supplementary material, Fig. S2b), the observation that RAG1 expression levels in the bone marrow are not significantly different between WT and dnRAG1 mice (Fig. 3), the diverse gene usage observed in splenic B cells of dnRAG1 mice (Fig. 4), and the similar levels of heavy chain gene replacement observed in 56Rki and DTG mice (see Supplementary material, Fig. S4). Rather, several lines of evidence suggest that dnRAG1 expression impairs secondary V(D)J rearrangements that occur later in B-cell development associated with receptor editing. First, dnRAG1 mice exhibit impaired B-cell progression through the immature/T1-to-T2 B-cell transition, a stage that supports secondary V(D)J recombination.40 As a result, there is a significant loss of follicular B cells. Second, RAG1 is over-expressed in splenic B cells in dnRAG1 mice relative to WT mice (Fig. 3c), suggesting that catalytically inactive RAG1 is expressed at sufficient levels to compete with endogenous RAG1 for binding to the recombination signal sequence. Third, dnRAG1 mice exhibit an expanded population of splenic B cells with a B1-like phenotype (Figs 1 and 2). This subset is known to harbour a high frequency of cells with poly-reactive specificities,43 and might reasonably be expected to increase under conditions of impaired receptor editing. Fourth, light chain rearrangements in sorted CD19+ B220lo B cells show evidence of skewing to Jκ1 (Fig. 5b). As the initial Vκ rearrangements tend to use the most proximal Jκ segment,44 this outcome is consistent with impaired initiation of secondary V(D)J rearrangement to replace a primary Vκ rearrangement to Jκ1.
Comparison of dnRAG1 mice to other models of B1 B-cell accumulation
The B1 B cells normally constitute a small fraction of splenic B cells, but are the most abundant B cells in the pleural and peritoneal cavities.27 B1 B cells are thought to be the primary source of natural antibodies capable of recognizing common microbial determinants, which, together with rapidly inducible antibodies generated by MZ B cells, play a critical role in early thymus-independent immune responses against encapsulated bacterial microorganisms such as Streptococcus pneumoniae.45,46 Expansion of B1 B cells has been observed in some strains of mice predisposed to autoimmune disease,47 mutant mice prone to developing a disease resembling chronic lymphocytic leukaemia,48 and mice deficient in certain regulators of B-cell signalling, such as SHP1,49 Lyn,50 or Siglec-G.51,52 We have not observed the onset of any obvious manifestations of autoimmune disease, such as the development of anti-nuclear antibody or glomerular nephritis, or chronic lymphocytic leukaemia-like syndromes in older dnRAG1 mice (data not shown). In this regard, the absence of B1 B-cell-associated pathological conditions in dnRAG1 mice is similar to that observed in Siglec-G-deficient mice.51,52 However, unlike Siglec-G-deficient mice, which exhibit elevated levels of serum IgM, dnRAG1 mice show a deficiency in circulating IgM and IgG antibodies (Fig. 6). One potential explanation for this distinction is that the signalling pathways that normally attenuate B-cell activation in response to stimulation by self-antigen remain intact in dnRAG1 mice and are sufficient to prevent autoantibody production under conditions where receptor editing is impaired. By contrast, the attenuation of signalling in Siglec-G-deficient mice under the same conditions may be insufficient to prevent B-cell activation and antibody secretion. Alternatively, accumulating B1-like B cells in dnRAG1 mice may be intrinsically resistant to (auto)antigenic stimulation. This possibility is supported by experiments showing that B cells from dnRAG1 mice exhibit impaired responses toward antigenic stimuli in vitro and immunization by thymus-independent antigens in vivo (Fig. 3). Whether genetic manipulation of BCR signalling pathways in dnRAG1 mice can promote (auto)antibody production in these animals is a focus of future investigation.
BCR specificity dictates splenic B1 versus MZ B-cell fate determination in dnRAG1 mice
Both the B1 and the MZ B-cell populations are known to be enriched for cells with poly-reactive and/or weakly self-reactive BCRs.53 B cells with such specificities could be potentially dangerous if allowed to undergo affinity maturation toward host antigens, but are generally tolerated by the host because of the useful role they play in recognizing bacterial antigens to promote early immune responses against these organisms.45,46 There remains some uncertainty over the extent to which BCR specificity controls lineage specification of B1 B cells.54 The data presented here suggest that splenic B1-like B cells accumulating in dnRAG1 mice acquire this phenotype based on their BCR specificity, because enforced expression of a heavy chain transgene specific for dsDNA (56Rki) in dnRAG1 mice blocks their accumulation, and instead promotes expansion of MZ-like B cells (Fig. 7). The latter result is particularly interesting in light of evidence showing that anti-dsDNA B cells that fail to edit BCR specificity away from dsDNA, but that possess cross-reactivity toward intracellular antigens, may acquire the phenotype of a B cell found in the MZ and remain sequestered there as a means to escape editing pressure.55
The fact that B cells with a B1 phenotype are normally detected at low levels in the spleen, but are significantly increased in dnRAG1 mice, raises the question of whether B cells normally present in this compartment have been positively selected into this reservoir, or whether this population represents a safe anatomical repository for peripheral B cells that have attempted to undergo receptor editing, but still retain vestiges of self-reactivity at levels that are tolerated by the host. These possibilities are not necessarily mutually exclusive. The selection model of B1 B-cell differentiation argues that if this self-specificity is retained, then the B cell would adopt a B1-like phenotype. The expansion of splenic B1 B cells in dnRAG1 mice suggests that the antigenic specificities represented in this population are tolerated by the host if they cannot be successfully edited. If so, why would editing be triggered in the spleen in response to antigenic specificities that appear to be otherwise tolerated and maintained in the peritoneal and pleural cavities? We speculate that the peritoneal B1-cell-specified progenitor identified by the Dorshkind group56 evolved to maintain weakly self-reactive specificities in the peritoneal and pleural cavities because of the advantages that this confers to the host in responding to common microbial organisms, but because of the high frequency at which these self-specificities may emerge during B-cell development,57 an ontological switch evolved to promote editing of these specificities in the adult spleen, perhaps to avoid unnecessary redundancy with peritoneal/pleural B1-cell specificities and/or the potential risk associated with activating B cells with these specificities in the spleen. This possibility is supported by experiments reported by Ferry et al.58 Using hen egg lysozyme (HEL) as a neo-self antigen in anti-HEL MD4 transgenic mice, these authors observed a change in the response toward neo-self-antigen from one that encourages positive selection during early ontogeny to one that promotes tolerance induction in the adult. Further evidence supporting this model is the observation that DTG mice continue to sustain a population of B cells with a B1 phenotype in the peritoneal cavity, despite the loss of B1-like B cells in the spleen (Fig. 7a). The fact that splenic B1-like B cells detected in dnRAG1 mice do not express CD11b also argues against the likelihood that they are derived from the same progenitors as peritoneal B1 B cells, because the Lin− B220lo-neg CD19+ B1 lineage progenitors identified by Montecino-Rodriguez et al. support development of B1 B cells expressing CD11b56. B1 B progenitor cells with the same phenotype have recently also been identified in the spleen, and have been shown to support reconstitution of peritoneal B1 B cells and splenic MZ-like cells (CD21hi/B220hi/CD23–) in RAG1−/− recipients, but splenic B cells with the B1-like phenotype described here were not apparent after reconstitution.59 Nevertheless, we cannot exclude the possibility that a subset of splenic B1-like cells arises from a distinct progenitor to support immune responses in this location.
Taken together, these data suggest a model of B-cell development in which B1-like cells arise through both lineage-based and selection-based mechanisms (Fig. 8). In the peritoneal and pleural cavities, B1 B cells arise from progenitor cells that are distinct from those that give rise to B2 B cells. In the adult spleen, B cells with a B1-like phenotype may develop from a specified progenitor that may or may not be the same as the peritoneal B1 progenitor cell, and/or they may arise as a result of selection processes. In the latter case, we speculate that during the ontological switch toward increasing reliance on the B2 lineage for B-cell development, immature/transitional T1 B cells possessing a self-specificity that would otherwise be tolerated in peritoneal B cells arising from B1-lineage progenitors now triggers receptor editing in the B2 lineage. If editing fails to remove self-specificity, as may be caused by dnRAG1 expression, the cell may acquire a B1-like phenotype in the spleen and persist there. B cells with less innocuous anti-self specificities, such as anti-dsDNA, may not be tolerated in the splenic B1 compartment if editing fails to rescue autoreactivity, but may instead undergo deletion or be sequestered in the MZ compartment.55 If this model is correct, then distinguishing and enumerating putative splenic B1 subsets that arise through lineage-specified or selection-induced mechanisms would be an important focus of future efforts.
Figure 8.
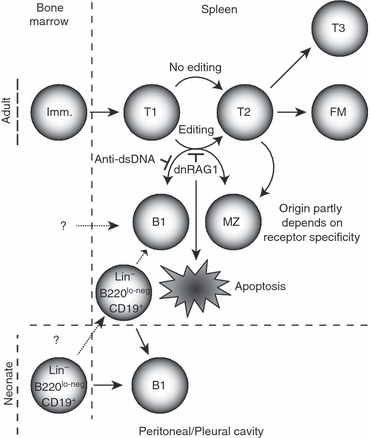
Model for receptor editing's role in guiding B-cell differentiation. Non-self-reactive immature B cells arriving from the bone marrow progress normally through the transitional stages of B-cell development. However, those arriving with receptor specificities tolerated in the host, but normally edited in the adult spleen at the T1 stage, are prevented from editing by dnRAG1 expression. As a result, B cells may acquire a B1 or marginal zone (MZ) phenotype; those with anti-dsDNA specificity preferentially acquire the MZ phenotype. Alternatively, B cells retaining a self-specificity that is not tolerated in the periphery may undergo apoptosis. T2 B cells not subjected to editing (or having successfully edited) may also differentiate into MZ B cells as discussed previously.61 Even if receptor editing is impaired in the conventional B2 lineage, peritoneal B1 B cells arising from a specified Lin− B220lo-neg CD19+ progenitor may continue to persist.54,59 It is also possible that a different haematopoietic progenitor cell uniquely gives rise to a splenic B1 cell population that is distinct from B1-like cells that acquire this phenotype in response to a failed editing programme.
Although this model provides a reasonable explanation for why splenic B1-like B cells accumulate in dnRAG1 mice, we cannot fully exclude the possibility that alternative, more complicated, scenarios might cause the same outcome. For example, because full-length RAG1 has been shown to interact with other cellular factors and may function as an E3 ubiquitin ligase,60 dnRAG1 expression may cause sequestration or mis-regulated ubiquitylation of cellular factors involved in the V(D)J recombination process, potentially altering the physiology of the cell in a way that promotes differentiation toward a B1-like phenotype. Alternatively, a recurrent illegitimate V(D)J recombination event may be generated during the coincident expression of endogenous RAG1 and transgene-encoded dnRAG1 that promotes splenic B1 B-cell differentiation. However, the failure of splenic B1-like B cells to accumulate in DTG mice expressing both the dnRAG1 and 56Rki transgene is not easily explained in either of these scenarios. Moreover, the latter possibility seems unlikely because we do not detect a recurrent DNA rearrangement involving the heavy or light chain loci by Southern blotting of splenic DNA prepared from dnRAG1 mice (data not shown), but these results cannot fully rule out the possibility that non-immunoglobulin loci are targets of inappropriate V(D)J rearrangement in dnRAG1 mice. For this reason, we currently favour the simpler explanation that dnRAG1 expression interferes with secondary rearrangements associated with receptor editing.
Acknowledgments
This work was supported by grants from the Health Future Foundation, the Nebraska LB506 Cancer and Smoking Disease Research Program, and the Nebraska LB692 Biomedical Research Program. This investigation was conducted in a facility constructed with support from the Research Facilities Improvement Program of the NIH National Center for Research Resources (C06 RR17417-01).
Disclosures
The authors declare no conflict of interest.
Supporting Information
Additional Supporting Information may be found in the online version of this article:
Figure S1. dnRAG1 mice bred onto a RAG1-deficient background fail to develop mature lymphocytes.
Figure S2. Summary of data obtained for Fig. 1(c) and for analysis of T-cell populations in the spleen, thymus and lymph node.
Figure S3. Comparison of cell cycle status and apoptosis levels between sorted CD19+ B220hi and CD19+ B220lo B cells purified from WT and dnRAG1 mice.
Figure S4. Flow cytometric analysis comparing surface expression levels of B220 versus CD43 on BM B cells, and AA4.1 versus B220, IgMa versus IgMb and Igj versus Igλ on splenic B cells from wild-type (WT), dnRAG1, 56Rki, and double-transgenic (DTG) mice.
Table S1. Primers used for Igj gene sequence analysis.
Table S2. Summary and statistical analysis of flow cytometric data collected for wild-type (WT), dnRAG1, 56Rki, and double-transgenic (DTG) mice.
Table S3. Igκ gene sequence analysis.
Please note: Wiley-Blackwell are not responsible for the content or functionality of any supporting materials supplied by the authors. Any queries (other than about missing material) should be directed to the corresponding author for the article.
References
- 1.Bassing CH, Swat W, Alt FW. The mechanism and regulation of chromosomal V(D)J recombination. Cell. 2002;109(Suppl.):S45–55. doi: 10.1016/s0092-8674(02)00675-x. [DOI] [PubMed] [Google Scholar]
- 2.Jankovic M, Casellas R, Yannoutsos N, Wardemann H, Nussenzweig MC. RAGs and regulation of autoantibodies. Annu Rev Immunol. 2004;22:485–501. doi: 10.1146/annurev.immunol.22.012703.104707. [DOI] [PubMed] [Google Scholar]
- 3.Hillion S, Rochas C, Youinou P, Jamin C. Expression and reexpression of recombination activating genes: relevance to the development of autoimmune states. Ann N Y Acad Sci. 2005;1050:10–8. doi: 10.1196/annals.1313.002. [DOI] [PubMed] [Google Scholar]
- 4.Seagal J, Melamed D. Role of receptor revision in forming a B cell repertoire. Clin Immunol. 2002;105:1–8. doi: 10.1006/clim.2002.5290. [DOI] [PubMed] [Google Scholar]
- 5.Fugmann SD, Villey IJ, Ptaszek LM, Schatz DG. Identification of two catalytic residues in RAG1 that define a single active site within the RAG1/RAG2 protein complex. Mol Cell. 2000;5:97–107. doi: 10.1016/s1097-2765(00)80406-2. [DOI] [PubMed] [Google Scholar]
- 6.Kim DR, Dai Y, Mundy CL, Yang W, Oettinger MA. Mutations of acidic residues in RAG1 define the active site of the V(D)J recombinase. Genes Dev. 1999;13:3070–80. doi: 10.1101/gad.13.23.3070. [DOI] [PMC free article] [PubMed] [Google Scholar]
- 7.Landree MA, Wibbenmeyer JA, Roth DB. Mutational analysis of RAG1 and RAG2 identifies three catalytic amino acids in RAG1 critical for both cleavage steps of V(D)J recombination. Genes Dev. 1999;13:3059–69. doi: 10.1101/gad.13.23.3059. [DOI] [PMC free article] [PubMed] [Google Scholar]
- 8.Furusawa T, Hosoe M, Ohkoshi K, et al. Catalytic RAG1 mutants obstruct V(D)J recombination in vitro and in vivo. Mol Immunol. 2003;39:871–8. doi: 10.1016/s0161-5890(03)00008-7. [DOI] [PubMed] [Google Scholar]
- 9.Pircher H, Mak TW, Lang R, Ballhausen W, Ruedi E, Hengartner H, Zinkernagel RM, Burki K. T cell tolerance to Mlsa encoded antigens in T cell receptor V β 8.1 chain transgenic mice. EMBO J. 1989;8:719–27. doi: 10.1002/j.1460-2075.1989.tb03431.x. [DOI] [PMC free article] [PubMed] [Google Scholar]
- 10.Bergeron S, Anderson DK, Swanson PC. RAG and HMGB1 proteins: purification and biochemical analysis of recombination signal complexes. Methods Enzymol. 2006;408:511–28. doi: 10.1016/S0076-6879(06)08032-3. [DOI] [PubMed] [Google Scholar]
- 11.Lin WC, Desiderio S. Regulation of V(D)J recombination activator protein RAG-2 by phosphorylation. Science. 1993;260:953–9. doi: 10.1126/science.8493533. [DOI] [PubMed] [Google Scholar]
- 12.Li H, Jiang Y, Prak EL, Radic M, Weigert M. Editors and editing of anti-DNA receptors. Immunity. 2001;15:947–57. doi: 10.1016/s1074-7613(01)00251-5. [DOI] [PubMed] [Google Scholar]
- 13.Razani-Boroujerdi S, Boyd RT, Davila-Garcia MI, et al. T cells express alpha7-nicotinic acetylcholine receptor subunits that require a functional TCR and leukocyte-specific protein tyrosine kinase for nicotine-induced Ca2+ response. J Immunol. 2007;179:2889–98. doi: 10.4049/jimmunol.179.5.2889. [DOI] [PubMed] [Google Scholar]
- 14.Giulietti A, Overbergh L, Valckx D, Decallonne B, Bouillon R, Mathieu C. An overview of real-time quantitative PCR: applications to quantify cytokine gene expression. Methods. 2001;25:386–401. doi: 10.1006/meth.2001.1261. [DOI] [PubMed] [Google Scholar]
- 15.Livak KJ, Schmittgen TD. Analysis of relative gene expression data using real-time quantitative PCR and the 2(-Delta Delta C(T)) Method. Methods. 2001;25:402–8. doi: 10.1006/meth.2001.1262. [DOI] [PubMed] [Google Scholar]
- 16.Fusby JS, Kassmeier MD, Palmer VL, et al. Cigarette smoke-induced effects on bone marrow B-cell subsets and CD4+:CD8+ T-cell ratios are reversed by smoking cessation: influence of bone mass on immune cell response to and recovery from smoke exposure. Inhal Toxicol. 2010;22:785–96. doi: 10.3109/08958378.2010.483258. [DOI] [PubMed] [Google Scholar]
- 17.Vindelov LL. Flow microfluorometric analysis of nuclear DNA in cells from solid tumors and cell suspensions. A new method for rapid isolation and straining of nuclei. Virchows Arch B Cell Pathol. 1977;24:227–42. [PubMed] [Google Scholar]
- 18.Mosmann T. Rapid colorimetric assay for cellular growth and survival: application to proliferation and cytotoxicity assays. J Immunol Methods. 1983;65:55–63. doi: 10.1016/0022-1759(83)90303-4. [DOI] [PubMed] [Google Scholar]
- 19.Schlissel MS, Corcoran LM, Baltimore D. Virus-transformed pre-B cells show ordered activation but not inactivation of immunoglobulin gene rearrangement and transcription. J Exp Med. 1991;173:711–20. doi: 10.1084/jem.173.3.711. [DOI] [PMC free article] [PubMed] [Google Scholar]
- 20.Schlissel MS, Baltimore D. Activation of immunoglobulin kappa gene rearrangement correlates with induction of germline kappa gene transcription. Cell. 1989;58:1001–7. doi: 10.1016/0092-8674(89)90951-3. [DOI] [PubMed] [Google Scholar]
- 21.Gartner F, Alt FW, Monroe R, Chu M, Sleckman BP, Davidson L, Swat W. Immature thymocytes employ distinct signaling pathways for allelic exclusion versus differentiation and expansion. Immunity. 1999;10:537–46. doi: 10.1016/s1074-7613(00)80053-9. [DOI] [PubMed] [Google Scholar]
- 22.Chen YY, Wang LC, Huang MS, Rosenberg N. An active v-abl protein tyrosine kinase blocks immunoglobulin light-chain gene rearrangement. Genes Dev. 1994;8:688–97. doi: 10.1101/gad.8.6.688. [DOI] [PubMed] [Google Scholar]
- 23.Schlissel M, Constantinescu A, Morrow T, Baxter M, Peng A. Double-strand signal sequence breaks in V(D)J recombination are blunt, 5′-phosphorylated, RAG-dependent, and cell cycle regulated. Genes Dev. 1993;7:2520–32. doi: 10.1101/gad.7.12b.2520. [DOI] [PubMed] [Google Scholar]
- 24.Delassus S, Gey A, Darche S, Cumano A, Roth C, Kourilsky P. PCR-based analysis of the murine immunoglobulin heavy-chain repertoire. J Immunol Methods. 1995;184:219–29. doi: 10.1016/0022-1759(95)00091-n. [DOI] [PubMed] [Google Scholar]
- 25.Nagaoka H, Gonzalez-Aseguinolaza G, Tsuji M, Nussenzweig MC. Immunization and infection change the number of recombination activating gene (RAG)-expressing B cells in the periphery by altering immature lymphocyte production. J Exp Med. 2000;191:2113–20. doi: 10.1084/jem.191.12.2113. [DOI] [PMC free article] [PubMed] [Google Scholar]
- 26.von Bulow GU, van Deursen JM, Bram RJ. Regulation of the T-independent humoral response by TACI. Immunity. 2001;14:573–82. doi: 10.1016/s1074-7613(01)00130-3. [DOI] [PubMed] [Google Scholar]
- 27.Berland R, Wortis HH. Origins and functions of B-1 cells with notes on the role of CD5. Annu Rev Immunol. 2002;20:253–300. doi: 10.1146/annurev.immunol.20.100301.064833. [DOI] [PubMed] [Google Scholar]
- 28.Tumang JR, Hastings WD, Bai C, Rothstein TL. Peritoneal and splenic B-1 cells are separable by phenotypic, functional, and transcriptomic characteristics. Eur J Immunol. 2004;34:2158–67. doi: 10.1002/eji.200424819. [DOI] [PubMed] [Google Scholar]
- 29.Hardy RR, Carmack CE, Shinton SA, Kemp JD, Hayakawa K. Resolution and characterization of pro-B and pre-pro-B cell stages in normal mouse bone marrow. J Exp Med. 1991;173:1213–25. doi: 10.1084/jem.173.5.1213. [DOI] [PMC free article] [PubMed] [Google Scholar]
- 30.Cancro MP. Peripheral B-cell maturation: the intersection of selection and homeostasis. Immunol Rev. 2004;197:89–101. doi: 10.1111/j.0105-2896.2004.0099.x. [DOI] [PubMed] [Google Scholar]
- 31.Monroe JG, Dorshkind K. Fate decisions regulating bone marrow and peripheral B lymphocyte development. Adv Immunol. 2007;95:1–50. doi: 10.1016/S0065-2776(07)95001-4. [DOI] [PubMed] [Google Scholar]
- 32.Allman D, Lindsley RC, DeMuth W, Rudd K, Shinton SA, Hardy RR. Resolution of three nonproliferative immature splenic B cell subsets reveals multiple selection points during peripheral B cell maturation. J Immunol. 2001;167:6834–40. doi: 10.4049/jimmunol.167.12.6834. [DOI] [PubMed] [Google Scholar]
- 33.Merrell KT, Benschop RJ, Gauld SB, Aviszus K, Decote-Ricardo D, Wysocki LJ, Cambier JC. Identification of anergic B cells within a wild-type repertoire. Immunity. 2006;25:953–62. doi: 10.1016/j.immuni.2006.10.017. [DOI] [PubMed] [Google Scholar]
- 34.Rawstron AC, Bennett FL, O'Connor SJ, et al. Monoclonal B-cell lymphocytosis and chronic lymphocytic leukemia. N Engl J Med. 2008;359:575–83. doi: 10.1056/NEJMoa075290. [DOI] [PubMed] [Google Scholar]
- 35.Blier PR, Bothwell AL. The immune response to the hapten NP in C57BL/6 mice: insights into the structure of the B-cell repertoire. Immunol Rev. 1988;105:27–43. doi: 10.1111/j.1600-065x.1988.tb00764.x. [DOI] [PubMed] [Google Scholar]
- 36.Mond JJ, Lees A, Snapper CM. T cell-independent antigens type 2. Annu Rev Immunol. 1995;13:655–92. doi: 10.1146/annurev.iy.13.040195.003255. [DOI] [PubMed] [Google Scholar]
- 37.Wang H, Feng J, Qi CF, Li Z, Morse HC, 3rd, Clarke SH. Transitional B cells lose their ability to receptor edit but retain their potential for positive and negative selection. J Immunol. 2007;179:7544–52. doi: 10.4049/jimmunol.179.11.7544. [DOI] [PubMed] [Google Scholar]
- 38.Sekiguchi DR, Yunk L, Gary D, Charan D, Srivastava B, Allman D, Weigert MG, Prak ET. Development and selection of edited B cells in B6.56R mice. J Immunol. 2006;176:6879–87. doi: 10.4049/jimmunol.176.11.6879. [DOI] [PubMed] [Google Scholar]
- 39.Yunk L, Meng W, Cohen PL, Eisenberg RA, Luning PrakET. Antibodies in a heavy chain knock-in mouse exhibit characteristics of early heavy chain rearrangement. J Immunol. 2009;183:452–61. doi: 10.4049/jimmunol.0804060. [DOI] [PMC free article] [PubMed] [Google Scholar]
- 40.Nemazee D. Receptor editing in lymphocyte development and central tolerance. Nat Rev Immunol. 2006;6:728–40. doi: 10.1038/nri1939. [DOI] [PubMed] [Google Scholar]
- 41.von Boehmer H, Melchers F. Checkpoints in lymphocyte development and autoimmune disease. Nat Immunol. 2010;11:14–20. doi: 10.1038/ni.1794. [DOI] [PubMed] [Google Scholar]
- 42.Wang YH, Diamond B. B cell receptor revision diminishes the autoreactive B cell response after antigen activation in mice. J Clin Invest. 2008;118:2896–907. doi: 10.1172/JCI35618. [DOI] [PMC free article] [PubMed] [Google Scholar]
- 43.Rowley B, Tang L, Shinton S, Hayakawa K, Hardy RR. Autoreactive B-1 B cells: constraints on natural autoantibody B cell antigen receptors. J Autoimmun. 2007;29:236–45. doi: 10.1016/j.jaut.2007.07.020. [DOI] [PMC free article] [PubMed] [Google Scholar]
- 44.Klein F, Feldhahn N, Mooster JL, Sprangers M, Hofmann WK, Wernet P, Wartenberg M, Muschen M. Tracing the pre-B to immature B cell transition in human leukemia cells reveals a coordinated sequence of primary and secondary IGK gene rearrangement, IGK deletion, and IGL gene rearrangement. J Immunol. 2005;174:367–75. doi: 10.4049/jimmunol.174.1.367. [DOI] [PubMed] [Google Scholar]
- 45.Haas KM, Poe JC, Steeber DA, Tedder TF. B-1a and B-1b cells exhibit distinct developmental requirements and have unique functional roles in innate and adaptive immunity to S. pneumoniae. Immunity. 2005;23:7–18. doi: 10.1016/j.immuni.2005.04.011. [DOI] [PubMed] [Google Scholar]
- 46.Martin F, Oliver AM, Kearney JF. Marginal zone and B1 B cells unite in the early response against T-independent blood-borne particulate antigens. Immunity. 2001;14:617–29. doi: 10.1016/s1074-7613(01)00129-7. [DOI] [PubMed] [Google Scholar]
- 47.Hayakawa K, Hardy RR, Parks DR, Herzenberg LA. The “Ly-1 B” cell subpopulation in normal immunodefective, and autoimmune mice. J Exp Med. 1983;157:202–18. doi: 10.1084/jem.157.1.202. [DOI] [PMC free article] [PubMed] [Google Scholar]
- 48.Pekarsky Y, Zanesi N, Aqeilan RI, Croce CM. Animal models for chronic lymphocytic leukemia. J Cell Biochem. 2007;100:1109–18. doi: 10.1002/jcb.21147. [DOI] [PubMed] [Google Scholar]
- 49.Pao LI, Lam KP, Henderson JM, et al. B cell-specific deletion of protein-tyrosine phosphatase Shp1 promotes B-1a cell development and causes systemic autoimmunity. Immunity. 2007;27:35–48. doi: 10.1016/j.immuni.2007.04.016. [DOI] [PubMed] [Google Scholar]
- 50.Hibbs ML, Tarlinton DM, Armes J, Grail D, Hodgson G, Maglitto R, Stacker SA, Dunn AR. Multiple defects in the immune system of Lyn-deficient mice, culminating in autoimmune disease. Cell. 1995;83:301–11. doi: 10.1016/0092-8674(95)90171-x. [DOI] [PubMed] [Google Scholar]
- 51.Hoffmann A, Kerr S, Jellusova J, et al. Siglec-G is a B1 cell-inhibitory receptor that controls expansion and calcium signaling of the B1 cell population. Nat Immunol. 2007;8:695–704. doi: 10.1038/ni1480. [DOI] [PubMed] [Google Scholar]
- 52.Ding C, Liu Y, Wang Y, Park BK, Wang CY, Zheng P. Siglecg limits the size of B1a B cell lineage by down-regulating NFkappaB activation. PLoS ONE. 2007;2:e997. doi: 10.1371/journal.pone.0000997. [DOI] [PMC free article] [PubMed] [Google Scholar]
- 53.Martin F, Kearney JF. B1 cells: similarities and differences with other B cell subsets. Curr Opin Immunol. 2001;13:195–201. doi: 10.1016/s0952-7915(00)00204-1. [DOI] [PubMed] [Google Scholar]
- 54.Montecino-Rodriguez E, Dorshkind K. New perspectives in B-1 B cell development and function. Trends Immunol. 2006;27:428–33. doi: 10.1016/j.it.2006.07.005. [DOI] [PubMed] [Google Scholar]
- 55.Khan SN, Witsch EJ, Goodman NG, et al. Editing and escape from editing in anti-DNA B cells. Proc Natl Acad Sci USA. 2008;105:3861–6. doi: 10.1073/pnas.0800025105. [DOI] [PMC free article] [PubMed] [Google Scholar]
- 56.Montecino-Rodriguez E, Leathers H, Dorshkind K. Identification of a B-1 B cell-specified progenitor. Nat Immunol. 2006;7:293–301. doi: 10.1038/ni1301. [DOI] [PubMed] [Google Scholar]
- 57.Wardemann H, Yurasov S, Schaefer A, Young JW, Meffre E, Nussenzweig MC. Predominant autoantibody production by early human B cell precursors. Science. 2003;301:1374–7. doi: 10.1126/science.1086907. [DOI] [PubMed] [Google Scholar]
- 58.Ferry H, Crockford TL, Leung JC, Cornall RJ. Signals from a self-antigen induce positive selection in early B cell ontogeny but are tolerogenic in adults. J Immunol. 2006;176:7402–11. doi: 10.4049/jimmunol.176.12.7402. [DOI] [PubMed] [Google Scholar]
- 59.Ghosn EE, Sadate-Ngatchou P, Yang Y, Herzenberg LA. Distinct progenitors for B-1 and B-2 cells are present in adult mouse spleen. Proc Natl Acad Sci U S A. 2011;108:2879–84. doi: 10.1073/pnas.1019764108. [DOI] [PMC free article] [PubMed] [Google Scholar]
- 60.Schatz DG, Swanson PC. V(D)J recombination: mechanisms of initiation. Annu Rev Genet. 2011;14:167–202. doi: 10.1146/annurev-genet-110410-132552. [DOI] [PubMed] [Google Scholar]
- 61.Pillai S, Cariappa A, Moran ST. Marginal zone B cells. Annu Rev Immunol. 2005;23:161–96. doi: 10.1146/annurev.immunol.23.021704.115728. [DOI] [PubMed] [Google Scholar]
Associated Data
This section collects any data citations, data availability statements, or supplementary materials included in this article.