

Abstract
Purpose
Next-generation sequencing (NGS) has revolutionized systems-based analysis of cellular pathways. The goals of this study are to compare NGS-derived retinal transcriptome profiling (RNA-seq) to microarray and quantitative reverse transcription polymerase chain reaction (qRT–PCR) methods and to evaluate protocols for optimal high-throughput data analysis.
Methods
Retinal mRNA profiles of 21-day-old wild-type (WT) and neural retina leucine zipper knockout (Nrl−/−) mice were generated by deep sequencing, in triplicate, using Illumina GAIIx. The sequence reads that passed quality filters were analyzed at the transcript isoform level with two methods: Burrows–Wheeler Aligner (BWA) followed by ANOVA (ANOVA) and TopHat followed by Cufflinks. qRT–PCR validation was performed using TaqMan and SYBR Green assays.
Results
Using an optimized data analysis workflow, we mapped about 30 million sequence reads per sample to the mouse genome (build mm9) and identified 16,014 transcripts in the retinas of WT and Nrl−/− mice with BWA workflow and 34,115 transcripts with TopHat workflow. RNA-seq data confirmed stable expression of 25 known housekeeping genes, and 12 of these were validated with qRT–PCR. RNA-seq data had a linear relationship with qRT–PCR for more than four orders of magnitude and a goodness of fit (R2) of 0.8798. Approximately 10% of the transcripts showed differential expression between the WT and Nrl−/− retina, with a fold change ≥1.5 and p value <0.05. Altered expression of 25 genes was confirmed with qRT–PCR, demonstrating the high degree of sensitivity of the RNA-seq method. Hierarchical clustering of differentially expressed genes uncovered several as yet uncharacterized genes that may contribute to retinal function. Data analysis with BWA and TopHat workflows revealed a significant overlap yet provided complementary insights in transcriptome profiling.
Conclusions
Our study represents the first detailed analysis of retinal transcriptomes, with biologic replicates, generated by RNA-seq technology. The optimized data analysis workflows reported here should provide a framework for comparative investigations of expression profiles. Our results show that NGS offers a comprehensive and more accurate quantitative and qualitative evaluation of mRNA content within a cell or tissue. We conclude that RNA-seq based transcriptome characterization would expedite genetic network analyses and permit the dissection of complex biologic functions.
Introduction
Next-generation sequencing (NGS) technology has launched a new era of enormous potential and applications in genomic and transcriptomic analyses [1-3]. With continued cost reductions and improved analytical methods, NGS has begun to have a direct impact on biomedical discovery and clinical outcome [4-6]. NGS has enabled “meta-genomic” studies to survey the genomes of organisms in a particular ecosystem [7], and decode the entire genomes of species ranging from bacteria [8,9] and viruses [10] to humans [11]. Whole-genome sequencing has made it possible to investigate genetic variations [12], global DNA methylation [13], and in vivo analysis of targets of DNA-binding proteins [14,15]. Deep sequencing of RNA with NGS (called “RNA-seq”) allows a comprehensive evaluation and quantification of all subtypes of RNA molecules expressed in a cell or tissue [16]. RNA-seq technology can detect transcripts expressed at low levels [17] and permit the identification of unannotated transcripts and new spliced isoforms [16,18]. The issues related to cross-hybridization and detection levels that limit the accuracy of gene expression estimates by microarray technology are not relevant to the data obtained with RNA-seq [19]. Visualization of mapped sequence reads spanning the splice junctions can also reveal novel splice forms of annotated genes in the mouse retina, which was not possible with earlier hybridization-based technologies. With a steady reduction in the costs of NGS, RNA-seq is now emerging as a method of choice for comprehensive transcriptome profiling.
The vertebrate retina exhibits a highly organized laminar structure that captures, integrates, and transmits visual information to the brain for further processing. Photoreceptors constitute more than 70% of the retinal cells and convert light into electrical signals [20]. Rod photoreceptors mediate dim light vision and can detect a single photon of light, while cone photoreceptors are responsible for daylight vision, color perception, and visual acuity [21,22]. Impairment of photoreceptor function leads to retinal degeneration with a more common pattern of rod death preceding the death of cones [23-25]. The neural retina leucine zipper (Nrl) gene encodes a basic-motif leucine zipper transcription factor necessary for determining rod photoreceptor cell fate and functional maintenance [26]. The Nrl−/− mouse, generated by creating a loss of function mutation in Nrl, has a cone-only retina that serves as a useful model for studies of cone biology [26-28].
Several previous investigations have elucidated the gene expression landscape specific to whole retina or retinal cell types and during development or aging. Serial analysis of gene expression [29-31] and cDNA eye gene arrays [32-36] were initially used to determine signatures of retinal gene expression. Oligonucleotide microarrays have since allowed a more comprehensive approach to expression profiling [37-41]. Microarray analyses of flow-sorted photoreceptors and single cells from dissociated retinas [42-44] have begun to reveal new insights into regulatory networks. Application of NGS technology greatly expands the power of expression profiling by identifying all transcripts and spliced isoforms in the tissue or cell type of interest.
Here, we have used the power of NGS-based RNA-seq analysis to investigate in depth the transcriptome of wild-type (WT) and Nrl−/− retinas and identified a set of differentially expressed genes and spliced isoforms. We have also taken advantage of the knowledge about Nrl−/− mice to optimize workflows for data analysis and compared our results with those obtained with microarray methods and quantitative reverse transcription polymerase chain reaction (qRT–PCR) analysis. Our studies illustrate that RNA-seq offers a more complete, accurate, and relatively faster approach for comparative and comprehensive analysis of retinal transcriptomes and for discovering novel transcribed sequences. Our validated data analysis workflow should also be beneficial for similar studies by other investigators. Raw data and workflow are available on the N-NRL/NEI website.
Methods
Animals and tissue collection
All investigations on mice were approved by the Animal Care and Use Committee of the National Eye Institute and followed the tenets of the Declaration of Helsinki. C57Bl/6J (referred to as wild type, WT) and Nrl−/− (on C57Bl/6J background [26]) mice were euthanized with CO2 inhalation. The retinas were excised rapidly, frozen on dry ice, and stored at −80 °C.
RNA isolation
Fresh frozen mouse retinas were lysed with a mortar and pestle in TRIzol Reagent, and total RNA was isolated according to the manufacturer’s protocol (Invitrogen, Carlsbad, CA). RNA quality and quantity were assessed with the RNA 6000 Nano Kit (Agilent, Santa Clara, CA).
NGS library construction
Whole retinal RNA samples were independently processed from three wild-type and three Nrl−/− mice at P21. Total RNA (1 μg) was used with the TruSeq mRNA-seq Sample Preparation Kit (Illumina, San Diego, CA) to construct cDNA libraries. The quality of the libraries was verified using the DNA-1000 Kit (Agilent) and quantitation performed with qRT–PCR using ABI 7900HT (Life Technologies, Carlsbad, CA), as suggested in the Sequencing Library qRT–PCR Quantification Guide (Illumina). Gene Expression Master Mix (Life Technologies) was used for the qRT–PCR reactions, and a titration of phiX control libraries was employed as the quantification standard.
Illumina sequencing
Each cDNA library (10 pM) was independently loaded into one flow cell lane, and single-read cluster generation proceeded using the TruSeq SR Cluster Generation Kit v5 (Illumina). Sequencing-by-synthesis (SBS) of 70-nucleotide length was performed on a Genome Analyzer IIx running SCS2.8 software using SBS v4 reagents (Illumina). Base calling and chastity filtering were performed using RTA (real-time analysis with SCS2.8).
Burrows–Wheeler transform-based short read aligner analysis workflow
Burrows–Wheeler Transform Aligner (BWA) [45] was used to align RNA-seq reads against the mouse reference genome (build mm9), downloaded and indexed from the University of California Santa Cruz (UCSC) genome browser database [46]. The resulting sequence alignment/map files were imported into Partek Genomics Suite (Partek Inc., St. Louis, MO) to compute raw and fragments per kilobase of exon model per million mapped (FPKM) reads normalized expression values of the transcript isoforms defined in the UCSC refFlat file. A stringent filtering criterion of FPKM value 1.0 (equivalent to one transcript per cell [16]) in at least one out of six samples was used to obtain expressed transcripts. The FPKM values of the filtered transcripts were log-transformed using log2 (FPKM+offset) with an offset=1.0. ANOVA (ANOVA) was then performed on the log-transformed data of the two groups (WT and Nrl−/−) to generate fold change and p values for each transcript. Y-chromosome transcripts were filtered out along with non-coding (nc) RNAs, mitochondrial DNA coded genes, pseudogenes, and predicted protein-coding genes. Differentially expressed mRNA isoforms were filtered for a fold change cutoff of 1.5 and p-value cutoff of 0.05. These criteria were implemented to enable a comparison with previous expression studies. Hierarchical clustering was performed using Cluster 3.0 software [47]. We used uncentered correlation as the distance metric. Heatmaps and dendrograms were generated using JavaTreeView software [48]. Aligned reads were visualized using the Integrated Genomics Viewer (IGV) [49].
TopHat/Cufflinks-based analysis workflow
Raw reads that passed the chastity filter threshold were mapped using TopHat [50] to identify known and novel splice junctions and to generate read alignments for each sample. Genomic annotations were obtained from Ensembl in gene transfer format (GTF). Splice junctions from the six samples were combined into a master junctions file that was used as an input file for the second iteration of TopHat mapping. The transcript isoform level and gene level counts were calculated and FPKM normalized using Cufflinks. An FPKM filtering cutoff of 1.0 in at least one of the six samples was used to determine expressed transcripts. Differential transcript expression was then computed using Cuffdiff. The resulting lists of differentially expressed isoforms were filtered and sorted into the following categories: protein coding mRNA transcripts and ncRNA transcripts.
qRT–PCR analysis
Reverse transcription (RT) reactions were performed using oligo(dT)20 with SuperScript II reagents (Life Technologies) according to the manufacturer’s protocol. cDNA synthesized from 2 μg of total RNA (1 μg for minus RT controls) was diluted to 100 μl (fivefold dilution), and from this 1 μl was used for each qRT–PCR reaction. The qRT–PCR reactions were performed in triplicate for TaqMan assays or in duplicate for the SYBR assays, using three biologic replicates per genotype, on a 7900HT Genetic Analyzer (Life Technologies). TaqMan assays were performed using TaqMan Gene Expression Master Mix and TaqMan Gene Expression Assays (Life Technologies) for genes listed in Table 1. The SYBR Green assays (Table 2) were performed using Power SYBR Green Master Mix (Life Technologies) and oligonucleotides at a final concentration of 200 nM. Oligonucleotides were designed using the Primer3 PCR Primer Design Tool [51] and synthesized by Integrated DNA Technologies (Coralville, IA). To eliminate complications due to contaminating genomic DNA in the RNA samples, qRT–PCR reactions were also performed with minus-RT control, using hypoxanthine guanine phosphoribosyl transferase (Hprt) primer pairs that can differentiate between mRNA and genomic DNA (data not shown). Differential expression analysis was performed using the ddCt method [52], with the geometric average of actin, beta (ActB) and Hprt as the endogenous controls [53].
Table 1. TaqMan assays employed for qRT–PCR validation.
| TaqMan assay ID | Gene symbol | Gene name |
|---|---|---|
| Mm00607939_s1 |
Actb |
actin, b |
| Mm00504628_m1 |
Arr3 |
arrestin 3, retinal |
| Mm00437764_m1 |
B2m |
b-2 microglobulin |
| Mm00474799_m1 |
Cadm3 |
cell adhesion molecule 3 |
| Mm00432322_m1 |
Casp7 |
caspase 7 |
| Mm00833234_m1 |
Cnga1 |
cyclic nucleotide gated channel a 1 |
| Mm00489232_m1 |
Cngb3 |
cyclic nucleotide gated channel b 3 |
| Mm00656724_m1 |
Egr1 |
early growth response 1 |
| Mm00442411_m1 |
Esrrb |
estrogen related receptor, b |
| Mm00438796_m1 |
Eya1 |
eyes absent 1 homolog (Drosophila) |
| Mm00445225_m1 |
Fabp7 |
fatty acid binding protein 7, brain |
| Mm99999915_g1 |
Gapdh |
glyceraldehyde-3-phosphate dehydrogenase |
| Mm00492388_g1 |
Gnat1 |
guanine nucleotide binding protein, a transducing 1 |
| Mm00492394_m1 |
Gnat2 |
guanine nucleotide binding protein, a transducing 2 |
| Mm01197698_m1 |
Gusb |
glucuronidase, b |
| Mm01318747_g1 |
Hprt1 |
hypoxanthine guanine phosphoribosyl transferase 1 |
| Mm00833431_g1 |
Hsp90ab1 |
heat shock protein 90 kDa a, class B member 1 |
| Mm01340839_m1 |
Mef2c |
myocyte enhancer factor 2C |
| Mm00443299_m1 |
Nr2e3 |
nuclear receptor subfamily 2, group E, member 3 |
| Mm00476550_m1 |
Nrl |
neural retina leucine zipper gene |
| Mm00524018_m1 |
Nxnl1 |
nucleoredoxin-like 1 |
| Mm00433560_m1 |
Opn1mw |
opsin 1 (cone pigments), medium-wave-sensitive |
| Mm00432058_m1 |
Opn1sw |
opsin 1 (cone pigments), short-wave-sensitive |
| Mm00476679_m1 |
Pde6b |
phosphodiesterase 6B, cGMP, rod receptor, b |
| Mm00473920_m1 |
Pde6c |
phosphodiesterase 6C, cGMP specific, cone, a prime |
| Mm01225301_m1 |
Pgk1 |
phosphoglycerate kinase 1 |
| Mm00519814_m1 |
Reep6 |
receptor accessory protein 6 |
| Mm00520345_m1 |
Rho |
Rhodopsin |
| Mm00524993_m1 |
Rorb |
RAR-related orphan receptor b |
| Mm01612986_gH |
Rpl13a |
ribosomal protein L13A |
| Mm02601831_g1 |
Rps26 |
ribosomal protein S26 |
| Mm00774693_g1 |
Sall3 |
sal-like 3 (Drosophila) |
| Mm01249143_g1 |
Socs3 |
suppressor of cytokine signaling 3 |
| Mm01277045_m1 |
Tbp |
TATA box binding protein |
| Mm00726185_s1 |
Tubb4 |
tubulin, b 4 |
| Mm01198158_m1 |
Ubc |
ubiquitin C |
| Mm00457574_m1 | Wisp1 | WNT1 inducible signaling pathway protein 1 |
Table 2. SYBR Green assays employed for qRT–PCR validation.
| Gene symbol | Gene name | Forward | Reverse |
|---|---|---|---|
| Abca13 (Exon 53/55) |
ATP-binding cassette, sub-family A (ABC1), member 13 |
GACCTTCTGAGATGGCCAAG |
TTAACTCCAAGGAGCCCAAA |
| Abca13 (Exon 58/60) |
ATP-binding cassette, sub-family A (ABC1), member 13 |
CGGTACCTCTGGCAAACAAT |
GGAAATGGAGCTTCAAGCAG |
| Acoxl |
acyl-CoA oxidase-like |
TGCTGTATGGAACGAAGCTG |
TGTGGAATGTTGAAGGCAGA |
| Akt3 |
thymoma viral proto-oncogene 3 |
CATCTGAAACAGACACCCGATA |
GTCCGCTTGCAGAGTAGGAG |
| Cadm3 |
cell adhesion molecule 3 |
AGGGATTGTGGCTTTCATTG |
CTAGGGGCTCAGGAGTTGTG |
| Ccdc24 |
coiled-coil domain containing 24 |
TGTCACATGTTGCAGAACGA |
TCTAAGGCTGGGAATGGATG |
| Cd8a |
CD8 antigen, alpha chain |
GACATCTCAGCCCCAGAGAC |
GCTTGCCTTCCTGTCTGACT |
| Cox5b |
cytochrome c oxidase, subunit Vb |
CGTCCATCAGCAACAAGAGA |
ATAACACAGGGGCTCAGTGG |
| Ctss |
cathepsin S |
TAAAGGGCCTGTCTCTGTGG |
GCCATCCGAATGTATCCTTG |
| Drd4 |
dopamine receptor D4 |
AGACTGCCCACCTCCCTTAC |
AAGAAAGGCGTCCAACACAC |
| Dynlt3 |
dynein light chain Tctex-type 3 |
TTGATGGAGTTTTGGGTGGT |
GGTACGGTTCTCCCATCTGA |
| Hr |
hairless |
GCCCTCTCTGCTCAGCTCTA |
CGGACCACACCGTCTAAGTT |
| Klf9 |
Kruppel-like factor 9 |
ACAGTGGCTGTGGGAAAGTC |
CATGCTTGGTGAGATGGTCA |
| Klhl3 |
kelch-like 3 |
GAGCACTGGGAGGAGCTATG |
AGGAGGTTGGTCTGCTGAGA |
| Klhl33 |
kelch-like 33 |
AGCTTCTTCCCTTTGGTGGT |
CTACAGCCACCGCTGACATA |
| Neurod1 |
neurogenic differentiation 1 |
GCGTTGCCTTAGCACTTCTT |
AGGAGTGTGTGTTGGCATTT |
| Nipal1 |
NIPA-like domain containing 1 |
CCCACAAGAGGGAGAAGTCA |
GTAAACAGGCTTCCGTTCCA |
| Pip5k1a |
phosphatidylinositol-4-phosphate 5-kinase, type 1 alpha |
GGGGAACACAGAGCACAAGT |
GGTCTTCTGAGGCTCACTGC |
| Plekhf2 |
pleckstrin homology domain containing, family F (with FYVE domain) member 2 |
GTTGTCGGGTTCGACTGGA |
TGCGTCTAGTATTCGCCTCAC |
| Rab18 |
RAB18, member RAS oncogene family |
TGCACGCAAGCATTCTATGT |
GGCTCTCTTCCCTGTGTGAC |
| Rgs22 |
regulator of G-protein signaling 22 |
GCCCAGAAGATCCTTGAACA |
CGCCTTGTCCTCTTCTGTGT |
| Rpgrip1 |
retinitis pigmentosa GTPase regulator interacting protein 1 |
GCCATGCTACATGCTCAAGA |
TTTGGATGGCCTGGTTTCTA |
| Sema7a |
sema domain, immunoglobulin domain (Ig), and GPI membrane anchor, (semaphorin) 7A |
TCTACAGCTCCCAACGATCA |
GCTCACAGCTCTGTTCCACA |
| Txnip |
thioredoxin interacting protein |
TATGTACGCCCCTGAGTTCC |
GTTCCCCGCTGTAGAGACTG |
| Wisp1 |
WNT1 inducible signaling pathway protein 1 |
GCTCTACCACCTGTGGCCTA |
ACAGCCTGCGAGAGTGAAGT |
| Wscd2 | WSC domain containing 2 | TCTGCATCAAGACCCATGAA | ACGGTCTTGCCAAACTTGAG |
Results
Sequencing run summary
Six libraries of P21 retinal cDNA (three each from WT and Nrl−/−) were sequenced to obtain 35 to 49 million raw sequence reads per sample (Table 3). Of these, 75.8% to 82.7% reads passed the RTA chastity filter and were used for subsequent Burrows–Wheeler Aligner (BWA) and TopHat analysis workflows (Figure 1). Due to TopHat workflow’s power to map across splice junctions, the workflow consistently yielded 6 to 7 million more alignments per sample when compared to BWA.
Table 3. Summary of Illumina base calling and alignments.
|
Genotype |
WT |
WT |
WT |
Nrl−/− |
Nrl−/− |
Nrl−/− |
|---|---|---|---|---|---|---|
| Sample 1 | Sample 2 | Sample 3 | Sample 1 | Sample 2 | Sample 3 | |
| Total reads |
35,872,080 |
41,785,800 |
49,076,400 |
46,689,240 |
48,480,240 |
48,656,040 |
| PF Reads |
29,603,280 |
33,251,160 |
37,642,800 |
36,472,800 |
37,119,960 |
36,823,320 |
| |
82.7% |
79.7% |
76.9% |
78.2% |
76.7% |
75.8% |
| BWA alignments |
24,992,271 |
27,922,997 |
32,085,799 |
30,960,565 |
31,374,578 |
31,257,335 |
| TopHat alignments | 30,769,939 | 34,177,120 | 39,222,596 | 38,289,469 | 38,744,790 | 38,593,533 |
Each of the 3 week old WT and Nrl−/− retina sample was sequenced on a separate lane of the Illumina GAIIx flow cell to obtain 35 to 49 million raw reads. Over 75% of the raw reads passed Illumina’s read chastity threshold to yield 29 to 37 million usable PF reads. TopHat mapping always gave significantly more alignments than BWA because of its ability to map across the splice junctions. A relatively smaller numbers of reads and alignments for WT samples 1 and 2 are not a matter of concern as FPKM normalization was used to assess the transcript isoform expression. WT=wild type. PF=pass filter
Figure 1.
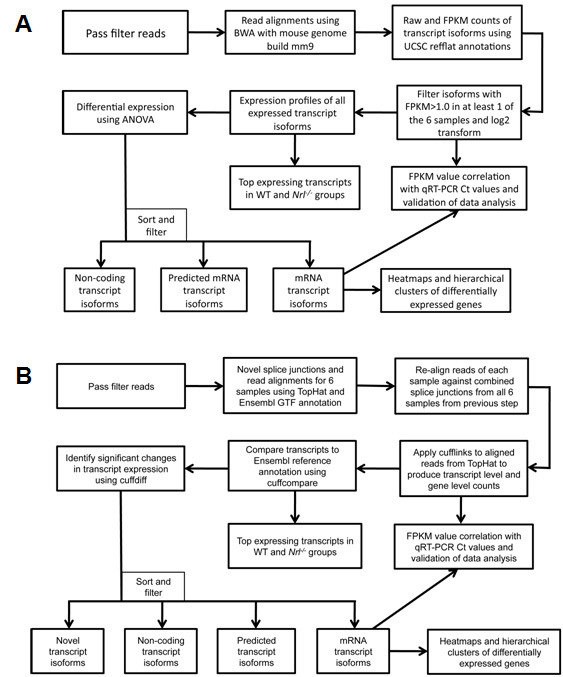
Flowchart of RNA-seq data analysis methodology using Burrows-Wheeler Aligner (BWA) and TopHat. Schematic representation of two RNA-seq data analysis workflows and resulting views of the data generated. A: BWA workflow: Gapped alignments are performed using the BWA algorithm against the mouse reference genome build mm9, and estimation of the expression of genes at the transcript isoform level is performed by importing aligned reads into the Partek Genomics Suite using annotations provided by the University of California Santa Cruz (UCSC) refflat.txt file. Transcripts expressed at low levels in all samples (<1 fragments per kilobase of exon model per million mapped reads [FPKM]) are filtered out. Differential expression analysis was performed by applying the ANOVA (ANOVA) method, and the resulting list was sorted and filtered into different transcript groups. Clustering of rod and cone enriched genes was performed using Cluster 3.0 software (see Methods). B: TopHat workflow: Splice junction mapping was performed using the TopHat algorithm in two phases. In the first phase, splice junctions were detected de novo from the reads from each sample and combined to obtain a master splice junctions list. In the second phase of TopHat alignment, reads from each sample were re-aligned by providing the master junctions list as input. The two-phase mapping approach significantly increased the number of alignments spanning the splice junctions. Estimation of gene expression and differential expression were computed using Cufflinks, Cuffcompare, and Cuffdiff. Sorting and filtering of transcript isoforms were performed as in the BWA workflow.
BWA workflow
Based on the BWA analysis workflow, 16,014 transcripts were detected with a normalized FPKM value greater than 1.0 in any of the six samples. Transcripts were filtered based on whether they were mRNAs or ncRNAs. Of the 15,142 mRNA transcripts, only 1,422 met our criteria of differential expression of having a fold change greater than 1.5 and a p-value less than 0.05 (Table 4). Of the 1,422 differentially expressed mRNA transcripts (DETs) representing 1,218 unique genes, 551 were downregulated in Nrl−/− (including rod-specific genes) retinas, and 871 were upregulated in Nrl−/− (including cone-enriched genes and those involved in retinal remodeling) retinas.
Table 4. Summary of transcript isoforms detected by BWA/ANOVA and TopHat/Cufflinks workflows.
| Analysis | BWA/ANOVA | TopHat/Cufflinks |
|---|---|---|
| Total detected transcripts |
16,014 |
34,115 |
| mRNA |
15,142 |
32,001 |
| mRNA DETs | 1,422 | 3,258 |
The BWA workflow employed refflat.txt annotation for mouse build mm9 from UCSC genome browser. The TopHat workflow employed GTF annotation for mouse build mm9 from the Ensembl database. After FPKM filtering (see Materials and Methods), transcribed features were classified as protein coding mRNAs and non-coding (nc) RNAs. The features classified as protein-coding mRNAs were further filtered based on fold change (≥1.5) and p-value (<0.05) to be considered significantly differentially expressed transcripts (DETs).
TopHat workflow
A total of 34,115 transcripts were detected with a normalized FPKM value of greater than 1.0 in any of the samples in either group. Transcripts were filtered based on whether they were protein-coding mRNAs or ncRNAs. Of the 32,001 mRNA transcripts, only 3,258 met our criteria of differential expression (Table 4). The DETs represented 1990 unique genes; 1,504 were downregulated in Nrl−/− (including rod-specific genes) retinas, and 1,754 were upregulated in the Nrl−/− (including cone-enriched genes and those involved in retinal remodeling) retinas.
Comparison of the results from BWA and TopHat analyses
The BWA/ANOVA and TopHat/Cufflinks analyses were compared to assess the consistency and quality of the results. Using the official Mouse Genome Informatics gene symbol as the linking term, Venn diagrams were constructed to summarize the overlap between the set of all (Figure 2A), the top 500 (Figure 2B), and the top 200 (Figure 2C) DETs from the BWA workflow and the DET list from the TopHat workflow. A comparison of the full list of BWA DETs to the TopHat list revealed only 51.7% overlap between the differentially expressed genes (DEGs) from BWA and TopHat. This overlap increased to 73.8% and 87.8% when only the top 500 and 200 DEGs from BWA, respectively, were considered. Subsequent analyses were performed using BWA data.
Figure 2.

Venn diagrams comparing differentially expressed transcripts (DETs) between the Nrl−/− and WT groups from BWA and TopHat analyses. Despite major differences in the UCSC refFlat annotations used by Burrows-Wheeler Aligner (BWA) and Ensembl annotations used by TopHat, most of the genes identified by BWA were also identified as significant by TopHat. A: Comparison of the total number of DETs identified as significant (fold change ≥1.5 and p-value <0.05) by the two methods. B: Inclusion of the top 500 DETs (424 unique genes) identified as significant by BWA and in the full TopHat DET list. C: Inclusion of the top 200 DETs (179 unique genes) identified as significant by BWA and in the full TopHat DET list. We assess the two methods based on a comparison of qRT–PCR data for the genes detected by either or both methods. The discrepancy between the results can be attributed to differences in the input annotation files used (UCSC refFlat versus Ensembl GTF) by the two methods and their alignment algorithms.
Regression analysis of quantitative expression values obtained with RNA-seq and TaqMan qRT–PCR assays
We first assessed the correlation between the FPKM values (obtained with RNA-seq) with their corresponding qRT–PCR crossing threshold (Ct) values from the TaqMan assays; the two values represent the quantitative levels of expression of a specific transcript in the RNA sample. For this purpose, we chose 24 differentially expressed genes (DEGs, reflecting a wide range of expression) and 12 housekeeping genes (HKGs). The Ct values from three biologic replicates (without normalization) were then compared to the corresponding log2 FPKM values (Figure 3). A least-squares regression analysis of DEGs provided an R2 value of 0.8798, with a corresponding slope of −1.056, suggesting a strong inverse relationship between Ct and log2 FPKM values over a dynamic range of 4–5 orders of magnitude. Only one out of 24 genes, cell adhesion molecule 3 (Cadm3), fell outside this correlation. Further investigation of the RNA-seq aligned reads showed that our qRT–PCR assay was specific for only one of the two retina-expressed spliced isoforms of Cadm3. The reanalysis using a SYBR assay designed to detect both Cadm3 transcripts confirmed the linear correlation between RNA-seq and qRT–PCR analysis. Interestingly, FPKM and Ct values for 6 of the 12 HKGs did not show the expected linear relationship; these included ubiquitin C (Ubc), ActB, ribosomal protein L13A (Rpl13a), ribosomal protein S26 (Rps26), phosphoglycerate kinase 1 (Pgkl), and most severely glyceraldehyde-3-phosphate dehydrogenase (Gapdh). With the exception of Ubc that was underestimated by qRT–PCR (in the same manner as Cadm3), the BWA workflow underestimated all others.
Figure 3.

Correlation of RNA-seq and qRT–PCR. The correlations between the RNA-seq fragments per kilobase of exon model per million mapped reads (FPKM) values and the corresponding qRT–PCR crossing threshold (Ct) values are shown. FPKM values represented in log2 scale, and non-normalized Ct values are an average of three biologic replicates. Data generated from differentially expressed genes (black) is contrasted with data generated from the housekeeping genes (red). The dashed line, associated equation, and goodness of fit value were generated by least-squares regression analysis of the differentially expressed data set. Since a lower Ct value indicates an increased initial amount of target mRNA, an inverse relationship between FPKM and Ct values is expected if a correlation exists.
A comparison of RNA-seq and qRT–PCR data for housekeeping genes
RNA-seq data were evaluated for the expression of 27 established HKGs (Table 5) included in the control qRT–PCR plates from the following vendors: Life Technologies (Mouse Endogenous Control Array), SA Biosciences, Frederick, MD (Mouse Housekeeping Genes RT2 Profiler PCR Array), and Qiagen, Valencia, CA (QuantiTect Housekeeping Genes). Comparison of qRT–PCR data for 12 genes (that were tested) showed almost complete concordance of expression with the RNA-seq results. Only one gene, Ubc, revealed a significant difference in expression between the WT and Nrl−/− retinas with qRT–PCR (−1.89 fold) compared to the RNA-seq (−1.19 fold) analyses. Gapdh showed a relatively high change in expression in qRT–PCR and RNA-seq (−1.49 and −1.37 fold, respectively). Hprt and Rpl13a revealed lower variation in qRT–PCR and RNA-seq, respectively. Actb, TATA box binding protein (Tbp), glucuronidase, beta (Gusb), and Pgk1 were among the best HKGs for qRT–PCR and RNA-seq normalization. For further qRT–PCR analyses, we employed ActB and Hprt in all normalization calculations.
Table 5. Quantitative expression profiles of housekeeping genes obtained by qRT–PCR and RNA-seq.
| Transcript | Gene ID | Description | WT FPKM | Nrl−/− FPKM | RNA-seq FC | WT Ct | Nrl−/− Ct | qPCR FC |
|---|---|---|---|---|---|---|---|---|
|
NM_007393 |
Actb |
Actin, b |
136.24 |
128 |
−1.07 |
19.61 |
19.84 |
−1.17 |
|
NM_020559 |
Alas1 |
Aminolevulinic acid synthase 1 |
8.06 |
8.46 |
1.05 |
|
|
|
|
NM_009735 |
B2m |
β 2-microglobulin |
11.88 |
20.11 |
1.71 |
25.67 |
25.09 |
1.5 |
|
NM_019468 |
G6pd2 |
Glucose-6-phosphate dehydrogenase 2 |
9.85 |
12.13 |
1.23 |
|
|
|
|
NM_008084 |
Gapdh |
Glyceraldehyde-3-phosphate dehydrogenase |
6.68 |
4.47 |
−1.49 |
17.64 |
18.09 |
−1.37 |
|
NM_010368 |
Gusb |
b-glucuronidase |
3.63 |
4 |
1.1 |
28.72 |
28.67 |
1.03 |
|
NM_008194 |
Gyk |
Glycerol kinase |
2.62 |
2.69 |
1.02 |
|
|
|
|
NM_001110251 |
Hmbs
(isoform 2) |
Hydroxymethylbilane synthase |
3.16 |
3.25 |
1.03 |
|
|
|
|
NM_013551 |
Hmbs
(isoform 1) |
Hydroxymethylbilane synthase |
1.89 |
2.1 |
1.11 |
|
|
|
|
NM_013556 |
Hprt |
Hypoxanthine guanine phosphoribosyl transferase |
47.5 |
65.34 |
1.37 |
22.61 |
22.58 |
1.02 |
|
NM_008302 |
Hsp90ab1 |
Heat shock protein 90 kDa α class B member 1 |
149.09 |
199.47 |
1.33 |
22.51 |
22.25 |
1.2 |
|
NM_001081113 |
Ipo8 |
Importin 8 |
10.48 |
11.31 |
1.08 |
|
|
|
|
NM_023144 |
Nono |
Non-POU-domain-containing octamer-binding |
28.64 |
38.59 |
1.35 |
|
|
|
|
NM_008828 |
Pgk1 |
Phosphoglycerate kinase 1 |
17.88 |
16.91 |
−1.06 |
20.86 |
21.05 |
−1.15 |
|
NM_009089 |
Polr2a |
Polymerase (RNA) II (DNA directed) polypeptide A |
50.56 |
36.5 |
−1.39 |
|
|
|
|
NM_008907 |
Ppia |
Peptidylprolyl isomerase A (cyclophilin A) |
2.38 |
2.68 |
1.13 |
|
|
|
|
NM_009438 |
Rpl13a |
Ribosomal protein L13A |
45.25 |
44.63 |
−1.01 |
20.22 |
20.62 |
−1.32 |
|
NM_007475 |
Rplp0 |
Ribosomal protein large P0 |
39.12 |
39.67 |
1.02 |
|
|
|
|
NM_026020 |
Rplp2 |
Ribosomal protein large P2 |
18.51 |
17.15 |
−1.07 |
|
|
|
|
NM_013765 |
Rps26 |
Ribosomal protein S26 |
22.94 |
21.71 |
−1.06 |
21.7 |
21.94 |
−1.19 |
|
NM_023281 |
Sdha |
Succinate dehydrogenase complex subunit A, flavoprotein |
74.03 |
80.45 |
1.09 |
|
|
|
|
NM_013684 |
Tbp |
TATA box binding protein |
18.51 |
18.9 |
1.02 |
25 |
25.24 |
−1.18 |
|
NM_011638 |
Tfrc |
Transferrin receptor |
34.3 |
37.53 |
1.09 |
|
|
|
|
NM_011654 |
Tuba2 |
Tubulin, α 2 |
37.53 |
46.85 |
1.25 |
|
|
|
|
NM_009451 |
Tubb4 |
Tubulin β 4 |
79.34 |
80.45 |
1.01 |
23.13 |
23.45 |
−1.25 |
|
NM_019639 |
Ubc |
Ubiquitin C |
33.13 |
27.86 |
−1.19 |
28.29 |
29.21 |
−1.89 |
| NM_011740 | Ywhaz | Tyrosine 3-monooxygenase-tryptophan 5-monooxygenase activation protein z polypeptide | 38.05 | 51.98 | 1.37 |
We evaluated housekeeping genes (HKGs) for their expression in RNA-seq data and by qRT–PCR analysis. Rows in bold indicate genes that are significantly differentially expressed and hence not good choices for HKGs. WT=wild type, Ct=crossing threshold, FPKM=fragments per kilobase of exon model per million mapped reads.
A comparison of RNA-seq and qRT–PCR analysis for DEGs
Based on the RNA-seq data from the WT and Nrl−/− retinas, we selected 25 DEGs (12 downregulated and 13 upregulated) showing a wide range of differential expression for validation with qRT–PCR analysis. qRT–PCR data for all genes validated the RNA-seq results (Figure 4). The WNT1 inducible signaling pathway protein 1 (Wisp1) TaqMan assay did not produce an amplicon in any of the experiments performed; subsequent examination of the RNA-seq data revealed that this assay did not correspond to the splice variant expressed in the retina. Additional analysis using a SYBR assay with oligonucleotides specific to the retinal splice variant confirmed the differential expression of Wisp1 (−43.9 fold change) in the Nrl−/− retina compared to the WT.
Figure 4.

qRT–PCR validation of RNA-seq results. Comparison of differential expression values determined by RNA-seq (dark gray) and qRT–PCR (light gray) for 25 differentially expressed genes identified by Burrows-Wheeler Aligner (BWA) workflow. Error bars represent the standard error of the mean. Neural retina leucine zipper gene (Nrl) was not detectable by qRT–PCR and therefore are left blank in the graph. Note that Rhodopsin (Rho), guanine nucleotide binding protein, alpha transducing 1 (Gnat1), cyclic nucleotide gated channel alpha 1 (Cnga1), and nuclear receptor subfamily 2, group E, member 3 (Nr2e3) having average crossing threshold (Ct) values greater than 30 in the Nrl−/− samples are considered extremely low to non-expressing.
Expression levels of transcripts in the WT and Nrl−/− retina
The preceding analysis clearly demonstrates the high reliability and accuracy of the data obtained with RNA-seq methodology. We therefore used RNA-seq data to derive absolute expression levels of individual transcripts. The top 25 genes highly expressed in the WT or Nrl−/− retina are listed in Table 6 and Table 7. As predicted, most of these genes encode proteins involved in photoreceptor function/metabolism.
Table 6. Top 25 highly expressed transcripts in wild-type retina based on RNA-seq data.
| Transcript ID | Gene ID | Gene name | WT FPKM | Nrl−/− FPKM |
|---|---|---|---|---|
|
NM_145383 |
Rho |
Rhodopsin |
8135.4 |
1.7 |
|
NM_008140 |
Gnat1 |
Guanine nucleotide binding protein γ transducing activity polypeptide 1 |
4011.7 |
2 |
|
NM_008938 |
Prph2 |
Peripherin 2 |
1448.2 |
367.1 |
|
NM_012065 |
Pde6g |
Phosphodiesterase 6G cGMP-specific rod γ |
1269.5 |
552.6 |
|
NM_009073 |
Rom1 |
Retinal outer segment membrane protein 1 |
948.8 |
229.1 |
|
NM_015745 |
Rbp3 |
Retinol binding protein 3 |
885.3 |
1024 |
|
NM_009118 |
Sag |
S-antigen retina and pineal gland |
765.4 |
548.7 |
|
NM_011676 |
Unc119 |
Unc-119 homolog |
719.1 |
407.3 |
|
NM_024458 |
Pdc |
Phosducin |
689.8 |
302.3 |
|
NM_009038 |
Rcvrn |
Recoverin |
643.6 |
288 |
|
NM_011099 |
Pkm2 |
Pyruvate kinase muscle |
604.7 |
467.9 |
|
NM_001159730 |
Pdc |
Phosducin |
580 |
250.7 |
|
NM_146079 |
Guca1b |
Guanylate cyclase activator 1B |
552.6 |
68.1 |
|
NM_008131 |
Glul |
Glutamate-ammonia ligase |
545 |
530.1 |
|
NM_001136074 |
Nrl |
Neural retina leucine zipper |
545 |
1.9 |
|
NM_001160017 |
Gnb1 |
Guanine nucleotide binding protein β polypeptide 1 |
487.8 |
24.4 |
|
NM_011428 |
Snap25 |
Synaptosomal-associated protein 25 kDa |
471.1 |
576 |
|
NM_146086 |
Pde6a |
Rod photoreceptor cGMP phosphodiesterase a subunit |
433.5 |
35.8 |
|
NM_026358 |
4930583H14Rik |
Unknown |
407.3 |
362 |
|
NM_013415 |
Atp1b2 |
ATPase Na+K+ transporting β 2 polypeptide |
369.6 |
608.9 |
|
NM_144921 |
Atp1a3 |
Α 3 subunit of Na+K+ ATPase |
367.1 |
286 |
|
NM_008806 |
Pde6b |
Phosphodiesterase 6B cGMP-specific rod β |
364.6 |
16.2 |
|
NM_001160016 |
Gnb1 |
Guanine nucleotide binding protein β polypeptide 1 |
352.1 |
18.1 |
| |
(isoform 2) |
|
|
|
|
NM_008142 |
Gnb1 |
Guanine nucleotide binding protein β polypeptide 1 |
349.7 |
17.9 |
| |
(isoform 1) |
|
|
|
| NM_010314 | Gngt1 | Guanine nucleotide binding protein g transducing activity polypeptide 1 | 340.1 | 203.7 |
As photoreceptors constitute almost 70% of cells in P21 WT and Nrl−/− retina, the high expressed genes (in bold) likely encode proteins associated with general photoreceptor function/metabolism. WT=wild type
Table 7. Top 25 highly expressed transcripts in Nrl−/− retina based on RNA-seq data.
| Transcript ID | Gene ID | Gene name | WT FPKM | Nrl−/− FPKM |
|---|---|---|---|---|
|
NM_007538 |
Opn1sw |
Opsin 1 short-wave-sensitive |
149.1 |
2740.1 |
|
NM_015745 |
Rbp3 |
Retinol binding protein 3 |
885.3 |
1024 |
|
NM_008141 |
Gnat2 |
Guanine nucleotide binding protein a transducing 2 |
70.5 |
861.1 |
|
NM_013530 |
Gnb3 |
Guanine nucleotide binding protein β polypeptide 3 |
103.3 |
786.9 |
|
NM_133205 |
Arr3 |
Arrestin 3, retinal |
69.6 |
652.6 |
|
NM_023898 |
Pde6h |
Phosphodiesterase 6H cGMP-specific cone g |
91.1 |
634.7 |
|
NM_013415 |
Atp1b2 |
ATPase Na+K+ transporting β 2 polypeptide |
369.6 |
608.9 |
|
NM_011428 |
Snap25 |
Synaptosomal-associated protein 25 kDa |
471.1 |
576 |
|
NM_012065 |
Pde6g |
Phosphodiesterase 6G cGMP-specific rod g |
1269.5 |
552.6 |
|
NM_009118 |
Sag |
S-antigen retina and pineal gland |
765.4 |
548.7 |
|
NM_008131 |
Glul |
Glutamate-ammonia ligase |
545 |
530.1 |
|
NM_053245 |
Aipl1 |
Aryl hydrocarbon receptor interacting protein-like 1 |
313 |
515.6 |
|
NM_009305 |
Syp |
Synaptophysin |
326.3 |
505 |
|
NM_008189 |
Guca1a |
Guanylate cyclase activator 1A (retina) |
306.6 |
487.8 |
|
NM_011099 |
Pkm2 |
Pyruvate kinase muscle |
604.7 |
467.9 |
|
NM_013494 |
Cpe |
Carboxypeptidase E |
337.8 |
439.6 |
|
NM_023121 |
Gngt2 |
Guanine nucleotide binding protein g transducing activity polypeptide 2 |
32 |
407.3 |
|
NM_011676 |
Unc119 |
Unc-119 homolog |
719.1 |
407.3 |
|
NM_021273 |
Ckb |
Creatine kinase brain |
290 |
398.9 |
|
NM_007450 |
Slc25a4 |
Solute carrier family 25 member 4 |
313 |
385.3 |
|
NM_008938 |
Prph2 |
Peripherin 2 |
1448.2 |
367.1 |
|
NM_026358 |
4930583H14Rik |
Unknown |
407.3 |
362 |
|
NM_016774 |
Atp5b |
ATP synthase H+ transporting mitochondrial F1 complex β polypeptide |
315.2 |
352.1 |
|
NM_001038664 |
Gngt2 |
Guanine nucleotide binding protein γ transducing activity polypeptide 2 |
22.6 |
337.8 |
| NM_010106 | Eef1a1 | Eukaryotic translation elongation factor 1 α 1 | 265 | 328.6 |
As photoreceptors constitute almost 70% of cells in P21 WT and Nrl−/− retina, the high expressed genes (in bold) likely encode proteins associated with general photoreceptor function/metabolism. WT=wild type
Rod and cone photoreceptor enriched genes
We then focused on DEGs between the Nrl−/− and WT retinas. A total of 1,422 transcripts, corresponding to 1,218 unique genes, showed a minimum fold change of 1.5 at p≤0.05. Hierarchical clustering of all differentially expressed transcripts resulted in two distinct clusters: one cluster of 477 genes downregulated in the Nrl−/− retina includes all known rod-specific genes such as rhodopsin (Rho; FC=-4,804), guanine nucleotide binding protein, alpha transducing 1 (Gnat1; FC=-2,034), and nuclear receptor subfamily 2, group E, member 3 (Nr2e3; FC=-227.5; Figure 5A and Table 8); and the other cluster of 741 upregulated genes had all cone-specific genes such as opsin 1, short-wave-sensitive (Opn1sw; FC=18.4), cyclic nucleotide gated channel beta 3 (Cngb3; FC=18.1), and Gnat2 (FC=12.2; Figure 5B and Table 9).
Figure 5.

Heatmaps and hierarchical clusters of differentially expressed rod-specific genes and cone-specific genes or those involved in retinal remodeling. Heatmaps with dendrograms of clusters of differentially expressed rod genes (A) and cone / retinal remodeling genes (B) by applying hierarchical clustering. A filtered list of mRNA transcript isoforms was further revised for fold change ≥1.5 and p-value <0.05, and duplicate gene symbol rows were deleted to retain the most expressed isoform as reflective of the gene. This list was used to generate the heatmap and the master cluster. Specific clusters of rod specific genes and cone-specific or retinal remodeling genes were identified as clusters containing known rod genes (e.g., Rhodopsin [Rho], guanine nucleotide binding protein, alpha transducing 1 [Gnat1], cyclic nucleotide gated channel alpha 1 [Cnga1], and nuclear receptor subfamily 2, group E, member 3 [Nr2e3]) and cone genes (e.g., fatty acid binding protein 7, brain [Fabp7], cyclic nucleotide gated channel alpha 3 [Cnga3], cyclic nucleotide gated channel beta 3 [Cngb3]). Columns 1, 2, and 3 are wild-type samples, and columns 4, 5, and 6 are Nrl−/− samples.
Table 8. Top 25 transcripts down-regulated in Nrl−/− retina compared to WT.
| Transcript | Gene ID | Gene name | WT FPKM | Nrl−/− FPKM | FC |
|---|---|---|---|---|---|
|
NM_145383 |
Rho |
Rhodopsin |
8135.4 |
1.7 |
−4803.93 |
|
NM_008140 |
Gnat1 |
Guanine nucleotide binding protein γ transducing activity polypeptide 1 |
4011.7 |
2 |
−2033.85 |
|
NM_001136074 |
Nrl |
Neural retina leucine zipper |
545 |
1.9 |
−284.05 |
|
NM_007723 |
Cnga1 |
Intracellular cGMP activated cation channel |
232.3 |
1 |
−229.13 |
|
NM_013708 |
Nr2e3 |
Nuclear receptor subfamily 2 group E member 3 |
237.2 |
1 |
−227.54 |
|
NM_144813 |
Slc24a1 |
Solute carrier family 24 member 1 (sodium-potassium-calcium exchanger 1) |
263.2 |
3.2 |
−81.57 |
|
NM_145963 |
Kcnj14 |
Potassium inwardly-rectifying channel subfamily J member 14 |
63.6 |
1.4 |
−44.02 |
|
NM_139292 |
Reep6 |
Receptor accessory protein 6 |
317.4 |
8.6 |
−36.76 |
|
NM_025491 |
Susd3 |
Sushi domain containing 3 |
58.1 |
1.7 |
−34.06 |
|
NM_011934 |
Esrrb
(isoform 1) |
Estrogen-related receptor β |
67.2 |
2.6 |
−26.17 |
|
NM_001007576 |
Gucy2f |
Guanylate cyclase 2f |
36.5 |
1.6 |
−22.78 |
|
NM_008806 |
Pde6b |
Phosphodiesterase 6B cGMP-specific rod β |
364.6 |
16.2 |
−22.32 |
|
NM_001195413 |
Cngb1 |
Cyclic nucleotide gated channel β 1 |
52.3 |
2.5 |
−21.11 |
|
NM_001160017 |
Gnb1
(isoform 3) |
Guanine nucleotide binding protein β polypeptide 1 |
487.8 |
24.4 |
−19.97 |
|
NM_008736 |
Nrl |
Neural retina leucine zipper |
20 |
1 |
−19.97 |
|
NM_008142 |
Gnb1
(isoform 1) |
Guanine nucleotide binding protein β polypeptide 1 |
349.7 |
17.9 |
−19.7 |
|
NM_007472 |
Aqp1 |
Aquaporin 1 |
42.5 |
2.2 |
−19.56 |
|
NM_001160016 |
Gnb1
(isoform 2) |
Guanine nucleotide binding protein β polypeptide 1 |
352.1 |
18.1 |
−19.29 |
|
NM_153803 |
Glb1l2 |
Galactosidase, β 1-like 2 |
55.7 |
3.5 |
−16.11 |
|
NM_001159500 |
Esrrb
(isoform 2) |
Estrogen-related receptor β |
22.5 |
1.5 |
−15.03 |
|
NM_172802 |
Fscn2 |
Fascin homolog 2, actin-bundling protein, retinal |
41.6 |
3 |
−14.03 |
|
NM_001033498 |
Gramd2 |
Member of the GRAM domain containing family |
20.3 |
1.4 |
−14.03 |
|
NM_027001 |
2610034M16Rik |
Unknown |
69.6 |
5.1 |
−13.64 |
|
NM_018865 |
Wisp1 |
WNT1 inducible signaling pathway protein |
17.8 |
1.4 |
−12.21 |
| NM_146086 | Pde6a | Rod photoreceptor cGMP phosphodiesterase α subunit | 433.5 | 35.8 | −12.13 |
Many of the genes down-regulated in Nrl−/− retina represent rod-specific transcripts, whereas upregulated genes include those associated with cone function and retinal remodeling.
Table 9. Top 25 transcripts upregulated in Nrl−/− retina compared to WT.
| Transcript | Gene ID | Gene title | WT FPKM | Nrl−/− FPKM | FC |
|---|---|---|---|---|---|
|
NM_021272 |
Fabp7 |
Fatty acid binding protein 7 brain |
2.5 |
62.7 |
24.59 |
|
NM_007538 |
Opn1sw |
Opsin 1 short-wave-sensitive |
149.1 |
2740.1 |
18.38 |
|
NM_013927 |
Cngb3 |
Cyclic nucleotide gated channel β 3 |
4.7 |
85.6 |
18.13 |
|
NM_033614 |
Pde6c
(isoform 1) |
Phosphodiesterase 6C, cGMP-specific, cone, α prime |
12.6 |
199.5 |
15.78 |
|
NM_001170959 |
Pde6c
(isoform 2) |
Phosphodiesterase 6C, cGMP-specific, cone, α prime |
13.8 |
207.9 |
14.93 |
|
NM_001038664 |
Gngt2
(isoform 2) |
Guanine nucleotide binding protein γ transducing activity polypeptide 2 |
22.6 |
337.8 |
14.93 |
|
NM_001166651 |
Klhl33 |
Kelch-like 33 |
3 |
42.2 |
14.03 |
|
NM_007627 |
Cckbr |
Cholecystokinin B receptor |
3.6 |
50.2 |
13.83 |
|
NM_017474 |
Clca3 |
Chloride channel calcium activated 3 |
3.4 |
46.2 |
13.64 |
|
NM_027132 |
Otop3 |
Otopetrin 1 homolog |
4.4 |
56.5 |
12.82 |
|
NM_023121 |
Gngt2
(isoform 1) |
Guanine nucleotide binding protein γ transducing activity polypeptide 2 |
32 |
407.3 |
12.73 |
|
NM_178747 |
Gulo |
L gulonolactone oxidase |
6.5 |
82.7 |
12.64 |
|
NM_008141 |
Gnat2 |
Guanine nucleotide binding protein γ transducing activity polypeptide 2 |
70.5 |
861.1 |
12.21 |
|
NM_145574 |
Ccdc136 |
Coiled-coil domain containing 136 |
17.6 |
213.8 |
12.13 |
|
NM_009918 |
Cnga3 |
Cyclic nucleotide gated channel α 3 |
5 |
54.6 |
11 |
|
NM_133205 |
Arr3 |
Arrestin 3, retinal |
69.6 |
652.6 |
9.32 |
|
NM_184053 |
Calu |
Calumenin, a calcium ion binding protein |
14.8 |
131.6 |
8.82 |
|
NM_183224 |
Fam19a3 |
Family with sequence similarity 19, member A3 |
30.7 |
266.9 |
8.69 |
|
NM_010164 |
Eya1 |
Eyes absent 1 homolog |
1.4 |
12.6 |
8.63 |
|
NM_001201378 |
Ccdc136 |
Coiled-coil domain containing 136 |
16.6 |
142 |
8.51 |
|
NM_025659 |
Abi3 |
ABI gene family, member 3 |
1.4 |
11.5 |
8.28 |
|
NM_013848 |
Ermap |
Erythroblast membrane-associated protein |
1.2 |
9.8 |
8 |
|
NM_133167 |
Parvb |
Parvin β |
9 |
71.5 |
7.94 |
|
NM_007419 |
Adrb1 |
Β-1 adrenergic receptor |
6.5 |
50.2 |
7.73 |
| NM_138653 | Bspry | B-box and SPRY-domain containing (zetin-1) | 1.4 | 10.6 | 7.73 |
Many of the genes down-regulated in Nrl−/− retina represent rod-specific transcripts, whereas upregulated genes include those associated with cone function and retinal remodeling.
We then compared our DEG list with two published studies that examined WT and Nrl−/− retinas: a recent transcript-level RNA-seq analysis that included 6,123 DETs [54] and a gene-level microarray analysis showing 438 DEGs [38] (Figure 6). To obtain the list of DEGs from the Mustafi et al. [55] data set, we performed ANOVA on their FPKM data from GEO database. Interestingly, the DEGs lists from the three studies had only 203 common genes including many previously identified genes specifically expressed in cone (fatty acid binding protein 7, brain [Fabp7], Opn1sw, Cngb3, and Gnat2) or rod (Rho, Gnat1, cyclic nucleotide gated channel alpha 1 [Cnga1], and Nr2e3) photoreceptors. To assess the power of RNA-seq to more comprehensively identify DETs than microarray, we examined the list of 634 genes identified in common by the RNA-seq studies but not by the microarray study. This list included 18 retinal disease genes (ATP-binding cassette, sub-family A (ABC1), member 4 [Abca4], cadherin 23 (otocadherin) [Cdh23], ADP-ribosylation factor-like 6 [Arl6], Bardet-Biedl syndrome 9 (human) [Bbs9], calcium binding protein 4 [Cabp4], cyclic nucleotide gated channel alpha 3 [Cnga3], G protein-coupled receptor 98 [Gpr98], guanylate cyclase activator 1a (retina) [Guca1a], opsin 1 (cone pigments), medium-wave-sensitive (color blindness, deutan) [Opn1mw], orthodenticle homolog 2 (Drosophila) [Otx2], phosphodiesterase 6G, cGMP-specific, rod, gamma [Pde6g], peripherin 2 [Prph2], retinol binding protein 4, plasma [Rbp4], retinol dehydrogenase 1 (all trans) [Rdh1], regulator of G-protein signaling 9 binding protein [Rgs9bp], unc-119 homolog (C. elegans) [Unc119], Usher syndrome 2A (autosomal recessive, mild) homolog (human) [Ush2a], and whirlin [Whrn]) and several known genes involved in visual perception (guanylate cyclase 2e [Gucy2e], guanylate cyclase 2f [Gucy2f], recoverin [Rcvrn], RAR-related orphan receptor beta [Rorb], and sal-like 3 (Drosophila) [Sall3]). Several genes showing large differential expression values might participate in rod homeostasis (galactosidase, beta 1-like 2 [Glb1l2] FC=-14.02, GRAM domain containing 2 [Gramd2] FC=-14.0, carbohydrate (chondroitin 6/keratan) sulfotransferase 3 [Chst3] FC=-4.8, desert hedgehog [Dhh] FC=-4.1, and ADP-ribosylation factor-like 4D [Arl4d] FC=-3.6) and cone function (dual specificity phosphatase 23 [Dusp23] FC=6.3, cyclin-dependent kinase 11B [Cdkl1] FC=6.1, tryptophan hydroxylase 1 [Tph1] FC=4.7, muscle glycogen phosphorylase [Pygm] FC=4.6, cyclin-dependent kinase 6 [Cdk6] FC=4.0, Sall3 FC=3.9, and early growth response 1 [Egr1] FC=3.7).
Figure 6.
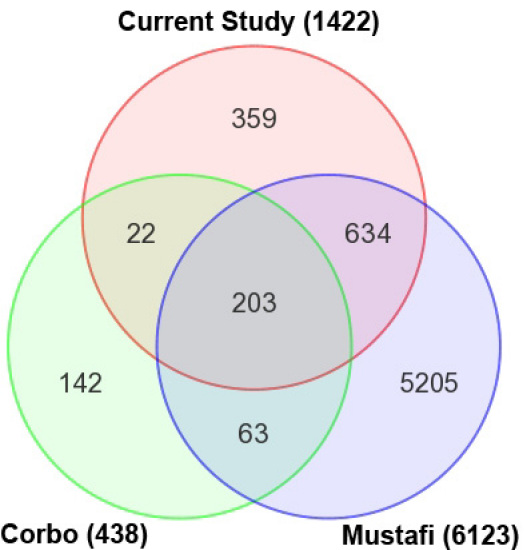
Comparison of the current and previous data sets of differentially expressed transcripts of Nrl−/− versus wild type (WT) mouse retina. Overlap between the differentially expressed transcripts (DETs) identified in the current study and previous studies using mouse retinas from the same age and genotype was determined using the Mouse Genome Informatics (MGI) gene symbol as the identifier. The current study includes all mRNA transcripts identified with the Burrows-Wheeler Aligner (BWA) workflow (fold change ≥1.5 and p value <0.05). The 438 DETs of an Affymetrix microarray study [38] and 6,123 DETs from another RNA-seq study [54] with similar criteria were used for comparison with our study. Of the 438 DETs from the Corbo et al. [38] study, 157 transcripts are not significantly differentially expressed in our data, 11 are expressed below the fragments per kilobase of exon model per million mapped reads (FPKM) detection threshold of 1.0, and 38 do not map to the current annotations. Of the 6,123 DETs from the Mustafi et al. [54] study, 4,858 transcripts are not significantly differentially expressed in our study, 348 are expressed below our FPKM detection threshold of 1.0, and 62 do not map to the current annotations.
Our RNA-seq data allowed us to identify 359 genes not identified in previous investigations. To further assess the quality of our analysis, we performed qRT–PCR validation of 15 genes identified by other studies (but not in our study) as differentially expressed and of 7 genes uniquely identified by our study (but not by other studies; Table 10). Of the 15 genes identified by other studies, only three (ATP-binding cassette, sub-family A (ABC1), member 13 [Abca13], CD8 antigen, alpha chain [Cd8a], and acyl-CoA oxidase-like [Acoxl]) were confirmed with qRT–PCR as being differentially expressed. We also detected these three as differentially expressed but had filtered them out because of FPKM values that were less than 1.0 in all samples. Interestingly, the Abca13 transcript detected in the retina had only sequence reads for exons 56 through 62. This finding was supported by qRT–PCR using two SYBR assays designed to exons 53/55 and exons 56/58. All seven genes uniquely identified by our study were validated as significantly differentially expressed.
Table 10. Validation of selected genes from study comparisons by qRT–PCR.
| Name | Transcript ID | qRT–PCR FC | Corbo FC | Mustafi FC | This report FC | p-value | WT FPKM | Nrl−/− FPKM |
|---|---|---|---|---|---|---|---|---|
|
Corbo | ||||||||
| Abca13 exon 53/55 |
NM_178259 |
NA |
−11.58 |
NA |
−4.18 |
0.000278 |
0.75 |
0.18 |
| Abca13 exon 56/58 |
NM_178259 |
−21.36 |
−11.58 |
NA |
−4.18 |
0.000278 |
0.75 |
0.18 |
| Amz2 |
NM_025275 |
1.09 |
−6.77 |
1.13 |
1.06 |
0.1122 |
15.06 |
16.13 |
| Klf9 |
NM_010638 |
1.09 |
−2.6 |
−1.15 |
1.11 |
0.2481 |
29.7 |
33.12 |
| Pip5k1a |
NM_008847 |
1.43 |
50 |
1.03 |
1.35 |
0.0015 |
11.81 |
16.25 |
| Sema7a |
NM_011352 |
1.03 |
20 |
−1.39 |
1.13 |
0.0634 |
13.33 |
15.19 |
| Txnip |
NM_023719 |
−1.07 |
12.5 |
1 |
1.04 |
0.7347 |
2.17 |
2.01 |
|
Mustafi | ||||||||
| Cox5b |
NM_009942 |
1.26 |
NA |
−12.15 |
1.01 |
0.9342 |
18.31 |
18.24 |
| Drd4 |
NM_007878 |
−1.23 |
NA |
−8.72 |
−1.92 |
0.0764 |
39.6 |
20.92 |
| Cd8a |
NM_009857 |
11.5 |
NA |
21.17 |
9.03 |
3.47E-06 |
0.08 |
0.73 |
| Ctss |
NM_021281 |
1.25 |
NA |
6.92 |
1.29 |
0.0228 |
3.82 |
5.23 |
|
Corbo-Mustafi | ||||||||
| Acoxl |
NM_028765 |
−28.6 |
−13.93 |
−34 |
−4.61 |
0.0291 |
0.28 |
0.06 |
| Rpgrip1 |
NM_001168515 |
−1.3 |
−2.32 |
−1.83 |
1.06 |
0.1157 |
29.94 |
31.85 |
| Dynlt3 |
NM_025975 |
1.28 |
5 |
3.45 |
1.46 |
0.0036 |
17.79 |
26.39 |
| Rab18 |
NM_181070 |
1.37 |
3.23 |
3.31 |
1.29 |
0.0028 |
33.71 |
43.77 |
| Neurod1 |
NM_010894 |
1.38 |
2.63 |
2.2 |
1.14 |
0.0888 |
168.51 |
192.86 |
|
This report | ||||||||
| Plekhf2 |
NM_175175 |
−5.88 |
NA |
−1.35 |
−5.35 |
0.000428 |
37.77 |
7.21 |
| Klhl3 |
NM_001195075 |
−6.9 |
NA |
NA |
−3.29 |
0.000101 |
8.62 |
2.6 |
| Ccdc24 |
NM_001034876 |
−2.93 |
NA |
NA |
−2.64 |
0.0031 |
66.86 |
24.85 |
| Rgs22 |
NM_001195748 |
11.24 |
NA |
NA |
3.84 |
5.93E-07 |
1.95 |
7.47 |
| Hr |
NM_021877 |
3.82 |
NA |
1.25 |
3.89 |
0.000307 |
16.38 |
63.51 |
| Wscd2 |
NM_177292 |
4.1 |
NA |
1.13 |
4 |
0.000123 |
5.73 |
22.91 |
| Klhl33 | NM_001166651 | 27.12 | NA | NA | 14.03 | 2.34E-06 | 3.02 | 42.25 |
Differential expression of genes identified in three global profiling studies (Corbo, Mustafi and this report) was validated by qRT–PCR. Genes shown under the Corbo and Mustafi subheadings were identified in respective studies, but not in the current study. Corbo-Mustafi subheading indicates genes identified in both Corbo and Mustafi studies but not in the current report. The two genes, Cd8a and Acoxl, identified previously were differentially expressed by qRT–PCR but were filtered out of our sequencing data because of the low FPKM values observed. The gene Abca13 was detected as only expressing the last 7 exons of the annotated sequence. qRT–PCR assays that distinguished between the two isoforms were able to confirm the differential expression of the last 7 Abca13 exons. This gene was filtered out of our sequencing results because of the low FPKM value observed. All genes included in this report subheading were uniquely identified by the current study (and not in Corbo and Mustafi reports). FC, p-val, and FPKM values in this report are derived from the sequencing results reported here. Genes were selected as having the largest fold changes in each category and from current annotation in the latest mm9 Refseq build. All differentially expressed genes identified in this report could be validated by qRT–PCR. FC=fold change, NA=not applicable, FPKM=fragments per kilobase exon model per million reads.
The significantly lower number of DETs detected by our study compared to the Mustafi et al. study (2011; 1,422 versus 6,123, respectively) can be attributed to the following:
1. We used a stringent 1.0 FPKM cutoff that generated a list of genes with significant base level expression and fewer false positives than a lower expression level threshold. If we had decreased our threshold to 0.1 FPKM, we would have detected 975 more DETs; however, these genes are expressed at an extremely low level and their impact must be weighed against the increase in false positives. We chose a conservative criterion to identify significant and bona fide differentially expressed genes.
2. Mustafi et al. [54] pooled multiple RNA samples before generating the library and used the identical library on multiple lanes of the sequencer. Our experimental design consisted of libraries generated from individual biologic replicates that allowed us to eliminate the transcripts based on p-value.
Several DETs we identified might contribute to photoreceptor function but are not yet characterized; these include pleckstrin homology domain containing, family F (with FYVE domain) member 2 (Plekhf2; FC=-5.35), kelch-like 13 (Drosophila) [Klhl3] (FC=-3.3), NIPA-like domain containing 1 (Nipal1; FC=-2.8), and coiled-coil domain containing 24 (Ccdc24; FC=-2.6) in the WT retina, and kelch-like 33 (Drosophila) [Klhl33] (FC=14), WSC domain containing 2 (Wscd2; FC=4), hairless (Hr; FC=3.9) and regulator of G-protein signaling 22 (Rgs22; FC=3.8) in the Nrl−/− retina. We also identified Crx opposite strand transcript 1 (Crxos1; FC=4.1), which is exclusively expressed in the eye from the opposite strand of a key retinal transcription factor, cone-rod homeobox containing gene (Crx) [55]. An interesting new finding is the retinal expression of multiple genes from the Kelch-like family (Klhl3, 4, 5, 18, 33, 36), solute carrier family (>30 members), and zinc-finger protein family (>10 members). Mutations in at least one gene from each family have previously been associated with retinal disease: Klhl7 with autosomal dominant RP [56], Slc24A1 with autosomal-recessive congenital stationary night blindness [57], and Znf513 with autosomal-recessive retinitis pigmentosa (RP) [58].
Discussion
Specific patterns of gene expression define the morphology and function of distinct cell types and tissues. Changes in gene expression are associated with complex biologic processes, including development, aging, and disease pathogenesis. Until recently, such investigations focused on one or a few genes at a time. Advances in genomic technology have permitted simultaneous evaluation of most, if not all, genes that respond to an extrinsic microenvironment or intrinsic biologic program(s). Such studies are critical for delineating gene networks that can be targeted for treating specific diseases. RNA-seq allows comprehensive evaluation of transcriptomes, alternative transcripts, and coding polymorphisms. However, analyzing RNA-seq data has been challenging due to the complexity associated with quality control, sequence alignments, and handling of large data sets [59]. Several algorithms [45,60] have been proposed for mapping sequence reads to the reference genome, and multiple workflows [16,50] suggested for RNA-seq data analysis. Here, we report a detailed RNA-seq methodology using WT and Nrl−/− retinas as a study paradigm and establish the high performance of NGS technology compared to microarray and qRT–PCR platforms for transcript identification and quantification studies. Consistent with recent studies [61], our RNA-seq data demonstrate high sensitivity, a wider dynamic range of coverage, and lower technical variability.
Quantitative RT–PCR has long been considered the “gold standard” for mRNA quantification [62,63], and hence routinely used to validate results from transcriptome analysis studies. We show that FPKM values from RNA-seq analysis have a strong linear correlation across at least four orders of magnitude with Ct values from qRT–PCR. Expression of several HKGs is underestimated by RNA-seq because of the algorithmic limitation associated with alignment of reads that map to multiple genomic locations (paralogous sequences or pseudogenes). All of the outlying HKGs inspected had a lower-than-projected FPKM value due to varying numbers of associated pseudogenes [64-67]. For example, Gapdh has 331 pseudogenes in the mouse genome [64]. Our qRT–PCR data projected an FPKM value of approximately 4000 for Gapdh, yet the BWA workflow estimated an FPKM of only 6.6 in the WT retina (see Figure 3). This was also the case, but less severe, for Pgk1, Rps26, Rpl13a, and ActB. Current algorithms proportionally divide the number of reads aligning to multiple genes during FPKM calculation among those genes. In our study, unsuitable qRT–PCR assay design explains the remaining exceptions to the linear correlation between qRT–PCR and RNA-seq. After careful visual inspection of the aligned reads in IGV, we found that the assay designed for Wisp1 was not specific to the splice variant expressed in the retina. Similarly, the assays designed for Cadm3 and Ubc were specific to one of the two transcripts expressed in the retina. Hence, RNA-seq provides a better assessment of alternate isoforms, and transcript quantification is not limited by the design of qRT–PCR assays.
We took advantage of the RNA-seq data to inspect the expression of commonly used HKGs (see Table 5) for normalization in qRT–PCR assays. The choice generally depends on specific tissue and/or developmental time points being investigated. Our RNA-seq studies suggest that most of the HKGs can be used for normalization calculation in qRT–PCR assays; however, Gapdh, β-2 microglobulin (B2m), and Ubc do not appear to be good choices. Additional RNA-seq data would help in delineating relevant HKGs appropriate for qPCR validation in developing retina or cell types.
We compared two different strategies for analyzing WT and Nrl−/− RNA-seq data. The BWA workflow relies on fast and accurate gapped alignment of reads to the exonic regions of the genome. Since the gap between most adjacent exons is larger than a few bases, the cumulative gap extension penalty underestimates the quality of the alignment of reads spanning the splice junctions. Hence, the BWA workflow produced accurate quantitative estimation of gene and transcript isoform expression while losing valuable information about alternate splicing. The higher accuracy of quantitative gene expression estimates by the BWA workflow compared to those by TopHat is evident from the stronger correlation determined by linear regression analysis of the DETs. The regression line from BWA had a slope of −1.056 (compared to −0.905 for TopHat) and R2 of 0.8798 (compared to 0.7727 for TopHat).
The TopHat workflow maps the reads to exonic regions of the reference genome as well as across all known and putative splice junctions defined in the Ensembl GTF file. TopHat attempts to map reads across splice junctions defined in the Ensembl GTF file and across novel splice junctions detected during the first phase of alignment. Hence, the TopHat workflow maps significantly more reads starting with the same number of pass filter (PF) reads and detects additional transcript isoforms missed by the BWA workflow. The source of genomic annotations used by these methods is another important difference. UCSC refFlat annotation (used by the BWA workflow) for the mouse reference genome (build mm9) contained approximately 28,000 unique transcript isoforms, whereas the Ensembl GTF file (used by the TopHat workflow) for the same genome build listed three times more unique transcript isoforms. The problem is amplified because of the lack of one-to-one mapping for several transcripts defined in the UCSC refFlat file in Ensembl GTF. Hence, a non-trivial number of DETs detected by the BWA workflow could not be mapped to any DET from the TopHat workflow (see Figure 2, regions shaded in green).
The BWA workflow detects about 16,000 transcripts in the retina, with a minimum expression equivalent to one transcript per cell (i.e., 1 FPKM) [16]. When the criteria were relaxed to cover transcripts expressed at low levels (0.1 FPKM), 20,707 transcripts were detected in the retina. This is not surprising as the whole retina includes more than 50 distinct neuronal cell types, and each cell would achieve protein diversity largely by alternative promoter usage and/or alternative splicing [68]. The TopHat workflow yields thousands of known and putative transcript isoforms not previously described in the retina. However, validating these novel isoforms predicted from RNA-seq data remains a challenge.
Integrated analysis of RNA-seq data with miRNA-seq, transcription factor binding sites data (chromatin immunoprecipitation sequencing-Chip-Seq), genetic variations (expression Quantitative Trait Loci) [69], and methylation patterns would allow decoding of the complex regulatory networks associated with retinal development and function. Several technical improvements would however be necessary to overcome the bias introduced into the RNA-seq data due to GC content, mappability of reads, length of the gene, and regional differences due to local sequence structure [70]. RNA-seq methods are more likely to identify longer differentially expressed transcripts than shorter transcripts with the same effect size [71]. New statistical methods are being developed to correct for systematic biases inherent in NGS data [70-72]. In the coming years, we will witness an explosion in high throughput genomic methods that are expected to revolutionize biology and biomedical discovery.
Acknowledgments
This research was supported by Intramural Research Program of the National Eye Institute, National Institutes of Health, Bethesda, MD.
References
- 1.Margulies M, Egholm M, Altman WE, Attiya S, Bader JS, Bemben LA, Berka J, Braverman MS, Chen YJ, Chen Z, Dewell SB, Du L, Fierro JM, Gomes XV, Godwin BC, He W, Helgesen S, Ho CH, Irzyk GP, Jando SC, Alenquer ML, Jarvie TP, Jirage KB, Kim JB, Knight JR, Lanza JR, Leamon JH, Lefkowitz SM, Lei M, Li J, Lohman KL, Lu H, Makhijani VB, McDade KE, McKenna MP, Myers EW, Nickerson E, Nobile JR, Plant R, Puc BP, Ronan MT, Roth GT, Sarkis GJ, Simons JF, Simpson JW, Srinivasan M, Tartaro KR, Tomasz A, Vogt KA, Volkmer GA, Wang SH, Wang Y, Weiner MP, Yu P, Begley RF, Rothberg JM. Genome sequencing in microfabricated high-density picolitre reactors. Nature. 2005;437:376–80. doi: 10.1038/nature03959. [DOI] [PMC free article] [PubMed] [Google Scholar]
- 2.Shendure J, Porreca GJ, Reppas NB, Lin X, McCutcheon JP, Rosenbaum AM, Wang MD, Zhang K, Mitra RD, Church GM. Accurate multiplex polony sequencing of an evolved bacterial genome. Science. 2005;309:1728–32. doi: 10.1126/science.1117389. [DOI] [PubMed] [Google Scholar]
- 3.Schuster SC. Next-generation sequencing transforms today's biology. Nat Methods. 2008;5:16–8. doi: 10.1038/nmeth1156. [DOI] [PubMed] [Google Scholar]
- 4.Tsuji S. Genetics of neurodegenerative diseases: insights from high-throughput resequencing. Hum Mol Genet. 2010;19(R1):R65–70. doi: 10.1093/hmg/ddq162. [DOI] [PMC free article] [PubMed] [Google Scholar]
- 5.Roukos DH. Next-generation sequencing and epigenome technologies: potential medical applications. Expert Rev Med Devices. 2010;7:723–6. doi: 10.1586/erd.10.68. [DOI] [PubMed] [Google Scholar]
- 6.Ding L, Wendl MC, Koboldt DC, Mardis ER. Analysis of next-generation genomic data in cancer: accomplishments and challenges. Hum Mol Genet. 2010;19(R2):R188–96. doi: 10.1093/hmg/ddq391. [DOI] [PMC free article] [PubMed] [Google Scholar]
- 7.Tringe SG, Rubin EM. Metagenomics: DNA sequencing of environmental samples. Nat Rev Genet. 2005;6:805–14. doi: 10.1038/nrg1709. [DOI] [PubMed] [Google Scholar]
- 8.Hofreuter D, Tsai J, Watson RO, Novik V, Altman B, Benitez M, Clark C, Perbost C, Jarvie T, Du L, Galan JE. Unique features of a highly pathogenic Campylobacter jejuni strain. Infect Immun. 2006;74:4694–707. doi: 10.1128/IAI.00210-06. [DOI] [PMC free article] [PubMed] [Google Scholar]
- 9.Oh JD, Kling-Backhed H, Giannakis M, Xu J, Fulton RS, Fulton LA, Cordum HS, Wang C, Elliott G, Edwards J, Mardis ER, Engstrand LG, Gordon JI. The complete genome sequence of a chronic atrophic gastritis Helicobacter pylori strain: evolution during disease progression. Proc Natl Acad Sci USA. 2006;103:9999–10004. doi: 10.1073/pnas.0603784103. [DOI] [PMC free article] [PubMed] [Google Scholar]
- 10.Wang C, Mitsuya Y, Gharizadeh B, Ronaghi M, Shafer RW. Characterization of mutation spectra with ultra-deep pyrosequencing: application to HIV-1 drug resistance. Genome Res. 2007;17:1195–201. doi: 10.1101/gr.6468307. [DOI] [PMC free article] [PubMed] [Google Scholar]
- 11.Wheeler DA, Srinivasan M, Egholm M, Shen Y, Chen L, McGuire A, He W, Chen YJ, Makhijani V, Roth GT, Gomes X, Tartaro K, Niazi F, Turcotte CL, Irzyk GP, Lupski JR, Chinault C, Song XZ, Liu Y, Yuan Y, Nazareth L, Qin X, Muzny DM, Margulies M, Weinstock GM, Gibbs RA, Rothberg JM. The complete genome of an individual by massively parallel DNA sequencing. Nature. 2008;452:872–6. doi: 10.1038/nature06884. [DOI] [PubMed] [Google Scholar]
- 12.Korbel JO, Urban AE, Affourtit JP, Godwin B, Grubert F, Simons JF, Kim PM, Palejev D, Carriero NJ, Du L, Taillon BE, Chen Z, Tanzer A, Saunders AC, Chi J, Yang F, Carter NP, Hurles ME, Weissman SM, Harkins TT, Gerstein MB, Egholm M, Snyder M. Paired-end mapping reveals extensive structural variation in the human genome. Science. 2007;318:420–6. doi: 10.1126/science.1149504. [DOI] [PMC free article] [PubMed] [Google Scholar]
- 13.Cokus SJ, Feng S, Zhang X, Chen Z, Merriman B, Haudenschild CD, Pradhan S, Nelson SF, Pellegrini M, Jacobsen SE. Shotgun bisulphite sequencing of the Arabidopsis genome reveals DNA methylation patterning. Nature. 2008;452:215–9. doi: 10.1038/nature06745. [DOI] [PMC free article] [PubMed] [Google Scholar]
- 14.Johnson DS, Mortazavi A, Myers RM, Wold B. Genome-wide mapping of in vivo protein-DNA interactions. Science. 2007;316:1497–502. doi: 10.1126/science.1141319. [DOI] [PubMed] [Google Scholar]
- 15.Mikkelsen TS, Ku M, Jaffe DB, Issac B, Lieberman E, Giannoukos G, Alvarez P, Brockman W, Kim TK, Koche RP, Lee W, Mendenhall E, O'Donovan A, Presser A, Russ C, Xie X, Meissner A, Wernig M, Jaenisch R, Nusbaum C, Lander ES, Bernstein BE. Genome-wide maps of chromatin state in pluripotent and lineage-committed cells. Nature. 2007;448:553–60. doi: 10.1038/nature06008. [DOI] [PMC free article] [PubMed] [Google Scholar]
- 16.Mortazavi A, Williams BA, McCue K, Schaeffer L, Wold B. Mapping and quantifying mammalian transcriptomes by RNA-Seq. Nat Methods. 2008;5:621–8. doi: 10.1038/nmeth.1226. [DOI] [PubMed] [Google Scholar]
- 17.Wilhelm BT, Marguerat S, Watt S, Schubert F, Wood V, Goodhead I, Penkett CJ, Rogers J, Bahler J. Dynamic repertoire of a eukaryotic transcriptome surveyed at single-nucleotide resolution. Nature. 2008;453:1239–43. doi: 10.1038/nature07002. [DOI] [PubMed] [Google Scholar]
- 18.Trapnell C, Williams BA, Pertea G, Mortazavi A, Kwan G, van Baren MJ, Salzberg SL, Wold BJ, Pachter L. Transcript assembly and quantification by RNA-Seq reveals unannotated transcripts and isoform switching during cell differentiation. Nat Biotechnol. 2010;28:511–5. doi: 10.1038/nbt.1621. [DOI] [PMC free article] [PubMed] [Google Scholar]
- 19.Bradford JR, Hey Y, Yates T, Li Y, Pepper SD, Miller CJ. A comparison of massively parallel nucleotide sequencing with oligonucleotide microarrays for global transcription profiling. BMC Genomics. 2010;11:282. doi: 10.1186/1471-2164-11-282. [DOI] [PMC free article] [PubMed] [Google Scholar]
- 20.Dowling JE. The retina: an approachable part of the brain. Cambridge, Mass.: Belknap Press of Harvard University Press; 1987. [Google Scholar]
- 21.Mustafi D, Engel AH, Palczewski K. Structure of cone photoreceptors. Prog Retin Eye Res. 2009;28:289–302. doi: 10.1016/j.preteyeres.2009.05.003. [DOI] [PMC free article] [PubMed] [Google Scholar]
- 22.Yau KW, Hardie RC. Phototransduction motifs and variations. Cell. 2009;139:246–64. doi: 10.1016/j.cell.2009.09.029. [DOI] [PMC free article] [PubMed] [Google Scholar]
- 23.Punzo C, Kornacker K, Cepko CL. Stimulation of the insulin/mTOR pathway delays cone death in a mouse model of retinitis pigmentosa. Nat Neurosci. 2009;12:44–52. doi: 10.1038/nn.2234. [DOI] [PMC free article] [PubMed] [Google Scholar]
- 24.Wright AF, Chakarova CF, Abd El-Aziz MM, Bhattacharya SS. Photoreceptor degeneration: genetic and mechanistic dissection of a complex trait. Nat Rev Genet. 2010;11:273–84. doi: 10.1038/nrg2717. [DOI] [PubMed] [Google Scholar]
- 25.Bramall AN, Wright AF, Jacobson SG, McInnes RR. The genomic, biochemical, and cellular responses of the retina in inherited photoreceptor degenerations and prospects for the treatment of these disorders. Annu Rev Neurosci. 2010;33:441–72. doi: 10.1146/annurev-neuro-060909-153227. [DOI] [PubMed] [Google Scholar]
- 26.Mears AJ, Kondo M, Swain PK, Takada Y, Bush RA, Saunders TL, Sieving PA, Swaroop A. Nrl is required for rod photoreceptor development. Nat Genet. 2001;29:447–52. doi: 10.1038/ng774. [DOI] [PubMed] [Google Scholar]
- 27.Daniele LL, Lillo C, Lyubarsky AL, Nikonov SS, Philp N, Mears AJ, Swaroop A, Williams DS, Pugh EN., Jr Cone-like morphological, molecular, and electrophysiological features of the photoreceptors of the Nrl knockout mouse. Invest Ophthalmol Vis Sci. 2005;46:2156–67. doi: 10.1167/iovs.04-1427. [DOI] [PMC free article] [PubMed] [Google Scholar]
- 28.Nikonov SS, Daniele LL, Zhu X, Craft CM, Swaroop A, Pugh EN., Jr Photoreceptors of Nrl −/− mice coexpress functional S- and M-cone opsins having distinct inactivation mechanisms. J Gen Physiol. 2005;125:287–304. doi: 10.1085/jgp.200409208. [DOI] [PMC free article] [PubMed] [Google Scholar]
- 29.Blackshaw S, Fraioli RE, Furukawa T, Cepko CL. Comprehensive analysis of photoreceptor gene expression and the identification of candidate retinal disease genes. Cell. 2001;107:579–89. doi: 10.1016/s0092-8674(01)00574-8. [DOI] [PubMed] [Google Scholar]
- 30.Blackshaw S, Harpavat S, Trimarchi J, Cai L, Huang H, Kuo WP, Weber G, Lee K, Fraioli RE, Cho SH, Yung R, Asch E, Ohno-Machado L, Wong WH, Cepko CL. Genomic analysis of mouse retinal development. PLoS Biol. 2004;2:E247. doi: 10.1371/journal.pbio.0020247. [DOI] [PMC free article] [PubMed] [Google Scholar]
- 31.Sharon D, Blackshaw S, Cepko CL, Dryja TP. Profile of the genes expressed in the human peripheral retina, macula, and retinal pigment epithelium determined through serial analysis of gene expression (SAGE). Proc Natl Acad Sci USA. 2002;99:315–20. doi: 10.1073/pnas.012582799. [DOI] [PMC free article] [PubMed] [Google Scholar]
- 32.Yu J, He S, Friedman JS, Akimoto M, Ghosh D, Mears AJ, Hicks D, Swaroop A. Altered expression of genes of the Bmp/Smad and Wnt/calcium signaling pathways in the cone-only Nrl−/− mouse retina, revealed by gene profiling using custom cDNA microarrays. J Biol Chem. 2004;279:42211–20. doi: 10.1074/jbc.M408223200. [DOI] [PubMed] [Google Scholar]
- 33.Chowers I, Gunatilaka TL, Farkas RH, Qian J, Hackam AS, Duh E, Kageyama M, Wang C, Vora A, Campochiaro PA, Zack DJ. Identification of novel genes preferentially expressed in the retina using a custom human retina cDNA microarray. Invest Ophthalmol Vis Sci. 2003;44:3732–41. doi: 10.1167/iovs.02-1080. [DOI] [PubMed] [Google Scholar]
- 34.Chowers I, Liu D, Farkas RH, Gunatilaka TL, Hackam AS, Bernstein SL, Campochiaro PA, Parmigiani G, Zack DJ. Gene expression variation in the adult human retina. Hum Mol Genet. 2003;12:2881–93. doi: 10.1093/hmg/ddg326. [DOI] [PubMed] [Google Scholar]
- 35.Hackam AS, Qian J, Liu D, Gunatilaka T, Farkas RH, Chowers I, Kageyama M, Parmigiani G, Zack DJ. Comparative gene expression analysis of murine retina and brain. Mol Vis. 2004;10:637–49. [PubMed] [Google Scholar]
- 36.Ida H, Boylan SA, Weigel AL, Smit-McBride Z, Chao A, Gao J, Buchoff P, Wistow G, Hjelmeland LM. EST analysis of mouse retina and RPE/choroid cDNA libraries. Mol Vis. 2004;10:439–44. [PubMed] [Google Scholar]
- 37.Yoshida S, Mears AJ, Friedman JS, Carter T, He S, Oh E, Jing Y, Farjo R, Fleury G, Barlow C, Hero AO, Swaroop A. Expression profiling of the developing and mature Nrl−/− mouse retina: identification of retinal disease candidates and transcriptional regulatory targets of Nrl. Hum Mol Genet. 2004;13:1487–503. doi: 10.1093/hmg/ddh160. [DOI] [PubMed] [Google Scholar]
- 38.Corbo JC, Myers CA, Lawrence KA, Jadhav AP, Cepko CL. A typology of photoreceptor gene expression patterns in the mouse. Proc Natl Acad Sci USA. 2007;104:12069–74. doi: 10.1073/pnas.0705465104. [DOI] [PMC free article] [PubMed] [Google Scholar]
- 39.Yetemian RM, Brown BM, Craft CM. Neovascularization, enhanced inflammatory response, and age-related cone dystrophy in the Nrl−/−Grk1−/− mouse retina. Invest Ophthalmol Vis Sci. 2010;51:6196–206. doi: 10.1167/iovs.10-5452. [DOI] [PMC free article] [PubMed] [Google Scholar]
- 40.Ben-Shlomo G, Ofri R, Bandah D, Rosner M, Sharon D. Microarray-based gene expression analysis during retinal maturation of albino rats. Graefes Arch Clin Exp Ophthalmol. 2008;246:693–702. doi: 10.1007/s00417-008-0772-0. [DOI] [PubMed] [Google Scholar]
- 41.Dorrell MI, Aguilar E, Weber C, Friedlander M. Global gene expression analysis of the developing postnatal mouse retina. Invest Ophthalmol Vis Sci. 2004;45:1009–19. doi: 10.1167/iovs.03-0806. [DOI] [PubMed] [Google Scholar]
- 42.Akimoto M, Cheng H, Zhu D, Brzezinski JA, Khanna R, Filippova E, Oh EC, Jing Y, Linares JL, Brooks M, Zareparsi S, Mears AJ, Hero A, Glaser T, Swaroop A. Targeting of GFP to newborn rods by Nrl promoter and temporal expression profiling of flow-sorted photoreceptors. Proc Natl Acad Sci USA. 2006;103:3890–5. doi: 10.1073/pnas.0508214103. [DOI] [PMC free article] [PubMed] [Google Scholar]
- 43.Trimarchi JM, Stadler MB, Cepko CL. Individual retinal progenitor cells display extensive heterogeneity of gene expression. PLoS One. 2008;3:e1588. doi: 10.1371/journal.pone.0001588. [DOI] [PMC free article] [PubMed] [Google Scholar]
- 44.Parapuram SK, Cojocaru RI, Chang JR, Khanna R, Brooks M, Othman M, Zareparsi S, Khan NW, Gotoh N, Cogliati T, Swaroop A. Distinct signature of altered homeostasis in aging rod photoreceptors: implications for retinal diseases. PLoS ONE. 2010;5:e13885. doi: 10.1371/journal.pone.0013885. [DOI] [PMC free article] [PubMed] [Google Scholar]
- 45.Li H, Durbin R. Fast and accurate short read alignment with Burrows-Wheeler transform. Bioinformatics. 2009;25:1754–60. doi: 10.1093/bioinformatics/btp324. [DOI] [PMC free article] [PubMed] [Google Scholar]
- 46.Fujita PA, Rhead B, Zweig AS, Hinrichs AS, Karolchik D, Cline MS, Goldman M, Barber GP, Clawson H, Coelho A, Diekhans M, Dreszer TR, Giardine BM, Harte RA, Hillman-Jackson J, Hsu F, Kirkup V, Kuhn RM, Learned K, Li CH, Meyer LR, Pohl A, Raney BJ, Rosenbloom KR, Smith KE, Haussler D, Kent WJ. The UCSC Genome Browser database: update 2011. Nucleic Acids Res. 2011;39(Database issue):D876–82. doi: 10.1093/nar/gkq963. [DOI] [PMC free article] [PubMed] [Google Scholar]
- 47.Eisen MB, Spellman PT, Brown PO, Botstein D. Cluster analysis and display of genome-wide expression patterns. Proc Natl Acad Sci USA. 1998;95:14863–8. doi: 10.1073/pnas.95.25.14863. [DOI] [PMC free article] [PubMed] [Google Scholar]
- 48.Saldanha AJ. Java Treeview–extensible visualization of microarray data. Bioinformatics. 2004;20:3246–8. doi: 10.1093/bioinformatics/bth349. [DOI] [PubMed] [Google Scholar]
- 49.Robinson JT, Thorvaldsdottir H, Winckler W, Guttman M, Lander ES, Getz G, Mesirov JP. Integrative genomics viewer. Nat Biotechnol. 2011;29:24–6. doi: 10.1038/nbt.1754. [DOI] [PMC free article] [PubMed] [Google Scholar]
- 50.Trapnell C, Pachter L, Salzberg SL. TopHat: discovering splice junctions with RNA-Seq. Bioinformatics. 2009;25:1105–11. doi: 10.1093/bioinformatics/btp120. [DOI] [PMC free article] [PubMed] [Google Scholar]
- 51.Rozen S, Skaletsky H. Primer3 on the WWW for general users and for biologist programmers. Methods Mol Biol. 2000;132:365–86. doi: 10.1385/1-59259-192-2:365. [DOI] [PubMed] [Google Scholar]
- 52.Livak KJ, Schmittgen TD. Analysis of relative gene expression data using real-time quantitative PCR and the 2(-Delta Delta C(T)) Methods. 2001;25:402–8. doi: 10.1006/meth.2001.1262. [DOI] [PubMed] [Google Scholar]
- 53.Vandesompele J, De Preter K, Pattyn F, Poppe B, Van Roy N, De Paepe A, Speleman F. Accurate normalization of real-time quantitative RT-PCR data by geometric averaging of multiple internal control genes. Genome Biol. 2002;3:HOO34. doi: 10.1186/gb-2002-3-7-research0034. [DOI] [PMC free article] [PubMed] [Google Scholar]
- 54.Mustafi D, Kevany BM, Genoud C, Okano K, Cideciyan AV, Sumaroka A, Roman AJ, Jacobson SG, Engel A, Adams MD, Palczewski K. Defective photoreceptor phagocytosis in a mouse model of enhanced S-cone syndrome causes progressive retinal degeneration. FASEB J. 2011;25:3157–76. doi: 10.1096/fj.11-186767. [DOI] [PMC free article] [PubMed] [Google Scholar]
- 55.Furukawa T, Morrow EM, Cepko CL. Crx, a novel otx-like homeobox gene, shows photoreceptor-specific expression and regulates photoreceptor differentiation. Cell. 1997;91:531–41. doi: 10.1016/s0092-8674(00)80439-0. [DOI] [PubMed] [Google Scholar]
- 56.Friedman JS, Ray JW, Waseem N, Johnson K, Brooks MJ, Hugosson T, Breuer D, Branham KE, Krauth DS, Bowne SJ, Sullivan LS, Ponjavic V, Granse L, Khanna R, Trager EH, Gieser LM, Hughbanks-Wheaton D, Cojocaru RI, Ghiasvand NM, Chakarova CF, Abrahamson M, Goring HH, Webster AR, Birch DG, Abecasis GR, Fann Y, Bhattacharya SS, Daiger SP, Heckenlively JR, Andreasson S, Swaroop A. Mutations in a BTB-Kelch protein, KLHL7, cause autosomal-dominant retinitis pigmentosa. Am J Hum Genet. 2009;84:792–800. doi: 10.1016/j.ajhg.2009.05.007. [DOI] [PMC free article] [PubMed] [Google Scholar]
- 57.Riazuddin SA, Shahzadi A, Zeitz C, Ahmed ZM, Ayyagari R, Chavali VR, Ponferrada VG, Audo I, Michiels C, Lancelot ME, Nasir IA, Zafar AU, Khan SN, Husnain T, Jiao X, MacDonald IM, Riazuddin S, Sieving PA, Katsanis N, Hejtmancik JF. A mutation in SLC24A1 implicated in autosomal-recessive congenital stationary night blindness. Am J Hum Genet. 2010;87:523–31. doi: 10.1016/j.ajhg.2010.08.013. [DOI] [PMC free article] [PubMed] [Google Scholar]
- 58.Li L, Nakaya N, Chavali VR, Ma Z, Jiao X, Sieving PA, Riazuddin S, Tomarev SI, Ayyagari R, Riazuddin SA, Hejtmancik JF. A mutation in ZNF513, a putative regulator of photoreceptor development, causes autosomal-recessive retinitis pigmentosa. Am J Hum Genet. 2010;87:400–9. doi: 10.1016/j.ajhg.2010.08.003. [DOI] [PMC free article] [PubMed] [Google Scholar]
- 59.Pepke S, Wold B, Mortazavi A. Computation for ChIP-seq and RNA-seq studies. Nat Methods. 2009;6(Suppl):S22–32. doi: 10.1038/nmeth.1371. [DOI] [PMC free article] [PubMed] [Google Scholar]
- 60.Langmead B, Trapnell C, Pop M, Salzberg SL. Ultrafast and memory-efficient alignment of short DNA sequences to the human genome. Genome Biol. 2009;10:R25. doi: 10.1186/gb-2009-10-3-r25. [DOI] [PMC free article] [PubMed] [Google Scholar]
- 61.tHoen PA, Ariyurek Y, Thygesen HH, Vreugdenhil E, Vossen RH, de Menezes RX, Boer JM, van Ommen GJ, den Dunnen JT. Deep sequencing-based expression analysis shows major advances in robustness, resolution and inter-lab portability over five microarray platforms. Nucleic Acids Res. 2008;36:e141. doi: 10.1093/nar/gkn705. [DOI] [PMC free article] [PubMed] [Google Scholar]
- 62.Gibson UE, Heid CA, Williams PM. A novel method for real time quantitative RT-PCR. Genome Res. 1996;6:995–1001. doi: 10.1101/gr.6.10.995. [DOI] [PubMed] [Google Scholar]
- 63.Foley KP, Leonard MW, Engel JD. Quantitation of RNA using the polymerase chain reaction. Trends Genet. 1993;9:380–5. doi: 10.1016/0168-9525(93)90137-7. [DOI] [PubMed] [Google Scholar]
- 64.Liu YJ, Zheng D, Balasubramanian S, Carriero N, Khurana E, Robilotto R, Gerstein MB. Comprehensive analysis of the pseudogenes of glycolytic enzymes in vertebrates: the anomalously high number of GAPDH pseudogenes highlights a recent burst of retrotrans-positional activity. BMC Genomics. 2009;10:480. doi: 10.1186/1471-2164-10-480. [DOI] [PMC free article] [PubMed] [Google Scholar]
- 65.Ng SY, Gunning P, Eddy R, Ponte P, Leavitt J, Shows T, Kedes L. Evolution of the functional human beta-actin gene and its multi-pseudogene family: conservation of noncoding regions and chromosomal dispersion of pseudogenes. Mol Cell Biol. 1985;5:2720–32. doi: 10.1128/mcb.5.10.2720. [DOI] [PMC free article] [PubMed] [Google Scholar]
- 66.Balasubramanian S, Zheng D, Liu YJ, Fang G, Frankish A, Carriero N, Robilotto R, Cayting P, Gerstein M. Comparative analysis of processed ribosomal protein pseudogenes in four mammalian genomes. Genome Biol. 2009;10:R2. doi: 10.1186/gb-2009-10-1-r2. [DOI] [PMC free article] [PubMed] [Google Scholar]
- 67.Lam HY, Khurana E, Fang G, Cayting P, Carriero N, Cheung KH, Gerstein MB. Pseudofam: the pseudogene families database. Nucleic Acids Res. 2009;37(Database issue):D738–43. doi: 10.1093/nar/gkn758. [DOI] [PMC free article] [PubMed] [Google Scholar]
- 68.Pal S, Gupta R, Kim H, Wickramasinghe P, Baubet V, Showe LC, Dahmane N, Davuluri RV. Alternative transcription exceeds alternative splicing in generating the transcriptome diversity of cerebellar development. Genome Res. 2011;21:1260–72. doi: 10.1101/gr.120535.111. [DOI] [PMC free article] [PubMed] [Google Scholar]
- 69.Majewski J, Pastinen T. The study of eQTL variations by RNA-seq: from SNPs to phenotypes. Trends Genet. 2011;27:72–9. doi: 10.1016/j.tig.2010.10.006. [DOI] [PubMed] [Google Scholar]
- 70.Cheung MS, Down TA, Latorre I, Ahringer J. Systematic bias in high-throughput sequencing data and its correction by BEADS. Nucleic Acids Res. 2011;39:e103. doi: 10.1093/nar/gkr425. [DOI] [PMC free article] [PubMed] [Google Scholar]
- 71.Gao L, Fang Z, Zhang K, Zhi D, Cui X. Length bias correction for RNA-seq data in gene set analyses. Bioinformatics. 2011;27:662–9. doi: 10.1093/bioinformatics/btr005. [DOI] [PMC free article] [PubMed] [Google Scholar]
- 72.Roberts A, Trapnell C, Donaghey J, Rinn JL, Pachter L. Improving RNA-Seq expression estimates by correcting for fragment bias. Genome Biol. 2011;12:R22. doi: 10.1186/gb-2011-12-3-r22. [DOI] [PMC free article] [PubMed] [Google Scholar]