Abstract
Although structurally very similar, the aspartate transcarbamoylases (ATCase) of Serratia marcescens and Escherichia coli differ in both regulatory and catalytic characteristics. Most notably, CTP stimulates the catalytic activity of the S. marcescens ATCase and CTP/UTP inhibitory synergism has been lost. These allosteric characteristics contradict the traditional logic developed from the E. coli enzyme in which CTP and UTP function together as end products of the pyrimidine pathway to allosterically control the catalytic activity. In this study, five divergent residues (r93–r97) of the regulatory polypeptide of the S. marcescens enzyme have been replaced with their E. coli counterparts. These residues correspond to the S5′ β-strand of the allosteric effector binding domain at the junction of the allosteric and zinc domains of the regulatory polypeptide. In spite of the fact that the chimeric ATCase (SM:rS5′ec) retained 455 out of 460 amino acids of the S. marcescens enzyme, it possessed characteristics similar to those of the E. coli enzyme: (1) the [Asp]0.5 decreased from 40 to 5 mM; (2) ATP activation of the enzyme was greatly reduced; (3) CTP was converted from a strong activator to a strong inhibitor; and (4) the synergistic inhibition by CTP and UTP was restored. The S5′ β-strand is located at the outer surface of a five-stranded β-sheet of the allosteric domain, providing a potential structural mechanism defining the allostery of this enzyme.
Aspartate transcarbamoylase (EC 2.1.3.2; ATCase)1 provides the first unique step of the pathway for de novo pyrimidine biosynthesis by catalyzing the condensation of L-aspartate with carbamoyl phosphate to form carbamoyl aspartate and phosphate, ultimately leading to the end products UTP and CTP (Jones et al., 1995; Reichard & Hanshoff, 1956). The regulation of this transcarbamoylation varies from substrate channeling in multienzyme complexes to allosteric control of independent enzymes composed of distinct catalytic and regulatory subunits in various biological systems. Multiple structures of the Escherchia coli (Ec) ATCase (2c3:3r2)2 have been characterized by X-ray crystallography [Gouaux et al., 1990; Stevens et al., 1990; Ke et al., 1988; Kosman et al., 1993; for review see Lipscomb (1994)], and the relationship between structure and function has been intensively investigated using single-site-directed mutagenesis [for review see Kantrowitz and Lipscomb (1990); Stevens et al., 1991].
The ATCase holoenzymes from Ec and other enteric bacteria are expressed from the pyrLBI operons. The pyrB and pyrI cistrons encode the catalytic and regulatory polypeptides, respectively. Three catalytic polypeptides associate to form a functional catalytic subunit (trimer, c3), and two regulatory polypeptides form a regulatory subunit (dimer, r2). The holoenzyme is composed of two catalytic subunits and three regulatory subunits (2c3:3r2). Each of the catalytic polypeptides is composed of a carbamoyl phosphate binding domain (CP domain) and an aspartate binding domain (Asp domain), while each regulatory polypeptide is folded into an allosteric effector binding domain (Allo domain) and a zinc binding domain (Zn domain). The active sites are found at the interfaces of the Asp and CP domains of the catalytic trimers, 60 Å away from the nucleotide binding sites which are located adjacent to the five-stranded β-sheets of the Allo domains and connected to the Zn domains through the S5′ β-strand (Figure 1).
Figure 1.
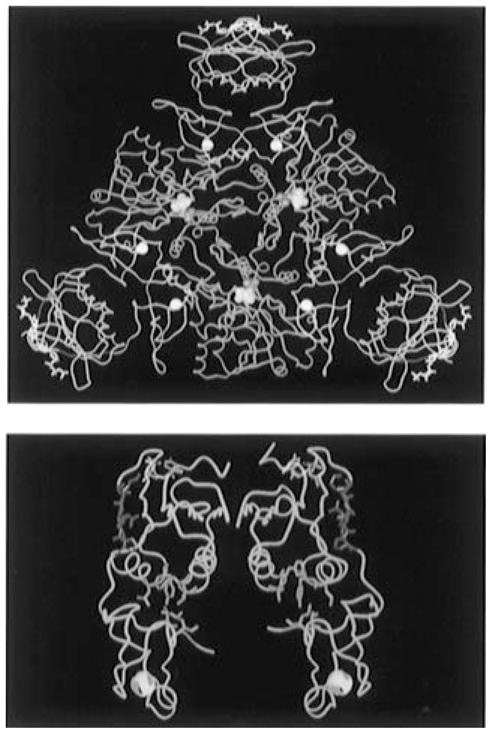
(A, top) Molecular graphic representation of a CTP-liganded R-state holoenzyme of ATCase from Ec. The holoenzyme is composed of two catalytic trimers (one trimer is shown in blue while the second is located beneath this trimer and not shown here for the purpose of simplication) and three regulatory dimers (in yellow). The nucleotide effector CTP (in white sticks and purple balls) binds on the allosteric domain and exerts its effect through the zinc domain (six zinc atoms are indicated as white balls) to the catalytic sites 60 Å away [the catalytic site lies between the Asp and CP domains of each catalytic monomer and is defined by the substrate analogs phosphonoacetamide (purple balls) and malonate (yellow balls)]. The substituted regions (r93–r97, red ribbon) are located at the junction between the allosteric binding sites and the catalytic sites. (B, bottom) The α-Carbon trace of a regulatory dimer is shown in yellow. The altered S5′ β-strand regions (r93–r97) are shown in red; the CTP nucleotide effectors in purple occupy the allosteric binding site; and the hydrophobic pockets (green) are located at the interface of the allosteric and zinc domains. All atomic coordinates are originally from file “8at1.full” in the Protein Data Bank supplied by Gouaux et al. (1990).
When substrate ligands bind to the native Ec ATCase, there is a conformational change from a less active “T-state” to the more active, open “R-state” (Schachman et al., 1988; Lipscomb, 1994). As the T → R transition occurs, the catalytic trimers move apart by 12 Å, and the catalytic and regulatory subunits rotate 10° and 15° above their axes of symmetry, respectively (Krause et al., 1987). The holoenzyme exhibits both homotropic and heterotropic allosteric regulation, by which the positive cooperativity of binding of aspartate can be modulated (Gerhart & Schachman, 1968; Bethell et al., 1968). The nucleotide effectors competitively bind to the r2 dimers and either activate (ATP) or inhibit (CTP, CTP + UTP) the formation of carbamoyl aspartate (Gerhart & Pardee, 1962; Wild et al., 1989).
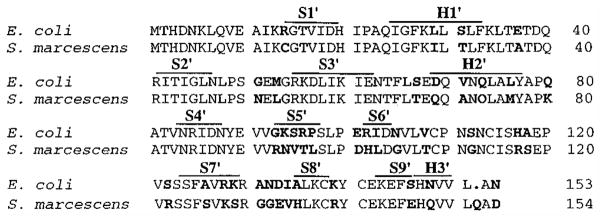
The ATCase from Serratia marcescens (Sm) has the same dodecameric structure, 2c3:3r2, as the Ec enzyme and shares 85% and 76% amino acid identity within their catalytic and regulatory polypeptides, respectively (Beck et al., 1989; this study). The regulatory polypeptide of Sm ATCase has 154 amino acids, one more than the Ec; however, a direct comparison of the sequences of the Sm and Ec regulatory polypeptides indicates there are only 37 amino acid differences between the two. The most divergent regions are involved in the minor r1:c1 interface (r130’s region) and the Zn:Allo domain junction (r100’s region) (Beck et al., 1989; Wild et al., 1990; Wild & Wales, 1990; and Figure 2). Most of the residues involved in the nucleotide binding sites and all inter- and intrasubunit interfaces (r1:c1, r1:c4, r1:r6, and Allo:Zn) are conserved between the two enzymes (Gouaux et al., 1990; Beck et al., 1989). In spite of these apparent structural similarities, the two enzymes differ in both regulatory and catalytic characteristics. Most notably, CTP activates the catalytic activity of the Sm ATCase, and the CTP + UTP inhibitory synergism is lost. This allosteric pattern is contrary to the traditional logic of the Ec ATCase where CTP, the end product of the pathway, feedback inhibits 50–60% of the catalytic activity of the enzyme, and the combination of CTP and UTP inhibits 90–95%. A hybrid ATCase assembled in vivo with the catalytic subunits from Ec and the regulatory subunits from Sm (Cec:Rsm) exhibited heterotropic responses characteristics of the native Sm holoenzyme (ATP and CTP activation; Shanley et al., 1984; Beck et al., 1989). In contrast, the reverse hybrid enzyme (Csm:Rec), utilizing the Sm catalytic subunits and the Ec regulatory subunits, exhibited the heterotropic responses characteristic of Ec (Shanley et al., 1984; Beck et al., 1989). These hybrids, along with other interspecies hybrids, have verified the hypothesis that the allosteric responses of the ATCase holoenzyme are determined exclusively by the controlling regulatory subunits (Wild et al., 1990; Wild & Wales, 1990; Wales & Wild, 1991).
Figure 2.
Comparison of the amino acid sequence of the regulatory polypeptides between Ec and Sm ATCase. The standard single-letter abbreviations from the amino acids are used. The presence of a “.” indicates a shift in sequence to optimize the alignments. The residues in bold are those which differ between the Ec and Sm ATCases. The lines above the sequence correspond to the secondary structural elements as determined for the Ec enzyme with H representing α-helices and S representing β-strands. Each structural element is numbered sequentially with the “′” indicating its location in the regulatory polypeptide. The S5′ β-strand is comprised in its entirety by the altered region (r93–r97).
The structural similarity and the functional divergence of these two enzymes provide an opportunity to directly address the role of specific structural regions in allosteric regulation. In this study, a chimeric enzyme has been constructed in which the S5′ β-sheet of the Sm enzyme was replaced by that of the Ec enzyme. The resulting chimeric ATCase displays allosteric patterns similar to those of the native Ec enzyme (ATP activation, CTP inhibition, and CTP + UTP synergistic inhibition). These results suggest that the nonconserved residues r93–r97 are critical to defining the diverged allosteric function and that the nature of the allosteric response is directly modulated by this region.
EXPERIMENTAL PROCEDURES
Site-Directed Mutagenesis
Site-directed mutagenesis was performed with double-stranded plasmid according to the protocol developed by Deng and Nickoloff (1992) with a 1 to 1000 molar ratio of template to primer. The mutagenesis primer (33-mer) replaced the coding sequence for residues from r93 to r97 in the regulatory polypeptide with that represented in the Ec sequence, and the selection primer removed a unique NcoI site located in the pyrB gene, without changing the encoded amino acidsequence. Both primers were synthesized by GIBCO BRL. After mutagenesis, the resulting plasmid pool was transformed into Ec strain, BMH71-18 mutS, amplified overnight, reisolated using the Wizard minipreparation column from Promega, and extensively digested with NcoI. The digested plasmid pool was transformed into Ec strain, EK1104 (ara, Δpro-lac, strA, thi, pyrBI, pyrF±, rpsL; Nowlan & Kantrowitz, 1985), and plated on LB medium with 40 mg/L ampicillin. The resulting colonies were screened by restriction mapping, and suspected chimeras were verified by sequencing. Following the positive identification of the desired chimera, the entire pyrBI operon was sequenced using the Sequenase version 2.0 DNA sequencing kit from USB to demonstrate that there were no other mutations occurring in the operon.
Enzyme Purification
Plasmid pPBh200-sm was created from PBh5109-sm (Beck et al., 1989) by inserting the 2.2 kb EcoRI/HindIII fragment from PBh5109-sm into pBR322. The plasmids containing the native (pPBh200-sm for Sm, pPBh105-ec for Ec; Roof et al., 1982) or chimera pyrBI operon were transformed into EK1104 and grown in minimal medium (TF medium) supplemented as previously described (Wales et al., 1988). The overexpressed holoenzyme was purified to homogeneity as previously described (Wales et al., 1988) with the following modifications: elimination of the pI precipitation, and the addition of ion-exchange chromatography (Hiload 26/10 Q Sepharose Fast Flow from Pharmacia LKB Biotechnology) with a salt gradient from 0.15 to 0.5 M KCl, and a final chromatographic step on a molecular sieve column (Superdex 200 prep grade from Pharmacia LKB Biotechnology). Purity of the enzyme was verified by both SDS–PAGE and native gel electrophoresis using Coomassie and silver staining (Smith, 1988; Sasse, 1988). The concentration of the holoenzyme was determined by absorbance at wavelength 280 nm using an extinction coefficient of 0.59 (Gerhart & Holobek, 1967).
Enzymatic Assays
ATCase activity was determined according to the colorimetric assay of Prescott and Jones (1969). Aspartate requirements were determined in the presence of a saturating concentration of carbamoyl phosphate (4.8 mM). Effector responses of the enzyme were determined in the presence of 2 mM ATP (4 mM for the native Sm ATCase), 2 mM CTP, 2 mM UTP, or 2 mM CTP plus 2 mM UTP (all are the saturating concentration at both the [Asp]0.5 and half of the [Asp]0.5 for aspartate). All enzyme activity assays were performed at 30 °C in tripartate buffer [0.1 M 2-(N-morpholino)ethanesulfonic acid (MES), 0.051 M N-ethylmorpholine, 0.051 M diethanolamine, pH 8.3] (Ellis & Morrison, 1982). The values presented here are the average of at least three independent assays.
Data Analysis
All collected data were fit with TableCurve 2D, and the equation for the linear regression line with maximal r2 value (square of the Pearson product moment correlation coefficient) was selected. The Vmax and [Asp]0.5 were calculated directly from these equations. The nH values were determined from a Hill plot of the data.
RESULTS
Sequence Analysis of the Ec and Sm Native Enzymes
On the basis of the extensive sequencing of the Sm pyrBI operon performed in this study, ten corrections to the published amino acid sequence (Beck et al., 1989) were confirmed (Table 1). Eight corrections were made in the catalytic polypeptide, and the number of residue differences between Sm and Ec enzymes was increased from 38 to 46. Two corrections were made in the S5′ β-strand of the regulatory polypeptide, and the number of residue differences in the regulatory polypeptide was increased from 35 to 37. Consequently, the amino acid similarities were 85% of the catalytic polypeptide and 76% for the regulatory polypeptide (Figure 3).
Table 1.
Corrections to the Amino Acid Sequence Published by Beck et al. (1989)
| position | original
|
corrected
|
||
|---|---|---|---|---|
| amino acid | codon | amino acid | codon | |
| c19 | D | GAC | E | GAG |
| c26 | A | GCG | R | CGC |
| c113 | R | CGC | A | GCG |
| c210 | S | TCG | L | CTG |
| c295 | A | GCC | G | GGC |
| c296 | L | TTG | C | TGC |
| c297 | A | GCG | W | TGG |
| c300 | V | GTC | L | CTC |
| r94 | K | AAG | N | AAC |
| r95 | L | CTG | V | GTG |
Figure 3.
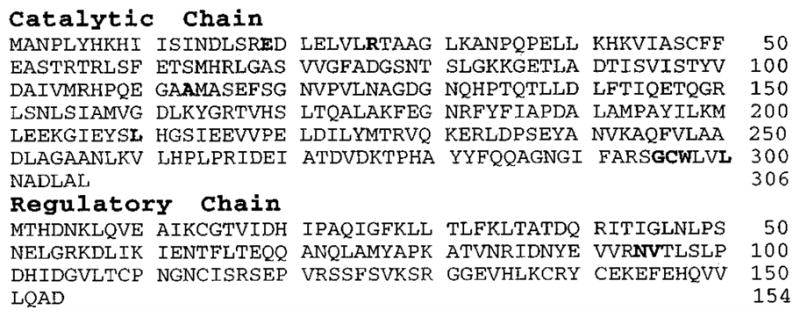
Amino acid sequence of the catalytic and regulatory polypeptides of S. marcescens ATCase. The bold letters represent those amino acids which have been corrected as compared with the data published by Beck et al. (1989).
Kinetic Analysis of Native and Chimeric Enzymes
The maximal reaction velocities (Vmax) of all three enzymes were similar (Table 2 and Figure 4). However, the patterns of Vmax due to the presence of different nucleotide effectors varied between the enzymes. The ATP-liganded Ec enzyme had the same Vmax as the unliganded enzyme, while CTP and CTP plus UTP (C + U) both reduced the Vmax relative to that of the unliganded enzyme. With the Sm holoenzyme, ATP, CTP, and CTP + UTP all increased the Vmax, although to different extents. This was also true for the chimera where, even though CTP and C + U had been converted to inhibitor, all nucleotide effectors still increased the Vmax relative to the unliganded form. UTP alone had no significant effect on any of the three enzymes.
Table 2.
Kinetic Parameters of the Native and Chimeric Form of ATCasea
| nucleotide effectorsb |
|||||
|---|---|---|---|---|---|
| none | ATP | CTP | UTP | C + U | |
| Native Sm Holoenzyme | |||||
| Vmaxc | 22.4 ± 0.5 | 25.6 ± 1.2 | 25.0 ± 0.4 | 23.1 ± 0.6 | 30.2 ± 0.4 |
| [Asp]0.5d | 39.2 ± 0.3 | 17.7 ± 3.7 | 22.0 ± 1.8 | 41.0 ± 3.1 | 25.7 ± 1.0 |
| nHe | 1.9 ± 0.1 | 2.5 ± 0.1 | 2.7 ± 0.1 | 2.2 ± 0.1 | 2.2 ± 0.1 |
| [NTP]0.5f | udg | 1.8 | 0.5 | ud | ndh |
| Native Ec Holoenzyme | |||||
| Vmax | 24.9 ± 1.2 | 24.8 ± 0.6 | 18.9 ± 1.9 | 25.1 ± 0.2 | 16.7 ± 0.5 |
| [Asp]0.5 | 16.6 ± 1.4 | 9.9 ± 1.9 | 27.3 ± 2.0 | 15.4 ± 2.7 | 31.8 ± 2.0 |
| nH | 3.2 ± 0.1 | 2.5 ± 0.3 | 3.7 ± 0.5 | 3.1 ± 0.3 | 3.1 ± 0.2 |
| [NTP]0.5 | ud | 1.0 | 0.1 | ud | nd |
| Chimera SM:rS5′ec Holoenzyme | |||||
| Vmax | 18.5 ± 1.1 | 25.0 ± 0.6 | 25.5 ± 0.3 | 25.9 ± 0.4 | 23.8 ± 0.5 |
| [Asp]0.5 | 4.7 ± 0.1 | 2.8 ± 0.1 | 9.0 ± 0.4 | 4.6 ± 0.1 | 12.0 ± 1.2 |
| nH | 2.1 ± 0.1 | 1.5 ± 0.1 | 2.5 ± 0.2 | 2.2 ± 0.1 | 2.2 ± 0.1 |
| [NTP]0.5 | ud | 0.3 | 0.2 | ud | nd |
All assays were carried out in the tripartate buffer (pH 8.3).
The values of Vmax, [Asp]0.5, and nH were determined at a nucleotide effector concentration of 2 mM. The single exception was ATP, which was 4 mM in the assays with the native Sm holoenzyme.
Maximal velocity, estimated at saturating concentrations of substrate, is given as micro-moles per hour per milligram.
Concentration of aspartate (mM) required to produce half-maximal velocity.
Hill coefficient (nH) estimated from aspartate saturation kinetics (determined by the Hill plot).
[NTP]0.5 is the nucleotide concentration (mM) at which the nucleotide exhibits half of its maximum effect. The values were calculated from Figure 5.
ud indicates the value is unable to be determined.
nd indicates the value is not determined.
Figure 4.
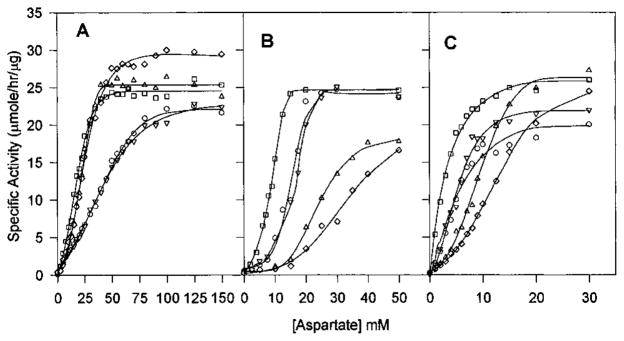
Aspartate saturation kinetics in the presence of nucleotide effectors for native Sm (A), native Ec (B), and chimera SM:rS5′ec (C) ATCase holoenzyme. The aspartate saturation of ATCase activity was determined in the presence of (□) either 4 mM (for the native Sm enzyme) or 2 mM ATP (for the native Ec enzyme and the chimeric enzyme, respectively), (△) 2 mM CTP, (▽) 2 mM UTP, (◇) 2 mM CTP plus 2 mM UTP, and (○) without any nucleotide effector. Standard assay conditions were used, and each curve is the average of at least three independent assays.
The various nucleotide effectors influenced the [Asp]0.5 of each enzyme, consistent with their allosteric roles. CTP increased the [Asp]0.5 of both the native Ec and chimeric enzymes, while it reduced [Asp]0.5 of the native Sm enzyme. For all these enzymes, the addition of UTP increased the [Asp]0.5 of the CTP-liganded enzymes (see Table 2). Overall, the [Asp]0.5 of the SM:rS5′ec chimeric enzyme was much lower than the values of either of the native enzymes (Table 2). ATP induced a lower [Asp]0.5, consistent with its role as an activator, while CTP increased the [Asp]0.5, consistent with its role as an inhibitor. UTP alone did not show much effect, but in the presence of CTP, UTP dramatically increased the [Asp]0.5.
The Ec enzyme exhibited homotropic cooperativity, as measured by the Hill coefficient, which was reduced by ATP and enhanced by CTP. In contrast, the nH of the native Sm enzyme was increased significantly in the presence of either ATP or CTP (both activators). The Ec pattern is consistent with the idea that inhibitors shift the enzyme population toward the T-state, thus making it more difficult to induce the active form of the enzyme, resulting in an increase in cooperativity. The converse would be true for activation, resulting in a decrease in nH. The S5′ β-strand substitution converted the Sm ATCase to Ec-like cooperativity with the nH value of the chimera being decreased in the presence of activator (ATP) and increased in the presence of inhibitor (CTP).
Allosteric Regulation by Individual Nucleotides
In order to determine the relative sensitivity of each enzyme to the various nucleotides, the specific activities were determined under increasing concentrations of nucleotide effector (Figure 5A,B). The maximum activation of the native Sm enzyme was not completely reached until 10 mM ATP, and the reaction rate was three times higher than that in the absence of nucleotide effector at the [Asp]0.5. Similarly, the activity of the native Sm enzyme was almost doubled by the presence of 2 mM CTP (Figure 5A). In contrast, high concentrations of ATP induced only a 68% enhancement of the native Ec enzymatic activity, while CTP reduced the activity of the native Ec enzyme by 50% (Figure 5B). Even though it appeared that a high concentration of UTP (10 mM) had a slight inhibitory effect, this inhibition was reversible by doubling the CP concentration, indicating that UTP could be binding to the active site and competitively inhibiting the enzymatic activity. Increasing the CP concentration had no observable effect in other effector studies. In the chimeric enzyme, ATP still functioned as a modest activator, while the CTP response was converted to inhibition, characteristic of the Ec enzyme (Figure 5).
Figure 5.
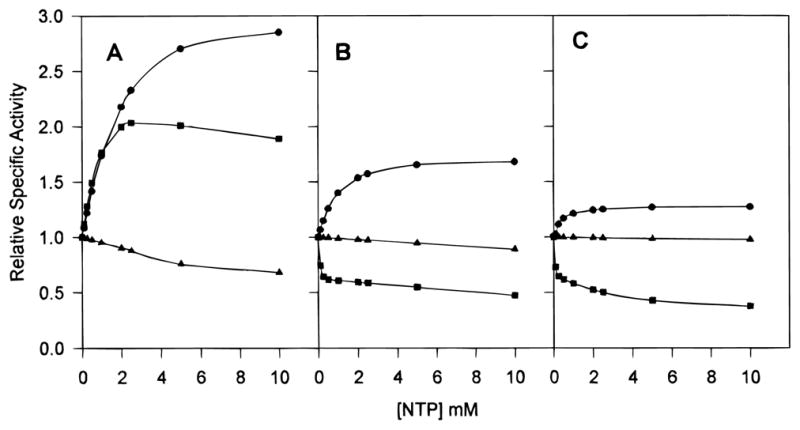
Comparative nucleotide saturation kinetics of native Sm (A), native Ec (B), and chimera SM:rS5′ec (C) ATCase holoenzyme. The saturation effects of ATP (●), CTP (■), and UTP (▲) on the activity of ATCase were determined under assay conditions employing saturating carbamoyl phosphate concentrations and aspartate concentrations at the [Asp]0.5 of each enzyme (4.8 mM carbamoyl phosphate for all enzymes; 39.2, 16.6, and 4.7 mM aspartate for native Sm, Ec, and chimera SM:rS5′ec enzymes, respectively). The specific activity was measured at each concentration of nucleotide (NTP) and plotted relative to the activity with no effector present.
Allosteric Effector Interactions
In order to evaluate the allosteric effects of combinations of nucleotides, competition assays were performed by increasing concentrations of one nucleotide in the presence of saturating concentrations of a second nucleotide. With the native Sm ATCase, in spite of the fact that ATP and CTP both functioned as strong activators, CTP was not capable of additional stimulation in the presence of 2 mM ATP. Surprisingly, this was also true of ATP in the presence of CTP (Figure 6A). In contrast, the enhanced level of enzymatic activity of the Ec enzyme in the presence of 2 mM ATP was reversed by as little as 0.1 mM CTP. The inhibition by CTP was also reversed by a high concentration of ATP (Figure 6B). In the native Sm ATCase, UTP counteracted the stimulatory effect of ATP, although it could not completely eliminate activation (Figure 7A). With the Ec ATCase, there was no indication of any ATP/UTP competition or synergism (Figure 7B), but the enzyme did exhibit the UTP/CTP synergistic inhibition (FIgure 8B) as previously described (Wild et al., 1989). A partial competition between these nucleotides occurred in the Sm enzyme, but there was no indication of the synergism seen with the native Ec enzyme.
Figure 6.
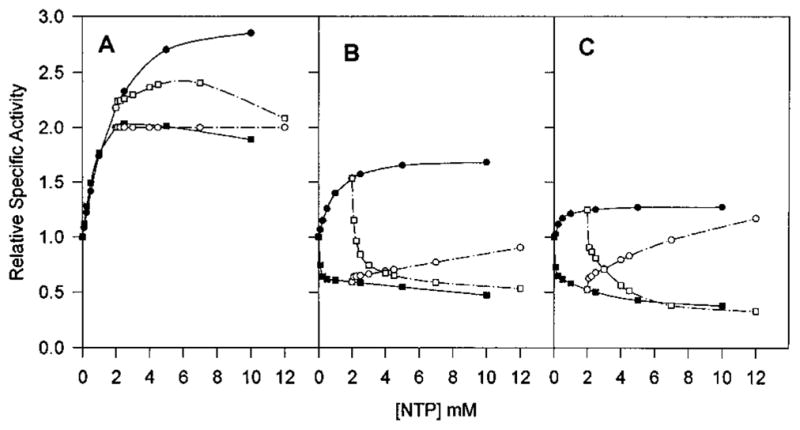
ATP and CTP saturation curves in the presence of 2 mM CTP or 2 mM ATP as compared to the one in the absence of other nucleotide effectors for native Sm (A), native Ec (B), and chimera SM:rS5′ec (C) ATCase holoenzyme. The saturation kinetics of the effects of varying ATP (●), varying ATP in the presence of CTP (○), varying CTP (■), and varying CTP in the presence of ATP (□) on the activity of ATCase were determined in the same way as described in Figure 5.
Figure 7.
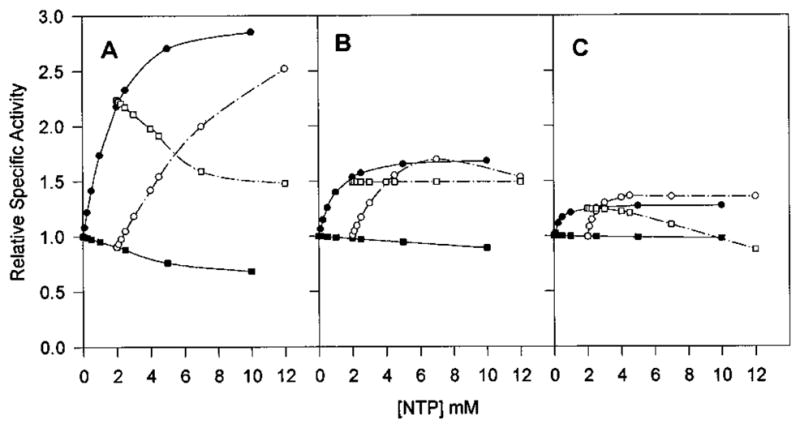
ATP and UTP saturation curves in the presence of 2 mM UTP or 2 mM ATP as compared to the one in the absence of other nucleotide effectors for native Sm (A), native Ec (B), and chimera SM:rS5′ec (C) ATCase holoenzyme. The saturation kinetics of the effects of varying ATP (●), varying ATP in the presence of UTP (○), varying UTP (■), and varying UTP in the presence of ATP (□) on the activity of ATCase were determined in the same way as described in Figure 5.
Figure 8.
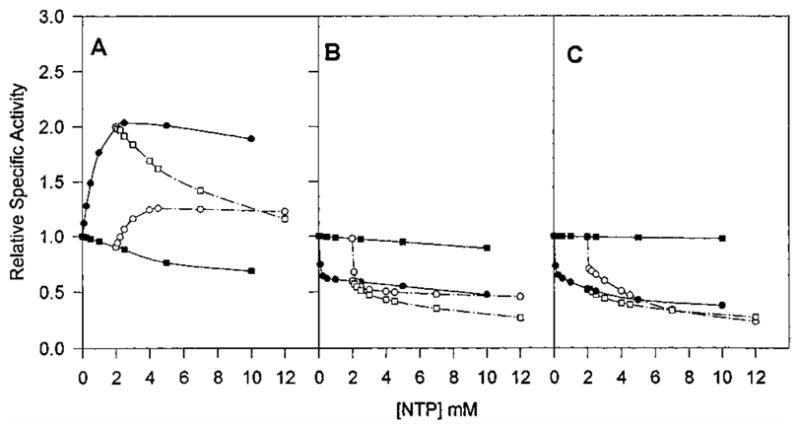
CTP and UTP saturation curves in the presence of 2 mM UTP or 2 mM CTP as compared to the one in the absence of other nucleotide effectors for native Sm (A), native Ec (B), chimera SM:rS5′ec (C) ATCase holoenzyme. The saturation kinetics of the effects of varying CTP (●), varying CTP in the presence of UTP (○), varying UTP (■), and varying UTP in the presence of CTP (□) on the activity of ATCase were determined in the same way as described in Figure 5.
All of the CTP-associated interactions of the parental Sm ATCase were converted to the Ec patterns in the chimeric enzyme. ATP successfully competed with CTP in the Ec and the chimeric enzymes but not in the native Sm enzyme (Figure 6). This was also observed for the UTP/CTP competition, where UTP competed with CTP for activation in the native Sm enzyme, while the combination synergistically inhibited both the chimeric Sm enzyme and the native Ec enzyme (Figure 8). In contrast, the chimeric enzyme retained the UTP/ATP response pattern of the native Sm enzyme as UTP successfully competed with ATP activation in both chimeric and native Sm enzymes, while UTP had no effect on the ATP-liganded Ec enzyme (Figure 7). A summary of the allosteric patterns of the native and chimeric enzymes is presented in Table 3.
Table 3.
Allosteric Patterns of the Native and Chimeric Enzymes
| nucleotide effectorsa | Sm | Ec | SM:rS5′ec |
|---|---|---|---|
| Pattern Common for Three Enzymes | |||
| ATP | +++b | ++ | + |
| UTP | 0 | 0 | 0 |
| CTP/ATP | ± | ± | ± |
| ATP/UTP | ± | ± | ± |
| Pattern Common for Native Ec and Chimera | |||
| CTP | +++ | – | – |
| ATP/CTP | 0 | ± | ± |
| CTP/UTP | ± | = | = |
| UTP/CTP | ± | = | = |
| Pattern Common for Native Sm and Chimera | |||
| UTP/ATP | ± | 0 | ± |
In the paired nucleotide studies, the first nucleotide listed was used at increasing concentration in the presence of a certain concentration of the second listed nucleotide. For example, ATP/CTP indicates varying concentrations of ATP in the presence of a saturating concentration of CTP; CTP/ATP indicates varying concentrations of CTP in the presence of a saturating concentration of ATP.
+++ represents strong activation; ++, activation; +, weak activation; 0, no effect; –, inhibition; =, synergistic inhibition; ±, competition.
DISCUSSION
The Role of Comparative Sequence Analysis in Establishing Structure–Function Hypotheses of ATCase
Site-directed mutagenesis studies commonly rely on an interpretation of structures provided by X-ray diffraction analyses of protein crystals. However, functional changes may be based on subtle differences in secondary or supersecondary structures which cannot be detected by the refinement of the diffraction data. In such cases, the functional variations among homologous proteins provide a unique opportunity for the formulation and analysis of structure–function hypotheses. In these studies, the selection of structural regions to be analyzed was based on information provided by the comparative analysis of the amino acid sequences of the ATCases from the Ec and Sm enzymes (Shanley et al., 1984; Foltermann et al., 1984, 1986; Beck et al., 1989; Wild et al., 1990). Hybrid enzymes constructed with subunits isolated from the different bacterial species had previously demonstrated that the pattern of allosteric control was exclusively determined by the regulatory subunits (Beck et al., 1989; Shanley et al., 1984; Wild et al., 1990; Wales & Wild, 1991).
Of the 153 residues of the Ec regulatory subunit, only 37 varied between the Ec and Sm enzymes (Figure 3). Almost half of these diverged residues are clustered in the 100’s region (r93–r105, located between the allosteric and the zinc domains, 8 differences out of 13 amino acids) and the 130’s region (r126–r135, which is involved in the r1:c1 interface, 8 differences out of 10 amino acids). When this sequence information was combined with structural information provided by X-crystallography (Gouaux et al., 1990; Stevens et al., 1990; Ke et al., 1988; Kosman et al., 1993), it was observed that the S5′ β-strand, which connects the nucleotide binding site to the zinc domain through the r98–r101 loop, was the only structural feature in the regulatory polypeptide which was not extensively conserved. This study clearly demonstrates the importance of the S5′ β-strand region in the allosteric modulation of CTP and CTP + UTP synergistic effects of ATCase.
The Native Enzymes Have Diverged Dramatically in both Their Catalytic and Their Allosteric Characteristics
In spite of the architectural similarities of the two native enzymes, the Sm and Ec ATCases differ in most of their homotropic and heterotropic characteristics as reported in Results. However, the most notable differences were found within the patterns of NTP allosteric reponse. The EC ATCase regulatory logic is one of the paradigms of allosteric regulation: activation by ATP, inhibition by CTP, and synergistic inhibition by CTP and UTP. In contrast, the Sm enzyme is activated by both ATP and CTP, and there is no evidence of CTP/UTP synergism under the conditions used in this study (Figure 8). The logic of this regulatory pattern requires an appreciation for the levels of intracellular pools of these nucleotides and the resulting competition that occurs as a consequence of competition for a common binding site. In Sm and Ec, the intracellular pool of ATP is about five times greater than that of CTP (Wild et al., 1988), and the regulatory logic is that the ATP-activated enzyme is rendered less active (inhibited) as a result of competition with CTP, regardless of the independent allosteric effects of the diverged ATCases.
This logic is demonstrated in the nucleotide competition studies with the Sm enzyme, in which CTP competed with ATP, effectively lowering the activity of the ATP-activated state (Wild et al., 1989; this study). Consistent with the apparent lower affinity of the enzyme for ATP, ATP did not exert a comparable effect on the CTP-activated enzyme. In contrast, there is clear competition between the nucleotides in the Ec enzyme: CTP rapidly reduced the ATP-activated levels to the CTP-inhibited levels, and ATP competed with CTP, even though there is a 10-fold differences in the binding constants between these two nucleotides (Tondre & Hammes, 1974; Allewell et al., 1975; England & Hervé, 1992, 1994). Similar differences were seen in other nucleotide competition studies. ATP and UTP successfully competed with each other in the Sm enzyme. However, in the Ec ATCase, UTP did not appear to have any effect on the ATP-liganded enzyme. The CTP/UTP synergism of the Ec enzyme was apparent in the CTP and UTP competition studies, and although there was no evidence of synergism, CTP and UTP did compete with each other in the Sm enzyme. Equilibrium binding and continuous flow dialysis have provided an explanation for the Ec synergism such that the Ec holoenzyme contains two classes of allosteric sites, as defined by their binding affinities. The binding of CTP to one allosteric site decreases the affinity of the second site for this nucleotide but increases its affinity for UTP. Conversely, the binding of UTP to one of the two sites decreases the affinity of the second site for this nucleotide but increases the affinity for CTP (Zhang & Kantrowitz, 1991; England & Hervé, 1992). This same explanation cannot be applied to the ATCase of Sm in which the activation by CTP was only counteracted by increased concentrations of UTP. If the Sm enzyme followed the Ec pattern of allosteric site cooperativity, the CTP effect (activation in this case) should be amplified in the presence of UTP. Even though the [CTP]0.5 is decreased 10-fold over that of the ATP ([ATP]0.5/[CTP]0.5 of 10), ATP can counteract CTP inhibition of the Ec enzyme. However, in spite of a [ATP]0.5/[CTP]0.5 ratio of 4, ATP was not able to affect the CTP activation of the Sm enzyme, indicating that a different ATP/CTP interaction exists for the Sm enzyme. Similarly, enzymatic response to other nucleotide interactions has also diverged between the two native enzymes.
The SM:rS5′ec Chimeric Enzyme Displayed the CTP and CTP + UTP Allosteric Responses of the Ec Enzyme
The chimeric SM:rS5′ec enzyme displayed a dramatic decrease in its [Asp]0.5 and a reversal of CTP and CTP + UTP allosteric effects relative to the native Sm enzyme. This conversion demonstrated that the S5′ β-strand was important in establishing either a unique T:R ratio or a unique R-state. One of the most important consequences of the substitution of the S5′ β-strand with the corresponding Ec sequence is the dramatic reduction of the [Asp]0.5. This may indicate that the enzyme has converted to a new R conformation or has established a new T:R ratio (a structural verification awaits additional studies). Even though the structure of the Sm has not yet been determined, these results suggest that the S5′ β-strand plays a critical role in defining the conformational state of the enzyme.
In addition to the dramatic decrease in the [Asp]0.5, the SM:rS5′ec enzyme has assumed the Ec pattern of allosteric regulation in all responses involving CTP such that CTP became an inhibitor, CTP/UTP synergism was established, and CTP/ATP competition was restored (Table 3). Even though both ATP and CTP are activators in the Sm enzyme, only the CTP effect was reversed. However, while ATP still functioned as an activator of the chimeric enzyme, the ATP-activated level was dramatically reduced as compared with the Sm native enzyme. The transmission and polarity of the ATP signal are determined separately from the CTP or CTP/UTP inhibitory effects, and a pathway of residues which mediate the Ec ATP response has been proposed (Van Vliet et al., 1991; De Staercke et al., 1995; Xi et al., 1994). These Ec studies predict that the correct transmission of the ATP signal requires an appropriate separation of the allo and Zn domains and that this separation (or coupling) is modulated at the hydrophobic interface (see Figure 1B). There are a number of proposals concerning the Ec ATCase allosteric mechanism in the literature (Krause et al., 1993; Allewell, 1989; Lipscomb, 1994; De Staercke et al., 1995; Xi et al., 1994). One feature in common to these proposals is a reliance on the coupling between the Zn and allo domains and its modulation by the binding of the nucleotide effectors.
Alternatively, thermodynamic analysis of the allosteric phenomenon in other enzymes has been offered by Reinhart and colleagues (Braxton et al., 1994, 1996). The role played by entropy relative to the change in free energy of the allosteric phenomenon was studied using the temperature dependence of the allosteric equilibrium. This thermodynamic-linked function provides an additional consideration in the analysis of allosteric enzymes. Preliminary investigations of ATCase upon temperature shifts from 15 to 45 °C indicate that entropy changes did affect the extent of activation or inhibition but did not change the allosteric polarity in the Ec enzyme.
The S5′ β-strand of the regulatory polypeptide has been identified as critical to the allosteric responses of ATCase, and its physical location at the outer surface of a five-stranded β-sheet of the allosteric domain directly links the allo domain with the Zn domain (Figure 1). In this position, the S5′ β-strand is optimally located to play a role in signal transduction. While the change in the overall pattern of allosteric responses in the SM:rS5′ec enzyme suggests that there may be a global mechanism, whether chemical or physical, linking all of the nucleotide responses, a description of the allosteric mechanism as a discrete pathway of residues for each signal may be too simplistic.
Footnotes
This research has been supported by grants from the Robert A. Welch Foundation (A915) and the NIH (GM33191). L.L. was a TAMU Regent’s Graduate Fellow.
Abbreviations: ATCase, aspartate transcarbamoylase; ATP, adenosine 5′-triphosphate; CTP, cytidine 5′-triphosphate; UTP, uridine 5′-triphosphate; NTP, nucleoside triphosphate; [Asp]0.5, aspartate concentration at half-maximal velocity; Ec, Escherichia coli; Sm, Serratia marcescens.
Nomenclature: SM:rS5′ec, designation of the chimera in which the S5′ β-strand in the regulatory polypeptide of the Sm ATCase has been replaced with the Ec sequence; r, regulatory polypeptide; c, catalytic polypeptide; 2c3:3r2, two catalytic subunits, each containing three catalytic polypeptides, and three regulatory subunits, each containing two regulatory polypeptides; r1 or c2, the non-subscripted number represents the polypeptide designation (i.e., regulatory polypeptide 1 and catalytic polypeptide 2); R and C, the regulatory dimeric and catalytic trimeric subunits, respectively, with subscripts indicating their origins; for example, Cec:Rsm describes a hybrid composed of the catalytic subunits from Ec and regulatory subunits from Sm.
References
- Allewell NM. Annu Rev Biophys Biophys Chem. 1989;18:71–92. doi: 10.1146/annurev.bb.18.060189.000443. [DOI] [PubMed] [Google Scholar]
- Allewell NM, Friedland J, Niekamp K. Biochemistry. 1975;14:224–230. doi: 10.1021/bi00673a005. [DOI] [PubMed] [Google Scholar]
- Beck DA, Kedzie KM, Wild JR. J Biol Chem. 1989;264:16629–16637. [PubMed] [Google Scholar]
- Bethell MR, Smith KE, White JS, Jones ME. Proc Natl Acad Sci USA. 1968;60:1442–1449. doi: 10.1073/pnas.60.4.1442. [DOI] [PMC free article] [PubMed] [Google Scholar]
- Braxton BL, Tlapak-Simmons VL, Reinhart GD. J Biol Chem. 1994;269:47–50. [PubMed] [Google Scholar]
- Braxton BL, Mullins LS, Raushel FM, Reinhart GD. Biochemistry. 1996;35:11918–11924. doi: 10.1021/bi961305m. [DOI] [PubMed] [Google Scholar]
- Deng WP, Nickoloff JA. Anal Biochem. 1992;200:81–88. doi: 10.1016/0003-2697(92)90280-k. [DOI] [PubMed] [Google Scholar]
- De Staercke C, Van Vliet F, Xi G, Rani CS, Ladjimi M, Jacobs A, Triniolles F, Hervé G, Cunin R. J Mol Biol. 1995;246:132–143. doi: 10.1006/jmbi.1994.0072. [DOI] [PubMed] [Google Scholar]
- Ellis KJ, Morrison JF. Methods Enzymol. 1982;87:405–426. doi: 10.1016/s0076-6879(82)87025-0. [DOI] [PubMed] [Google Scholar]
- England P, Hervé G. Biochemistry. 1992;31:9725–9732. doi: 10.1021/bi00155a028. [DOI] [PubMed] [Google Scholar]
- England P, Hervé G. Biochemistry. 1994;33:3913–3918. doi: 10.1021/bi00179a017. [DOI] [PubMed] [Google Scholar]
- Foltermann KF, Shanley MS, Wild JR. J Bacteriol. 1984;157:891–898. doi: 10.1128/jb.157.3.891-898.1984. [DOI] [PMC free article] [PubMed] [Google Scholar]
- Foltermann KF, Beck DA, Wild JR. J Bacteriol. 1986;67:285–290. doi: 10.1128/jb.167.1.285-290.1986. [DOI] [PMC free article] [PubMed] [Google Scholar]
- Gerhart JC, Pardee AB. J Biol Chem. 1962;237:891–896. [PubMed] [Google Scholar]
- Gerhart JC, Holoubek H. J Biol Chem. 1967;242:2886–2892. [PubMed] [Google Scholar]
- Gerhart JC, Schachman HK. Biochemistry. 1968;7:538–552. doi: 10.1021/bi00842a600. [DOI] [PubMed] [Google Scholar]
- Gouaux JE, Lipscomb WN. Biochemistry. 1990;29:389–402. doi: 10.1021/bi00454a013. [DOI] [PubMed] [Google Scholar]
- Gouaux JE, Stevens RC, Lipscomb WN. Biochemistry. 1990;29:7702–7715. doi: 10.1021/bi00485a020. [DOI] [PubMed] [Google Scholar]
- Jones ME, Spector L, Lipmann F. J Am Chem Soc. 1955;77:819–820. [Google Scholar]
- Kantrowitz ER, Lipscomb WN. Trends Biochem Sci. 1990;15:53–59. doi: 10.1016/0968-0004(90)90176-c. [DOI] [PubMed] [Google Scholar]
- Ke HM, Lipscomb WN, Cho Y, Honzatko RB. J Mol Biol. 1988;204:725–747. doi: 10.1016/0022-2836(88)90365-8. [DOI] [PubMed] [Google Scholar]
- Kosman RP, Gouaux JE, Lipscomb WN. Proteins: Struct, Funct, Genet. 1993;15:147–176. doi: 10.1002/prot.340150206. [DOI] [PubMed] [Google Scholar]
- Krause KL, Volz KW, Lipscomb WN. J Mol Biol. 1987;193:527–553. doi: 10.1016/0022-2836(87)90265-8. [DOI] [PubMed] [Google Scholar]
- Lipscomb WN. Adv Enzymol. 1994;68:67–151. doi: 10.1002/9780470123140.ch3. [DOI] [PubMed] [Google Scholar]
- Nowlan SF, Kantrowitz ER. J Biol Chem. 1985;260:14712–14716. [PubMed] [Google Scholar]
- Prescott LM, Jones ME. Anal Biochem. 1969;32:408–419. doi: 10.1016/s0003-2697(69)80008-4. [DOI] [PubMed] [Google Scholar]
- Reichard P, Hanshoff G. Acta Chem Scand. 1956;10:548–566. [Google Scholar]
- Roof WD, Foltermann KF, Wild JR. Mol Gen Genet. 1982;187:391–400. doi: 10.1007/BF00332617. [DOI] [PubMed] [Google Scholar]
- Sasse J. In: Current Protocols in Molecular Biology. Ausubel FM, et al., editors. Vol. 2. Greene Publishing Associates and Wiley-Interscience; New York: 1988. pp. 10.6.1–10.6.3. [Google Scholar]
- Schachman HK. J Biol Chem. 1988;263:18583–18586. [PubMed] [Google Scholar]
- Shanley MS, Foltermann KF, O’Donovan GA, Wild JR. J Biol Chem. 1984;259:12672–12677. [PubMed] [Google Scholar]
- Smith JA. In: Current Protocols in Molecular Biology. Ausubel FM, et al., editors. Vol. 2. Greene Publishing Associates and Wiley-Interscience; New York: 1988. pp. 10.2.1–10.2.9. [Google Scholar]
- Stevens RC, Gouaux JE, Lipscomb WN. Biochemistry. 1990;29:7691–7701. doi: 10.1021/bi00485a019. [DOI] [PubMed] [Google Scholar]
- Stevens RC, Chook YM, Cho CY, Lipscomb WN, Kantrowitz ER. Protein Eng. 1991;4:391–408. doi: 10.1093/protein/4.4.391. [DOI] [PubMed] [Google Scholar]
- Tondre C, Hammes GG. Biochemistry. 1974;13:3131–3136. doi: 10.1021/bi00712a020. [DOI] [PubMed] [Google Scholar]
- Van Vliet F, Xi XG, De Staercke C, De Wannemaeker B, Jacobs A, Cherfils J, Ladjimi MM, Hervé G, Cunin R. Proc Natl Acad Sci USA. 1991;88:9180–9183. doi: 10.1073/pnas.88.20.9180. [DOI] [PMC free article] [PubMed] [Google Scholar]
- Wales ME, Hoover TA, Wild JR. J Biol Chem. 1988;263:6109–6114. [PubMed] [Google Scholar]
- Wild JR, Wales ME. Annu Rev Microbiol. 1990;44:193–218. doi: 10.1146/annurev.mi.44.100190.001205. [DOI] [PubMed] [Google Scholar]
- Wild JR, Foltermann KF, Loughreychen SJ, O’Donovan GA. Arch Biochem Biophys. 1980;201:506–517. doi: 10.1016/0003-9861(80)90539-1. [DOI] [PubMed] [Google Scholar]
- Wild JR, Johnson JL, Loughrey SJ. J Bacteriol. 1988;170:446–448. doi: 10.1128/jb.170.1.446-448.1988. [DOI] [PMC free article] [PubMed] [Google Scholar]
- Wild JR, Loughreychen SJ, Corder TS. Proc Natl Acad Sci USA. 1989;86:46–50. doi: 10.1073/pnas.86.1.46. [DOI] [PMC free article] [PubMed] [Google Scholar]
- Wild JR, Grimsley JK, Kedzie KM, Loughreychen SJ, Wales ME. In: Chemical Aspects in Enzyme Biotechnology. Baldwin TO, et al., editors. Plenum Press; New York: 1990. pp. 95–109. [Google Scholar]
- Xi XG, De Staercke C, Van Vliet F, Triniolles F, Jacobs A, Stas PP, Ladjimi MM, Simon V, Cunin R, Hervé G. J Mol Biol. 1994;242:139–149. doi: 10.1006/jmbi.1994.1565. [DOI] [PubMed] [Google Scholar]
- Zhang Y, Kantrowitz ER. J Biol Chem. 1991;266:22154–22158. [PubMed] [Google Scholar]


