

Background: The stoichiometry of pore-forming toxins is frequently unknown because crystal structures do not reflect the active conformations.
Results: We used single subunit counting on fluorescently labeled Cry1Aa toxin of Bacillus thuringiensis to follow its oligomerization process.
Conclusion: We determined that the final architecture of the pores is tetrameric.
Significance: The stochastic analysis introduced permits the application of single subunit counting to dynamic processes such as oligomerization.
Keywords: Fluorescence, Membrane Bilayer, Membrane Biophysics, Single Molecule Biophysics, Toxins, Pore-forming Toxins, Single Subunit Counting
Abstract
Pore-forming toxins constitute a class of potent virulence factors that attack their host membrane in a two- or three-step mechanism. After binding to the membrane, often aided by specific receptors, they form pores in the membrane. Pore formation either unfolds a cytolytic activity in itself or provides a pathway to introduce enzymes into the cells that act upon intracellular proteins. The elucidation of the pore-forming mechanism of many of these toxins represents a major research challenge. As the toxins often refold after entering the membrane, their structure in the membrane is unknown, and key questions such as the stoichiometry of individual pores and their mechanism of oligomerization remain unanswered. In this study, we used single subunit counting based on fluorescence spectroscopy to explore the oligomerization process of the Cry1Aa toxin of Bacillus thuringiensis. Purified Cry1Aa toxin molecules labeled at different positions in the pore-forming domain were inserted into supported lipid bilayers, and the photobleaching steps of single fluorophores in the fluorescence time traces were counted to determine the number of subunits of each oligomer. We found that toxin oligomerization is a highly dynamic process that occurs in the membrane and that tetramers represent the final form of the toxins in a lipid bilayer environment.
Introduction
Pore-forming toxins are endogenous and potentially harmful proteins synthesized in a wide variety of bacteria, plants, and animals (1). Their specificity for certain hosts permits the use of pore-forming toxins as biopesticides or in medical treatment. Several toxins produced by Bacillus thuringiensis are widely used biological alternatives to chemical pesticides due to their specificity for certain insects of various orders, their low persistence in the environment, the absence of effects on mammals and humans, and the slow onset of resistance in target organisms (for review, see Ref. 2). Like other B. thuringiensis toxins, Cry1Aa, which is toxic only to Lepidoptera insects, is ingested by larvae as a protoxin and activated by proteases in the midgut of the larvae (3). The activated toxin is thought to then bind variably to different types of gut epithelial surface proteins (reviewed in Ref. 4). Subsequently, it will intercalate in the membrane, where it refolds to form pores responsible for cell destruction (2, 5–8). The crystal structure of Cry1Aa presents three functional domains (see Fig. 1A) (9). Domains II and III are involved in receptor binding and structural integrity (2, 4, 10, 11), whereas domain I, consisting of seven α-helices, is responsible for pore formation (8, 12, 13).
FIGURE 1.

Single toxin detection using fluorescence. A, domains of B. thuringiensis Cry1Aa toxin according to crystal structure (23). B, setup for photobleaching experiments with supported bilayers. A 532-nm laser excites fluorophores present in supported bilayers formed on a glass coverslip. A high numerical aperture objective collects the emitted light and directs it to an EMCCD camera. C, dispersion of fluorescent spots at incubation concentrations of 0.17 μg/ml (left panel), 1.21 μg/ml (center panel), and 2.33 μg/ml (right panel). D, for each spot, the fluorescence intensity time trace was determined. The time traces showed discrete photobleaching steps (arrows), and the number of steps was counted to determine the minimal number of subunits/oligomer. AU, arbitrary units.
Previous studies have shown that helix α4 of domain I lines the pores formed by Cry1Aa in planar lipid bilayers (14) and in brush-border membrane vesicles from Manduca sexta larva gut epithelial cells (15, 16). However, little information is available on the final architecture of the functional pores, i.e. whether they are monomeric or oligomeric and, in the latter case, how many subunits make up the pores and whether oligomerization takes place before or after membrane insertion.
Several studies have approached the question of B. thuringiensis toxin oligomerization in solution and in receptor-free artificial membranes. In solution, B. thuringiensis toxin oligomers or aggregates of a large range of sizes have been observed (17–19). In receptor-free bilayers, a number of different B. thuringiensis toxins formed ion channels with principal conductances of several hundreds of picosiemens, but smaller conducting levels down to a few picosiemens were also observed, indicative of the presence of conducting substates, smaller size channels of a lower order of oligomerization, or both (7, 9, 20–25). In brush-border membrane vesicles, Cry1Aa forms pores with a diameter of 24–26 Å (26). A similar diameter of 20–26 Å was obtained in the case of Cry1C in receptor-free bilayers as used in this study (25). It was proposed that these channels formed clusters of various sizes that gated cooperatively, resulting in multiple conductance states. On the other hand, trimers of Cry4Ba toxin, but also monomers and dimers, were detected in liposomes by SDS-PAGE analysis (27).
We recently studied the pore-forming mechanism of Cry1Aa using fluorescence spectroscopy (8) and found, in our system, that the pore-forming mechanism includes the insertion of the hairpin consisting of helices α3 and α4 into the membrane from the inner to the outer leaflet, whereas the rest of domain I remains on the inner leaflet. This intercalation of the hairpin preceded pore formation, suggesting an intermediate step, which might be lateral diffusion and oligomerization. Direct visual demonstration of pore-like structures of B. thuringiensis toxins in lipid membranes was provided by atomic force microscopy (AFM)3 (28–30) and electron microscopy (31). AFM measurements visualized a depression with a diameter of ∼15 Å surrounded by four elements, each of which had a diameter of ∼14 Å corresponding to the size of single α-helices or hairpin loops. The observed structures are thus consistent with a tetrameric stoichiometry as proposed previously (14, 32). According to our proposed model (8), mainly the α3-α4 loop protrudes from the external membrane leaflet, which would explain the size of the structures. Nevertheless, each Cry1Aa toxin contains seven α-helices and consequently five loops in pore-forming domain I, rendering it impossible to predict how many toxin molecules contribute to each pore-forming unit without additional information. Furthermore, the same toxin is suggested to form trimeric complexes in two-dimensional membrane-associated toxin crystals, as revealed by electron microscopy (31).
In this work, we set out to determine the number of subunits that compose the Cry1Aa oligomers using a single molecule fluorescence approach based on photobleaching step analysis (33–37). Because single fluorophores photobleach in a step-like behavior, the number of photobleaching steps occurring in a single labeled protein is equivalent to the number of fluorophores attached to it. In our case, each toxin monomer was labeled with a single fluorophore. Therefore, the number of photobleaching steps indicated how many subunits were present in individual Cry1Aa oligomers. Our results show that Cry1Aa forms tetramers in artificial membranes and suggest that oligomerization takes place after insertion into the lipid bilayer.
EXPERIMENTAL PROCEDURES
Purification, Labeling, and Reconstitution of Cry1Aa into Lipid Vesicles
Cry1Aa constructs in plasmid vectors pMP39 and pBA1 were described previously (8, 38). To monitor the fluorescence emission from fluorescently labeled Cry1Aa subunits using thiol-reactive fluorophores, cysteines were introduced into domain I by site-directed mutagenesis at Phe-50 and Pro-121 in the loops located between helices α1 and α2 and helices α3 and α4, respectively. Mutations were inserted using the QuikChange kit (Stratagene) and amplified using Qiagen miniprep kits following standard protocols. Constructs were sequenced to verify mutations.
Both mutants were transformed into B. thuringiensis strain Cry HD-73. The bacteria were grown for 72 h at 37 °C in yeast-tryptone medium containing 100 μg/ml ampicillin. Protoxins were solubilized and trypsin-activated, and toxins were purified by fast protein liquid chromatography as described previously (38). Purity was verified by SDS gel electrophoresis. All mutants were labeled with a 10-fold excess of tetramethylrhodamine-5-maleimide (Invitrogen) for 60 min. Unbound dye was removed by buffer exchange using Amicon concentrators (30 kDa; Millipore). The labeling ratio was determined by comparing the protein concentration (Bradford assay, Pierce) with the fluorophore concentration (absorption). The average labeling ratio after washing was 0.76 ± 0.02. WT Cry1Aa had low unspecific labeling (0.06 ± 0.03; see “Results”). Unilamellar vesicles (2.5 mg/ml lipid) were formed from 1-palmitoyl-2-oleoyl-sn-glycero-3-phosphatidylcholine (POPC) and 1-palmitoyl-2-oleoyl-sn-glycero-3-phosphatidylethanolamine (POPE) at a 1:1 mass ratio or from 1,2-diphytanoyl-sn-glycero-3-phosphocholine (DPhPC) (all from Avanti Polar Lipids) in experiment buffer (100 mm KCl, 10 mm Hepes, and 1 mm CaCl2, pH 7) using the same method as described previously (35). All mutants were finally reconstituted in unilamellar vesicles at concentrations of 0.17–2.33 μg/ml diluted from a stock solution of 33 μg/ml in experiment buffer. Preparations were sonicated and vortexed briefly to allow proper mixing and incubated overnight at 4 °C prior to measurements.
Fluorescence Measurements of Toxins in Supported Bilayer
Borosilicate glass coverslips were washed by a 30-min sonication in different solvents in the following order: Alconox (Fisher), acetone, and anhydrous ethanol. Between each step, the coverslips were rinsed with H2O (Milli-Q, filtered at 0.2 μm). Coverslips were stored in H2O and dried under a steady N2 stream immediately before use. At recording intensities below 1.5 milliwatts, almost no background fluorescence was detected from the top of the coverslip. 5 μl of mutant/vesicle mixture was added to 400 μl of experiment buffer on a clean coverslip. After 45 min, the vesicles formed supported bilayers on the coverslip, and excess vesicles were carefully washed off with experiment buffer using a micropipette.
Fluorescence was measured using an Axiovert 200 inverted microscope (Zeiss). A 30-milliwatt 532-nm laser (World Star Tech) was selected as the excitation source. Excitation light (<1.5 milliwatt) was defocused to a diameter of ≈10 mm. Emission was collected with a 63× numerical aperture 1.4 objective (Zeiss) and filtered using a 610/75-nm emission filter in combination with a Z532 dichroic mirror (Chroma Technologies). Images were recorded with an EMCCD camera (iXon+ 860BV, Andor Technology) (see Fig. 1B). To ensure complete photobleaching of the spots, each fluorescence recording was acquired until the image had reached a stable emission level (background, ∼5 min).
Photobleaching Data Analysis
Images were analyzed using a MATLAB routine (MathWorks) written in-house. The intensity of a single pixel spot was plotted over time and further analyzed regarding whether it met the selection criteria: only spots that showed clear photobleaching steps were considered to ensure that only single oligomers were observed (see below). We occasionally observed modulation of fluorescence intensity, which might have been caused by blinking or movement of the protein/fluorophore. Although these traces were included in the analysis of the number of photobleaching steps, the fluorescence modulation itself was not further analyzed, as we were interested only in the stoichiometry of the pore.
For every trace analyzed, we determined the number of photobleaching steps because they correspond to the number of labeled subunits forming a toxin oligomer (33, 35). Subunit counting statistics were first fitted to a Poisson distribution (Equation 1),
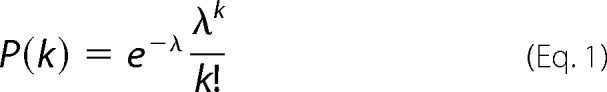 |
where P(k) represents the Poisson distribution probability as a function of k, and λ denotes the average number of subunits. The Poisson distribution provides information on the average number of subunits within stochastically distributed oligomers.
On the other hand, the binomial distribution is suitable only if the oligomerization results in a specific number of subunits,
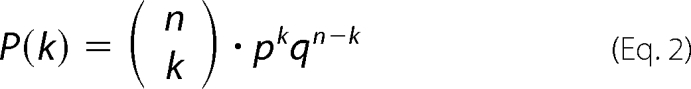 |
where P(k) represents the binomial distribution probability as a function of k, n is the number of subunits expected, p represents the probability of detecting an existing subunit, and q = (1 −p), the probability of not detecting it (photobleached or not labeled). Fitting was done by least squares optimization.
RESULTS
Toxin Oligomerizes as a Tetramer
Our aim was to establish whether we can deduce, from the observed distribution of photobleaching steps, the stoichiometry, if any, of the Cry1Aa pores. To this end, the toxins were fluorescently labeled using thiol-reactive chemistry, and supported bilayers were formed on the surface of glass coverslips from liposomes containing the labeled Cry1Aa toxins in variable concentrations between 0.17 and 2.33 μg/ml. Within this concentration range (1.95–2.6 μg/ml), pore formation has been observed in receptor-free planar lipid bilayers (8). In the presence of receptors, this concentration was reduced to 0.2–1.1 μg/ml (32). When directly injected into the midgut of insect larvae, the LC50 was ∼7 μg/ml (39). Distinct fluorescent spots were observed in the supported bilayer. The measurement of the efficiency of labeling (EOL) at 0.76 ± 0.02 (i.e. the number of fluorophores/monomer; see “Experimental Procedures”) established that not more than one fluorophore was attached to each monomer, meaning that each photobleaching event corresponds to a single subunit (monomer) (Fig. 1D). However, the number of bleaching steps is only the minimal number of subunits found in each oligomer, as not every subunit is observed via fluorescence due to incomplete labeling or previous photobleaching.
We found previously that the labeled Cry1Aa toxins form pores in planar lipid bilayers like the wild-type toxin (8). Fluorescence from tetramethylrhodamine-5-maleimide-labeled Cry1Aa toxins observed from the supported bilayer using epifluorescence was found to display fluorescence intensity in distinct spots distributed over the entire field of view (49 × 49 μm2) (Fig. 1C). Experiments were performed with Cry1Aa mutants F50C and P121C using two different lipid compositions, POPE/POPC (1:1) and DPhPC, to verify whether the observed oligomerization distribution is specific either to the labeling position in the pore-forming domain or to the lipid composition (fluidity). We analyzed the photobleaching behavior of the single spots. Most spots displayed a step-like photobleaching behavior, which confirmed that each spot contained only a few fluorophores (Fig. 1D). The exceptions were a few spots that fluoresced very intensely and followed an exponential bleaching behavior. These spots were likely caused by aggregated toxins or other impurities in the sample and were thus excluded from further analysis. We also excluded spots that were not fully bleached after the entire bleaching period (5 min) or where toxins moved during the exposure time as well as when the baseline did not remain constant. In those cases, the number of bleaching steps could not be confidently determined.
The observed spots were specific to the labeled toxins. Background measurements in the absence of toxins showed a low number of spots (14 ± 2). In presence of labeled wild-type Cry1Aa, which contains no endogenous cysteines, we found 110 ± 16 spots, which was ∼5.5 times lower than the number observed in the presence of labeled mutants. This ratio was consistent with the level of unspecific labeling (1:13) resulting in ratios in the range of 6.3 and 2.6 if the proteins contained two and six subunits, respectively. Although the unspecific labeling only slightly influences the histograms (the probability of finding two nonspecifically attached fluorophores in one oligomer is <0.6%), we will consider its influence below.
We determined the number of bleaching steps for each fluorescent spot from reconstituted toxin preparations at increasing concentrations between 0.17 and 2.33 μg/ml and analyzed the histograms representing the number of bleaching steps found under the different conditions. At even higher concentrations (>2.33 μg/ml), the spot density was close to the spatial resolution limit such that the spots were no longer distinct from one another. The photobleaching step size was not always equidistant, and a certain variability was observed also within one oligomer. This effect has been described previously (40–42). The fluorescence intensity is influenced by a number of parameters, including environmental properties, relative orientation, and homotransfer efficiency. The Cry toxin is a dynamic protein, suggesting that the fluorophores may dwell in more than one physical state. The type of distribution found in the histograms will give us information about the oligomerization. A randomly composed oligomer would follow a Poisson distribution, whereas an oligomer with a defined stoichiometry would rather display a binomial distribution. We therefore fitted the histograms of bleaching steps to both a Poisson distribution (Equation 1; see “Photobleaching Data Analysis”), by minimizing the difference between the data and the fit as a function of the average (λ), and to binomial distributions for different number of subunits, n (dimer, trimer, tetramer, etc.; Equation 2). For the binomial distributions, an additional fit parameter, p, was introduced, representing the probability of observing an existing subunit with fluorescence. Although it is related to the EOL, its value remains slightly lower because photobleaching prior to the measurement occurred to a certain extent.
At the lowest concentration (0.17 μg/ml), both toxin mutants photobleached to the greatest part in a single step (67.5 ± 3.3%) in both lipid compositions (Fig. 2, A and B, and supplemental Fig. 1, A and B) with a lower occurrence of dimers, trimers, and tetramers (averages of 24.2 ± 2.4, 6.6 ± 0.8, and 1.8 ± 0.7%, respectively). These results show that only minimal variations were observed between the different mutants and lipid environments. We found this to be consistent in all our measurements. A Poisson distribution with λ = 1.07 ± 0.04 was the best fit to our results. Even though a binomial distribution with the number of subunits (n) equal to 4, 5, and 6 also fits the distribution, the associated probability (p) would have to be too low in each case (<0.26) (see supplemental Table 1 for all results). As this is significantly lower than the EOL, a random number of subunits (as described by the Poisson distribution) seems to be the most likely interpretation.
FIGURE 2.

Experimental distributions of photobleaching steps. Shown is the distribution of F50C (A) and P121C (b) bleaching steps in DPhPC vesicles containing variable toxin concentrations incubated overnight. The numbers under the bars indicate the number of steps observed. N indicates the number of spots analyzed for each concentration.
With increasing concentrations of toxin in the bilayer, a shift in the distribution can be observed with both toxin mutants F50C and P121C and independent of the lipid composition (Fig. 2, A and B, and supplemental Fig. 1, A and B). Toward the highest concentration used here, the number of monomers observed decreased, and the distribution shifted steadily toward an increased number of trimers and tetramers and a low number of pentamers. Interestingly, a steep drop occurred between tetramers and pentamers, and hexamers were observed only twice among a total of 9129 spots that were analyzed.
It appeared that the type of distribution observed with increasing concentrations was shifting from a Poisson type to a binomial one (Fig. 3A). At a low concentration (<0.81 μg/ml), the optimized p values were for a binomial distribution of the number of labeled subunits/oligomer were still lower than 0.38 ± 0.03. This value was significantly different from the EOL value, meaning that there was no defined stoichiometry at low toxin concentrations, and up to concentrations of 0.81 μg/ml, the distribution was most appropriately described by a Poisson distribution. In contrast, the histograms were best fitted by a binomial distribution at higher concentrations, at which the distributions significantly deviated from Poisson distributions (Fig. 3A). This suggests that the toxins now assume a defined stoichiometry.
FIGURE 3.

Binomial and Poisson distributions. A, distribution of F50C oligomers in DPhPC vesicles at 0. 17 μg/ml (left panel) and 2.33 μg/ml (right panel) toxin incubated overnight and fitted with a Poisson distribution (upper panels) and a binomial distribution with n = 4, 5, and 6 (lower panels). B, distribution of P121C in DPhPC at 1.59 μg/ml (left panel) and 2.33 μg/ml (right panel) toxin and fitted with a double binomial distribution taking specific and unspecific labeling into account. The p values were 0.55 and 0.61, respectively, and the probability for unspecific labeling was 0.01.
The high number of four photobleaching steps that we found in the histograms excludes a dimeric and trimeric stoichiometry. Intuitively, one would presume a tetrameric pore-forming entity; however, as we still found a low number of five subunits, tetrameric, pentameric, or hexameric (n = 4, 5 and 6) structures would be possible models. Fitting the distributions to binomial distributions resulted in values of p, the probability of a subunit being detected, significantly lower than the EOL (p < 0.5) for n = 5 and 6. This and the steep drop from four to five observed steps would argue against oligomers with more than four subunits.
To obtain a more objective measure whether the pore-forming entity is indeed tetrameric, we determined the statistical probability to obtain the experimentally observed number of pentamers assuming a pentameric distribution (n = 5). We did this by considering the values to be Poisson-distributed around the theoretically predicted value for a binomial distribution with n = 5 for the highest two concentrations (1.59 and 2.33 μg/ml) for all four experimental conditions (see supplemental data). The probability (p) was either optimized by a binomial fit with n = 5 to all of the distribution or calculated directly from the frequency of four bleaching steps. In both cases, the probability that the experimentally observed frequency of five steps originated from a pentameric binomial distribution with p was <1%. Moreover, in each of the eight conditions (1.6 and 2.3 μg/ml for both lipid compositions and mutants), the observed value was consistently at the lower end of the Poisson distribution and was not spread evenly over the entire spectrum, as would be expected if the observed values were stochastically distributed. We can thus conclude with a 99% certainty that the toxins form tetramers.
If the pore-forming entity of the toxins is tetrameric, the low number of five and six bleaching steps observed still remained to be explained (Fig. 2, A and B). Theoretically, two explanations are possible assuming a tetrameric distribution: (i) there was more than one tetramer present in the spots, and (ii) some tetramers contained more than four fluorophores. We can directly rule out the first possibility again. With >50% of all spots showing three or four fluorophores, the probability of not finding any spots that contain seven or eight bleaching steps would be negligible. On the other hand, the second possibility is consistent with the unspecific labeling rate for the wild-type toxin. The ratio of specific to nonspecific labeling was 0.76:0.06, meaning that approximately every 13th monomer had an extra fluorophore attached nonspecifically. We therefore fitted the distributions obtained at concentrations of 1.6 and 2.3 μg/ml to a double binomial fit (Fig. 3B), where each monomer has a probability (p) and a different probability (u) of being labeled specifically and nonspecifically, respectively. The distributions fitted the experimental data very well with p = 0.64 ± 0.04 and u = 0.04 ± 0.03. The low number of five and six photobleaching steps is thus explained by nonspecific labeling of some of the monomers, and the observed histograms are consistent with a tetrameric pore-forming entity of Cry1Aa.
Concentration-dependent Evolution of Cry1Aa Oligomerization
The shift of the distribution from a Poisson to a binomial distribution with increasing concentrations of the toxin in the bilayer suggests that the stoichiometry is dependent on the toxin availability. Although a tetrameric structure forms at high concentrations, a more arbitrary stoichiometry exists at lower concentrations. This raises the question as to which oligomerization state of the toxin intercalates into the membrane. For example, it has been suggested that, in the presence of receptors, a tetrameric prepore forms in solution and is then inserted as such into the membrane (43), whereas other authors proposed that the monomers enter the membrane first (2, 44). To further investigate the evolution of the stoichiometry, we analyzed the development of the distribution as a function of toxin concentration.
Fig. 4B shows the average number of bleaching steps <n>, i.e. the population mean, found for increasing toxin concentrations in the incubation solution. As the distribution (and thus, <n>) varies with increasing concentrations, the oligomer composition in the membrane must also be different. If the stoichiometry remained unchanged at lower concentrations, identical distributions with a lower absolute number of spots should have been observed. On the other hand, if the oligomerization were random, we would expect Poisson distributions for all concentrations and a linear dependence of <n>, on the concentration. Thus, in contrast to our results, no saturation should be observed.
FIGURE 4.

Theoretical model. A, kinetic model explaining the stepwise oligomerization process of the toxin. The forward rate is concentration-dependent. B, fit of the population mean values of the number of bleaching steps fitted with the model in A (blue) and dependent on the vesicle/toxin ratio (red).
The availability of the toxins is given by two parameters: first, by the concentration of the toxin in the solution and, second, by the ratio of toxins to unilamellar vesicles. Let us first consider the concentration of the toxin. The oligomerization of the Cry1Aa tetramer can be described by a kinetic model, with an association constant Ka = α[Cry1Aa]/β, where α [Cry1Aa] is the association rate, β is the dissociation rate, and [Cry1Aa] is the concentration of Cry1Aa in solution (Fig. 4A). In such a model, the number of oligomers consisting of n subunits is given by An = Kan−1A1 (see supplemental data).
From this distribution, we can calculate the expected value of <n> for the average number of bleaching steps (monomers) (Fig. 4B, blue curve). <n> saturates at a value of 2.6, corresponding to a tetramer with a labeling probability of 0.65. This value corresponds well to the EOL of 0.76 for the cysteine mutants if we also consider a certain bleaching probability. We found Ka = 3.34 s−1 mol−1.
On the other hand, to obtain a sufficiently low number of toxins to be able to perform the subunit counting experiments, it was necessary to decrease the toxin concentration to a concentration at which the number of toxin monomers and vesicles in the solution became comparable. We estimated the ratio between toxin monomers and vesicles (toxin/vesicle) assuming vesicle radii varying from 25 nm (small unilamellar vesicles) to ∼500 nm (large unilamellar vesicles). In all cases, the toxin/vesicle ratio was close to or smaller than the ratio at low concentrations. For a typical radius of 200 nm, the ratio was 1.4. However, we can be certain that availability of the monomers was not the limiting factor at the higher concentrations used considering that the ratio increased to 18.9 at a toxin concentration of 2.33 μg/ml. In a random distribution of toxins onto the available vesicles, tetramers may only form in those vesicles that contain at least four toxin molecules. However, if, for instance, five molecules were present in a specific vesicle, a tetramer may be formed, but a single monomer will remain. These “overhang” molecules will significantly influence the oligomerization and will also lead to a concentration dependence of <n>. We fitted the observed evolution of <n> assuming a Poisson distribution of the available toxins onto the vesicles with an average vesicle radius of 252.5 nm and a labeling probability of 0.69 assuming full tetramer formation (Ka ≫ 1) (Fig. 4B, red curve). The curve fits the data well, indicating that also the distribution of monomers onto vesicles may explain the concentration dependence, in which case, Ka does not need to be concentration-dependent.
As both possibilities (a concentration-dependent Ka and the vesicle/toxin ratio) would explain the evolution of <n>, we cannot deduce whether the oligomerization process itself is concentration-dependent. However, the curve shown in Fig. 4B indicates that not only tetramers are present in the bilayer, but several oligomerization states coexist (monomers, dimers, trimers, and tetramers). Formation of a prepore is thus not a prerequisite to membrane insertion, but also monomers effectively enter the membrane. The maximal oligomerization state remains the tetramer, but we cannot exclude the possibility that the coexisting lower oligomers also form functional pores.
The coexistence of different oligomers would explain the significant difference between the p value of the tetrameric binomial fit and the EOL. If several oligomerization states coexist, the observed distribution will be a sum of binomial distributions (one for each oligomerization state). At high concentrations, even if we are very close to the expected tetrameric binomial distribution, other states may still exist and thus shift the distribution to some extent to smaller probabilities (p).
DISCUSSION
This study is the first direct demonstration of oligomerization, up to the tetrameric level, of Cry1A toxins. We used fluorescence spectroscopy based on the stepwise photobleaching principle to count the number of subunits present in Cry1Aa toxin pores within a supported bilayer free of toxin receptors. The data suggest that the pore is composed of four subunits (Fig. 2). On the basis of the spatial separation of the single spots, we can exclude the possibility that many spots are formed by two arbitrarily superposing oligomers. The results were not significantly affected by the lipid composition POPE/POPC versus DPhPC) or by the position of labeling (F50C versus P121C). They also showed that several oligomerization states coexist in the bilayer. Figs. 2 and 4 confirm that the oligomerization saturates with four subunits, indicating that, at the concentration range observed here, the tetrameric structure is the final state, suggesting it to be the pore-forming unit. We cannot with certainty decide whether monomers, dimers, and trimers also form pores. The measurements were limited by the highest concentration that can be used and still obtain a spatial separation between the toxin oligomers.
Whether the final structure is a symmetric tetramer or a dimer of dimers with a double pore cannot be distinguished with our method. However, single pore electrophysiological recordings and the symmetric images obtained in AFM measurements (28) argue against the possibility of a dimer of dimers.
The existence of B. thuringiensis toxin oligomers in receptor-free artificial membranes (planar lipid bilayers and liposomes) has been proposed for several B. thuringiensis toxins, mainly as a result of the observation of subconducting states in planar lipid bilayer experiments (7, 9, 20, 21, 24, 25, 45) and liposome permeabilization assays (27, 46, 47). Furthermore, a tetrameric configuration was suggested based on the biophysical properties of the pores (14, 45). The first direct evidence for a tetrameric pore came from AFM measurements in supported lipid bilayers (28–30). In the AFM measurements, however, it was impossible to determine how many toxin molecules were involved in forming the four identical observed structures. In contrast, Cry4Ba toxins were observed by electron crystallography to form trimers in two-dimensional crystals (31), and a tetrameric arrangement of trimers was obtained by computational simulation of intermolecular interactions in 16 B. thuringiensis toxin homologous sequences (48). In this study, we were able to directly show the tetrameric nature of the Cry1Aa pores because each toxin monomer contained a single fluorophore such that the number of fluorescence steps recorded corresponded to the number of toxin molecules that formed an individual pore.
Studies on cell and membrane vesicle permeabilization (26, 49–52), AFM measurements (28), and planar lipid bilayer data (25) provided an estimate of B. thuringiensis toxin pore diameter ranging between 15 and 26 Å. The maximal conductance of the pores in 150 mm KCl is 250–450 picosiemens (7, 8, 21). These observations are consistent with a tetrameric structure for B. thuringiensis pores in comparison with potassium channels, whose tetrameric pore is also composed of eight α-helices. Their central pore is up to 12 Å in diameter away from the 2–4-Å-wide selectivity filter and shows conductances up to 250 picosiemens under physiological conditions (53).
Whether the process of B. thuringiensis toxin oligomerization occurs before membrane insertion or takes place within the membrane is still unresolved. Data on toxin aggregation or oligomerization in solution, i.e. before the toxin partitions into the membrane, are scarce and variable, ranging from monomers to oligomers with 8–10 subunits (17–19, 54). It was suggested that the toxin assembles into stable oligomer barrels (prepores) before inserting into the bilayer (43) but also that monomers insert into the bilayer first and subsequently diffuse laterally in the membrane to assemble into multimers to form pores (46, 55, 56). In this study, we established that the oligomerization process may be described by a kinetic model as shown in Fig. 4A. Nevertheless, we could not distinguish whether the oligomerization occurs in the membrane or in solution before insertion because both possibilities are consistent with our data. However, the concentration-dependent distributions observed here demonstrate that the toxins can enter the membrane in their monomeric state because a large number of monomers were observed at low concentrations. Thus, we have shown that oligomeric prepore formation is not a necessary step in the mode of action of B. thuringiensis toxins, as suggested previously (44, 56).
We favor the possibility that the oligomerization process occurs within the membrane because the structure of the toxin changes after intercalation into the membrane (8, 57–59). Our previous study showed that pore formation occurred after the insertion of the toxin into the bilayer and with a temporal delay between the observed necessary conformational change and pore formation (8). The delay would be consistent with a lateral diffusion of the monomers to assemble into tetramers and would argue against the monomer being able to form pores itself. AFM studies also showed a time-dependent increase in the size of the observed structures, resulting in a final size of 350 Å for the entire complex (29).
Numerous studies have attempted to assess the role of toxin receptors in oligomerization either before insertion into the membrane, in terms of prepore formation, or within the membrane, in terms of pore formation by toxin monomers (reviewed in Ref. 6). Although no receptors were present in our system, the fact that the pores had identical properties whether they were mediated by receptors or intercalated into the membrane autonomously suggests that a similar pore architecture prevails.
In conclusion, using single subunit counting, we found that Cry1Aa of B. thuringiensis enters the membrane in monomeric form and that it assembles to tetrameric pores in the lipid bilayer. The way that the single subunit counting technique was utilized for the analysis was different from previous studies in which membrane proteins with a fixed stoichiometry were investigated (33–37). The highly dynamic nature of the oligomerization process and the presence of a mixture of oligomeric states required the employment of advanced stochastic analysis of histograms, and a high number of spots had to be analyzed to statistically distinguish between different models. We expect that studying oligomerization using single molecule fluorescence will help us to understand this highly dynamic protein-protein interaction for a number of similar proteins.
Supplementary Material
Acknowledgments
We thank Marc Juteau and Mireille Marsolais for technical assistance; Luke Masson for providing pMP39-Cry1Aa, pBA1-Cry1Aa, and some of the cysteine mutants; and Georges A. Haddad for comments on the manuscript.
The work was supported in part by Natural Sciences and Engineering Research Council Grants 327201DG (to R. B.) and 171373DG (to J.-L. S. and R. L.), Canada Research Chair Grant 202965 and Canadian Foundation for Innovation Grant 202965 (to R. B.), the Groupe d'Étude des Protéines Membranaires (GÉPROM), and student fellowships from Fonds de Recherche de Québec–Nature et Technologie (to N. G. and H. M.). Work performed at GÉPROM and Center SÈVE was supported by FRSQ and FQRNT, respectively.

The on-line version of this article (available at http://www.jbc.org) contains supplemental data, Figs. 1 and 2, and Table 1.
- AFM
- atomic force microscopy
- DPhPC
- 1,2-diphytanoyl-sn-glycero-3-phosphocholine
- EOL
- efficiency of labeling
- POPE
- phosphatidylethanolamine
- POPC
- phosphatidylcholine.
REFERENCES
- 1. Alouf J. E., Popoff M. R. (2006) The Comprehensive Sourcebook of Bacterial Protein Toxins, 3rd Ed., Elsevier, Amsterdam, The Netherlands [Google Scholar]
- 2. Schnepf E., Crickmore N., Van, Rie J., Lereclus D., Baum J., Feitelson J., Zeigler D. R., Dean D. H. (1998) Microbiol. Mol. Biol. Rev. 62, 775–806 [DOI] [PMC free article] [PubMed] [Google Scholar]
- 3. Höfte H., Whiteley H. R. (1989) Microbiol. Rev. 53, 242–255 [DOI] [PMC free article] [PubMed] [Google Scholar]
- 4. Pigott C. R., Ellar D. J. (2007) Microbiol. Mol. Biol. Rev. 71, 255–281 [DOI] [PMC free article] [PubMed] [Google Scholar]
- 5. Knowles B. H. (1994) Adv. Insect Physiol. 24, 275–308 [Google Scholar]
- 6. Bravo A., Likitvivatanavong S., Gill S. S., Soberón M. (2011) Insect Biochem. Mol. Biol. 41, 423–431 [DOI] [PMC free article] [PubMed] [Google Scholar]
- 7. Peyronnet O., Vachon V., Schwartz J. L., Laprade R. (2001) J. Membr. Biol. 184, 45–54 [DOI] [PubMed] [Google Scholar]
- 8. Groulx N., Juteau M., Blunck R. (2010) J. Gen. Physiol 136, 497–513 [DOI] [PMC free article] [PubMed] [Google Scholar]
- 9. Grochulski P., Masson L., Borisova S., Pusztai-Carey M., Schwartz J. L., Brousseau R., Cygler M. (1995) J. Mol. Biol. 254, 447–464 [DOI] [PubMed] [Google Scholar]
- 10. Aronson A. I., Wu D., Zhang C. (1995) J. Bacteriol. 177, 4059–4065 [DOI] [PMC free article] [PubMed] [Google Scholar]
- 11. Lee M. K., Young B. A., Dean D. H. (1995) Biochem. Biophys. Res. Commun. 216, 306–312 [DOI] [PubMed] [Google Scholar]
- 12. Walters F. S., Slatin S. L., Kulesza C. A., English L. H. (1993) Biochem. Biophys. Res. Commun. 196, 921–926 [DOI] [PubMed] [Google Scholar]
- 13. Schwartz J. L., Laprade R. (2000) in Entomopathogenic Bacteria: From Laboratory to Field Application (Charles J., Delécluse A., Nielsen-Leroux C. eds) pp. 199–217, Kluwer Associate Publishing, Norwell, MA [Google Scholar]
- 14. Masson L., Tabashnik B. E., Liu Y. B., Brousseau R., Schwartz J. L. (1999) J. Biol. Chem. 274, 31996–32000 [DOI] [PubMed] [Google Scholar]
- 15. Girard F., Vachon V., Lebel G., Préfontaine G., Schwartz J. L., Masson L., Laprade R. (2009) Biochim. Biophys. Acta 1788, 575–580 [DOI] [PubMed] [Google Scholar]
- 16. Girard F., Vachon V., Préfontaine G., Marceau L., Schwartz J. L., Masson L., Laprade R. (2009) Appl. Environ. Microbiol. 75, 359–365 [DOI] [PMC free article] [PubMed] [Google Scholar]
- 17. Walters F. S., Kulesza C. A., Phillips A. T., English L. H. (1994) Insect Biochem. Mol. Biol. 24, 963–968 [Google Scholar]
- 18. Güereca L., Bravo A. (1999) Biochim. Biophys. Acta 1429, 342–350 [DOI] [PubMed] [Google Scholar]
- 19. Masson L., Mazza A., Sangadala S., Adang M. J., Brousseau R. (2002) Biochim. Biophys. Acta 1594, 266–275 [DOI] [PubMed] [Google Scholar]
- 20. Slatin S. L., Abrams C. K., English L. (1990) Biochem. Biophys. Res. Commun. 169, 765–772 [DOI] [PubMed] [Google Scholar]
- 21. Schwartz J. L., Garneau L., Savaria D., Masson L., Brousseau R., Rousseau E. (1993) J. Membr. Biol. 132, 53–62 [DOI] [PubMed] [Google Scholar]
- 22. English L., Robbins H. L., Von Tersch M. A., Kulesza C. A., Ave D., Coyle D., Jany C. S., Slatin S. L. (1994) Insect Biochem. Mol. Biol. 24, 1025–1035 [Google Scholar]
- 23. Lorence A., Darszon A., Díaz C., Liévano A., Quintero R., Bravo A. (1995) FEBS Lett. 360, 217–222 [DOI] [PubMed] [Google Scholar]
- 24. Smedley D. P., Armstrong G., Ellar D. J. (1997) Mol. Membr. Biol. 14, 13–18 [DOI] [PubMed] [Google Scholar]
- 25. Peyronnet O., Nieman B., Généreux F., Vachon V., Laprade R., Schwartz J. L. (2002) Biochim. Biophys. Acta 1567, 113–122 [DOI] [PubMed] [Google Scholar]
- 26. Carroll J., Ellar D. J. (1997) Eur. J. Biochem. 245, 797–804 [DOI] [PubMed] [Google Scholar]
- 27. Likitvivatanavong S., Katzenmeier G., Angsuthanasombat C. (2006) Arch. Biochem. Biophys. 445, 46–55 [DOI] [PubMed] [Google Scholar]
- 28. Vié V., Van Mau N., Pomarède P., Dance C., Schwartz J. L., Laprade R., Frutos R., Rang C., Masson L., Heitz F., Le, Grimellec C. (2001) J. Membr. Biol. 180, 195–203 [DOI] [PubMed] [Google Scholar]
- 29. Laflamme E., Badia A., Lafleur M., Schwartz J. L., Laprade R. (2008) J. Membr. Biol. 222, 127–139 [DOI] [PubMed] [Google Scholar]
- 30. Puntheeranurak T., Stroh C., Zhu R., Angsuthanasombat C., Hinterdorfer P. (2005) Ultramicroscopy 105, 115–124 [DOI] [PubMed] [Google Scholar]
- 31. Ounjai P., Unger V. M., Sigworth F. J., Angsuthanasombat C. (2007) Biochem. Biophys. Res. Commun. 361, 890–895 [DOI] [PMC free article] [PubMed] [Google Scholar]
- 32. Schwartz J. L., Lu Y. J., Söhnlein P., Brousseau R., Laprade R., Masson L., Adang M. J. (1997) FEBS Lett. 412, 270–276 [DOI] [PubMed] [Google Scholar]
- 33. Ulbrich M. H., Isacoff E. Y. (2007) Nat. Methods 4, 319–321 [DOI] [PMC free article] [PubMed] [Google Scholar]
- 34. Das S. K., Darshi M., Cheley S., Wallace M. I., Bayley H. (2007) ChemBioChem 8, 994–999 [DOI] [PubMed] [Google Scholar]
- 35. Blunck R., McGuire H., Hyde H. C., Bezanilla F. (2008) Proc. Natl. Acad. Sci. U.S.A. 105, 20263–20268 [DOI] [PMC free article] [PubMed] [Google Scholar]
- 36. Tombola F., Ulbrich M. H., Isacoff E. Y. (2008) Neuron 58, 546–556 [DOI] [PMC free article] [PubMed] [Google Scholar]
- 37. Simonson P. D., Deberg H. A., Ge P., Alexander J. K., Jeyifous O., Green W. N., Selvin P. R. (2010) Biophys. J. 99, L81–L83 [DOI] [PMC free article] [PubMed] [Google Scholar]
- 38. Masson L., Préfontaine G., Péloquin L., Lau P. C., Brousseau R. (1990) Biochem. J. 269, 507–512 [DOI] [PMC free article] [PubMed] [Google Scholar]
- 39. van Frankenhuyzen K., Gringorten J. L., Milne R. E., Gauthier D., Pusztai M., Brousseau R., Masson L. (1991) Appl. Environ. Microbiol. 57, 1650–1655 [DOI] [PMC free article] [PubMed] [Google Scholar]
- 40. Ding H., Wong P. T., Lee E. L., Gafni A., Steel D. G. (2009) Biophys. J. 97, 912–921 [DOI] [PMC free article] [PubMed] [Google Scholar]
- 41. Lenn T., Gkekas C. N., Bernard L., Engl C., Jovanovic G., Buck M., Ying L. Y. (2011) Chem. Commun. 47, 400–402 [DOI] [PMC free article] [PubMed] [Google Scholar]
- 42. Garcia H. G., Lee H. J., Boedicker J. Q., Phillips R. (2011) Biophys. J. 101, 535–544 [DOI] [PMC free article] [PubMed] [Google Scholar]
- 43. Gómez I., Sánchez J., Miranda R., Bravo A., Soberón M. (2002) FEBS Lett. 513, 242–246 [DOI] [PubMed] [Google Scholar]
- 44. Aronson A. I., Geng C., Wu L. (1999) Appl. Environ. Microbiol. 65, 2503–2507 [DOI] [PMC free article] [PubMed] [Google Scholar]
- 45. Schwartz J. L., Juteau M., Grochulski P., Cygler M., Préfontaine G., Brousseau R., Masson L. (1997) FEBS Lett. 410, 397–402 [DOI] [PubMed] [Google Scholar]
- 46. Haider M. Z., Ellar D. J. (1989) Biochim. Biophys. Acta 978, 216–222 [DOI] [PubMed] [Google Scholar]
- 47. Gazit E., Shai Y. (1995) J. Biol. Chem. 270, 2571–2578 [DOI] [PubMed] [Google Scholar]
- 48. Torres J., Lin X., Boonserm P. (2008) Biochim. Biophys. Acta 1778, 392–397 [DOI] [PubMed] [Google Scholar]
- 49. Martin F. G., Wolfersberger M. G. (1995) J. Exp. Biol. 198, 91–96 [DOI] [PubMed] [Google Scholar]
- 50. Knowles B. H., Ellar D. J. (1987) Biochim. Biophys. Acta 924, 509–518 [Google Scholar]
- 51. Carroll J., Ellar D. J. (1993) Eur. J. Biochem. 214, 771–778 [DOI] [PubMed] [Google Scholar]
- 52. Villalon M., Vachon V., Brousseau R., Schwartz J. L., Laprade R. (1998) Biochim. Biophys. Acta 1368, 27–34 [DOI] [PubMed] [Google Scholar]
- 53. Latorre R., Vergara C., Hidalgo C. (1982) Proc. Natl. Acad. Sci. U.S.A. 79, 805–809 [DOI] [PMC free article] [PubMed] [Google Scholar]
- 54. Feng Q., Becktel W. J. (1994) Biochemistry 33, 8521–8526 [DOI] [PubMed] [Google Scholar]
- 55. Aronson A. I., Shai Y. (2001) FEMS Microbiol. Lett. 195, 1–8 [DOI] [PubMed] [Google Scholar]
- 56. Tigue N. J., Jacoby J., Ellar D. J. (2001) Appl. Environ. Microbiol. 67, 5715–5720 [DOI] [PMC free article] [PubMed] [Google Scholar]
- 57. Nair M. S., Dean D. H. (2008) J. Biol. Chem. 283, 26324–26331 [DOI] [PMC free article] [PubMed] [Google Scholar]
- 58. Tomimoto K., Hayakawa T., Hori H. (2006) Comp Biochem. Physiol. B Biochem. Mol. Biol. 144, 413–422 [DOI] [PubMed] [Google Scholar]
- 59. Alzate O., Hemann C. F., Osorio C., Hille R., Dean D. H. (2009) BMC Biochem. 10, 25. [DOI] [PMC free article] [PubMed] [Google Scholar]
Associated Data
This section collects any data citations, data availability statements, or supplementary materials included in this article.