Abstract
Metabolic stimuli such as insulin and insulin like growth factor cause cellular accumulation of G protein Coupled Receptor Kinase 2 (GRK2), which in turn is able to induce insulin resistance. Here we show that in fibroblasts, GRK2 is able to increase ATP cellular content by enhancing mitochondrial biogenesis; also, it antagonizes ATP loss after hypoxia/reperfusion. Interestingly, GRK2 is able to localize in the mitochondrial outer membrane, possibly through one region within the RGS homology domain and one region within the catalytic domain. In vivo, GRK2 removal from the skeletal muscle results in reduced ATP production and impaired tolerance to ischemia. Our data show a novel sub-cellular localization of GRK2 in the mitochondria and an unexpected role in regulating mitochondrial biogenesis and ATP generation.
Keywords: GRK2, mitochondria, ischemia/reperfusion, biogenesis, ATP production
1 Introduction
An emerging and intriguing role of the G protein coupled receptor kinase 2 (GRK2) involves its ability to modulate the metabolic state of the cell. Little is known about this feature, opposite to the relevance of the kinase in the regulation of the G protein coupled receptor (GPCR) signaling. Indeed, GRK2 belongs to a family of seven serine/threonine protein kinases, each encoded by a single gene, that specifically phosphorylate the activated form of GPCRs, mediating their desensitization [1,2].
The first suggestion that GRK2 is involved in the cellular metabolism derives from the observation that insulin [3] and insulin like growth factor are both able to induce up regulation of the kinase, which occurs within the time frame of few minutes. Interestingly, GRK2 accumulation leads to the shut-off of insulin signaling and inhibits glucose extraction [3–5]. Conditions characterized by elevated GRK2 levels such as hypertension or chronic activation of β adrenergic receptor [3], as well as transgenic overexpression of the kinase [6] present resistance to the metabolic effects on the cell induced by insulin. This evidence suggests a novel role of GRK2 in controlling the cellular use of glucose and, more in general, the ability of the cell to master energy production and expenditure.
Mitochondria, of course, play an important role in cell energy production, given their ability to produce ATP in an oxygen dependent manner. The mitochondria functional state varies dramatically depending on the functional and metabolic state of the cell. Post transduction modification of mitochondrial proteins and in particular protein phosphorylation appears to be an important mechanism of mitochondrial function. In the last years, different reports [7] confirmed that a series of kinases (MAPKs, Akt, PKA and PKC) are present in mitochondria, particularly in the intermembrane space and membranes where they meet mitochondrial constitutive upstream activators.
All of the above considerations prompted us to verify the hypothesis that GRK2 might affect energy cellular production by interfering with mitochondrial function. Pursuing this aim, we demonstrate that GRK2 has capability to localize in the mitochondrial fraction and profoundly affect the biology and the production of energy of these organelles.
2 Materials and Methods
2.1 Cell culture
HEK-293 cells were cultured in Dulbecco’s minimal essential medium (DMEM) and 25mM glucose supplemented with 10% foetal bovine serum (FBS) at 37°C in 95% air and 5% CO2.
2.2 Primary cultured mouse aorta cells and infection
Primary cultured cells were prepared with little modifications from a previously validated protocol [8] for extraction of cells from aortic rings of recombinant mice harbouring f-loxed GRK2 alleles (homozygous GRK2f/f) [9,10]. Briefly, vessels were cut in rings and placed on Matrigel (BD Technologies), incubated in Dulbecco’s minimal essential medium (DMEM) supplemented with 20% fetal bovine serum (FBS) and incubated at 37 °C in 95% air and 5% CO2. After 5 to 7 days, aortic rings were removed, and the cells remaining on Matrigel expanded. To obtain GRK2 knock out cells, we incubated GRK2f/f primary cultured cells with an adenovirus encoding for Cre recombinase (AdCre, Vector Biolabs) at MOI of 50 particles per cell for 3 hours in a serum free medium. Incubation was repeated after one week. GRK2 removal was confirmed by western blot. A similar procedure, using an empty vector (AdEMPTY, Vector Biolabs) was applied to obtain control GRK2f/f cells. Cells were studied between passages 7 and 14.
2.3 GRK2 cloning in pcDNA3.1
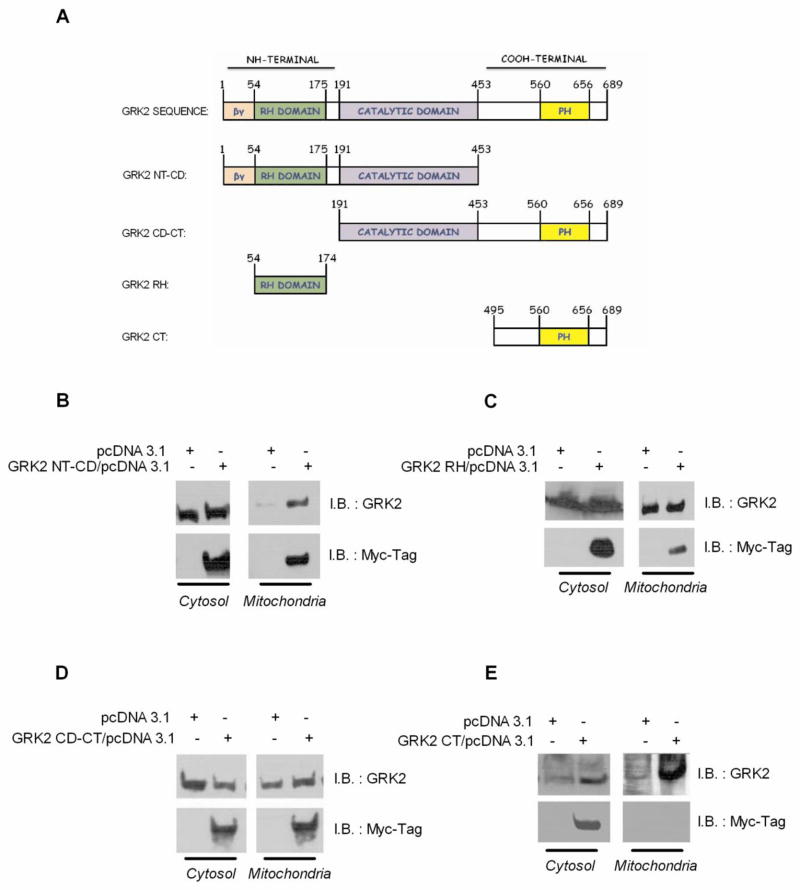
Using human GRK2 cDNA (GRK2-WT) in pcDNA3.1 [3] as a template and the primers which contain consensus sequences for the indicated restriction enzymes (Table 1), we amplified the N-Terminal region and catalytic domain, (NT-CD, 1–453 amino acids), the catalytic domain and C-Terminal region (GRK2 CD-CT, 191–689 amino acids), the C-Terminal region (GRK2 CT 454–689 amino acids) and the RH domain (GRK2 RH, 54–174 amino acids) (Figure 3A). These truncated mutants were cloned in pcDNA3.1 (+) Myc/His A by means of T4 DNA ligase (Promega). The right frame and orientation were confirmed by restriction analysis and DNA sequencing by using the above indicated primers (Avant 3100, Applied Biosystem).
Table 1.
Primer sequences used for amplification of truncated mutants of human GRK2 gene
| TRUNCATED MUTANTS | PRIMERS | RESTRICTION ENZYMES |
|---|---|---|
| GRK2 NT-CD | For: 5′-TAAGCTTGGATGGCGGACCTGGAGGC-3′ | HindIII |
| Rev: 5′-CCCTCTAGAGAAAAAGGGGCTCTCTTTC-3′ | XbaI | |
| GRK2 CD-CT | For: 5′-TAAGCTTGGATGGAATGACTTCAGCGTGCATC-3′ | HindIII |
| Rev: 5′-CCCTCTAGAGAGGCCGTTGGCACTGCCGCG-3′ | XbaI | |
| GRK2 RH | For: 5′-AAAAGGATCCTGATGACCTTTGAGAAGATC-3′ | BamHI |
| Rev: 5′-AAAAGATATCTGCAAAACCGTGTGAACTTATC-3′. | EcoRV | |
| GRK2 CT | For: 5′-TAAGCTTGGATGCTCCCTGGACTGGCAGATG -3′, | HindIII |
| Rev: 5′-CCCTCTAGAGAGGCCGTTGGCACTGCCGCG- 3′ | XbaI |
Figure 3.
(A) GRK2 sequence and truncated mutants cloned in pcDNA3.1 (+) Myc/His A. HEK-293 cells were transfected with pcDNA3.1 encoding for GRK2 NT-CD (B), GRK2 RH (C), GRK2 CD-CT (D) and GRK2 CT (E).
2.4 Cell transfections
Cell trasfection was performed with lipotrasfection reagents (lipofectamine 2000, Invitrogen) using 2μg of plasmid DNA according to manufacturer’s instructions [3,11]. For stable transfected clone selections, after 24 to 48 hours cell medium was supplemented with G418 (500μg/mL) for 2 weeks. The G418-resistant cells were cultured in medium supplemented with G418 to a final concentration of 250μg/mL and examined for overexpression of GRK2 (GRK2-HEK) by western blotting, using specific antibodies (Santa Cruz Biotechnology).
2.5 Mitochondria extracts preparation and western blot
Cells were washed in ice-cold phosphate buffer (PBS) and disrupted by dounce homogenization in isolation buffer [IB pH 7.4 200mM sucrose, 1mM EGTA-Tris and 10mM Tris-MOPS]. The homogenate was spun at 800g for 10 min; the supernatant was recovered and further centrifuged for 10 min at 8000g. The resulting pellet (mitochondrial fraction) was collected while the supernatant was further spun for 30 min at 100000g to obtain the cytosolic fraction, spanned again at 100000g to further purify the fraction. The mitochondrial fraction was further purified by centrifuging twice at 8000g for 10 minutes. The obtained pellet was purified by centrifugation at 95000g for 30 minutes on a 30% Percoll gradient in IB [12]. The obtained mitochondrial layer was washed free of Percoll and resuspended in IB. Protein concentration was determined by bichinconnate assay (Pierce). Protein concentration was determined by using the Bradford method (Bio-Rad). Cytosol and mitochondria extracts were confirmed by western blot using specific antibodies (Santa Cruz Biotechnology).
Cellular or mitochondria extracts were electrophoresed by SDS/PAGE and transferred to nitrocellulose; GRK2 was visualized by specific antibody (Santa Cruz Biotechnology), anti-mouse HRP-conjugated secondary antibody (Santa Cruz Biotechnology) and standard chemiluminescence (Pierce) on autoradiographic film. Images were then digitalized and densitometric analysis was performed (ImageQuant software).
2.6 Overlay assay
Mitochondrial proteins were electrophoresed by SDS/PAGE and transferred to nitrocellulose. The membrane was incubated with 50ng of GRK2 purified protein (Invitrogen) in binding buffer [Hepes 0,25M; MgCl2 50mM; DTT 2,5mM; Na3VO4 5mM; H20-Tween 0,1%] for 1 h at room temperature. Protein was fixed in 0.5% formaldehyde for 5 min and washed with 2% glycine [13]. GRK2 was visualized by chemiluminescence after incubation with anti-GRK2 antibody (Santa Cruz Biotechnology).
2.7 Kinase assay
Kinase assay was performed by using mitochondrial extracts. Phosphorylation reaction was initiated by adding master mix (Hepes 0,5M; MgCl2 1M; DTT 1M; Na3VO4 1M; H20-Tween 0,1%), 50ng of GRK2 purified protein (Invitrogen) and [γ-32P]ATP (GE Healthcare) and prolonged for 30 minutes at 37°C. Laemmli buffer was added to stop the reaction. Then, 30μl of the reaction mix were resolved on SDS-PAGE4-12% gradient (Invitrogen), stained with Coomassie blue, de-stained, vacuum dried, and exposed for autoradiography [14].
2.8 Quantitative analysis of mitochondrial nucleic acids
Cell DNA and total RNA were isolated using commercially available reagents (DNAzol and Trizol, Invitrogen). cDNA was synthesized from RNA by reverse transcriptase (Invitrogen), following the manufacturer’s instructions. Real-time quantitative polymerase chain reaction (RT-PCR) was performed on DNA and cDNA as previously described [11] to amplify two mitochondrial (cytochrome b, NADHd), and one nuclear (β globin) genes. The primers sequences used were: [15] cytochrome b: For: 5′-CCTAGGCGACCCAGACAATTAT; Rev: 5′-TCATTCGGGCTTGATGTGG; NADHd: For: 5′-CAGCCATTCTCATCCAAACC; Rev: 5′-ATTATGATGCGACTGT GAGTGC; β globin: For: 5′-AGCCTGACCAACATGGTGAAAC; Rev: 5′-AGCCACCTGAATAGCTGGGACT. All values obtained were normalized to the values obtained with the β globin primers. The reaction was visualized by Sybr Green Analysis (Applied Biosystem) on StepOne instrument (Applied Biosystem). The results are expressed as the relative integrated intensity.
2.9 Immunofluorescence
HEK-293 and GRK2-HEK cells were incubated for 30 min with 5nM mitotracker (Rosamine-based Mitotracker dye-Invitrogen) to identify mitochondria. Then the cells were fixed with −20°C cold methanol/acetone and permeabilized by incubation in 0.3% Triton X-100 solution for 3 min. Cells were incubated for 1h at room temperature with mouse anti-GRK2 Ab (Santa Cruz Biotecnology) in PBS containing 1% BSA [14]. After two washing in PBS, the cells were incubated for 1 h at room temperature with Fluorescent-labeled secondary antibody (Invitrogen) in PBS. After washing in PBS, the glass slides were mounted under a coverslip in a 50% glycerol PBS solution. Images were acquired with a Zeiss 510 confocal laser scanning microscope.
2.10 Transmission Electron Microscopy (TEM) and Immunogold staining
Mitochondrial fractions were washed in PBS and fixed in 4% paraformaldehyde for 4h at 4°C. Then samples were incubated with 0,05M glicine, dehydrated in graded ethanols and 100% acetone and blocked in 5% BSA in PBS for 1h. Mitochondrial fractions were washed in incubation buffer (IB: 0,8% BSA in PBS and 15mM NaN3), incubated with anti GRK2 antibody (5μg/ml) in IB overnight and washed in IB. Subsequently, samples were incubated with secondary antibody (Aurion ultra-small gold reagents) for 1,5 h, washed and incubated with Aurion R-gent SE-EM, according to manufacturer’s instructions. Samples were then xed with 2.5% glutaraldehyde, washed in PBS, xed in osmium tetroxide, dehydrated in an ethanol series, embedded in epoxy resin, and then examined under a transmission electron microscope (JEM-2000EX), at the Federico II facility for advanced imaging (CISME).
2.11 Cytofluorimetry
Cells were incubated for 30 min with 5nM mitotracker (Rosamine-based Mitotracker dye-Invitrogen) to identify mitochondria. Then mitotracker stained and unstained control cells were analysed by flow cytometry (FACSCalibur, BD Biosciences) followed by analysis of mean fluorescence intensity of 10,000 events by Cellquest software (BD Biosciences) [16].
2.12 Assay for oxidative ATP synthesis
Cells were harvested, washed twice in PBS, and counted in a Burker’s camera. A replicate for each sample was prepared that had been treated for 1 h with 4μg/ml rotenone (Sigma). The emission recorded from samples treated with rotenone was defined as baseline luminescence corresponding to a non mitochondrial source of ATP. Assays were performed using the ATP luminescence assay kit (Sigma) according to manufacturer’s instructions.
2.13 Cell Hypoxia
Cell medium was previously saturated for 10 min at 1 atm with 95% N2 and 5% CO2 mixture, containing (mM) concentrations of 116NaCl, 5.4KCl, 0.8MgSO4, 26.2NaHCO3, 1NaH2PO4, 1.8CaCl2, 0.01glycine and 0.001 (% w/v) phenol red, and placement in an anaerobic chamber (hypoxia chamber) filled with the same gas mixture and heated to 37°C. The pH, PO2 and PCO2 of the resulting medium were 7.36±0.2, 45.3±1.2mmHg, and 35.3±0.8mmHg and 7.32±0.9, 32.6±1.1 and 37.9±2.1 mmHg, before and at the end of hypoxia, respectively [17].
2.14 Mouse skeletal muscle infection
Animal studies were carried out on homozygous GRK2f/f mice [9] (n=23; weight: 26.7±3.1g) in accordance to Federico II University guidelines. To obtain GRK2 gene removal, mice were anaesthetized by vaporized Isoflurane 3% and intramuscular injection of AdCre (109pfu/ml) were performed into right quadriceps femoris (200μl) muscle. GRK2 removal was confirmed by western blot. After 5 days we performed ischemia/reperfusion.
2.15 Mouse surgery
Mice were anaesthetized by isoflurane 4% inhalation and maintained by mask ventilation (isoflurane 2%). A surgical incision was made in the skin overlying the middle portion of the right hind limb and the right common femoral artery was exposed and isolated, as previously described [18], and a slipknot was placed around the proximal end of the artery with a 5-0 silk suture, maintained for 1 hour to induce hind limb ischemia. Groups of 3 mice were sacrificed at the end of 1 hour of ischemia, after 15 minutes or 60 minutes of reperfusion. These mice were compared to GRK2f/f mice subjected to the same procedures (3 for each time point) and to sham-operated GRK2f/f (n=3) and GRK2f/f,Cre (n=3).
2.16 Assay for oxidative ATP synthesis in vivo
At sacrifice, quadriceps femoris muscles were harvested and quickly washed in PBS. Assay was performed using the ATP luminescence assay kit (Sigma) according to manufacturer’s instructions. Then, values were normalized according to muscles’ weights.
2.17 Statistical Analysis
All values are presented as mean±SEM. Two-way ANOVA was performed to compare the different parameters among the different groups. Bonferroni post hoc testing was performed where applicable. A significance level of p<0.05 was assumed for all statistical evaluations. Statistics were computed with GraphPad Prism software (San Diego, California).
3 Results
3.1 GRK2 increases oxidative ATP synthesis
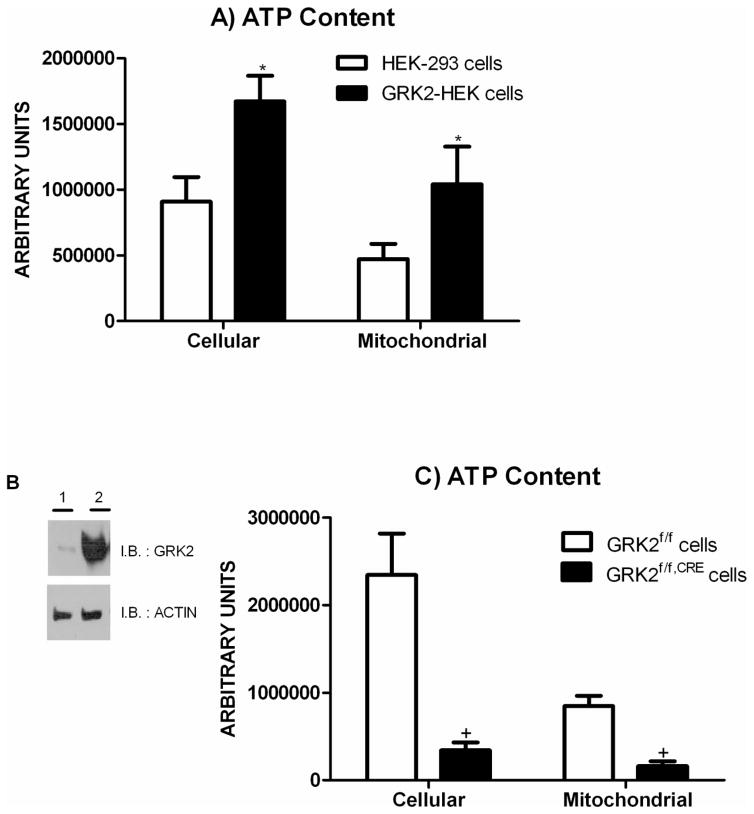
To evaluate the relevance of GRK2 in energy production we monitored whether GRK2 modulates mitochondrial ATP synthesis. Figure 1A shows that Human Embryonic Kidney (HEK-293) fibroblasts stably over expressing a human GRK2 gene (GRK2-HEK) contain higher levels of total and mitochondrial ATP, compared to control cells. We also studied primary cultured cells derived from the aortas of recombinant mice with both copies of the GRK2 gene flanked by two f-lox sites (GRK2f/f). When these cells were infected with AdCre to obtain cellular expression of the bacterial CRE recombinase (GRK2f/f,CRE), GRK2 protein levels became undetectable (Figure 1B). At the same time, in GRK2f/f,Cre cells (Figure 1C) there is a significant reduction of total and mitochondrial ATP levels, supporting a positive role of GRK2 in bio-energetic pathway.
Figure 1.
(A) Cellular and mitochondrial ATP content in HEK-293 and GRK2-HEK cells. (* p<0.05 vs HEK-293 cells). (B) Infection with AdCRE removes GRK2 gene in GRK2f/f cells. Recombinant floxed GRK2 cells were incubated either with adenovirus encoding for Cre recombinase (AdCRE, Vector Biolabs) or an empty virus (AdEMPTY) at MOI of 50 particles for 3 hours in a serum free medium. Cells were then maintained in culture and GRK2 removal was confirmed by western blot (1: cells treated with AdCRE; 2: cells treated with AdEMPTY). (C) Cellular and mitochondrial ATP content in GRK2f/f and GRK2f/f,CRE aortas derived cells. (+ p<0.05 vs GRK2f/f cells).
3.2 GRK2 is located in mitochondria
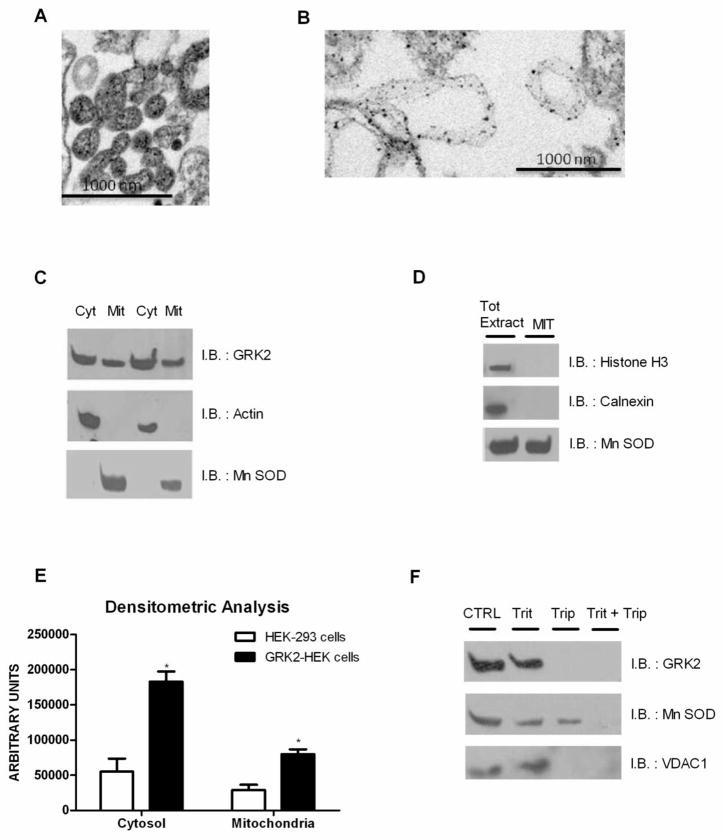
To clarify the basis for the possible link between GRK2 and the mitochondria, we evaluated the presence of the kinase in the organelles by co-fractionation experiments on a 30% Percoll gradient. First of all, to verify that the mitochondrial fraction was free from contaminants of other compartments, we observed samples from HEK-293 cells under TEM and confirmed the purity of the mitochondrial fraction (Figure 2A). On this fraction, immunogold analysis shows that the kinase is indeed found on the mitochondria, where it targets to the outer membranes (Figure 2B).
Figure 2.
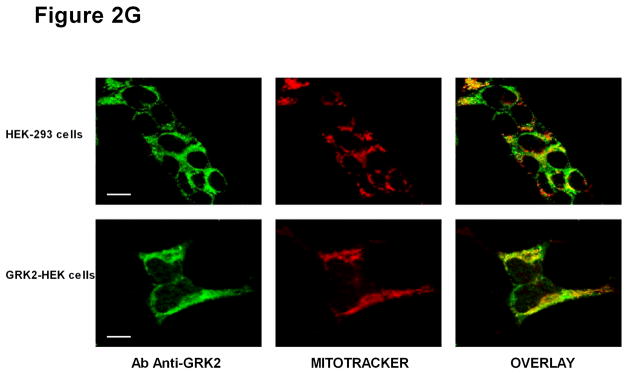
(A) Mitochondria were obtained by co-fractionation experiments on a 30% Percoll gradient and observed by electron microscopy. (B) GRK2 localization was observed by immunogold on mitochondria extracts using anti-GRK2 antibody. (C) GRK2 levels were analyzed in cytosol (Cyt) and mitochondrial (Mit) extracts by western blot in HEK-293 cells. (D) The absence of Histone H3 and Calnexin in purified mitochondria was confirmed by western blot in HEK-293 cells, using cellular extracts for molecular weight reference. (E) The stable overexpression of GRK2-WT increases GRK2 levels both in cytosol and mitochondria (* p<0.05 vs HEK-293 cells). (F) Mitochondria were incubated with or without tripsin (Trip). To disrupt mitochondrial integrity, triton X-100 (Trit) was added in the digestion buffer. Sample were probed for GRK2, Mn SOD and VDAC1. (G) GRK2 localization was analyzed by immunofluorescence. HEK-293 cells (upper lane) and GRK2-HEK cells (lower lane) were labeled in vivo with mitotracker (red), fixed, and immunostained with anti-GRK2 (green) antibody. Pictures were taken under confocal microscopy. Bars, 10μm.
Localization of GRK2 on mitochondria was also confirmed using mitochondria and cytosol fractions isolated from HEK-293 cells performing western blots. Figure 2C shows that endogenous GRK2 partly co-purified with the mitochondria-enriched fraction, as did the Mn-dependent Superoxide Dismutase (Mn SOD), a protein that resides within mitochondrial compartments. We verified that the purified mitochondrial fractions were free from contaminants of the cytosol (actin) (Figure 2C), nuclei (Histone H3) and sarcoplasmic reticulum (calnexin) (Figure 2D). The specificity of the antibody for GRK2 is confirmed by the observation that stable overexpression of GRK2 in HEK-293 cells increases the levels of the protein both in cytosol and mitochondria (Figure 2E).
To confirm the sub-mitochondrial compartment where GRK2 localizes, we subjected the purified mitochondrial fraction to a double treatment with trypsin and triton demonstrating that the kinase targets to outer membrane (Figure 2F). Confirmation derives from the evidence that the mitochondrial outer membrane protein VDAC1 but not the mitochondrial matrix protein MnSOD localizes in the same sub-mitochondrial fraction as GRK2.
Finally, the ability of GRK2 to co-localize with mitochondria was also demonstrated by confocal microscopy using immunofluorescence (Figure 2G). In particular, imaging confirms the ubiquitous localization of GRK2 within the cytosol and the membrane compartments, but the nucleus. When the GRK2 and mitochondria signals are merged, it appears clearly that GRK2 can compartmentalize in mitochondria. This feature is further highlighted in presence of GRK2 overexpression (Figure 2G).
3.3 Two regions within GRK2 sequence show affinity for mitochondria
To map the regions of GRK2 that possess the ability to localize in mitochondria, we generated myc/histidine-tagged, truncated mutants of GRK2 (Figure 3A). The aminoacid sequence 1–453 is able to localize to mitochondria (Figure 3B). Within this region, we found that the 120 aminoacids comprising the RGS Homology (GRK2 RH) domain (aminoacids 54–174) allow to target mitochondria (Figure 3C). Also, the region 191–689 (Figure 3D) which comprises the catalytic domain, but the sequence 495–689 (Figure 3E) is able to target the mitochondria.
3.4 GRK2 interacts and phosphorylates unidentified mitochondrial proteins
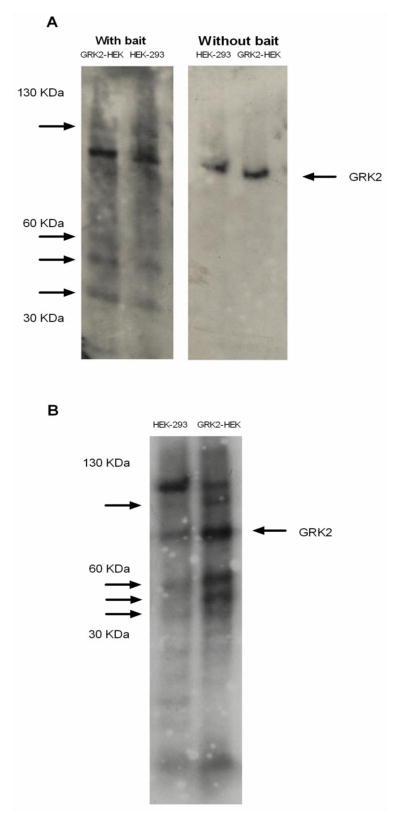
To confirm the ability of GRK2 to localize on mitochondria, we performed an overlay assay with purified GRK2 as bait on HEK-293 and GRK2-HEK cells mitochondria extracts blotted on nitrocellulose. This assay confirms the ability of GRK2 to interact with yet unidentified mitochondrial proteins within the molecular weight range of 30–60 KDa (Figure 4A).
Figure 4.
(A) Overlay assay with (left blot) or without (right blot) purified GRK2 as bait in HEK-293 and GRK2-HEK cells mitochondria blotted on nitrocellulose. (B) Purified GRK2 was incubated with HEK-293 and GRK2-HEK mitochondrial extracts blotted on nitrocellulose in a kinase buffer, in presence of [32P]-ATP. The blot was then extensively washed and exposed to autoradiography.
Using a similar approach, we performed a kinase assay to verify whether GRK2 recognizes substrates among the mitochondrial proteins (Figure 4B). This experiment confirms that GRK2 phosphorylates mitochondrial proteins within the molecular range of 30–60 KDa.
3.5 GRK2 increases mitochondrial biogenesis
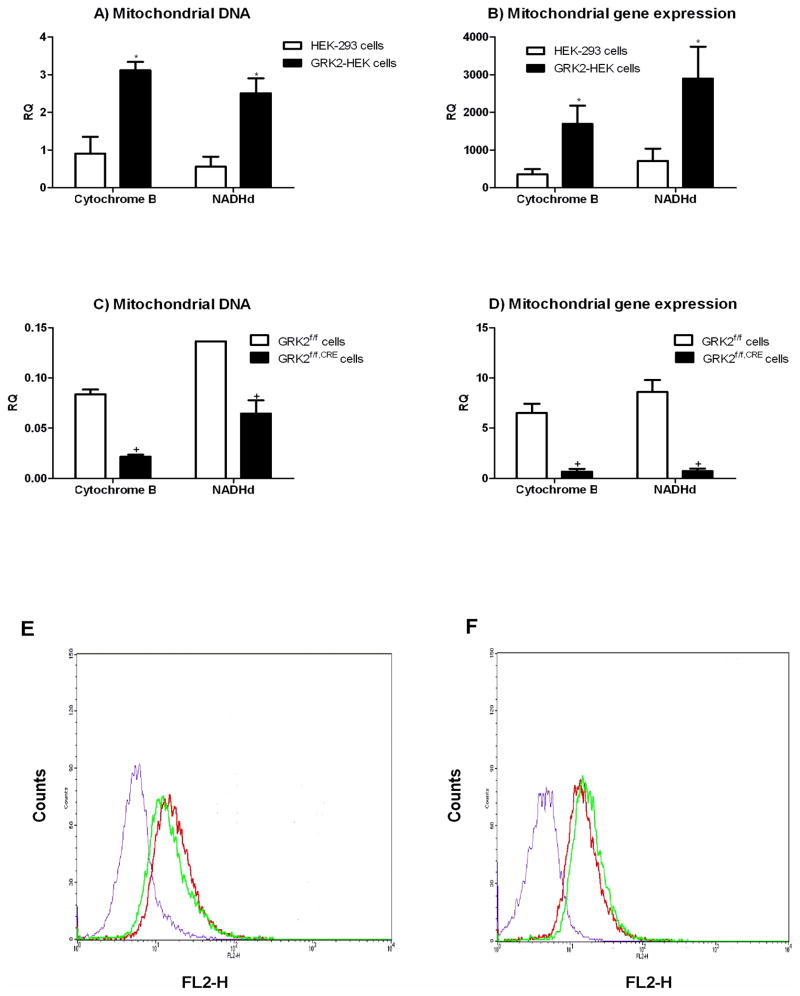
Given the localization of GRK2 on mitochondria, we asked whether GRK2 promotes mitochondrial DNA accumulation. By quantitative PCR analysis, we monitored the levels of two mitochondrial genes: NADH de-hydrogenase (NADHd) and cytochrome B (Cyt B), using nuclear globin gene as internal control. Figure 5A shows that GRK2 increased the levels of both mitochondrial genes.
Figure 5.
(A and B) Quantitative RT-PCR analysis in HEK-293 and GRK2-HEK cells of copy numbers and gene expression of the mitochondrial genes Cytochrome B (Cyt B) and NADHd, relative to the nuclear gene β globin. (RQ: relative quantities, * p<0.05 vs HEK-293 cells). (C and D) Same as above, in GRK2f/f and GRK2f/f,CRE cells. (RQ: relative quantities, + p<0.05 vs GRK2f/f cells). (E) Intensity of fluorescente emission in HEK-293 (green) and GRK2-HEK (red) cells and mitotracker unstained control cells (purple) under FACS analysis. (F) Same as above, in GRK2f/f(green) and GRK2f/f,CRE(red) cells and mitotracker unstained control cells (purple).
To correlate the increased mitDNA with increased expression of mitochondrial proteins, we monitored the expression levels of NADHd and cytochrome B mRNA. Total RNA was extracted from cells and subjected reverse transcription and quantitative RT-PCR analysis. As shown in Figure 5B, GRK2 significantly up-regulated the levels of NADHd and cytochrome B mRNAs. Reciprocally, in GRK2f/f,CRE cells, we observed a reduction in the number of copies and the level of expression of the NADHd and cytochrome B as compared to GRK2f/f cells (Figures 5C and 5D).
To assess for the actual change in total mitochondrial mass, we loaded cells with the mitochondrial selective fluorescent dye mitotracker and analysed the intensity of fluorescente emission by FACS analysis. GRK2 overexpression in HEK-293 induced a rightward shift in the emission profile of mitotracker, which increased by a 36% (Figure 5E). Reciprocally, in GRK2f/f,Cre cells, we observed a leftward shift compared to GRK2f/f cells, accounting for a decrease of emission intensity of mitotracker of about 31% (Figure 5F). These data are compatible with a positive effect of GRK2 on mitochondrial biogenesis.
3.6 GRK2 protects from hypoxia/reperfusion induced ATP loss
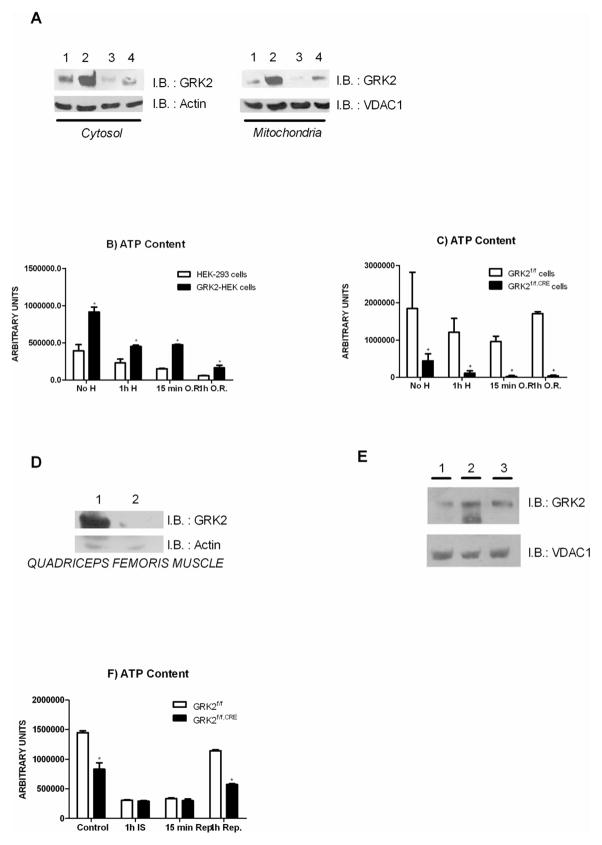
Given the ability of GRK2 to promote ATP production through an increase in mitochondria, we verified the effects of the kinase in a mitochondrial threatening condition, the hypoxia/reperfusion. Acute hypoxia (1 hour) promotes an increase of total and mitochondrion-associated GRK2 levels, as assessed by western blot analysis. The increase of GRK2 levels in hypoxic conditions was transient, since re-oxygenation for 15 minutes and 1 hour restored the levels of the kinase to normal oxygen conditions (Figure 6A). In control cells, ATP levels decreased during hypoxia and after oxygen restoration. Over-expression of GRK2 attenuated the loss of ATP production, compared to controls (Figure 6B). As expected, in GRK2f/f,CRE cells ATP levels were severely reduced under both basal and hypoxia conditions, and the recovery following oxygen restoration was impaired (Figure 6C).
Figure 6.
(A) In cells, GRK2 accumulates during hypoxia and returns to basal levels after oxygen replenishment (1: No hypoxia; 2: 1h hypoxia; 3: 15 minutes oxygen replenishment; 4: 1 hour oxygen replenishment). (B) Cellular ATP content in HEK-293 and GRK2-HEK cells during hypoxia (H: hypoxia; O.R.: Oxygen restoration; * p<0.05 vs HEK-293 cells). (C) Cellular ATP in GRK2f/f and GRK2f/f,CRE cells during hypoxia (H: hypoxia; O.R.: Oxygen restoration; + p<0.05 vs GRK2f/f cells). (D) In vivo GRK2 expression, in quadriceps femoris muscle from mice harbouring f-loxed GRK2 gene after intramuscular injection of AdCre (109pfu/ml) (1: AdEMPTY; 2: AdCre). (E) Ischemia induces an increase of GRK2, which promptly recovers to basal levels after 15 minutes of reperfusion (1: No ischemia; 2: 1h ischemia; 3: 15 minutes). (F) ATP content in quadriceps femoris muscle of mice subjected to hind limb ischemia/reperfusion (* p<0.05 vs GRK2f/f mice; Control: non ischemic muscle; IS: 1 hour ischemia; Rep: reperfusion).
3.7 Removal of GRK2 gene in GRK2f/f,CRE mice decreases ATP levels
We evaluated the role of GRK2 in the regulation of ATP levels in an in vivo model of muscle ischemia. We used mutant GRK2f/f mice. Intramuscular injection of adenoviral particles (109pfu/ml) encoding for Cre recombinase promoted targeted deletion of GRK2 gene, thus reducing the levels of the kinase by several folds (Figure 6D). Ischemia causes GRK2 mitochondrial accumulation in mouse hind limb muscle. Ischemia was obtained by ligation of the femoral artery for 1 hour, and reperfusion was applied for 15 minutes. By western blot, ischemia induces an increase of GRK2, which promptly recovers to basal levels after 15 minutes of reperfusion (Figure 6E). In control GRK2f/f mice, femoral artery occlusion reduced ATP levels, in quadriceps femoral muscle. Reperfusion of ischemic muscles for 15 minutes and 1 hour partially restored muscular ATP levels. In GRK2f/f,CRE muscles, GRK2 removal parallels a significant reduction of ATP levels. GRK2 deletion also attenuated the recovery of ATP levels following reperfusion of ischemic muscles, compared to GRK2f/f mice (Figures 6F).
4 Discussion
This report shows for the first time that GRK2 can localize on the mitochondrial outer membrane. Indeed, until now, the paradigm indicates that GRK2 shuttles between the cytosol and the plasma membrane, anchoring to the latter through its pleckstrin homology and Gβγ binding domains within the carboxyl terminus [19]. Our data allow us to indicate that also the mitochondria should be included as a cellular compartment on which this molecule can be found. Two regions within the RH and the catalytic domains possess the ability to localize truncated mutants of GRK2 on these organelles. The most compelling finding, though, is that GRK2 modifies the biology of mitochondria. Indeed, the mitochondrial compartment is more than just a reservoir for the kinase. We observed consensual changes in mitochondrial DNA and RNA, as well as mitochondrial mass size, after overexpression or deletion of GRK2, consistent with the ability of the kinase to promote mitochondrial biogenesis. Furthermore, these changes are paralleled by modification of mitochondrial ATP production.
Mitochondria are most important in the settings of the responses to stress, such as the ischemia/reperfusion [20], and under these conditions we report two striking novel and unexpected observations. First, ischemia causes acute cellular and mitochondrial accumulation of GRK2 both in vitro (Figure 6A) and in vivo (Figure 6E), an effect reverted by oxygen restoration. This surprising evidence further strengthen the physiological role of GRK2 in the mitochondria. Second, a protective effect of the kinase is revealed, since transgenic overexpression causes mitochondrial accumulation of the kinase and protects ATP production even after hypoxia/reperfusion damage.
Although we do not have evidence regarding the mechanism through which GRK2 localizes in the mitochondria, it is evident that within these organelles, the kinase can bind some protein counterparts, which can also be phosphorylated by the kinase. It is possible to speculate that these unknown substrates favours the accumulation within the mitochondria of GRK2 and in turn get phosphorylated. Indeed, using a catalytic inactive mutant of GRK2 we can observe mitochondrial accumulation, suggesting that the enzymatic activity of the kinase is not needed for the localization (data not shown). The identification of the mitochondrial partner of GRK2 is actively pursued in the lab, and will allow to better understand the mechanisms of biogenesis and mitochondrial protection induced by the kinase.
The favourable activity of GRK2 within the mitochondria results to be protective, in particular after ischemia/reperfusion. Previous data in the literature support a protective role of GRK2 for the cell. First, GRK2 gene deletion is detrimental for embryonic cardiac development [21]. Second, in adult life, cardiac selective GRK2 removal alters the cardiac hypertrophy response to chronic β adrenergic receptor stimulation, leading to an eccentric dilatation of the heart similar to that observed in intermediate-advanced phases of heart failure [9]. On the contrary, other data in literature, suggest a detrimental effect of increased GRK2 levels for the cell, and may appear in contrast with the present observation. In particular, in mice subjected to myocardial infarction, the inducible, cardiac specific removal of GRK2 through gene deletion results in the amelioration of survival, reduced “at risk” ischemic area and improved cardiac performance [22]. This apparent discrepancy could be imputed to differences in timing and model. Indeed, we applied ischemia reperfusion for 1 hour in the skeletal muscle. It is possible that more extensive tissue damage in a more sensitive tissue such as the myocardium, the negative signaling properties of GRK2 prevail on the protective metabolic effects of the kinase.
In conclusion, our data add more support to the building of a new perspective in which GRK2 not only regulates GPCR signaling, but also coordinates a series of metabolic responses to excessive signaling and stress, by starting receptor desensitization [19], reducing glucose extraction [3] and metabolism and activating mitochondrial biogenesis.
HIGHLIGHTS.
In this study we examine the mitochondrial localization of GRK2.
We identify two regions that possess the ability to localize in mitochondria.
We study the oxidative ATP synthesis and the mitochondrial biogenesis.
We demonstrate that GRK2 attenuates the loss of ATP after hypoxia/reperfusion.
This study supports a positive role of GRK2 in bio-energetic pathway.
Acknowledgments
We are grateful to Dr. Nella Prevete, Dr. Annalisa Carlucci and Sergio Sorbo (CISME) for their technical support. Antonio Feliciello is supported by Associazione Italiana Ricerca sul Cancro (AIRC), Guido Iaccarino by MIUR grant (PRIN 2009EL5WBP) and Anna Fusco is the recipient of the Salvatore Campus fellowship from Società Italiana Ipertensione Arteriosa (SIIA).
Footnotes
Publisher's Disclaimer: This is a PDF file of an unedited manuscript that has been accepted for publication. As a service to our customers we are providing this early version of the manuscript. The manuscript will undergo copyediting, typesetting, and review of the resulting proof before it is published in its final citable form. Please note that during the production process errors may be discovered which could affect the content, and all legal disclaimers that apply to the journal pertain.
References
- 1.Inglese J, Freedman NJ, Koch WJ, Lefkowitz RJ. J Biol Chem. 1993;268(32):23735–23738. [PubMed] [Google Scholar]
- 2.Ribas C, Penela P, Murga C, Salcedo A, Garcia-Hoz C, Jurado-Pueyo M, Aymerich I, Mayor F., Jr Biochim Biophys Acta. 2007;1768(4):913–922. doi: 10.1016/j.bbamem.2006.09.019. [DOI] [PubMed] [Google Scholar]
- 3.Cipolletta E, Campanile A, Santulli G, Sanzari E, Leosco D, Campiglia P, Trimarco B, Iaccarino G. Cardiovasc Res. 2009;84(3):407–415. doi: 10.1093/cvr/cvp252. [DOI] [PubMed] [Google Scholar]
- 4.Ciccarelli M, Chuprun JK, Rengo G, Gao E, Wei Z, Peroutka RJ, Gold JI, Gumpert A, Chen M, Otis NJ, Dorn GW, 2nd, Trimarco B, Iaccarino G, Koch WJ. Circulation. 123(18):1953–1962. doi: 10.1161/CIRCULATIONAHA.110.988642. [DOI] [PMC free article] [PubMed] [Google Scholar]
- 5.Usui I, Imamura T, Satoh H, Huang J, Babendure JL, Hupfeld CJ, Olefsky JM. Embo J. 2004;23(14):2821–2829. doi: 10.1038/sj.emboj.7600297. [DOI] [PMC free article] [PubMed] [Google Scholar]
- 6.Usui I, Imamura T, Babendure JL, Satoh H, Lu JC, Hupfeld CJ, Olefsky JM. Mol Endocrinol. 2005;19(11):2760–2768. doi: 10.1210/me.2004-0429. [DOI] [PubMed] [Google Scholar]
- 7.Antico Arciuch VG, Alippe Y, Carreras MC, Poderoso JJ. Adv Drug Deliv Rev. 2009;61(14):1234–1249. doi: 10.1016/j.addr.2009.04.025. [DOI] [PubMed] [Google Scholar]
- 8.Ciccarelli M, Cipolletta E, Santulli G, Campanile A, Pumiglia K, Cervero P, Pastore L, Astone D, Trimarco B, Iaccarino G. Cell Signal. 2007;19(9):1949–1955. doi: 10.1016/j.cellsig.2007.05.007. [DOI] [PubMed] [Google Scholar]
- 9.Matkovich SJ, Diwan A, Klanke JL, Hammer DJ, Marreez Y, Odley AM, Brunskill EW, Koch WJ, Schwartz RJ, Dorn GW., 2nd Circ Res. 2006;99(9):996–1003. doi: 10.1161/01.RES.0000247932.71270.2c. [DOI] [PubMed] [Google Scholar]
- 10.Iaccarino G, Ciccarelli M, Sorriento D, Cipolletta E, Cerullo V, Iovino GL, Paudice A, Elia A, Santulli G, Campanile A, Arcucci O, Pastore L, Salvatore F, Condorelli G, Trimarco B. Circulation. 2004;109(21):2587–2593. doi: 10.1161/01.CIR.0000129768.35536.FA. [DOI] [PubMed] [Google Scholar]
- 11.Sorriento D, Campanile A, Santulli G, Leggiero E, Pastore L, Trimarco B, Iaccarino G. Mol Cancer. 2009;8:97. doi: 10.1186/1476-4598-8-97. [DOI] [PMC free article] [PubMed] [Google Scholar]
- 12.de Brito OM, Scorrano L. Nature. 2008;456(7222):605–610. doi: 10.1038/nature07534. [DOI] [PubMed] [Google Scholar]
- 13.Sorriento D, Santulli G, Fusco A, Anastasio A, Trimarco B, Iaccarino G. Hypertension. 56(4):696–704. doi: 10.1161/HYPERTENSIONAHA.110.155960. [DOI] [PubMed] [Google Scholar]
- 14.Sorriento D, Ciccarelli M, Santulli G, Campanile A, Altobelli GG, Cimini V, Galasso G, Astone D, Piscione F, Pastore L, Trimarco B, Iaccarino G. Proc Natl Acad Sci U S A. 2008;105(46):17818–17823. doi: 10.1073/pnas.0804446105. [DOI] [PMC free article] [PubMed] [Google Scholar]
- 15.Livigni A, Scorziello A, Agnese S, Adornetto A, Carlucci A, Garbi C, Castaldo I, Annunziato L, Avvedimento EV, Feliciello A. Mol Biol Cell. 2006;17(1):263–271. doi: 10.1091/mbc.E05-09-0827. [DOI] [PMC free article] [PubMed] [Google Scholar]
- 16.Chowanadisai W, Bauerly KA, Tchaparian E, Wong A, Cortopassi GA, Rucker RB. J Biol Chem. 285(1):142–152. doi: 10.1074/jbc.M109.030130. [DOI] [PMC free article] [PubMed] [Google Scholar]
- 17.Ciccarelli M, Santulli G, Campanile A, Galasso G, Cervero P, Altobelli GG, Cimini V, Pastore L, Piscione F, Trimarco B, Iaccarino G. Br J Pharmacol. 2008;153(5):936–946. doi: 10.1038/sj.bjp.0707637. [DOI] [PMC free article] [PubMed] [Google Scholar]
- 18.Santulli G, Ciccarelli M, Palumbo G, Campanile A, Galasso G, Ziaco B, Altobelli GG, Cimini V, Piscione F, D’Andrea LD, Pedone C, Trimarco B, Iaccarino G. J Transl Med. 2009;7:41. doi: 10.1186/1479-5876-7-41. [DOI] [PMC free article] [PubMed] [Google Scholar]
- 19.Lodowski DT, Pitcher JA, Capel WD, Lefkowitz RJ, Tesmer JJ. Science. 2003;300(5623):1256–1262. doi: 10.1126/science.1082348. [DOI] [PubMed] [Google Scholar]
- 20.Carlucci A, Lignitto L, Feliciello A. Trends Cell Biol. 2008;18(12):604–613. doi: 10.1016/j.tcb.2008.09.006. [DOI] [PubMed] [Google Scholar]
- 21.Jaber M, Koch WJ, Rockman H, Smith B, Bond RA, Sulik KK, Ross J, Jr, Lefkowitz RJ, Caron MG, Giros B. Proc Natl Acad Sci U S A. 1996;93(23):12974–12979. doi: 10.1073/pnas.93.23.12974. [DOI] [PMC free article] [PubMed] [Google Scholar]
- 22.Raake PW, Vinge LE, Gao E, Boucher M, Rengo G, Chen X, DeGeorge BR, Jr, Matkovich S, Houser SR, Most P, Eckhart AD, Dorn GW, 2nd, Koch WJ. Circ Res. 2008;103(4):413–422. doi: 10.1161/CIRCRESAHA.107.168336. [DOI] [PMC free article] [PubMed] [Google Scholar]


