

Abstract
Transient receptor potential channels Trpc2 and Trpc3 are expressed on normal murine erythroid precursors, and erythropoietin stimulates an increase in intracellular calcium ([Ca2+]i) through TRPC2 and TRPC3. Because modulation of [Ca2+]i is an important signaling pathway in erythroid proliferation and differentiation, Trpc2, Trpc3, and Trpc2/Trpc3 double knockout mice were utilized to explore the roles of these channels in erythropoiesis. Trpc2, Trpc3, and Trpc2/Trpc3 double knockout mice were not anemic, and had similar red blood cell counts, hemoglobins, and reticulocyte counts as wild type littermate controls. Although the erythropoietin induced increase in [Ca2+]i was reduced, these knockout mice showed no defects in red cell production. The major phenotypic difference at steady state was that the mean corpuscular volume, mean corpuscular hemoglobin, and hematocrit of red cells were significantly greater in Trpc2 and Trpc2/Trpc3 double knockout mice, and mean corpuscular hemoglobin concentration was significantly reduced. All hematological parameters in Trpc3 knockout mice were similar to controls. When exposed to phenyhydrazine, unlike the Trpc3 knockouts, Trpc2 and Trpc2/Trpc3 double knockout mice showed significant resistance to hemolysis. This was associated with significant reduction in hydrogen peroxide-induced calcium influx in erythroblasts. While erythropoietin induced calcium influx through TRPC2 or TRPC3 is not critical for erythroid production, these data demonstrate that TRPC2 plays an important role in oxidative stress-induced hemolysis which may be related to reduced calcium entry in red cells in the presence of Trpc2 depletion.
Keywords: TRP Channels, Trpc2, Trpc3, erythropoietin, oxidative stress
INTRODUCTION
Erythropoietin (Epo) has been shown to be of key importance in production of red cells in mice (1, 2). Severe anemia and subsequent death at eleven to fifteen days gestation follow homozygous deletion of the Epo or Epo receptor (Epo-R) genes. Erythropoietin mediates its effects on erythroid proliferation and differentiation through a number of different signaling pathways (3–7), including regulation of the intracellular calcium concentration ([Ca2+]i) (8–16). Recently, specific members of the transient receptor potential (TRP) ion channel superfamily, TRPC2, TRPC3, and TRPC6, have been identified on normal erythroid progenitors and precursors (17–21). TRPC2 and TRPC3 are activated by erythropoietin (17, 18), whereas TRPC6, a highly homologous member of the TRPC subfamily is not, but can inhibit calcium influx through TRPC2 or TRPC3 (19, 21).
The TRP superfamily of ion channels is a group of calcium-permeable cation channels expressed on nonexcitable cells which are involved in a large number of physiological processes (22–30). TRP channels function as homotetramers or heterotetramers, with the pore formed by loops between the fifth and sixth transmembrane domains (31, 32). TRPC2 and TRPC3, like many other TRPC channels, associate with phospholipase Cγ (PLCγ) and the inositol 1,4,5-trisphosphate receptor, which modulate their activation (17, 20, 33). Several N-terminal splice variants of Trpc2 (clones 14, 17, and α) have been identified in murine splenic erythroblasts (19, 34, 35). Clones 17 (120 kDa) and α (100 kDa) lack the first 111 and 287 N-terminal amino acids of clone 14 (135 kDa), respectively. Erythropoietin has been shown to stimulate an increase in [Ca2+]i through all three isoforms (19). However, TRPC2 is a pseudogene in humans because of the introduction of a number of stop codons (34). TRPC3 and TRPC6 have significant sequence homology and often have similar function; both TRPC3 and TRPC6 are activated by VEGF (36, 37), and promote cardiac hypertrophy (38, 39). However, they also differ in a number of activation pathways. For example, TRPC3 is activated by erythropoietin to increase [Ca2+]i, whereas TRPC6 is not, and TRPC3 expression increases during normal human erythroid progenitor differentiation whereas TRPC6 expression decreases (21).
The Trpc2 gene is strongly expressed in the vomeronasal organ of mice. Trpc2 knockout mice generated independently by two different laboratories confirmed that Trpc2 is important in pheromone signaling in primates. Knockout mice showed a loss of sex discrimination and aggressiveness (40–42). In contrast, Trpc3 knockout mice demonstrated a role for Trpc3 in neuronal function. TRPC3 was required for normal synaptic transmission in cerebellar Purkinje cells, and was critical for motor coordination (43). In addition, knockdown of either Trpc3 or Trpc6 abrogated BDNF-mediated survival and induced cerebellar granule neuron apoptosis, demonstrating that these two channels are important in promoting neuronal survival (44). Heterozygous point mutation of Trpc3 threonine 635 (T635A) resulted in mice with abnormal Purkinje cell development and cerebellar ataxia, the moonwalker mouse (45). Trpc6 knockout mice have defective neutrophil migration in response to specific stimuli (46), as well as increased smooth muscle tone under basal and agonist-stimulated conditions. None of these mice have been reported to have phenotypic abnormalities in response to oxidative stress or cell volume regulation.
Because erythropoietin stimulates an increase in [Ca2+]i through TRPC2 and TRPC3 (17–19, 21), Trpc2 and Trpc3 knockout mice were studied to determine the role of these channels in erythropoiesis. At steady state, although calcium influx was significantly decreased in their erythroblasts in response to erythropoietin, Trpc2, Trpc3, and Trpc2/Trpc3 double knockout mice showed no evidence of anemia and had similar red blood cell counts (RBCs), hemoglobins, reticulocyte counts, and white blood cell counts (WBCs) compared to wild type littermate controls. The major phenotypic abnormality in red cells was that the mean red blood cell corpuscular volume (MCV), mean corpuscular hemoglobin (MCH), and hematocrits were significantly greater and the mean corpuscular hemoglobin concentration (MCHC) was significantly reduced in Trpc2 and Trpc2/Trpc3 double knockout mice. In contrast, hematologic parameters were similar in Trpc3 knockout mice compared to their wild type littermate controls. Murine red blood cells from Trpc2 knockout mice and Trpc2/Trpc3 double knockout mice both showed significant resistance to phenyhydrazine induced hemolysis. Protection of Trpc2 knockout mice from oxidative stress may be related to reduced calcium influx in red cells.
MATERIALS AND METHODS
Experimental Animals
Trpc2 knockout mice, constructed from C57BL/6, were a kind gift of Dr. Catherine Dulac, Harvard University (40). Conditional knockout of Trpc3 was performed using homologous recombination in mouse embryonic stem cells and subsequent blastocyst injection of appropriately targeted ES cells (Xenogen Corporation, Cranbury, New Jersey). The targeting vector contained loxP sequences flanking exon 7 and 8 of Trpc3, encoding the putative cation pore and sixth transmembrane domain (3.3 kb), and immediately 3’ to this, loxP sequences flanking a Neo cassette for positive selection of ES cells (Fig. 1A). The vector was electroporated into ES cells, which were identified by resistance to neomycin and screening with Southern blotting. Correctly targeted ES cell clones were expanded, injected into C57BL/6 blastocysts, and transferred into pseudopregnant females. Mice heterozygous for the Trpc3 conditional knockout were bred in our laboratory to EIIa-Cre mice (47), to create whole animal Trpc3 knockout mice. Progeny were screened for deletion of Trpc3 exons 7 and 8 and the neomycin expression cassette with PCR, and mice heterozygous for deletion of Trpc3 exons 7 and 8 were bred to homozygosity. Trpc2/Trpc3 double knockout mice were generated by breeding Trpc2−/− and Trpc3−/− mice. All experimental procedures and breeding were performed in accordance with the “Guide for the Care and Use of Laboratory Animals” and approved by the Institutional Animal Care and Use Committee at the Pennsylvania State University College of Medicine.
Fig. 1. Identification of Trpc2 and Trpc3 Knockout Mice.

A. Schema of Trpc3 knockout mice generation showing wild type (wt) Trpc3, conditional Trpc3 knockout (KO) with loxP sites, targeted exons 7 and 8, and neomycin gene (Neo), and whole animal knockout (Trpc3 KO) without exon 7 or 8. B. Identification of Trpc3 Knockout Mice. PCR of tail DNA from wt (+/+), Trpc3 heterozygous knockout (+/−), Trpc3 homozygous knockout (−/−), and Trpc2/Trpc3 double knockout (c2−/−c3−/−). A 3.5 Kb band is observed with wt Trpc3 and a 0.4 Kb fragment in the KO with PCR primers described in Materials and Methods. C. Identification of Trpc2 Knockout Mice. PCR of tail DNA from wt (+/+), Trpc2 heterozygous knockout (+/−),Trpc2 homozygous knockout (−/−), and Trpc2/Trpc3 double knockout (c2−/−C3−/−). A 6 Kb band is observed with wt Trpc2 and a 2.3 Kb fragment in the KO.
Identification of Trpc2 and Trpc3 knockout mice by PCR
DNA was prepared from mice tails using Qiagen DNAsy Blood and Tissue Kit. A 3.5 Kb fragment was amplified from the wild type Trpc3 gene and 0.4 Kb fragment was amplified from knockout Trpc3 gene (Fig. 1B) using EmeraldAmp HS PCR mix from TaKaRa and the following primers: forward primer from the murine intron between exons 6 and 7 (ATAAAGGGCTTTGTTGCTGGGTGG), and reverse primer from murine intron between exons 8 and 9 (AGACTCCAACCTTGCACCATTCCA). A 6 Kb fragment was amplified from wild type Trpc2 gene and 2.3 Kb fragment from the knockout Trpc2 gene (Fig. 1C) using EmeraldAmp HS PCR mix from TaKaRa and the following primers: forward primer CCTGTACTTGGCATCCTTTGCACT from mouse exon 6, and reverse primer TTGATGACTCGAAGGCGGTAGGA from mouse exon 12.
Detection of Expression of Trpc2 and Trpc3 in murine splenic erythroblasts using RT-PCR
RNA from murine splenic erythroblasts was prepared using Qiagen RNAsy kit. First strand DNA was prepared using Invitrogen SuperScript First Strand kit and served as the template for amplification using EmeraldAmp HS PCR mix from TaKaRa of either 277 bp fragment for wild type Trpc2 (Fig 2A) or 303 bp fragment for wild type Trpc3 (Fig 2B). No bands were seen in the knockouts. For Trpc2, the following primers were used: forward primer TGGGTCACAGGCTTCCTATGGTTT bridging mouse exon 5 and 6 and reverse primer TGCTGGTGACAGTAAAGAGCACCT from mouse exon 7. For Trpc3, the following primers were used: forward primer ATGCAGGAGGAGAAGACTGCAGAA from mouse exon 6 and reverse primer AATTCCTCCGTCGCTTGGCTCTTA from mouse exon 11.
Fig. 2. Expression of Trpc2 and Trpc3 in Murine Splenic Erythroblasts.

RT-PCR was performed using RNA prepared from splenic erythroblasts of Trpc2 and Trpc3 wild type controls (+/+), knockouts (−/−), and double knockout (Trpc2−/−c3−/−) mice. A. A 277 bp band demonstrates expression of Trpc2. Quality of RNA is demonstrated by RT-PCR of 18S at 536 bp and quality of RT-PCR by absence of bands without the RT step, performed with the same RNA samples. B. A 303 bp band demonstrates expression of Trpc3.
Hematologic Parameters
Phlebotomy was performed on Trpc2, Trpc3, Trpc2/Trpc3 double knockout mice, and wild-type littermate controls aged 8–12 weeks of both sexes via the retro-orbital venous plexus. Blood was collected into heparinized capillary tubes. RBCs, hemoglobin, WBCs, and MCVs were measured directly by the automated Heska CBC-Diff Veterinary Hematology System. Hematocrit (RBC X MCV), MCH (Hgb/RBC) and MCHC (Hgb/Hct X 100) were calculated and reported by the Heska.
Hematocrits after phenylhydrazine treatment were confirmed with the microcentrifuge. % reticulocytes was determined using the BD Unopette System (Becton Dickinson, Franklin Lakes, New Jersey). Significant differences between groups was calculated with the Kruskal-Wallis test.
Phenylhydrazine Treatment of Mice to Induce Hemolysis
Mice at 8 to 12 weeks of age were exposed to hemolytic stress by intraperitoneal injection with phenylhydrazine (60 mg/kg) on days 1 and 2 (48, 49). Hematologic parameters were determined as described above on day 5.
Tissues and cell lines
Human embryonic kidney (HEK) 293T cells were cultured in Dulbecco’s modified Eagle’s medium (DMEM) with 10% fetal calf serum. Splenic erythroblasts were obtained by injecting mice with phenylhydrazine on days 1 and 2 as described above. Mice were sacrificed on day 5 by cervical dislocation, the spleen removed, and a single suspensions of unfractionated cells consisting primarily of splenic erythroblasts prepared as described previously (19). HCD-57 cells, an erythropoietin dependent murine erythroleukemia cell line (gift of Dr. Sandra Ruscetti), were cultured in Iscove’s D-MEM media with 30% fetal calf serum and 0.2 units/ml recombinant erythropoietin (Amgen, Thousand Oaks, CA) (50, 51).
Measurement of [Ca2+]i with Digital Video Imaging
Splenic erythroblasts from male Trpc2, Trpc3, and Trpc2/Trpc3 double knockout mice and their littermate wild-type controls were incubated in Iscove’s modified Dulbecco’s media containing 2% fetal calf serum and 50 μM β-mercaptoethanol for 2 to 4 hours without growth factor. During this period of time, they were adhered to fibronectin-coated glass coverslips and loaded for 20–25 minutes with 5 μM Fura Red AM (excitation, 440 and 490 nm; emission, 600 nm long pass) or 0.1 μM Fura-2 AM (excitation, 360 and 380 nm; emission, 510 nm) (Molecular Probes, Inc, Eugene, OR). Fura Red or Fura-2 loaded cells were visualized with digital video imaging and fluorescence intensity ratio (R) measured (Fura Red F440/F490; Fura-2 F360/F380) (17, 19). Baseline fluorescence intensity ratio (R) and the changes in individual cells after stimulation over a 20 minute interval with PBS, 40 units/ml recombinant erythropoietin (Amgen, Thousand Oaks, CA) or 100 or 500 μM hydrogen peroxide were measured. Mature enucleated erythroblasts were excluded from analysis; most failed to adhere to coverslips or appeared significantly crenated, unlike nucleated cells, which had round cytoplasmic borders and appeared healthy. For cells loaded with Fura Red, [Ca2+]i was calculated as described previously to establish differences in baseline [Ca2+]i between groups (21). Statistical significance of differences between groups was analyzed with one-way analysis of variance.
Transfection of Trpc2,TRPC3, and Gardos into HEK 293T cells
Murine Trpc2 clone 14 (34), murine Trpc2 α (35), and human TRPC3 (hTRPC3) (gifts of Dr. Lutz Birnbaumer) were subcloned into pcDNA 3.1/V5-His TOPO (Invitrogen, Carlsbad, CA). The V5 tag is expressed on the C-terminus of TRPC2 and TRPC3. Murine and human TRPC3 channels are 96% homologous. Murine Gardos channel (mIK1, KCNN4) was subcloned into pEZ-M11 (Flag-tagged) (GeneCopoeia, Rockville, MD). The Flag tag is expressed on the N-terminus of IK1. HEK 293T cells at 50–70% confluency were transfected with vectors using Lipofectamine 2000 (Invitrogen) in accordance with the manufacturers’ recommended protocols. HEK 293T cells were routinely harvested at 24–48 hours after transfection for study.
Immunoblotting, Cell Fractionation, and Immunoprecipitation
For Western blotting, whole cell lysates, membrane fractions, or immunoprecipitates were separated on 8% or 10% polyacrylamide gels, followed by transfer to Hybond-C Extra membranes (Amersham Biosciences, Piscataway, NJ) as previously described (19). Blots were incubated with anti-TRPC2 c14 (18), anti-TRPC3-C (17), anti-V5-HRP (1:10,000; Invitrogen), anti-Flag (1:1000, Sigma, St. Louis, MO), or anti-IK1 (anti-SK4, or anti-Gardos, sc-32949, 1:350, Santa Cruz Biotechnology, Santa Cruz, CA) antibodies. Blots were washed and incubated with the appropriate horseradish peroxidase (HRP)-conjugated antibodies (1:2000). Enhanced chemiluminescence (ECL) was used for detection of signal.
To isolate membrane fractions to enrich endogenous channels, cell fractionation was performed on splenic erythroblasts and HCD-57 cells using the Qiagen Cell Fractionation Kit according to manufacturer’s protocol. Proteins obtained from different cell fractions were concentrated using Pall Life Sciences (Ann Arbor, MI) Nanosep 10K omega centrifugal devices, and western blotting performed by loading equivalent amounts of protein in each lane for each fraction
To examine the interaction of TRPC2 or TRPC3 with the Gardos channel, HEK 293T cells were transfected with Trpc2 clone 14, Trpc2 α, or TRPC3 in pcDNA3.1/V5-His TOPO, with or without Flag-tagged Gardos. Cell lysates prepared as previously described (21) were incubated with preimmune rabbit serum, anti-V5 antibody, or anti-Flag agarose (Sigma) for 2 hours at 4° C. Immunoprecipitates were washed, and sample buffer (2x) was added to pellets with the exception of Flag immunoprecipitates, which were eluted using Flag peptide (Sigma). Samples were heated at 60° C for 30 minutes. Western blots were probed with anti-V5-HRP or anti-Flag antibody and HRP-conjugated secondary antibody, followed by ECL.
Colocalization of TRPC2 and the Gardos Channel in the murine erythroid cell line HCD57
HCD57 cells were plated at 6 x 10⁵on Lab-Tek chamber slides (Nalge Nunc International, Rochester, New York), fixed in methanol, and permeabilized as described previously (19). Cells were blocked in PBS with 5% nonfat milk and stained with primary antibodies (1:50 in PBS with 5% nonfat milk); rabbit anti-mouse TRPC2 clone14 or goat anti-IK1 (anti-SK4, or anti-Gardos, sc-27081, Santa Cruz Biotechnology, Santa Cruz, CA). A limitation of this study is that this anti-IK1 antibody has not been vigorously tested in immunofluorescence localization studies. Slides were washed and labeled with a mixture of Alexa Fluor 488 goat anti-rabbit IgG (Molecular Probes, Eugene, 1:1000) and Cy5 donkey anti-Goat IgG (Molecular Probes, 1:1000). After washing, cells were stained with 4’,6-diamidino-2-phenylindole, and coverslips were mounted using Aqua-Poly/Mount Coverslipping Medium (polysciences, Inc, Warrington, PA). Images were acquired with the Leica TCS SP2 AOBS Confocal Microscope in the Penn State College of Medicine Imaging Core Facility.
RESULTS
Generation of Trpc3 and Trpc2/Trpc3 Double Knockout Mice
TRPC2 and TRPC3 channels are activated by erythropoietin and their expression is modulated during erythroid differentiation (17, 18). To study the function of TRPC3 in erythropoiesis, we generated Trpc3 knockout mice by deletion of amino acids 602–736 in exon 7 and 8, encoding the putative cation pore and the sixth transmembrane domain (Fig. 1A). Trpc2, Trpc3, and Trpc2/Trpc3 double knockout mice were identified with PCR of tail DNA (Fig. 1B, C, respectively). Trpc3 male and female knockout mice had normal general fitness, weight, and longevity up to one year of age (data not shown), when studies were terminated.
To examine channel expression in splenic erythroblasts, mice were injected with phenyhydrazine on days 1 and 2, and spleens harvested on day 5. Morphological examination of unfractionated cells following Wright’s staining confirmed that greater than 90% were erythroid precursors (19, 48, 49). These unfractionated cells are subsequently referred to as erythroblasts. Expression of Trpc2 and Trpc3 in splenic erythroblasts and deletion in erythroblasts from knockout mice was confirmed by RT-PCR (Fig. 2). To examine depletion of Trpc2 and Trpc3 function in knockout mice, splenic erythroblasts were adhered to fibronectin-coated glass coverslips and loaded with Fura Red. F440/F490 was measured at baseline and over 20 minutes after stimulation with 0 or 40 units/ml Epo with digital video imaging. Calculation of baseline [Ca2+]i revealed no differences between the groups, consistent with previous results (19). In contrast, erythroblasts from Trpc2, Trpc3, and Trpc2/Trpc3 double knockout mice had significantly reduced increases in F440/F490 in response to Epo compared to littermate controls (Fig. 3, p<0.001). A modest increase in F440/F490 occurred in knockout mice, suggesting Epo may modulate an increase in [Ca2+]i through additional mechanisms.
Fig. 3. Change in [Ca2+]i in Splenic Erythroblasts from Trpc KO Mice in Response to Erythropoietin.

Splenic erythroblasts from Trpc2 knockout (−/−), Trpc3 knockout (−/−), or Trpc2/Trpc3 double knockout (−/−) male mice and their male littermate controls (+/+) were loaded with Fura Red AM. Fluoresence intensity ratio F440/F490 was measured with DVI before treatment with 40 units/ml erythropoietin and at 2 minute intervals for 20 minutes. Peak % Increase in F440/F490 above baseline (mean + SE % increase ) = peak F440/F490 divided by baseline F440/F490 X 100%, −100% (baseline). Number of individual cells studied were: Trpc2 −/− (PBS 5, Epo 27), Trpc2 +/+ (30), Trpc3 −/− (23), Trpc3 +/+ (13), Trpc2/ Trpc3 −/− (7), Trpc2/ Trpc3 +/+ (6), obtained from at least 2 experiments with each genotype.
** Indicates significantly greater % increase in F440/F490 in wild type littermate control compared to knockout (p<0.001).
MCV and MCH Are Increased and MCHC is Decreased in Trpc2 Knockout Mice
Hematopoiesis was characterized in 8–12 week old Trpc2 and Trpc3 knockout mice. In Trpc2 male and female knockout mice, there was no evidence of anemia, and RBCs, hemoglobins, reticulocyte counts, and WBCs were indistinguishable from normal littermate control animals. The major phenotypic differences observed in Trpc2 knockout mice was that the MCV, MCH, and hematocrits were significantly greater in both male and female knockout mice compared to normal littermates, and the MCHC was significantly decreased (Table 1). In Trpc3 knockout mice, all hematopoietic parameters including MCV, MCH, and MCHC were similar to wild type littermates. Because both TRPC2 and TRPC3 channels can be activated by erythropoietin stimulation, suggesting redundancy of function, Trpc2/Trpc3 double knockout mice were created to examine whether these mice had a more severe erythroid phenotype. These mice also showed no evidence of anemia and RBCs, reticulocyte counts, and WBCs were identical to wild type control mice generated during breeding of the double knockout (Table 2). Hematological parameters were similar to Trpc2 knockout mice; the MCV, MCH, and hematocrits were significantly increased and MCHC was significantly decreased compared to wild type control animals.
Table 1.
Hematologic Values for Trpc2 Knockout and Wild Type Control Mice
| RBC (x106/ul) | Hct (%) | Hgb (g/dl) | Retic (%) | WBC (x103/ul) | MCH (pg/cell) | MCHC (g/dl) | MCV (fl) | n | |
|---|---|---|---|---|---|---|---|---|---|
| Trpc2 Male Mice | |||||||||
| −/− | 9.8±0.1 | 50.3±0.7* | 15.4±0.2 | 2.8±0.2 | 10.6±0.3 | 15.7±0.1* | 30.7±0.1* | 51.3±0.2* | 10 |
| +/+ | 9.7±0.2 | 40.6±0.9 | 14.4±0.2 | 3.4±0.3 | 10.6±0.9 | 14.9±0.1 | 35.7±0.2 | 41.9±0.2 | 6 |
| Trpc2 Female Mice | |||||||||
| −/− | 9.5±0.2 | 51.0±1.4* | 15.1±0.4 | 3.4±0.6 | 8.5±0.4 | 16.0±0.1* | 29.8±0.1* | 53.7±0.5* | 12 |
| +/+ | 9.4±0.2 | 39.6±0.7 | 14.2±0.2 | 3.1±0.3 | 8.3±0.6 | 15.0±0.1 | 35.8±0.1 | 41.8±0.3 | 6 |
Trpc2 knockout (−/−) mice and wild type littermates (+/+) were studied at 8–12 weeks of age. Red cell count (RBC), hemoglobin (Hgb), white cell count (WBC), and mean corpuscular volume (MCV) were measured directly by the automated Heska CBC-Diff Veterinary Hematology System. % reticulocytes (retics) was determined as described in experimental procedures. Hematocrit (Hct, RBC X MCV), MCH (Hgb/RBC) and MCHC (Hgb/Hct X 100) are values calculated by the Heska. n = the number of mice studied in each group.
Significantly different from wild-type littermate mice (p<0.05) calculated with the Kruskal-Wallis test.
Table 2.
Hematologic Values for Trpc2/Trpc3 Double Knockout and Wild Type Control Mice
| RBC (x106/ul) | Hct (%) | Hgb (g/dl) | Retic (%) | WBC (x103/ul) | MCH (pg/cell) | MCHC (g/dl) | MCV (fl) | n | |
|---|---|---|---|---|---|---|---|---|---|
| Trpc2/c3 Male Mice | |||||||||
| −/− | 9.9±0.1 | 51.7±0.6* 15.4±0.2* | 2.6±0.2 | 10.2±0.5 | 15.4±0.1* | 29.7±0.1* | 52.0±0.3* | 26 | |
| +/+ | 9.6±0.1 | 40.9±0.7 | 14.2±0.2 | 1.9±0.1 | 8.9±0.3 | 14.8±0.1 | 34.8±0.1 | 42.4±0.2 | 19 |
| Trpc2/c3 Female Mice | |||||||||
| −/− | 9.6±0.2 | 52.9±1.5* 15.5±0.2 | 2.6±0.2 | 8.4±0.3 | 16.1±0.1* | 30.4±0.2* 52.8±0.3* | 11 | ||
| +/+ | 9.8±0.1 | 41.4±0.9 | 15.0±0.2 | 2.6±0.2 | 7.9±0.5 | 15.3±0.1 | 36.4±0.1 | 42.1±0.2 | 12 |
Trpc2/c3 double knockout (−/−) mice and wild type littermate controls (+/+) were studied at 8–12 weeks of age. Red cell count (RBC), hemoglobin (Hgb), white cell count, (WBC), and mean corpuscular volume (MCV) were measured directly by the automated Heska CBC-Diff Veterinary Hematology System. % reticulocytes (retics) was determined as described in experimental procedures. Hematocrit (Hct, RBC X MCV), MCH (Hgb/RBC) and MCHC (Hgb/Hct X 100) are values calculated by the Heska. n = the number of mice studied in each group.
Significantly different from wild-type mice (p<0.05) calculated with the Kruskal-Wallis test.
Four splice variants of murine Trpc2 have been identified: clone 14 (135 kDa), 17 (120 kDa), α (100 kDa), and β (34, 35). Here, on western blots of splenic erythroblasts from wild type mice, bands at the expected molecular weights of endogenous TRPC2 and TRPC3 channels were not detectable, probably secondary to small quantities of endogenous channels expressed and the sensitivity of available antibodies (Fig. 4). However, in three experiments, western blotting of membrane fractions of splenic erythroblast from Trpc3 knockout mice demonstrated a TRPC2 c14 band at ~135 kDa, and western blotting of membrane fractions of splenic erythroblasts from Trpc2 knockout mice demonstrated a TRPC3 band at ~92 kDa. This suggests a compensatory increase in TRPC2 c14 in the Trpc3 knockout and TRPC3 in the Trpc2 knockout. The Gardos channel (IK1) was expressed equally in membrane fractions from wild type, Trpc2, and Trpc3 knockout mice.
Fig. 4. Compensatory increase in TRPC3 in splenic erythroblasts of Trpc2 knockout mice and of TRPC2 c14 in Trpc3 knockouts.
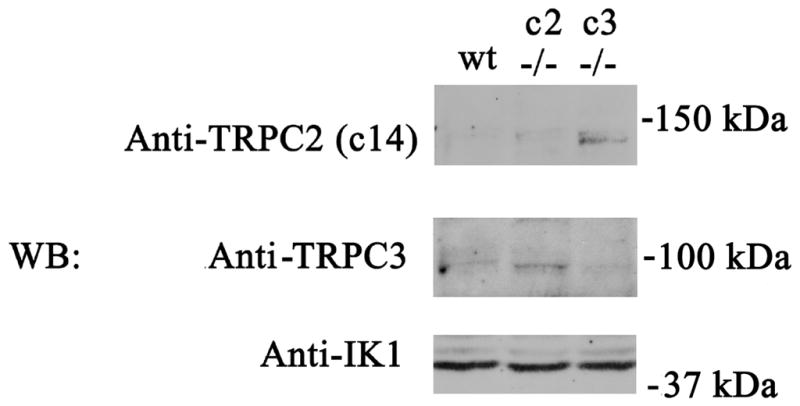
Membrane fractions were prepared from splenic erythroblasts of wild type (wt), Trpc2 knockout (c2 −/−), and Trpc3 knockout (c3 −/−) mice. Blots were probed with anti-TRPC2 c14, anti-TRPC3, or anti-IK1 (Gardos) antibodies. Although endogenous TRPC2 and TRPC3 bands were difficult to detect, TRPC3 was easily detectable in the Trpc2 knockout and TRPC2 c14 in the Trpc3 knockout. The Gardos channel was equally expressed in all groups. A representative result of 3 experiments is shown.
RBC of Trpc2 Knockout Mice are Resistant to Phenylhydrazine-Induced Hemolysis
Erythroid stress was studied in Trpc2, Trpc3, and Trpc2/Trpc3 knockout mice and control wild type mice at 8–12 weeks of age using a well described murine model of phenylhydrazine-induced hemolysis (48, 49). Phenylhydrazine injection is a model of oxidative stress since it results in hydrogen peroxide production in cells and causes hemolytic anemia (49). RBC and hematocrits at day 5 were significantly higher in Trpc2 male and female knockout mice than in their wild type littermate controls (Table 3). The reticulocyte count, a measure of response to anemia, was decreased in Trpc2 knockout mice after phenylhydrazine treatment, although differences from littermate controls reached statistical significance only in female mice. Reduced reticulocytosis is consistent with the higher RBCs and hematocrits observed in these animals, which would result in reduced stimulation of red blood cell production. Trpc3 knockout mice had a similar response to hemolytic stress as wild type littermate controls, and were not protected from oxidative stress-induced hemolysis. Trpc2/Trpc3 double knockout mice had a phenotype similar to Trpc2 knockout mice, with significant resistance to red blood cell hemolysis. RBC and hematocrits of Trpc2 and Trpc2/Trpc3 knockout mice were similar after phenylhydrazine treatment, and were significantly greater than Trpc3 knockout mice of the same sex. Measurement of the spun hematocrit with the microcentrifuge after phenyhydrazine treatment confirmed significant differences in the hematocrits of Trpc2 and Trpc2/Trpc3 knockout mice compared to littermate controls, but not the hematocrits of Trpc3 knockout mice compared to control. These data demonstrate that Trpc2 depletion protects murine red blood cells from oxidative stress-induced hemolysis. There was no evidence of a defect in red cell production in any of these knockout mice.
Table 3.
Hematologic Parameters of Trpc Knockout Mice Treated with Phenylhydrazine
| RBC (x106/ul) | Hct (%) | Retic (%) | n | |
|---|---|---|---|---|
| Trpc2 Male Mice | ||||
| −/− | 6.6±0.2* | 29.4±0.8* | 22.0±2.1 | 10 |
| +/+ | 5.6±0.2 | 23.7±0.5 | 28.2±1.5 | 6 |
| Trpc2 Female Mice | ||||
| −/− | 6.4±0.2* | 29.5±1.1* | 31.5±1.7* | 14 |
| +/+ | 5.4±0.1 | 26.1±0.4 | 40.8±2.4 | 12 |
| Trpc3 Male Mice | ||||
| −/− | 5.1±0.1 | 21.4±1.4 | 40.0±2.7 | 9 |
| +/+ | 5.5±0.2 | 22.6±2.6 | 32.1±2.0 | 12 |
| Trpc3 Female Mice | ||||
| −/− | 5.58±0.13 | 26.9±2.2 | 43.0±1.5 | 9 |
| +/+ | 5.74±0.09 | 26.5±1.1 | 40.3±1.2 | 9 |
| Trpc2/c3 Male Mice | ||||
| c2−/−c3−/− | 6.56±0.14* | 28.7±0.8* | 29.7±1.7 | 12 |
| c2+/+c3+/+ | 5.08±0.09 | 21.7±0.5 | 31.3±2.2 | 12 |
| Trpc2/c3 Female Mice | ||||
| c2−/−c3−/− | 6.08±0.14* | 31.8±0.8* | 31.6±1.6 | 9 |
| c2+/+c3+/+ | 5.38±0.09 | 26.1±0.5 | 40.2±4.2 | 15 |
Trpc2 and Trpc3 knockout mice, Trpc2/Trpc3 double knockout mice and their littermate wild-type controls were injected with phenylhydrazine on day 1 and 2 to induce red cell hemolysis. Hematolologic parameters were determined on day 5. RBC, Hct, and reticulocyte count were quantitated as stated previously. n = number of mice studied in each group.
Significantly different from wild-type control mice (p<0.05) calculated with Kruskal-Wallis test.
Decreased [Ca2+]i in Splenic Erythroblasts from Trpc2 Knockout Mice in Response to Oxidative Stress
To examine the mechanisms through which Trpc2 depletion protects RBC from hemolysis, the change in [Ca2+]i in splenic erythroblasts from Trpc2 and Trpc2/Trpc3 double knockout mice in response to oxidative stress was determined and compared to wild type littermate controls. Change in [Ca2+]i in Fura-2 loaded erythroblasts was quantitated by measurement of the fluorescent intensity ratio F360/F380 with digital video imaging at baseline and at two minute intervals over 20 minutes after treatment with 100 or 500 μM hydrogen peroxide. Erythroblasts of all mice showed a dose-dependent increase in the F360/F380 after treatment with hydrogen peroxide, which was reduced significantly in the Trpc2 and Trpc2/Trpc3 knockouts (Table 4). These data suggest that the reduced rise in [Ca2+]i in response to oxidative stress may play a role in protecting Trpc2 depleted RBC from hemolysis.
Table 4.
[Ca2+]I in Splenic Erythroblasts from Trpc KO Mice in Response to Oxidative Stress
| Peak % Inc in F360/F380 after Treatment
|
||||||
|---|---|---|---|---|---|---|
| H2O2 |
||||||
| PBS | n | 100 uM | n | 500 uM | n | |
| Trpc2 Mice | ||||||
| +/+ | 10.1±4.8% | 10 | 127.8±14.3% | 15 | 189.9±39.5% | 5 |
| KO | 11.9±2.9% | 9 | 82.0±16.4%* | 16 | 110.6±23.3% | 6 |
| Trpc2/c3 Mice | ||||||
| +/+ | 23.8±8.1% | 7 | 117.1±26.2% | 8 | 167.6±4.8% | 4 |
| Double KO | 20.2±5.1% | 7 | 58.3±13.9%* | 9 | 107.4±16.9%* | 6 |
Splenic erythroblasts from Trpc2 knockout (−/−), or Trpc2/Trpc3 double knockout male mice and their male littermate controls were loaded with Fura-2 AM. Fluorescence intensity ratio (F360/F380) of Fura-2 loaded cells was obtained with DVI before treatment with PBS or H2O2 and at 2 minute intervals after treatment for 20 minutes. Peak % Increase in F360/F380 after treatment (mean + SE % increase ) = peak F360/F380 divided by baseline F360/F380 X 100%, −100% (baseline). n=number of individual cells studied from each genotype.
Significant reduction in F360/F380 in knockout compared to control mice (<0.05) determined by ANOVA.
TRPC2 and the Gardos channel coassociate
In red blood cell volume regulation, the Ca2+-activated potassium channel Gardos is a key determinant. As an exploratory approach to study the mechanism of the increased MCV in Trpc2 knockout mice, we examined whether TRPC2 associated with the Gardos channel. The TRP channel TRPV4 previously was shown to associate with aquaporin (52, 53). HEK 293T cells were transfected with V5-tagged Trpc2 c14 (135 kDa isoform) or the Trpc2α (100 kDa) isoform, and Flag-tagged Gardos. Immunoprecipitation was performed on lysates with anti-V5 antibody or anti-Flag M2 affinity gel. Representative results of five experiments are shown in Fig. 5. Preimmune serum did not precipitate TRPC2 or Gardos, showing specificity of results (data not shown). V5-TRPC2 c14 and α coassociated strongly with the Gardos channel following reciprocal immunoprecipitation with anti-V5 or anti-Flag. Two exposures of the anti-Flag immunoprecipitation probed with anti-V5, 10 seconds (Fig. 5A) and 2 minutes (Fig. 5B), are shown to demonstrate the strength of the coassociation. Similarly, two exposures of the anti-V5 immunoprecipitation probed with anti-Flag, 2 minutes (Fig. 5A) and 45 minutes (Fig. 5C), are also shown. This association was significantly greater than that of V5-TRPC3 with Gardos (results not shown). Unfortunately, due to the low quantity of TRP channels typically expressed and the sensitivity of our antibodies, we were not able to examine endogenous interaction of TRPC2 and Gardos with immunoprecipitation. Instead, we examined endogenous colocalization with confocal microscopy using the erythroid cell line HCD-57 (Fig. 6). We first confirmed that TRPC c14 and Gardos are expressed on HCD-57 cells by Western blotting, using membrane fractions and long exposure times (Fig. 6B). Confocal microscopy was then performed. A caveat of this study is that the anti-IK1 antibody has not been vigorously tested in immunofluorescence studies. TRPC2 clone 14 (green) and the Gardos channel (red) showed membrane as well as cytoplasmic localization. Merged images (yellow) confirmed substantial colocalization of endogenous TRPC2 c14 with Gardos in murine RBC.
Fig. 5. Coassociation of TRPC2 with the Gardos Channel.

V5-tagged TRPC2 c14, or TRPC2 α, with or without Flag-tagged Gardos, were expressed in HEK 293T cells as described in Materials and Methods. Reciprocal immunoprecipitation with anti-V5 antibody or anti-Flag agarose was performed and blots probed with anti-V5 and anti-Flag antibodies. A. A representative result of five experiments is shown with lysates, anti-Flag, and anti-V5 immunoprecipitates. Exposure time for western blots probed with anti-V5 antibody was 10 seconds and with anti-Flag antibody was 2 minutes. B. Longer exposure of anti-Flag immunoprecipitate probed with anti-V5 for 2 minutes to demonstrate intensity of interaction. C. Longer exposure of anti-V5 immunoprecipitate probed with anti-Flag for 45 minutes
Fig. 6. Colocalization of TRPC2 with the Gardos Channel in HCD 57 cells.
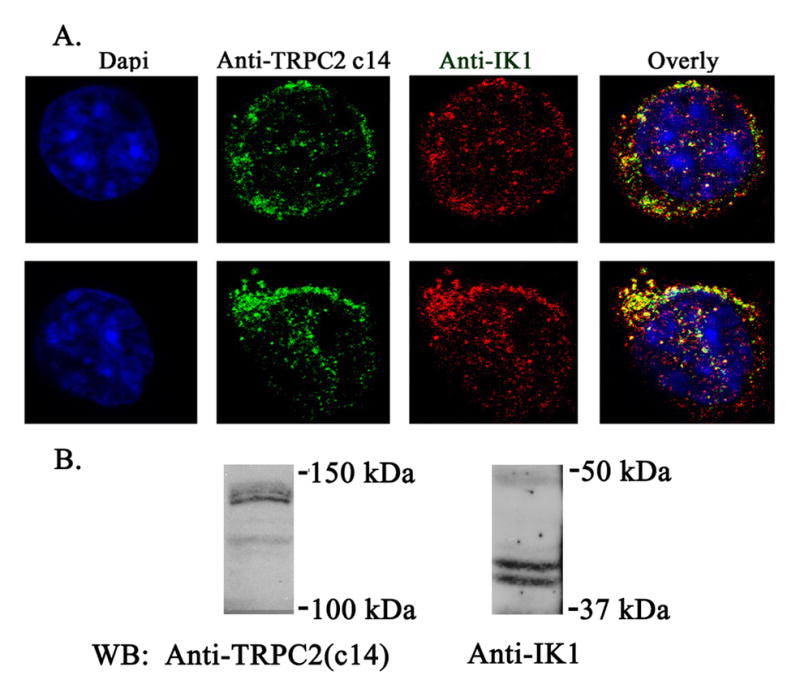
A. Murine erythroleukemia HCD57 cells were stained with primary antibodies goat anti-IK1 (Gardos) antibody and rabbit anti-TRPC2 c14 antibody, followed by anti-goat Cy5 and anti-rabbit Alexa Fluor 488. Nuclei were identified by 4’,6-diamidino-2-phenylindole staining. Representative results of images obtained in the midplane of two cells with confocal microscopy are shown. B. Western blot following membrane fractionation of lysates from HCD-57 cells probed with anti-TRPC2 c14 and anti-IK1.
DISCUSSION
Erythropoietin stimulates an increase in [Ca2+]i through TRPC2 or TRPC3 in cells expressing Epo-R. Modulation of [Ca2+]i is an important signaling pathway controlling erythroid proliferation and differentiation, and the role of these TRP channels in erythropoiesis was explored here in Trpc2 and Trpc3 knockout mice. Trpc2/Trpc3 double knockout mice were generated to detect a phenotype that might be missed in the single knockouts due to redundant function of these channels. TRP channels are involved in a broad range of physiological processes (22–28). They are recognized as unique cellular sensors which respond to a variety of extra- and intracellular signals including mechanical and osmotic stress (54). The first major finding of this report is that although Epo activation of its receptor results in calcium influx through TRPC2 and TRPC3, depletion of Trpc2 and/or Trpc3 does not result in anemia. Lack of erythropoietin-induced calcium influx through TRPC2 or TRPC3 did not significantly impair erythroid production in vivo. However, we could not eliminate the possibility that another channel with redundant function compensated for Trpc2 and Trpc3 depletion. This is particularly true since a small increase in [Ca2+]i was observed in response to erythropoietin in erythroblasts from the Trpc2/Trpc3 double knockout when stimulated with erythropoietin.
The involvement of TRP channels in oxidative stress has been recognized previously (55). The TRP channels which are reported to be activated by oxidative stress include TRPC3 and TRPC4 in aortic endothelial cells, TRPM2, TRPM7, and TRPV1 (55). The second major finding of this report is that Trpc2 depletion protects red cells from phenyhydrazine-induced hemolysis. After exposure to oxidative stress, significantly higher red cell counts and hematocrits were observed in the peripheral blood of Trpc2 and Trpc2/Trpc3 knockout mice compared to littermate controls. This same protection was not detected in Trpc3 knockout mice. The erythroblasts of Trpc2 and double knockout mice had significantly reduced calcium influx after exposure to oxidative stress compared to littermate wild type controls. Elevated calcium can affect RBC in a number of ways, including stimulation of neutral endopeptidase calpain and phospholipid scramblase and inhibition of aminophospholipid translocase, contributing to lipid asymmetry and clearance of RBC from the circulation by macrophages (56). Gardos-mediated red cell shrinkage can further potentiate scramblase activation (57). We speculate that reduced calcium influx through TRPC2 has an important role in protection of RBC from Trpc2 knockout mice from oxidative stress induced hemolysis. A number of red cell disorders are mediated through increased calcium influx (58, 59) and exacerbated by oxidative stress, including thalassemia and sickle cell anemia (60). Sickle red cells are particularly susceptible to oxidative stress induced hemolysis (61, 62). We considered the possibility that Trpc2 depletion might protect red cells from hemolysis associated with thalassemia and sickle cell anemia. Unfortunately, both the mouse β-globin gene and TRPC2 are located on chromosome 7. This would make generation of mice to test this hypothesis with knockout of both β-globin (thalassemia model) and Trpc2, or with transgene expression of human α and sickle-β globins (sickle cell model) and Trpc2 knockout, technically very difficult.
The third finding of this study is that the red cells of Trpc2 and Trpc2/Trpc3 double knockout mice have significantly increased MCV, MCH, and decreased MCHC. Red cells possess a number of systems to regulate their volume including K+Cl− cotransport systems, the anion exchanger 1, and the intermediate conductance Ca2+-activated K+ channel KCNN4, also known as KCa3.1, IKCa1, or the Gardos channel (63). The Gardos channel plays an important role in volume regulation of circulating blood cells including erythrocytes (64, 65), and has been shown to conduct all the K+ permeability associated with water loss in mouse erythrocytes. In fact, ionomycin induced cell shrinkage was nearly eliminated in the Kcnn4 knockout mouse (64), and the red blood cells of Kcnn4 knockout mice are characterized by mild macrocytosis and impaired volume regulation (66). The possibility that TRPC2 mediates its effects on mouse red cell volume through activation of the Ca2+-sensitive K+ channel channel Gardos was explored. TRPC2 was found to associate with the Gardos channel through reciprocal immunoprecipitation and colocalization experiments. Trpc2 may contribute to Gardos channel regulation by influencing the calcium concentration in its immediate microenvironment. We hypothesize that in the red cells of Trpc2 knockout mice, the Ca2+-sensitive K+ channel Gardos cannot be activated by calcium influx through TRPC2, resulting in increased volume of RBC, as observed in the Kcnn4 knockout. In the absence of an increase in calcium, the Gardos channel is not activated and intracellular potassium and water are retained, increasing the MCV and reducing MCHC. Of note, deletion of TRPC1, TRPM7, and TRPV4 has also been associated with cell volume defects (52, 67, 68).
In chronic hypoxia, potassium loss from the sickle red cell is mediated primarily by the Gardos channel. Activation leads to erythrocyte dehydration, increased concentration of intracellular hemoglobin S, accelerated hemoglobin S polymerization, and decreased red cell deformability (69–72). Decreased deformability is directly related to increased MCHC (73). The MCHC is a major contributor to cellular rigidity, and correcting the elevated MCHC can restore normal deformability. Therapies aimed at blocking the Gardos channel and preventing cellular dehydration have promise in the therapy of sickle cell anemia (74). Red blood cells of Trpc2 knockout mice have a significant decrease in MCHC, suggesting a mechanism in addition to oxidative stress though which inhibition of the Trpc2 channel could reduce hemoglobin polymerization and enhance cellular deformability in murine sickle cells.
Acknowledgments
We appreciate the assistance of Tina Brissette in preparation of the manuscript.
SUPPORT
This work was supported by grants from the National Institutes of Health R01 DK46778 (BA Miller) and by the Four Diamonds Fund of the Pennsylvania State University College of Medicine. There are no conflicts in interest with any of the authors.
Footnotes
Publisher's Disclaimer: This is a PDF file of an unedited manuscript that has been accepted for publication. As a service to our customers we are providing this early version of the manuscript. The manuscript will undergo copyediting, typesetting, and review of the resulting proof before it is published in its final citable form. Please note that during the production process errors may be discovered which could affect the content, and all legal disclaimers that apply to the journal pertain.
References
- 1.Lin CS, Lim SK, D'Agati V, Costantini F. Differential effects of an erythropoietin receptor gene disruption on primitive and definitive erythropoiesis. Genes Dev. 1996;10:154–164. doi: 10.1101/gad.10.2.154. [DOI] [PubMed] [Google Scholar]
- 2.Kieran MW, Perkins AC, Orkin SH, Zon LI. Thrombopoietin rescues in vitro erythroid colony formation from mouse embryos lacking the erythropoietin receptor. Proc Natl Acad Sci U S A. 1996;93:9126–9131. doi: 10.1073/pnas.93.17.9126. [DOI] [PMC free article] [PubMed] [Google Scholar]
- 3.Orkin SH, Zon LI. Hematopoiesis: an evolving paradigm for stem cell biology. Cell. 2008;132:631–644. doi: 10.1016/j.cell.2008.01.025. [DOI] [PMC free article] [PubMed] [Google Scholar]
- 4.Mulloy JC, Cancelas JA, Filippi MD, Kalfa TA, Guo F, Zheng Y. Rho GTPases in hematopoiesis and hemopathies. Blood. 2010;115:936–947. doi: 10.1182/blood-2009-09-198127. [DOI] [PMC free article] [PubMed] [Google Scholar]
- 5.Graf T, Enver T. Forcing cells to change lineages. Nature. 2009;462:587–594. doi: 10.1038/nature08533. [DOI] [PubMed] [Google Scholar]
- 6.Sims B, Clarke M, Njah W, Hopkins ES, Sontheimer H. Erythropoietin-induced neuroprotection requires cystine glutamate exchanger activity. Brain Res. 2010;1321:88–95. doi: 10.1016/j.brainres.2010.01.040. [DOI] [PMC free article] [PubMed] [Google Scholar]
- 7.Richmond TD, Chohan M, Barber DL. Turning cells red: signal transduction mediated by erythropoietin. Trends Cell Biol. 2005;15:146–155. doi: 10.1016/j.tcb.2005.01.007. [DOI] [PubMed] [Google Scholar]
- 8.Miller BA, Barber DL, Bell LL, et al. Identification of the erythropoietin receptor domain required for calcium channel activation. J Biol Chem. 1999;274:20465–20472. doi: 10.1074/jbc.274.29.20465. [DOI] [PubMed] [Google Scholar]
- 9.Miller BA, Scaduto RC, Jr, Tillotson DL, Botti JJ, Cheung JY. Erythropoietin stimulates a rise in intracellular free calcium concentration in single early human erythroid precursors. J Clin Invest. 1988;82:309–315. doi: 10.1172/JCI113588. [DOI] [PMC free article] [PubMed] [Google Scholar]
- 10.Miller BA, Cheung JY, Tillotson DL, Hope SM, Scaduto RC., Jr Erythropoietin stimulates a rise in intracellular-free calcium concentration in single BFU-E derived erythroblasts at specific stages of differentiation. Blood. 1989;73:1188–1194. [PubMed] [Google Scholar]
- 11.Misiti J, Spivak JL. Erythropoiesis in vitro. Role of calcium. J Clin Invest. 1979;64:1573–1579. doi: 10.1172/JCI109618. [DOI] [PMC free article] [PubMed] [Google Scholar]
- 12.Gillo B, Ma YS, Marks AR. Calcium influx in induced differentiation of murine erythroleukemia cells. Blood. 1993;81:783–792. [PubMed] [Google Scholar]
- 13.Hensold JO, Dubyak G, Housman DE. Calcium ionophore, A23187, induces commitment to differentiation but inhibits the subsequent expression of erythroid genes in murine erythroleukemia cells. Blood. 1991;77:1362–1370. [PubMed] [Google Scholar]
- 14.Levenson R, Housman D, Cantley L. Amiloride inhibits murine erythroleukemia cell differentiation: evidence for a Ca2+ requirement for commitment. Proc Natl Acad Sci U S A. 1980;77:5948–5952. doi: 10.1073/pnas.77.10.5948. [DOI] [PMC free article] [PubMed] [Google Scholar]
- 15.Cheung JY, Elensky MB, Brauneis U, et al. Ion channels in human erythroblasts. Modulation by erythropoietin. J Clin Invest. 1992;90:1850–1856. doi: 10.1172/JCI116061. [DOI] [PMC free article] [PubMed] [Google Scholar]
- 16.Cheung JY, Zhang XQ, Bokvist K, Tillotson DL, Miller BA. Modulation of calcium channels in human erythroblasts by erythropoietin. Blood. 1997;89:92–100. [PubMed] [Google Scholar]
- 17.Tong Q, Hirschler-Laszkiewicz I, Zhang W, et al. TRPC3 is the erythropoietin-regulated calcium channel in human erythroid cells. J Biol Chem. 2008;283:10385–10395. doi: 10.1074/jbc.M710231200. [DOI] [PMC free article] [PubMed] [Google Scholar]
- 18.Chu X, Cheung JY, Barber DL, et al. Erythropoietin modulates calcium influx through TRPC2. J Biol Chem. 2002;277:34375–34382. doi: 10.1074/jbc.M205541200. [DOI] [PubMed] [Google Scholar]
- 19.Chu X, Tong Q, Cheung JY, et al. Interaction of TRPC2 and TRPC6 in erythropoietin modulation of calcium influx. J Biol Chem. 2004;279:10514–10522. doi: 10.1074/jbc.M308478200. [DOI] [PubMed] [Google Scholar]
- 20.Tong Q, Chu X, Cheung JY, et al. Erythropoietin-modulated calcium influx through TRPC2 is mediated by phospholipase Cgamma and IP3R. Am J Physiol Cell Physiol. 2004;287:C1667–1678. doi: 10.1152/ajpcell.00265.2004. [DOI] [PubMed] [Google Scholar]
- 21.Hirschler-Laszkiewicz I, Tong Q, Conrad K, et al. TRPC3 activation by erythropoietin is modulated by TRPC6. J Biol Chem. 2009;284:4567–4581. doi: 10.1074/jbc.M804734200. [DOI] [PMC free article] [PubMed] [Google Scholar]
- 22.Clapham DE. TRP channels as cellular sensors. Nature. 2003;426:517–524. doi: 10.1038/nature02196. [DOI] [PubMed] [Google Scholar]
- 23.Sharif-Naeini R, Folgering JH, Bichet D, et al. Sensing pressure in the cardiovascular system: Gq-coupled mechanoreceptors and TRP channels. J Mol Cell Cardiol. 2010;48:83–89. doi: 10.1016/j.yjmcc.2009.03.020. [DOI] [PubMed] [Google Scholar]
- 24.Ribelayga C. Vertebrate vision: TRP channels in the spotlight. Curr Biol. 2010;20:R278–280. doi: 10.1016/j.cub.2010.02.012. [DOI] [PMC free article] [PubMed] [Google Scholar]
- 25.Miller BA. The role of TRP channels in oxidative stress-induced cell death. J Membr Biol. 2006;209:31–41. doi: 10.1007/s00232-005-0839-3. [DOI] [PubMed] [Google Scholar]
- 26.Dong XP, Wang X, Xu H. TRP channels of intracellular membranes. J Neurochem. 2010;113:313–328. doi: 10.1111/j.1471-4159.2010.06626.x. [DOI] [PMC free article] [PubMed] [Google Scholar]
- 27.Di A, Malik AB. TRP channels and the control of vascular function. Curr Opin Pharmacol. 2010;10:127–132. doi: 10.1016/j.coph.2009.11.010. [DOI] [PubMed] [Google Scholar]
- 28.Birnbaumer L. The TRPC class of ion channels: a critical review of their roles in slow, sustained increases in intracellular Ca(2+) concentrations. Annu Rev Pharmacol Toxicol. 2009;49:395–426. doi: 10.1146/annurev.pharmtox.48.113006.094928. [DOI] [PubMed] [Google Scholar]
- 29.Montell C. The TRP superfamily of cation channels. Sci STKE. 2005;2005:re3. doi: 10.1126/stke.2722005re3. [DOI] [PubMed] [Google Scholar]
- 30.Venkatachalam K, Montell C. TRP channels. Annu Rev Biochem. 2007;76:387–417. doi: 10.1146/annurev.biochem.75.103004.142819. [DOI] [PMC free article] [PubMed] [Google Scholar]
- 31.Hofmann T, Schaefer M, Schultz G, Gudermann T. Subunit composition of mammalian transient receptor potential channels in living cells. Proc Natl Acad Sci U S A. 2002;99:7461–7466. doi: 10.1073/pnas.102596199. [DOI] [PMC free article] [PubMed] [Google Scholar]
- 32.Goel M, Sinkins WG, Schilling WP. Selective association of TRPC channel subunits in rat brain synaptosomes. J Biol Chem. 2002;277:48303–48310. doi: 10.1074/jbc.M207882200. [DOI] [PubMed] [Google Scholar]
- 33.Woodard GE, Lopez JJ, Jardin I, Salido GM, Rosado JA. TRPC3 regulates agonist-stimulated Ca2+ mobilization by mediating the interaction between type I inositol 1,4,5-trisphosphate receptor, RACK1, and Orai1. J Biol Chem. 2010;285:8045–8053. doi: 10.1074/jbc.M109.033605. [DOI] [PMC free article] [PubMed] [Google Scholar]
- 34.Vannier B, Peyton M, Boulay G, et al. Mouse trp2, the homologue of the human trpc2 pseudogene, encodes mTrp2, a store depletion-activated capacitative Ca2+ entry channel. Proc Natl Acad Sci U S A. 1999;96:2060–2064. doi: 10.1073/pnas.96.5.2060. [DOI] [PMC free article] [PubMed] [Google Scholar]
- 35.Hofmann T, Schaefer M, Schultz G, Gudermann T. Cloning, expression and subcellular localization of two novel splice variants of mouse transient receptor potential channel 2. J Biochem. 2000;351:115–122. doi: 10.1042/0264-6021:3510115. [DOI] [PMC free article] [PubMed] [Google Scholar]
- 36.Poteser M, Graziani A, Eder P, et al. Identification of a rare subset of adipose tissue-resident progenitor cells, which express CD133 and TRPC3 as a VEGF-regulated Ca2+ entry channel. FEBS Lett. 2008;582:2696–2702. doi: 10.1016/j.febslet.2008.06.049. [DOI] [PubMed] [Google Scholar]
- 37.Ge R, Tai Y, Sun Y, et al. Critical role of TRPC6 channels in VEGF-mediated angiogenesis. Cancer Lett. 2009;283:43–51. doi: 10.1016/j.canlet.2009.03.023. [DOI] [PubMed] [Google Scholar]
- 38.Wu X, Eder P, Chang B, Molkentin JD. TRPC channels are necessary mediators of pathologic cardiac hypertrophy. Proc Natl Acad Sci U S A. 2010;107:7000–7005. doi: 10.1073/pnas.1001825107. [DOI] [PMC free article] [PubMed] [Google Scholar]
- 39.Onohara N, Nishida M, Inoue R, et al. TRPC3 and TRPC6 are essential for angiotensin II-induced cardiac hypertrophy. Embo J. 2006;25:5305–5316. doi: 10.1038/sj.emboj.7601417. [DOI] [PMC free article] [PubMed] [Google Scholar]
- 40.Stowers L, Holy TE, Meister M, Dulac C, Koentges G. Loss of sex discrimination and male-male aggression in mice deficient for TRP2. Science. 2002;295:1493–1500. doi: 10.1126/science.1069259. [DOI] [PubMed] [Google Scholar]
- 41.Leypold BG, Yu CR, Leinders-Zufall T, Kim MM, Zufall F, Axel R. Altered sexual and social behaviors in trp2 mutant mice. Proc Natl Acad Sci U S A. 2002;99:6376–6381. doi: 10.1073/pnas.082127599. [DOI] [PMC free article] [PubMed] [Google Scholar]
- 42.Hasen NS, Gammie SC. Trpc2 gene impacts on maternal aggression, accessory olfactory bulb anatomy and brain activity. Genes Brain Behav. 2009;8:639–649. doi: 10.1111/j.1601-183X.2009.00511.x. [DOI] [PMC free article] [PubMed] [Google Scholar]
- 43.Hartmann J, Dragicevic E, Adelsberger H, et al. TRPC3 channels are required for synaptic transmission and motor coordination. Neuron. 2008;59:392–398. doi: 10.1016/j.neuron.2008.06.009. [DOI] [PMC free article] [PubMed] [Google Scholar]
- 44.Jia Y, Zhou J, Tai Y, Wang Y. TRPC channels promote cerebellar granule neuron survival. Nat Neurosci. 2007;10:559–567. doi: 10.1038/nn1870. [DOI] [PubMed] [Google Scholar]
- 45.Trebak M. The puzzling role of TRPC3 channels in motor coordination. Pflugers Arch. 2010;459:369–375. doi: 10.1007/s00424-009-0740-5. [DOI] [PMC free article] [PubMed] [Google Scholar]
- 46.Damann N, Owsianik G, Li S, Poll C, Nilius B. The calcium-conducting ion channel transient receptor potential canonical 6 is involved in macrophage inflammatory protein-2-induced migration of mouse neutrophils. Acta Physiol (Oxf) 2009;195:3–11. doi: 10.1111/j.1748-1716.2008.01918.x. [DOI] [PubMed] [Google Scholar]
- 47.Lakso M, Pichel JG, Gorman JR, et al. Efficient in vivo manipulation of mouse genomic sequences at the zygote stage. Proc Natl Acad Sci U S A. 1996;93:5860–5865. doi: 10.1073/pnas.93.12.5860. [DOI] [PMC free article] [PubMed] [Google Scholar]
- 48.Krystal G. A simple microassay for erythropoietin based on 3H-thymidine incorporation into spleen cells from phenylhydrazine treated mice. Exp Hematol. 1983;11:649–660. [PubMed] [Google Scholar]
- 49.Hodges VM, Winter PC, Lappin TR. Erythroblasts from friend virus infected- and phenylhydrazine-treated mice accurately model erythroid differentiation. Br J Haematol. 1999;106:325–334. doi: 10.1046/j.1365-2141.1999.01535.x. [DOI] [PubMed] [Google Scholar]
- 50.Ruscetti SK, Janesch NJ, Chakraborti A, Sawyer ST, Hankins WD. Friend spleen focus-forming virus induces factor independence in an erythropoietin-dependent erythroleukemia cell line. J Virol. 1990;64:1057–1062. doi: 10.1128/jvi.64.3.1057-1062.1990. [DOI] [PMC free article] [PubMed] [Google Scholar]
- 51.Sawyer ST, Hankins WD. The functional form of the erythropoietin receptor is a 78-kDa protein: correlation with cell surface expression, endocytosis, and phosphorylation. Proc Natl Acad Sci U S A. 1993;90:6849–6853. doi: 10.1073/pnas.90.14.6849. [DOI] [PMC free article] [PubMed] [Google Scholar]
- 52.Becker D, Blase C, Bereiter-Hahn J, Jendrach M. TRPV4 exhibits a functional role in cell-volume regulation. J Cell Sci. 2005;118:2435–2440. doi: 10.1242/jcs.02372. [DOI] [PubMed] [Google Scholar]
- 53.Liu X, Bandyopadhyay BC, Nakamoto T, et al. A role for AQP5 in activation of TRPV4 by hypotonicity: concerted involvement of AQP5 and TRPV4 in regulation of cell volume recovery. J Biol Chem. 2006;281:15485–15495. doi: 10.1074/jbc.M600549200. [DOI] [PubMed] [Google Scholar]
- 54.Pedersen SF, Nilius B. Transient receptor potential channels in mechanosensing and cell volume regulation. Methods Enzymol. 2007;428:183–207. doi: 10.1016/S0076-6879(07)28010-3. [DOI] [PubMed] [Google Scholar]
- 55.Miller BA, Zhang W. TRP Channels as Mediators of Oxidative Stress. Adv Exp Med Biol. 2011;704:531–544. doi: 10.1007/978-94-007-0265-3_29. [DOI] [PubMed] [Google Scholar]
- 56.Foller M, Bobbala D, Koka S, et al. Functional significance of the intermediate conductance Ca2+-activated K+ channel for the short-term survival of injured erythrocytes. Pflugers Arch. 2010;460:1029–1044. doi: 10.1007/s00424-010-0878-1. [DOI] [PubMed] [Google Scholar]
- 57.Lang KS, Myssina S, Brand V, et al. Involvement of ceramide in hyperosmotic shock-induced death of erythrocytes. Cell Death Differ. 2004;11:231–243. doi: 10.1038/sj.cdd.4401311. [DOI] [PubMed] [Google Scholar]
- 58.Foller M, Huber SM, Lang F. Erythrocyte programmed cell death. IUBMB Life. 2008;60:661–668. doi: 10.1002/iub.106. [DOI] [PubMed] [Google Scholar]
- 59.Lang KS, Duranton C, Poehlmann H, et al. Cation channels trigger apoptotic death of erythrocytes. Cell Death Differ. 2003;10:249–256. doi: 10.1038/sj.cdd.4401144. [DOI] [PubMed] [Google Scholar]
- 60.Sangokoya C, Telen MJ, Chi JT. microRNA miR-144 modulates oxidative stress tolerance and associates with anemia severity in sickle cell disease. Blood. 116:4338–4348. doi: 10.1182/blood-2009-04-214817. [DOI] [PMC free article] [PubMed] [Google Scholar]
- 61.Steinberg MH, Brugnara C. Pathophysiological-based approaches to treatment of sickle cell disease. Annu Rev Med. 2003;54:89–112. doi: 10.1146/annurev.med.54.101601.152439. [DOI] [PubMed] [Google Scholar]
- 62.Amer J, Ghoti H, Rachmilewitz E, Koren A, Levin C, Fibach E. Red blood cells, platelets and polymorphonuclear neutrophils of patients with sickle cell disease exhibit oxidative stress that can be ameliorated by antioxidants. Br J Haematol. 2006;132:108–113. doi: 10.1111/j.1365-2141.2005.05834.x. [DOI] [PubMed] [Google Scholar]
- 63.Wei AD, Gutman GA, Aldrich R, Chandy KG, Grissmer S, Wulff H. International Union of Pharmacology. LII. Nomenclature and molecular relationships of calcium-activated potassium channels. Pharmacol Rev. 2005;57:463–472. doi: 10.1124/pr.57.4.9. [DOI] [PubMed] [Google Scholar]
- 64.Begenisich T, Nakamoto T, Ovitt CE, et al. Physiological roles of the intermediate conductance, Ca2+-activated potassium channel Kcnn4. J Biol Chem. 2004;279:47681–47687. doi: 10.1074/jbc.M409627200. [DOI] [PubMed] [Google Scholar]
- 65.Vandorpe DH, Shmukler BE, Jiang L, et al. cDNA cloning and functional characterization of the mouse Ca2+-gated K+ channel, mIK1. Roles in regulatory volume decrease and erythroid differentiation. J Biol Chem. 1998;273:21542–21553. doi: 10.1074/jbc.273.34.21542. [DOI] [PubMed] [Google Scholar]
- 66.Grgic I, Kaistha BP, Paschen S, et al. Disruption of the Gardos channel (KCa3.1) in mice causes subtle erythrocyte macrocytosis and progressive splenomegaly. Pflugers Arch. 2009;458:291–302. doi: 10.1007/s00424-008-0619-x. [DOI] [PubMed] [Google Scholar]
- 67.Chen J, Barritt GJ. Evidence that TRPC1 (transient receptor potential canonical 1) forms a Ca(2+)-permeable channel linked to the regulation of cell volume in liver cells obtained using small interfering RNA targeted against TRPC1. Biochem J. 2003;373:327–336. doi: 10.1042/BJ20021904. [DOI] [PMC free article] [PubMed] [Google Scholar]
- 68.Numata T, Shimizu T, Okada Y. TRPM7 is a stretch- and swelling-activated cation channel involved in volume regulation in human epithelial cells. Am J Physiol Cell Physiol. 2007;292:C460–C467. doi: 10.1152/ajpcell.00367.2006. [DOI] [PubMed] [Google Scholar]
- 69.Brugnara C, de Franceschi L, Alper SL. Inhibition of Ca(2+)-dependent K+ transport and cell dehydration in sickle erythrocytes by clotrimazole and other imidazole derivatives. J Clin Invest. 1993;92:520–526. doi: 10.1172/JCI116597. [DOI] [PMC free article] [PubMed] [Google Scholar]
- 70.Brugnara C, Gee B, Armsby CC, et al. Therapy with oral clotrimazole induces inhibition of the Gardos channel and reduction of erythrocyte dehydration in patients with sickle cell disease. J Clin Invest. 1996;97:1227–1234. doi: 10.1172/JCI118537. [DOI] [PMC free article] [PubMed] [Google Scholar]
- 71.Mozzarelli A, Hofrichter J, Eaton WA. Delay time of hemoglobin S polymerization prevents most cells from sickling in vivo. Science. 1987;237:500–506. doi: 10.1126/science.3603036. [DOI] [PubMed] [Google Scholar]
- 72.Hoffman JF, Joiner W, Nehrke K, Potapova O, Foye K, Wickrema A. The hSK4 (KCNN4) isoform is the Ca2+-activated K+ channel (Gardos channel) in human red blood cells. Proc Natl Acad Sci U S A. 2003;100:7366–7371. doi: 10.1073/pnas.1232342100. [DOI] [PMC free article] [PubMed] [Google Scholar]
- 73.Clark MR, Mohandas N, Shohet SB. Deformability of oxygenated irreversibly sickled cells. J Clin Invest. 1980;65:189–196. doi: 10.1172/JCI109650. [DOI] [PMC free article] [PubMed] [Google Scholar]
- 74.Ataga KI, Smith WR, De Castro LM, et al. Efficacy and safety of the Gardos channel blocker, senicapoc (ICA-17043), in patients with sickle cell anemia. Blood. 2008;111:3991–3997. doi: 10.1182/blood-2007-08-110098. [DOI] [PubMed] [Google Scholar]