Abstract
Photopolymerizable phospholipid DC8,9PC (1,2-bis-(tricosa-10,12-diynoyl)-sn-glycero-3-phosphocholine) exhibits unique assembly characteristics in the lipid bilayer. Due to the presence of the diacetylene groups, DC8,9PC undergoes polymerization upon UV (254 nm) exposure and assumes chromogenic properties. DC8,9PC photopolymerization in a gel phase matrix lipid 1,2-dipalmitoyl-sn-glycero-3-phosphocholine (DPPC) monitored by UV-VIS absorption spectroscopy occurred within 2 minutes after UV treatment, whereas no spectral shifts were observed when DC8,9PC was incorporated in a liquid phase matrix 1-palmitoyl-2-oleoyl-sn-glycero-3-phosphocholine (POPC). Liquid chromatography-tandem mass spectrometry analysis showed a decrease in DC8,9PC monomer in both DPPC and POPC environments without any change in matrix lipids in UV-treated samples. Molecular Dynamics (MD) simulations of DPPC/DC8,9PC and POPC/DC8,9PC bilayers indicate that the DC8,9PC molecules adjust to the thickness of the matrix lipid bilayer. Furthermore, motions of DC8,9PC in the gel phase bilayer are more restricted than in the fluid bilayer. The restricted motional flexibility of DC8,9PC (in the gel phase) enables the reactive diacetylenes in individual molecules to align and undergo polymerization, whereas the unrestricted motions in the fluid bilayer restrict polymerization due to the lack of appropriate alignment of the DC8,9PC fatty acyl chains. Fluorescence microscopy data indicates homogenous distribution of the lipid probe 1,2-dioleoyl-sn-glycero-3-phosphoethanolamine-N-lissamine rhodamine B sulfonyl ammonium salt (N-Rh-PE) in POPC/DC8,9PC monolayers, but domain formation in DPPC/DC8,9PC monolayers. These results show that the DC8,9PC molecules cluster and assume the preferred conformation in the gel phase matrix for UV-triggered polymerization reaction.
Keywords: polymerizable lipids, lipid packing, triggered drug release, diacetylene phospholipids, light-sensitive liposomes, lipid modification, phase separation
INTRODUCTION
Novel imaging techniques have revealed nanoscale segregated regions of structure, function, and composition (nanodomains) in biological membranes.1,2 Certain membrane functions (e.g. fusion, signaling, and permeability) are known to be strictly dependent on the particular nano-environment in which these processes take place.3 Lipid monolayers, multilayers, and/or liposomes have frequently been used as simple model membranes to gain insight into complex molecular assemblies and nano-domain formation.4 Although the physical properties of membrane domains and phases in such systems have been probed using a variety of techniques (e.g., X-ray diffraction, Nuclear magnetic resonance (NMR), Differential scanning calorimetry (DSC), fluorescence), fewer studies have been reported on the nature of biochemical reactions in these environments. Photopolymerizable diacetylenic lipids present a unique opportunity to examine chemical reactivity in a particular membrane environment5–10 due to their unique self-assembly characteristics.
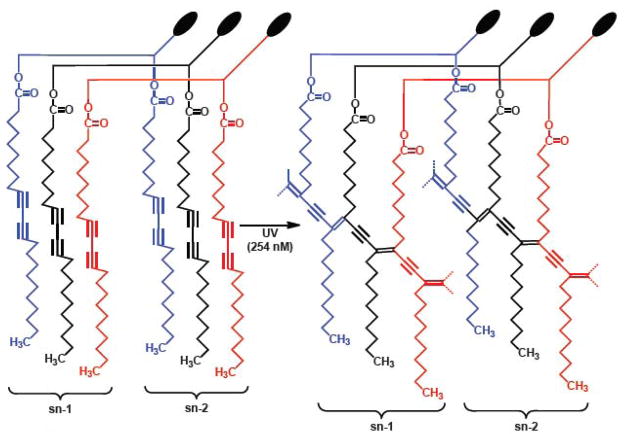
In our previous work we monitored the chemical reactivity of DC8,9PC whose highly reactive diacetylenic groups undergo UV-triggered photo-crosslinking resulting in polymerization (Figure 1).11 Our initial studies were focused on the evaluation of phospholipid composition(s) that potentially support light-triggered solute release from liposomes (containing DC8,9PC) without compromising their stability. We found that the polymerization reaction proceeded efficiently when DC8,9PC was embedded in DPPC, at room temperature, which is in the gel phase at that temperature. In contrast, polymerization reaction was not observed when DC8,9PC was embedded in Egg PC, which is in the liquid phase at room temperature. This study is designed to understand the mechanism of DC8,9PC reactivity at 254 nm in the gel and liquid phase lipid environments. For the fluid environment we have used a pure lipid, POPC, which is a major component of Egg PC and has similar chain melting characteristics. Using the same lipid compositions we examined the outcome of the UV irradiation at 254 nm on DC8,9PC reactivity. We show by liquid chromatography-tandem mass spectrometry analysis a significant decrease in DC8,9PC monomer in both DPPC and POPC environments following UV triggering, although no spectral changes indicative of propagating polymerization were observed in POPC. We gained more detailed information on the motional flexibility in the two environments by performing atomistic molecular dynamics simulations on these lipid mixtures. We show that DC8,9PC assumes conformations in the gel phase, which enables the reactive diacetylenes in individual molecules to align and undergo polymerization. We further investigated the thermodynamic properties of these mixtures using a monolayer system and show that in DPPC the DC8,9PC molecules are phase-separated, which is necessary for propagating polymerization. These results taken together indicate that the motional freedom or restriction of DC8,9PC fatty acyl chains in the nano-environment of the lipid bilayer determines its reactivity within the membrane.
Figure 1.
A cartoon depicting packing of DC8,9PC in the lipid bilayer. Three monomers (red, blue and black) are shown in the figure (Left). UV (254 nm)-triggered intermolecular photo-crosslinking results in polymerization of DC8,9PC (Right). The cartoon also shown that photo-crosslinking reaction occurs between the sn-1 or the sn-2 fatty acyl chain of the three monomers respectively. Alignment of adjacent DC8,9PC acyl chains that leads to UV-induced Polymerization.
MATERIALS AND METHODS
Materials
The phospholipids, DC8,9PC: (1,2 bis (tricosa-10, 12-diynoyl)-sn-glycero-3-phosphocholine), DPPC (16:0 PC, 1,2-dipalmitoyl-sn-glycero-3-phosphocholine) and POPC (16:0–18:1 PC, 1-palmitoyl-2-oleoyl-sn-glycero-3-phosphocholine) were purchased from Avanti Polar Lipids, Inc. (Alabaster, AL.). The fluorescent lipid N-Rh-PE (1,2-dioleoyl-sn-glycero-3-phosphoethanolamine-N-(lissamine rhodamine B sulfonyl) (ammonium salt) was also from Avanti Polar Lipids, Inc., Alabaster, AL. All other reagents and buffers were of reagent grade.
Preparation of Liposomes
A lipid film was formed by removing the solvent under nitrogen and any residual chloroform was removed by placing the films overnight in a vacuum desiccator. Multilamellar vesicles (MLVs) were formed by reconstituting the lipid film with HBS buffer (10 mM HEPES, 150 mM NaCl, pH 7.5) by vigorous vortexing. Liposomes were formed by sonication at 4 °C (10 min with 1 min pulses and 1 min rest) using a Probe Sonicator (W-375 Heat Systems-Ultrasonics, New York, USA). Sonicated samples were centrifuged at 2000×g for (10 min) to remove any titanium particles and larger aggregates. For further analysis, lipids were extracted from the aqueous dispersions according to Bligh and Dyer protocol.12 and solvents were removed.
DC8,9PC Polymerization
Liposomes placed in a 96-well plate were irradiated with a UV lamp (UVP, SHORT WAVE ASSEMLY 115 V, 60 Hz - 254 nm) at a distance of 1 inch at desired temperatures for 0–45 min.11 Chromogenic properties of DC8,9PC were detected by monitoring increase in absorbance (510 nm) (SpectraMax M2, Molecular Devices, Sunnyvale CA, USA). To monitor spectral shifts, the samples were diluted with 9 volumes of PBS and absorption spectra were recorded in a spectrophotometer using quartz cuvettes (DU-350 Beckman Coulter, Fullerton, CA, USA).
Liquid Chromatography-tandem Mass Spectrometry Analysis
Liquid chromatography-tandem mass spectrometry (LC-MS/MS) analysis was performed using a TSQ Discovery triple quadrupole mass spectrometer (Thermo Scientific, San Jose, CA, USA) coupled to a Shimadzu UFLC XR HPLC (Shimadzu, Columbia, MD). Reversed phase chromatography was performed using a 5 cm × 1.0 mm × 5 μm Discovery C18 column (Supelco, Bellefonte, PA) operating at a flow rate of 100 μl/min and maintained at 37 °C. Mobile phases A and B consisted of 10 mM HCOONH4 in 74:25:1 (v/v/v) H2O)/CH3OH/HCOOH and 10 mM HCOONH4 in 99:1 (v/v) CH3OH:HCOOH, respectively. For LC-MS/MS analysis 10 μL of each sample, diluted 500 or 5000-fold in buffers A and B, was injected onto the column. After sample injection the initial 0% B gradient was held for 5 min, and increased to 18% B in 1.5 min was and held for 2.5 min. The organic gradient was increased to 65% B in 0.5 min and held for 3.5 min, followed by an increase to 98% B over 5 min, which was maintained for 3.5 min. The gradient was brought to initial conditions in 0.5 min and held there for 8 min, for a total run time of 30 min.
Electrospray ionization source conditions were optimized using a mixture containing 1 μg/mL of DPPC, POPC, and DC8,9PC. The source parameters were as follows: ionization mode, positive; sheath gas pressure, 5 psi; ion sweep gas pressure, 0; auxiliary gas pressure, 0; ion spray needle voltage, 4,000 V; capillary temperature, 270 °C; skimmer offset, −7 V. Collision induce dissociation was performed using nitrogen gas within Q2, offset from Q1 by 10 V. For single reaction monitoring (SRM) the following parent ions were measured: m/z 734.57, 760.52, and 914.67 corresponding to [M+H]+ ions of DPPC, POPC, and DC8,9PC, respectively. The measured product ion was m/z 183.95 for all three molecules. The acquisition parameters used were: scan width (m/z) 0.10; scan time, 0.400 sec for each transition; peak width (FWHM) 0.70 for both Q1 and Q3; collision pressure 1.5 mTorr, and skimmer offset at −7 V. Data acquisition and analysis were accomplished using Xcalibur software v.2.0.5 (Thermo Scientific).
Calibration plots were obtained by analzying individual DPPC, POPC, and DC8,9PC reference standard samples at ten different concentrations ranging from 1 to 10000 ng/mL. Calibration curves were found to be linear with correlation coefficients ranging from 0.9945 to 0.9958.
Computational Analysis
The lipid bilayers containing DPPC, POPC, and DC8,9PC were simulated using an explicit all-atom lipid simulations. The CHARMM program13 using the revised CHARMM27 (C27r) force field for lipids14 and the modified TIP3P water model15 were used to construct the set of starting points and to relax the systems to a production-ready stage. For production runs, the NAMD code16 on a Biowulf cluster (http://biowulf.nih.gov) at the NIH was used for the starting point with the same CHARMM27 force field.
Two different phases, gel and liquid phases of lipid bilayers are considered for the simulations. In each phase, a homogeneous (or pure) lipid bilayer containing a single type of lipid molecule, DPPC or POPC, and heterogeneous (or mixed) lipid bilayers containing DPPC or POPC mixed with 10 and 20 mol% of DC8,9PC were used (Table 1). Details of the force field parameters for the triple bonds in the DC8,9PC tails are presented in the Supporting Information. A unit cell containing two layers of lipids was constructed. In the middle of the unit cell, lipid molecules were randomly selected from the library of preequilibrated state and replaced with pseudo vdW spheres at the positions of lipid head group, constituting the lipid bilayer topology.17,18 For DPPC, the cross-section areas per lipid and the head group distance are 48.6 Å2 and 47.1 Å at 298 K, respectively.19 For POPC, they are 68.3 Å2 and 37.0 Å at 303 K, respectively.20 At these temperatures, DPPC is in the gel phase, while POPC is in the liquid phase. With a choice for the number of lipid molecules, the optimal value of lateral cell dimensions can be determined. For the gel phase bilayer, 600 DPPCs (300 DPPCs each side) constitute the lateral cell dimension of 120.8 Å × 120.8 Å. For the liquid phase bilayer with 600 POPCs (300 POPCs each side), the lateral cell dimension is set to 143.1 Å × 143.1 Å. Since no experimental lipid parameter for DC8,9PC is currently available, the mixed lipid bilayers adapted the same values of the lateral cell dimensions as used for the pure lipid bilayers. For the mixed lipid bilayers, our simulation employed the NPT (constant number of atoms, pressure, and temperature) ensemble, with a constant normal pressure applied in all directions to the membrane, allowing natural cell expansion along the lateral direction due to relaxed DC8,9PC lipids. However, for the pure lipid bilayers, we employed the NPAT (constant number of atoms, pressure, surface area, and temperature) ensemble, an effective (time-averaged) surface tension, with a constant normal pressure applied in the direction perpendicular to the membrane. Adding two slabs of TIP3P water finally constitutes the unit cell with total atom number of almost 190,000 in the gel phase bilayers and 240,000 in the liquid phase bilayers.
Table 1.
Composition of simulated lipid bilayer systems.
| Bilayer system* | Lipid composition** | Temperature (K) |
|---|---|---|
| GP1 | 600 DPPC | 298 |
| GP2 | 540 DPPC + 60 DC8,9PC | 298 |
| GP3 | 480 DPPC + 120 DC8,9PC | 298 |
| LP1 | 600 POPC | 303 |
| LP2 | 540 POPC + 60 DC8,9PC | 303 |
| LP3 | 480 DPPC + 120 DC8,9PC | 303 |
GP denotes gel phase, and LP denotes liquid phases.
The numbers represent the molecules taken for analysis
A series of minimizations was performed to remove overlaps of the alkane chains and gradually relax the system. For the lipid bilayer systems, many different initial configurations were constructed for the relaxation process. For each lipid bilayer simulation, the best initial configuration was selected as a starting point for the final production stage. The selection process is based on the criteria that all lipids should be distributed uniformly on the membrane surface and the lipid tails should be well ordered in the calculation of the lipid order parameter. The initial configurations were gradually relaxed through dynamic cycles that were performed with electrostatic cutoffs (12 Å) and constant temperature (Nosé-Hoover). In subsequent stages, the phosphate atoms were harmonically restrained at their z positions, with the harmonic restraints gradually diminishing, allowing the lipids to adjust to each other. Harmonic restraints on the phosphate atoms were gradually relaxed until gone, with the dynamics performed on the NPAT ensemble for the pure bilayers and NPT ensemble for the mixed bilayer. A Nosé-Hoover thermostat/barostat was used to maintain constant temperatures of 208 K and 303 K for the gel and liquid phase bilayers, respectively, with a constant pressure of 1 atm. Later equilibration stages include full Ewald electrostatics. Production runs of 60 ns for the starting points with the NAMD code16 were performed on a Biowulf cluster at the NIH. Analysis was performed with the CHARMM programming package.13
Monolayer Experiments
Compression Isotherm
Using Microtrough X (Kibron, Inc., Helsinki, Finland), monolayers were prepared by carefully depositing a droplet of phospholipids at the air-water interface. Ultrapure water (18.2 MΩ) was deposited using 25 mm syringe filters with a pore size of 0.2 μm (Fisher Scientific, Co., Pittsburgh, PA). The sub-phase for monolayer experiments was deposited on a trough (59 mm × 208 mm) with two Teflon barriers and had a surface tension of 72.8 mN/m at room temperature (23 ± 1 °C). Mixtures were spread from a chloroform solution (1 mg/ml) using a 10 μl microsyringe (Hamilton, Co., Reno, NV). After deposition, the chloroform was allowed to evaporate for 20 min. A compression isotherm was achieved by reducing the area per molecule available using two symmetrical barriers with a constant velocity of 2 mm/min at room temperature. The surface pressure (mN/m) versus area per molecule (Å2/molecule) plot was obtained on a computer connected to the Microtrough X sensor through the FilmWare software.
Fluorescence Microscopy
Experiments were done using a special configuration of the Microtrough X designed for fluorescence microscopy with a 20X objective at room temperature. A molar concentration of 0.5 mol% of N-Rh-PE was added to the mixtures and the monolayer was deposited in the same way as in the compression isotherm protocol and the desired area per molecule was achieved (65 Å2/molecule).
RESULT AND DISCUSSION
Environment-dependent DC8,9PC Polymerization
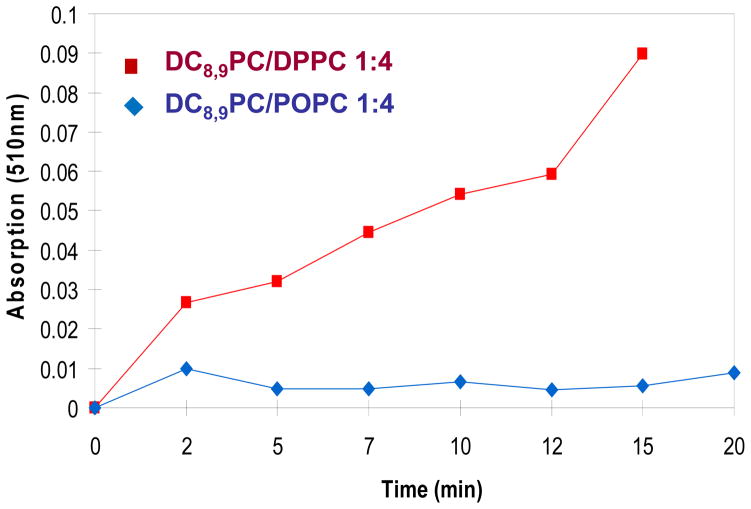
Aqueous dispersions of DC8,9PC (pure) are known to self-assemble within the plane of the bilayer, a prerequisite for UV-induced polymerization.21 The photo-crosslinking between DC8,9PC monomers leading to polymerization relies on the proper directional alignment of its fatty acyl chains (Figure 1). Previously we had evaluated the phospholipid composition of liposomes that potentially support light-triggered polymerization of embedded DC8,9PC without compromising liposome stability.11 The objective of these studies was to develop phototriggerable formulations for future drug delivery applications. Although stable liposomes containing DC8,9PC were formed in Egg PC (Tm ~ −7 °C) and DPPC (Tm ~ 41 °C), only the gel phase matrix (DPPC) supported UV-triggered polymerization. To examine the effects of the membrane environment on UV-triggered polymerization in more detail we conducted experiments using the pure lipid POPC (Tm ~ −2 °C), which is a main component of Egg PC. UV-triggered polymerization was monitored by measuring the change in the molecule’s absorption at 510 nm (Figure 2). However, a quantitative determination of the DC8,9PC monomers in UV-irradiated samples will represent a more accurate determination of reactivity of DC8,9PC.
Figure 2.
UV-VIS spectral analysis of liposomes. UV-induced changes in the sonicated liposomes were detected by an increase in absorbance (at 510 nm) as a function of time. The samples were placed in a 96-well plate (0.1 ml per well) and treated with UV (254 nm) at 25 °C for 0–20 minutes. Absorption at 510 nm was determined using the plate reader (Methods section) and the data are presented as optical density as a function of time. Squares, DPPC/DC8,9PC (4:1), diamonds, POPC/DC8,9PC (4:1).
Liquid Chromatography-tandem Mass Spectrometry (LC-MS/MS) Analysis
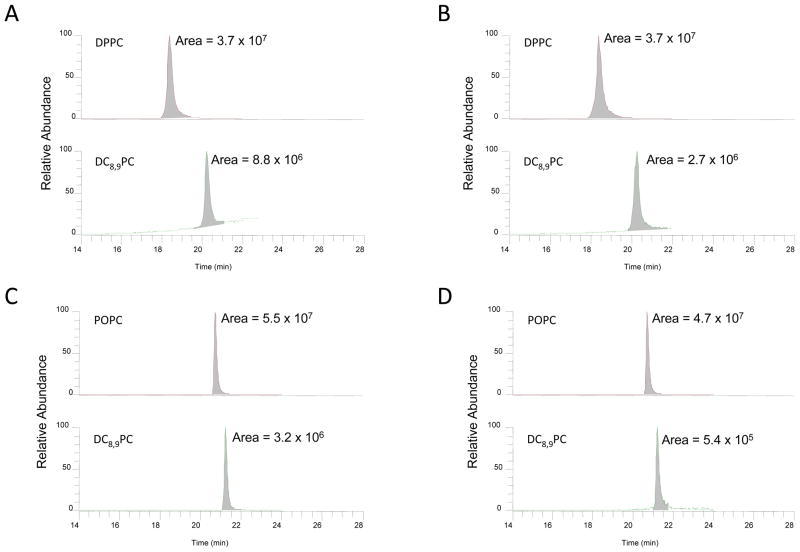
LC-MS/MS was used to characterize and identify the analytes in the UV- and non-irradiated samples of DPPC/DC8,9PC, and POPC/DC8,9PC as shown in Figure 3. Peaks representing DPPC (m/z 734.49), DC8,9PC (m/z 914.62) or POPC (m/z 760.52) and DC8,9PC analyte pairs were observed in both UV- and non-irradiated samples. The chromatograms before and after UV-irradiation are similar except the peak area ratios of the analyte pairs differ. To determine the relative concentrations of monomers, in the UV- and non-irradiated DPPC/DC8,9PC and POPC/DC8,9PC samples, LC-MS/MS experiments were performed in triplicate and at different dilution concentrations as described in Materials and Methods section. The amount of monomeric DC8,9PC in the UV-irradiated DPPC/DC8,9PC sample decreased approximately by 70% (Fig. 3B, lower panel) compared to the non-irradiated sample (Fig. 3B, A, lower panel), while the amount of monomeric DPPC remained unchanged (Fig 3A&B, top panels). Interestingly, the amount of DC8,9PC in the UV-irradiated POPC/DC8,9PC sample decreased approximately by 83% compared to the non-irradiated sample (Fig. 3D, lower panel), while the POPC concentration did not change (Fig. 3C&D, top panels). Therefore, the amount of monomeric DC8,9PC is significantly reduced in both environments. It may be noted that the LC-MS/MS experiments were performed using a Single Reaction Monitoring (SRM) mode to specifically target DC8,9PC in both POPC and DPPC matrixes. When operating in this mode the mass spectrometer specifically measures the analyte of interest and does not monitor other compounds. In this experiment the mass spectrometer specifically monitors the parent ions and their corresponding product ions for quantitation of the desired analytes. However, we have also performed full scan and precursor ion scan (PIS) experiments. In the PIS experiment we monitored m/z 184 corresponding to a choline phosphate product ion to check for all parent ions that transmit this product ion. We did not see any other parent ions except for those coming from the analytes of interest. In full scan mode apart from the major peaks of analytes, other signals from either chemical noise or from low mass ions which we were not able to characterize were observed. The triple quadrupole instrument has a mass range from 30 to 1500 Da, and consequently any polymerized monoionic species with m/z > 1500 Da are not be detectable. Therefore we were unable to characterize the photo-products of DC8,9PC in the matrixes. Taken together, the LC-MS/MS and the UV-VIS spectroscopy data indicate that in POPC/DC8,9PC samples, small cross-linked adducts (possibly dimers and trimers) may form22 that do not give rise to significant absorption changes in the visible light spectrum. In contrast, in DPPC/DC8,9PC samples, larger cross-linked conjugates are formed that result in a noticeable change in the absorption spectrum 11. Similar spectral changes upon UV irradiation have been reported in DMPC/DC8,9PC mixtures 9. If the DC8,9PC molecules are randomly distributed in the lipid matrix, cross-linking reactions can take place between the sn-1 acyl chain of one lipid and the sn-2 acyl chain of a near neighbor.22 However in that case the alignment required for chain propagation of the diacetylene chain is lost and, presumably, polymerization reaction is aborted. Therefore, for chain propagation to occur proper alignment of DC8,9PC molecules and phase-separation within the lipid matrix is essential.
Figure 3.
Quantitation of lipids by LC-MS. Sonicated liposomes were treated with UV for 30 min at 25 °C as described in Methods section. Control samples were not irradiated. Lipids were extracted according to Bligh and Dyer protocol (see Methods section). The samples were analyzed by LC-MS. Selected reaction monitoring profiles are shown in the figure A&B, DPPC:DC8,9PC (4:1) (A) control and (B) UV-irradiated). C&D, POPC: DC8,9PC (4:1) (C) control and (D) UV-irradiated). The areas of the peaks are provided within each chromatogram.
Effect of Temperature on DC8,9PC Polymerization
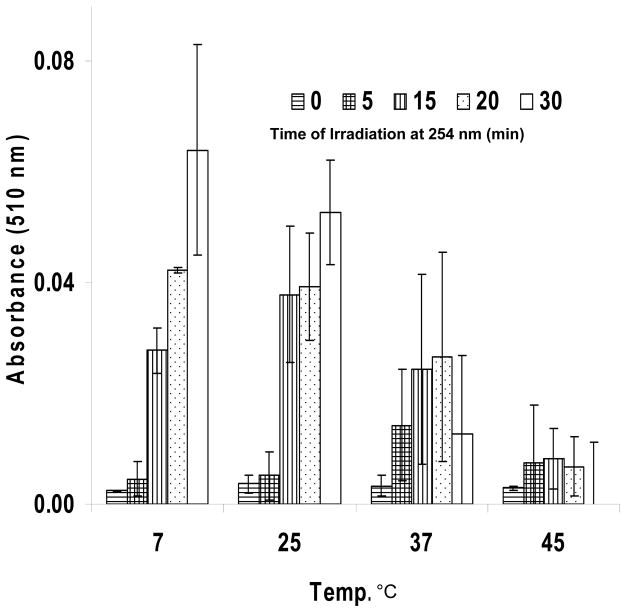
We needed to ascertain that the lack of polymerization of DC8,9PC in POPC was not due to its chemical structure but rather to the physical nature of the matrix. We therefore examined UV-triggered polymerization of DC8,9PC either in the gel phase or in the liquid phase of a single lipid, DPPC. The Tm’s of pure DPPC and DC8,9PC are 41 and 44 °C, respectively.11 Figure 4 shows no UV-triggered polymerization of DC8,9PC embedded in DPPC at 45 °C (above its Tm), whereas polymerization increased significantly as the temperature was lowered below its Tm. This result confirms that polymerization is dependent on the physical properties of the lipid in which DC8,9PC is embedded.
Figure 4.
Temperature dependence of UV-triggered DC8,9PC polymerization in DPPC liposomes. Absorption at 510 nm of DPPC/DC8,9PC (4:1) vesicles sonicated at 4 °C and then irradiated at 254 nm at different temperatures (4, 25, 37 and 45 °C, respectively) and different times (0–30 min). The error bars indicate standard deviations.
Atomistic Molecular Dynamics (MD) Simulations
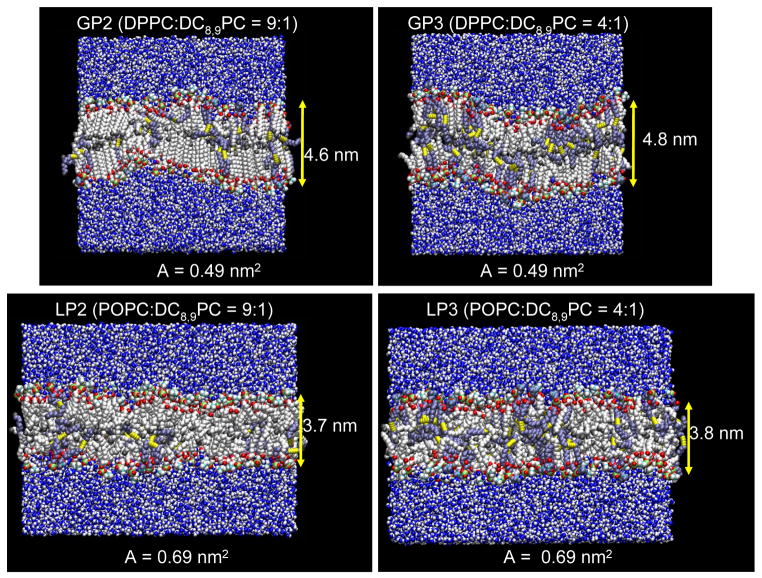
It is clear that the motional flexibility of DC8,9PC molecules significantly affects their ability to form the alignment necessary to undergo UV-triggered polymerization. To gain more detailed information on the motional flexibility in the two environments discussed above, atomistic molecular dynamics simulations (MD) were performed on these lipid mixtures. Two different bilayer phases, gel and liquid, were considered in the simulations. Simulations were performed on two homogeneous (or pure) lipid bilayers containing a single type of lipid molecule, DPPC or POPC, and four heterogeneous (or mixed) lipid bilayers containing DPPC or POPC mixed with 10 and 20 mol% of DC8,9PC. Details of the bilayer systems are presented in Table 1. Snapshots of the DPPC and POPC bilayers mixed with either 10 or 20 mol% DC8,9PC are shown in Figure 5. Interestingly the DC8,9PC molecules adjust their conformations/orientation to accommodate within the confines of their host bilayer thickness so that there is no hydrophobic mismatch. With additions of the DC8,9PC molecules in the matrix lipid bilayer, a slight increase in the averaged area per lipid and distance between phosphate atoms across the bilayer from the pure bilayers is observed (Table 2).
Figure 5.
MD simulations of lipid mixtures. Snapshots of the mixed lipid bilayers containing DC8,9PC at the end of simulations for the gel (GP2 and GP3, upper panels) and liquid (LP2 and LP3, lower panels) phase matrix. In the bilayers, white beads represents DPPC or POPC, and ice blue beads represent DC8,9PC, except some highlighted atoms in lipids. In the lipid head groups, phosphates, nitrogens, oxygens are shown as green, cyan, and red beads, respectively. In the lipid tails, triple bonded carbons are shown as yellow beads, and carbons in methyl groups are shown as gray beads. Waters are represented as blue (oxygen) and white (hydrogen) beads.
Table 2.
Calculated properties of the bilayer systems.
| Bilayer system | Area per lipid (Å2) | P-P distance (Å) | |
|---|---|---|---|
| DPPC or POPC | DC8,9PC | ||
| GP1 | 48.6 (exp)* | 47.1 (exp)*/44.7 ± 0.2 | |
| GP2 | 48.8 ± 0.1 | 46.4 ± 0.1 | 42.6 ± 0.7 |
| GP3 | 48.9 ± 0.1 | 48.3 ± 0.2 | 44.5 ± 0.3 |
| LP1 | 68.3 (exp)* | 37.0 (exp)*/36.5 ± 0.1 | |
| LP2 | 68.5 ± 0.1 | 37.2 ± 0.1 | 36.6 ± 0.7 |
| LP3 | 68.6 ± 0.1 | 38.0 ± 0.1 | 37.8 ± 0.3 |
exp denotes the experimental values. The errors are in standard deviation of the mean.
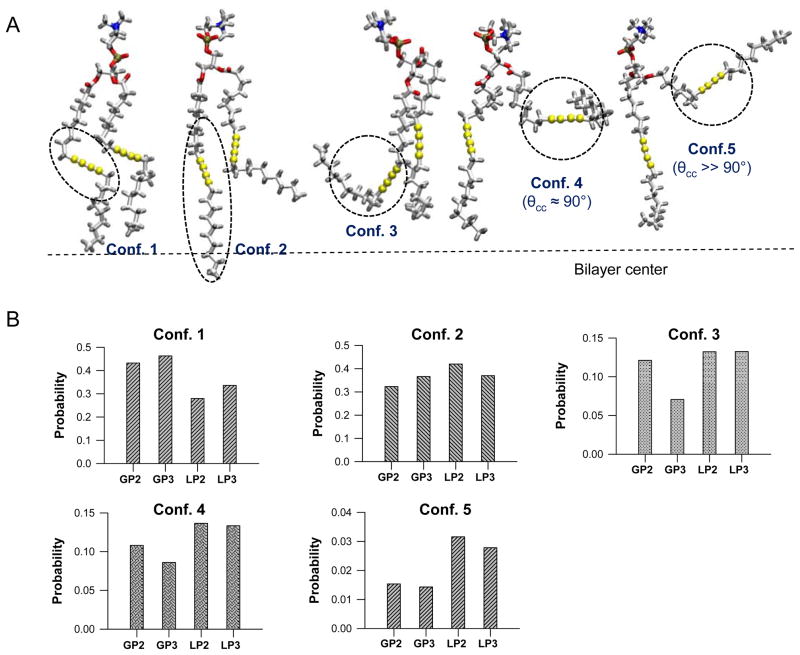
Since the conformation of DC8,9PC is an important determinant of its ability to undergo the polymerization reaction, we sampled the conformations assumed by DC8,9PC during the MD runs. Figure 6A shows five different lipid tail conformations ranging from conformation 1 with well-aligned acyl chains to conformation 5, where one of the acyl chains has rotated nearly parallel to the plane of the bilayer. The probabilities of assuming these conformations in the different lipid environments are plotted in Figure 6B. Conformation 1 can give rise to UV-triggered polymerization as the diacetylene groups are well-aligned for reactions between intermolecular sn-1 acyl chains and between intermolecular sn-2 acyl chains (see Figure 1). The more disordered conformers, however, can undergo UV-triggered reactions between the sn-1 acyl chain of one DC8,9PC molecule and the sn-2 acyl chain of a near neighbor DC8,9PC molecule giving rise to smaller adducts (see discussion above). Figure 6 indicates that the probability of conformation 1 is higher in the gel phase matrix, whereas the percentage of conformation 5 is much higher in the liquid phase matrix. Nevertheless, in spite of the fact that DC8,9PC molecules can assume conformation 1 in the fluid phase, relatively rapid lateral diffusion and fast rotational dynamics in the fluid phase (POPC) may yield only short-lived aligned conformation (Table 3). Therefore, restricted lateral diffusion and slow decay of the rotational autocorrelation of lipids in the gel phase (DPPC) favors long-lived conformation 1 of DC8,9PC to assure correct alignment for polymerization.
Figure 6.
Various DC8,9PC conformations by MD simulations. Five typical lipid tail conformations of DC8,9PC monitored during the simulations. Conformation 1 denotes “general”, conformation 2 represents “crossed”, conformation 3 denotes “folded”, conformation 4 denotes “parallel”, and conformation 5 denotes “upward” lipid tails. Probability distribution function for five typical lipid tail conformations of DC8,9PC in the gel phase bilayers, GP2 and GP3, and in the liquid phase bilayers, LP2 and LP3. Dotted lines denote the bilayer center.
Table 3.
Calculated rotational correlation parameter
| Bilayer system | DR (s−1) | |
|---|---|---|
| DPPC or POPC | DC8,9PC | |
| GP1 | 2.40 × 10⁷ | |
| GP2 | 2.75 × 10⁷ | 7.26 × 10⁷ |
| GP3 | 2.46 × 10⁷ | 5.34 × 10⁷ |
| LP1 | 2.45 × 10⁸ | |
| LP2 | 1.38 × 10⁸ | 1.42 × 10⁸ |
| LP3 | 1.24 × 10⁸ | 1.66 × 10⁸ |
Visualization of DC8.9PC Clusters in Lipid Mixtures by Microscopy
As noted above, UV-triggered polymerization only occurs if the DC8,9PC molecules are aligned and phase-separated from the matrix lipid. In general such phase separations (domains) only occur when mixtures of lipids containing liquid and solid phases are used.23 DPPC and DC8,9PC have phase transition temperatures of 41 and 44 °C respectively.11 Previously it had been shown that the Tm’s of both components are shifted towards lower temperatures in DMPC/DC8,9PC10 and DPPC/DC8,9PC 11 mixtures. However at temperatures below the Tm of both lipids, transitions are not observed and hence both components are presumably in the gel phase.
To further investigate the thermodynamic properties of these mixtures we used a monolayer system since the use of bilayers for the study of thermodynamics has several limitations.24, including the inability to manipulate the lipid composition, area per molecule and temperature independently.25,26 Moreover, evaluation of the thermodynamic relationship between bilayers and monolayers is direct.27 and the results provide important insight on the coexistence of phase in the different lipid mixtures (DPPC/DC8,9PC and POPC/DC8,9PC).
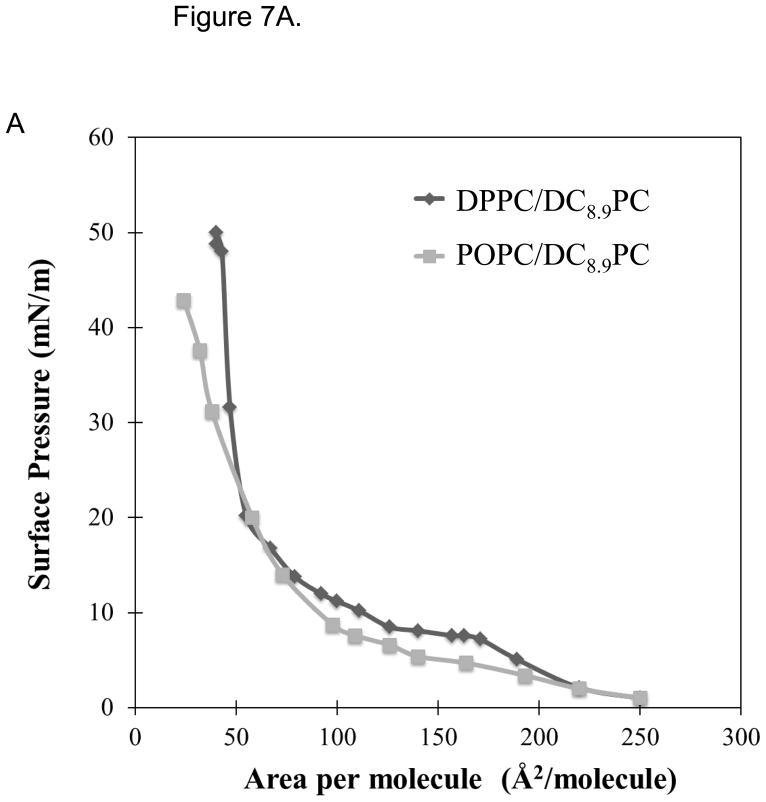
Figure 7A shows the surface pressure versus area per molecule isotherms of DPPC/DC8,9PC and POPC/DC8,9PC monolayers spread on a Langmuir trough. The POPC/DC8,9PC isotherm shows a normal (ideal gas) behavior with no indication of phase coexistence, however the DPPC/DC8,9PC curve shows a behavior indicative of phase separation. After the transition point from gas to liquid phase, the isotherm follows a two-phase coexistence region from liquid-condensed (lc) to liquid-expanded (le). Typically, monolayers that exhibit this behavior possess regularly condensed domains.28
Figure 7.
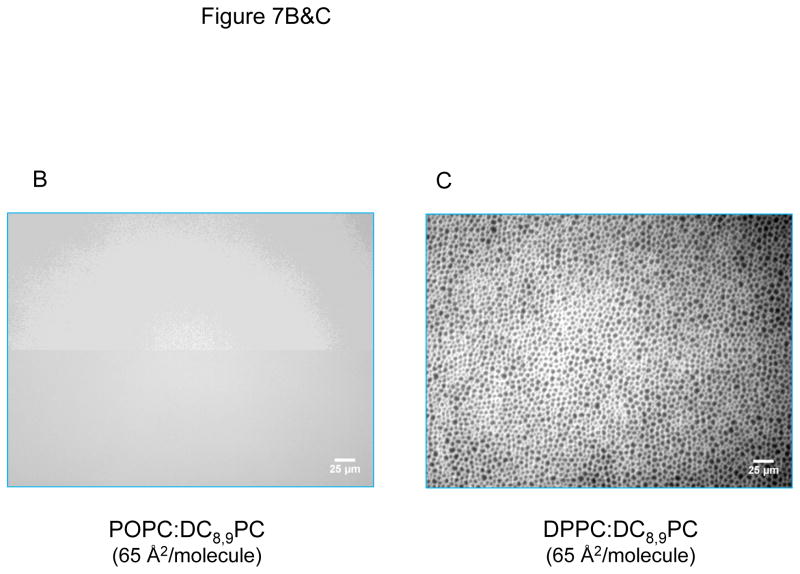
DC8,9PC clustering analysis in lipid monolyers. (A) Compression isotherms of DPPC/DC8,9PC and POPC/DC8,9PC (both 90:10 mole ratio) at room temperature. The plateau region on DPPC/DC8,9PC is an indicator of phase coexistence in the monolayer. Fluorescence micrographs of both monolayers (B) POPC/DC8,9PC and (C) DPPC/DC8,9PC. Phase separation exists only in (C), where the fluorescence areas are formed by the partition of the fluorescence probe N-Rh-PE into the more disordered phase.
The phase pattern on monolayers was also examined using a fluorescent lipid probe, N-Rh-PE, which has the propensity to partition in the fluid phase lipid29 and it is excluded from condensed solid ordered and liquid ordered domains. DPPC/DC8,9PC and POPC/DC8,9PC monolayers were analyzed at 65 Å2/molecule; an intermediate value from the range found for liquid-crystalline DPPC bilayers, which lies between 56.8 Å2/molecule30 and 71.2 Å2/molecule.31 In the POPC/DC8,9PC monolayer the fluorescence was spread out evenly over the whole surface (Figure 7B) similar to pure POPC monolayers 32 indicating that the addition of DC8,9PC to POPC does not induce phase separation. Furthermore, UV radiation did not induce phase separation in the POPC/DC(8,9)PC mixture (data not shown). Conversely a distinct pattern formation was observed in pure DPPC (data not shown) and DPPC/DC8,9PC monolayers (Figure 7C). In this case, phase separation can be distinguished due to the preferential partition of N-Rh-PE molecules away from the gel phase (represented by the existence of black circles). It is the intrinsic ability of DPPC33 to phase separate that makes it a suitable matrix lipid for our drug delivery system. By analyzing the black fraction (amount of lipid in gel phase) in pure DPPC monolayers compared to DPPC/DC8,9PC, we can observe that the addition of DC8,9PC increases the fraction of black (from an average of 28% to 36% black with a standard deviation of 2 and 1% respectively) in the monolayer, which indicates that DC8,9PC molecules are being included into the gel phase.
These data clearly support the hypothesis that the mixing behavior of DC8,9PC with the matrix lipid is a key parameter for polymerization to occur. We have demonstrated that only the mixture showing polymerization (DPPC/DC8,9PC) had evidence of domain formation in our monolayer system. This separation allows the clustering of DC8,9PC molecules enabling the proper alignment required for polymerization.
CONCLUSION
In this work we show that highly ordered lipid matrix ensures a more robust chain reaction of embedded photoreactive molecules such as DC8,9PC. Our data therefore provides insight how nanoscale ordering of lipid components regulates the kinetics, sensitivity and fidelity of chemical reactions in membranes. Our ability to control the reactivity of polymerizable lipid by modulating the lipid matrix may have applications in the building of nanodevices for biomarker detection, and triggered drug delivery.
Supplementary Material
Acknowledgments
This project is funded in whole or in part with Federal funds from the National Cancer Institute, National Institutes of Health, under contract number HHSN261200800001E. The content of this publication does not necessarily reflect the views or policies of the Department of Health and Human Services, nor does mention of trade names, commercial products, or organizations imply endorsement by the U.S. Government. This research was supported (in part) by the Intramural Research Program of the NIH, National Cancer Institute, Center for Cancer Research. All simulations were performed using the high-performance computational facilities of the Biowulf PC/Linux cluster at the National Institutes of Health, Bethesda, MD (http://biowulf.nih.gov). We thank Brian Mikolajczyk, Alex Haber, Mylinh Vu, Christopher Connor and Aamir Akram for their help with the experiments.
Footnotes
Supporting Information Available.
Force field parameters and lipid libraries generation for DC8,9PC, and one supporting figure and two supporting tables. This material is available free of charge at http://pubs.acs.org.
References
- 1.Edidin M. Nat Rev Mol Cell Biol. 2003;4:414–418. doi: 10.1038/nrm1102. [DOI] [PubMed] [Google Scholar]
- 2.Engelman DM. Nature. 2005;438:578–580. doi: 10.1038/nature04394. [DOI] [PubMed] [Google Scholar]
- 3.Simons K, Toomre D. Nat Rev Mol Cell Biol. 2000;1:31–39. doi: 10.1038/35036052. [DOI] [PubMed] [Google Scholar]
- 4.Simons K, Vaz WL. Annu Rev Biophys Biomol Struct. 2004;33:269–295. doi: 10.1146/annurev.biophys.32.110601.141803. [DOI] [PubMed] [Google Scholar]
- 5.Leaver J, Alonso A, Durrani AA, Chapman D. Biochimica et Biophysica Acta. 1983;732:210–218. doi: 10.1016/0005-2736(83)90418-2. [DOI] [PubMed] [Google Scholar]
- 6.Lopez E, O’Brien DF, Whitesides TH. Biochim Biophys Acta. 1982;693:437–443. doi: 10.1016/0005-2736(82)90451-5. [DOI] [PubMed] [Google Scholar]
- 7.Regen SL, Singh A, Oehme G, Singh M. Biochem Biophys Res Commun. 1981;101:131–136. doi: 10.1016/s0006-291x(81)80020-4. [DOI] [PubMed] [Google Scholar]
- 8.Hub HH, Hupfer B, Koch H, Ringsdorf H. Angew Chem Int Ed Engl. 1980;19:938–940. doi: 10.1002/anie.198009381. [DOI] [PubMed] [Google Scholar]
- 9.Alonso-Romanowski S, Chiaramoni NS, Lioy VS, Gargini RA, Viera LI, Taira MC. Chemistry and Physics of Lipids. 2003;122:191–203. doi: 10.1016/s0009-3084(02)00190-1. [DOI] [PubMed] [Google Scholar]
- 10.Temprana CF, Duarte EL, Taira MC, Lamy MT, Alonso SD. Langmuir. 2010;26:10084–10092. doi: 10.1021/la100214v. [DOI] [PubMed] [Google Scholar]
- 11.Yavlovich A, Singh A, Tarasov S, Capala J, Blumenthal R, Puri A. J Therm Anal Calorim. 2009;98:97–104. doi: 10.1007/s10973-009-0228-8. Ref Type: Journal (Full) [DOI] [PMC free article] [PubMed] [Google Scholar]
- 12.Bligh EG, Dyer WJ. Canadian J Biochem Physiol. 1959;37:911–917. doi: 10.1139/o59-099. [DOI] [PubMed] [Google Scholar]
- 13.Brooks BR, Bruccoleri RE, Olafson BD, States DJ, Swaminathan S, Karplus M. J Comp Chem. 1983;4:187–217. [Google Scholar]
- 14.Klauda JB, Brooks BR, MacKerell AD, Venable RM, Pastor RW. Journal of Physical Chemistry B. 2005;109:5300–5311. doi: 10.1021/jp0468096. [DOI] [PubMed] [Google Scholar]
- 15.Durell SR, Brooks BR, Bennaim A. Journal of Physical Chemistry. 1994;98:2198–2202. [Google Scholar]
- 16.Phillips JC, Braun R, Wang W, Gumbart J, Tajkhorshid E, Villa E, Chipot C, Skeel RD, Kale L, Schulten K. Journal of Computational Chemistry. 2005;26:1781–1802. doi: 10.1002/jcc.20289. [DOI] [PMC free article] [PubMed] [Google Scholar]
- 17.Woolf TB, Roux B. Proceedings of the National Academy of Sciences of the United States of America. 1994;91:11631–11635. doi: 10.1073/pnas.91.24.11631. [DOI] [PMC free article] [PubMed] [Google Scholar]
- 18.Woolf TB, Roux B. Proteins-Structure Function and Genetics. 1996;24:92–114. doi: 10.1002/(SICI)1097-0134(199601)24:1<92::AID-PROT7>3.0.CO;2-Q. [DOI] [PubMed] [Google Scholar]
- 19.Rand RP, Parsegian VA. Biochimica et Biophysica Acta. 1989;988:351–376. [Google Scholar]
- 20.Kucerka N, Tristram-Nagle S, Nagle JF. Journal of Membrane Biology. 2005;208:193–202. doi: 10.1007/s00232-005-7006-8. [DOI] [PubMed] [Google Scholar]
- 21.Johnston DS, Sanghera S, Pons M, Chapman D. Biochimica et Biophysica Acta. 1980;602:57–69. doi: 10.1016/0005-2736(80)90289-8. [DOI] [PubMed] [Google Scholar]
- 22.Peek BM, Callaghan JH, Namboodiri K, Singh A, Gaber BP. Macromolecules. 1994;27:292–297. Ref Type: Journal (Full) [Google Scholar]
- 23.Grant CW, Wu SH, McConnell HM. Biochim Biophys Acta. 1974;363:151–158. doi: 10.1016/0005-2736(74)90055-8. [DOI] [PubMed] [Google Scholar]
- 24.Brockman H. Curr Opin Struct Biol. 1999;9:438–443. doi: 10.1016/S0959-440X(99)80061-X. [DOI] [PubMed] [Google Scholar]
- 25.Luna C, Stroka KM, Bermudez H, Aranda-Espinoza H. Colloids Surf B Biointerfaces. 2011;85:293–300. doi: 10.1016/j.colsurfb.2011.02.037. [DOI] [PMC free article] [PubMed] [Google Scholar]
- 26.Kjaer K, ls-Nielsen J, Helm CA, Laxhuber LA, Mohwald H. Phys Rev Lett. 1987;58:2224–2227. doi: 10.1103/PhysRevLett.58.2224. [DOI] [PubMed] [Google Scholar]
- 27.Feng Ss. Langmuir. 1999;15:998–1010. [Google Scholar]
- 28.Vollhardt D. Advances in Colloid and Interface Science. 1996;64:143–171. [Google Scholar]
- 29.de Almeida RFM, Loura LMS, Fedorov A, Prieto M. Journal of Molecular Biology. 2005;346:1109–1120. doi: 10.1016/j.jmb.2004.12.026. [DOI] [PubMed] [Google Scholar]
- 30.Inoko Y, Mitsui T. Journal of the Physical Society of Japan. 1978;44:1918–1924. [Google Scholar]
- 31.Lis LJ, Mcalister M, Fuller N, Rand RP, Parsegian VA. Biophys J. 1982;37:657–665. [PMC free article] [PubMed] [Google Scholar]
- 32.Milhiet PE, Domec C, Giocondi MC, Van Mau N, Heitz F, Le Grimellec C. Biophys J. 2001;81:547–555. doi: 10.1016/s0006-3495(01)75721-9. [DOI] [PMC free article] [PubMed] [Google Scholar]
- 33.McConlogue CW, Vanderlick TK. Langmuir. 1997;13:7158–7164. [Google Scholar]
Associated Data
This section collects any data citations, data availability statements, or supplementary materials included in this article.


