Abstract
Single molecule detection is useful for characterizing nanoscale objects such as biological macromolecules, nano-particles and nano-devices with nano-meter spatial resolution. Fluorescence resonance energy transfer (FRET) is widely used as a single-molecule assay to monitor intramolecular dynamics in the distance range of 3–8 nm. Here we demonstrate that self-quenching of two rhodamine derivatives can be used to detect small conformational dynamics corresponding to sub-nanometer distance changes in a FRET-insensitive short range at the single molecule level. A ParM protein mutant labeled with two rhodamines works as a single molecule ADP sensor which has 20 times brighter fluorescence signal in the ADP bound state than the unbound state. Single molecule time trajectories show discrete transitions between fluorescence on and off states that can be directly ascribed to ADP binding and dissociation events. The conformational changes observed with 20:1 contrast are only 0.5 nm in magnitude and are between crystallographic distances of 1.6 nm and 2.1 nm, demonstrating exquisite sensitivity to short distance scale changes. The systems also allowed us to gain information on the photophysics of self-quenching induced by rhodamine stacking: (1) photobleaching of either of the two rhodamines eliminates quenching of the other rhodamine fluorophore and (2) photobleaching from the highly quenched, stacked state is only two-fold slower than from the unstacked state.
Keywords: Single molecule technique, nano-devices, conformational change detection, fluorescence microscopy, rhodamine self-quenching
In recent years, single molecule fluorescence techniques have been widely used in nanotechnology and biological macromolecules to image and characterize nano-scale movements at a spatial precision far beyond the optical diffraction limit 1–3. Single molecule fluorescence resonance energy transfer (smFRET) is of particular interest where a pair of fluorophores, donor and acceptor, are involved as a real-time indicator of the distance between the two 4–8. Many nano-devices and nano-sensors are based on biomolecules and can be characterized using smFRET by monitoring the intramolecular conformational changes of the biomolecules 9–12 or the intermolecular distance changes 13, 14 in real time. FRET efficiency, EFRET, is a measure of how much energy is transferred from the donor to the acceptor and is given by EFRET = 1/ (1+(R/Ro)6), where R is the distance between the donor and the accepter and Ro is the Förster radius at which EFRET =0.515. A typical value of Ro is 5–7 nm for the FRET pairs used in a single molecule experiment 16, making smFRET sensitive to the distance changes in the range of 3–10 nm 17. Nanoparticle-induced lifetime modification has been used to serve as a nanoscopic ruler for the distance range beyond the upper limit of FRET sensitive range (> 10 nm) 18. There have been previous attempts to monitor small distance changes in the 0–3 nm distance range but they are mostly based on time-resolved or time-correlated fluorescence spectroscopy using freely diffusing biomolecules and hence could not yield long time traces of a single biomolecule undergoing conformational changes 8, 19–25. For some FRET pairs, when the donor and acceptor come in close proximity (< 3 nm), their interactions cause complex fluorescence fluctuations 26. Protein induced fluorescence enhancement, a recently reported single molecule assay, provides a means of monitoring the time-dependent intermolecular distance change between a fluorophore and a protein in the 0–3 nm range 27. However, an equivalent method is missing for detecting the intramolecular conformational dynamics of single biomolecules in the smFRET insensitive distance range.
Here, we use a ParM mutant, an engineered ADP-sensing protein 28, as a model system to illustrate the use of self-quenching between two identical tetramethylrhodamines (TMR) to study the intramolecular conformational dynamics in short distances. When in close proximity, the two TMRs can stack on each other to form a dimer in which their fluorescence emission is significantly quenched. Self-quenching of TMR due to stacking has been used in the ensemble studies to monitor the peptide cleavage by proteases 29, 30, and intramolecular conformational changes of proteins 28, 31, 32 and nucleic acids 33. This strategy has also been used to study molecular motors stepping on microtubules at both ensemble and single molecule levels 34, 35. In the previous attempts to utilize this approach to study titin unfolding/refolding at a single protein level, there were multiple TMRs attached to a titin molecule and rapid fluorescent enhancement induced by chemical denaturants was shown to be the result of direct action of the denaturants on TMR dimers rather than protein unfolding 36, 37. In this article, we present a generalizable surface-tethered single molecule assay for detecting conformational changes of individual biomolecules in a FRET inaccessible short range and in real time.
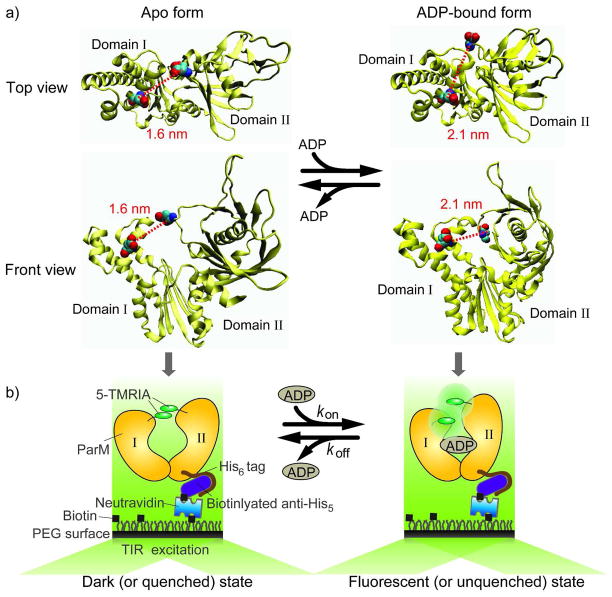
The model system we use to demonstrate our assay is ParM, a bacterial actin homologue that forms F-actin-like filaments during plasmid segregation in E. coli 38. ParM consists of two domains (I and II) between which is a cleft where the nucleotide binding site is located. ParM is in an open conformation in the absence of ADP whereas it changes to a closed conformation with ADP bound by closing the two domains (Figure 1a). The mutations T174A/T175N and K33A were made to increase the selectivity for ADP versus ATP and to inhibit filament formation, respectively 28. To use TMR self-quenching as a reporter for the dynamics between the open and closed conformations, two cysteines residues were introduced (D63C/D224C; Figure 1a) which reacted with 5′-isomers of tetramethylrhodamine iodoacetamide (5-TMRIA) on either side of the nucleotide binding cleft (the natural, exposed cysteine in the wild-type protein was mutated to alanine, C287A). The two attachment positions (or cysteines) in the protein must be sufficiently close (~1.5 nm) and the cysteine side chains needs to adopt appropriate relative orientations for the two TMRs to dimerize in one of the ParM conformations but not in the other. In order to satisfy these requirements, several pairs of TMR labeling positions were tested through a screening process 28, 31. In general, such screening procedure would be needed to identify the optimum labeling positions even if structural information is available for a protein. In the previous ensemble measurement, the ParM mutant (His6/K33A /D63C/T174A/T175N/D224C/C287A) developed as a ADP sensor showed ~ 15-fold fluorescence increase and the characteristic absorbance changes of the rhodamines in response to ADP binding 28, suggesting that distance change, estimated from the crystal structures, from 1.6 nm (ADP unbound, open conformation) to 2.1 nm (ADP bound, closed conformation) is enough to strongly affect the probability of rhodamines stacking.
Figure 1.
a) The top and front views of ParM apo structure (left, PDB entry 1MWM) and the ADP-bound ParM structure (right, PDB entry 1MWK). The positions of the two cysteine mutations and the distance between them are shown (1.6 nm for the quenched state and 2.1 nm for the unquenched state; the distances were measured between cysteine α-carbons). b) The experimental scheme that shows how the protein is anchored onto the PEG-coated surface through anti-His5/His6-tag and biotin/neutravidin interactions (also see Experimental Section).
We have developed multiple surface immobilization strategies for smFRET experiments where fluorescently labeled biomolecules are anchored onto a PEG (polyethylene glycol) coated surface with a low density such that individual molecules can be resolved as well-separated diffraction limited spots 16, 39. In our current design, ParM was surface-immobilized using an antibody against the Histidine6-tag 39 to achieve specific binding and the total internal reflection fluorescence (TIRF) microscope 16 was used for sample illumination and data acquisition (Figure 1b). Upon ADP binding, one would expect the doubly TMR-labeled ParM to change from a fluorescently quenched to an unquenched state. The oxygen-scavenging system with Trolox was used for imaging to reduce photobleaching while preventing milliseconds time scale photophysical blinking of TMRs (Supporting Information, Figure S1)40.
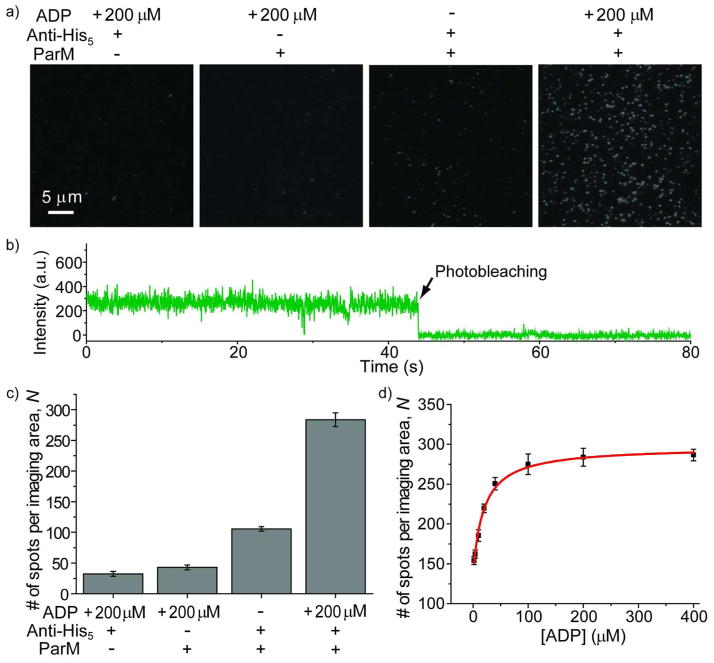
We first validated the assay by comparing the TIRF images, obtained in the absence and presence of His6-tagged ParM at different ADP concentrations (Figure 2a). Before adding ParM to the sample chamber containing a penta-His-antibody coated surface, the surface image showed ~30 fluorescent spots per imaging area (2,700μm2) presumably due to surface impurities. After anchoring the proteins to the surface and flushing away excess unbound proteins, we observed ~100 fluorescent spots on average per imaging area in the absence of ADP (Figure 2b). The additional ~70 spots observed beyond the surface impurity spots (~30) typically show a steady, continuous fluorescence emission over time with one photobleaching step (Figure 2b), which we assign to the proteins with only one active TMR attached. Either the protein is singly labeled or one of the two TMRs has been photobleached before data acquisition, but in either case TMR self-quenching would not occur. We then sequentially injected imaging buffers containing increasing ADP concentrations and determined the average number of fluorescent spots per imaging area, N. N increases with increasing ADP concentrations to a saturation value of ~290 (Figures 2c and 2d). This indicates a larger fraction of proteins is bound with ADP at high ADP concentrations because ADP binding converts ParM from a weakly-fluorescent (or quenched) state into a highly-fluorescent (or unquenched) state and the proteins in the quenched state cannot be detected by the automated algorithm to pick fluorescent spots. The hyperbolic fit to the data points yields a dissociation constant (Kd) of 20 ± 3 μM for ADP binding to the protein (Figure 2d), similar to the value of 30 ± 4 μM obtained from previous ensemble experiments 28. In order to demonstrate that ParM proteins were immobilized on the surface through specific interactions rather than non-specific adsorption, we used a surface without penta-His-antibody coating and obtained ~ 40 fluorescent spots per imaging area in the presence of ADP, which is close to the ~ 30 spots of surface impurities (Figures 2a and 2c).
Figure 2.
a) Representative TIRF images taken in the absence and presence of ParM with the indicated ADP concentrations and surface conditions (penta-His-antibody coated surface or not). b) A representative fluorescence-intensity time trace for the molecules in the absence of ADP, showing steady and continuous fluorescence over time. c) The average number of fluorescent spots per imaging area determined in the absence and presence of ParM and/or ADP. d) The average number of fluorescence spots per imaging area as a function of the ADP concentration. The red line is the fit to a hyperbola.
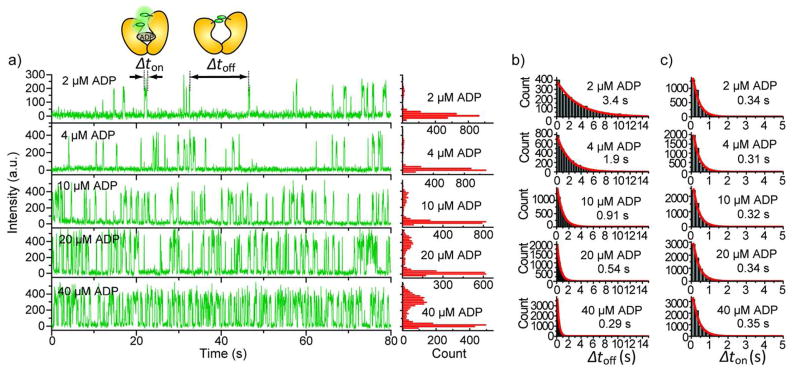
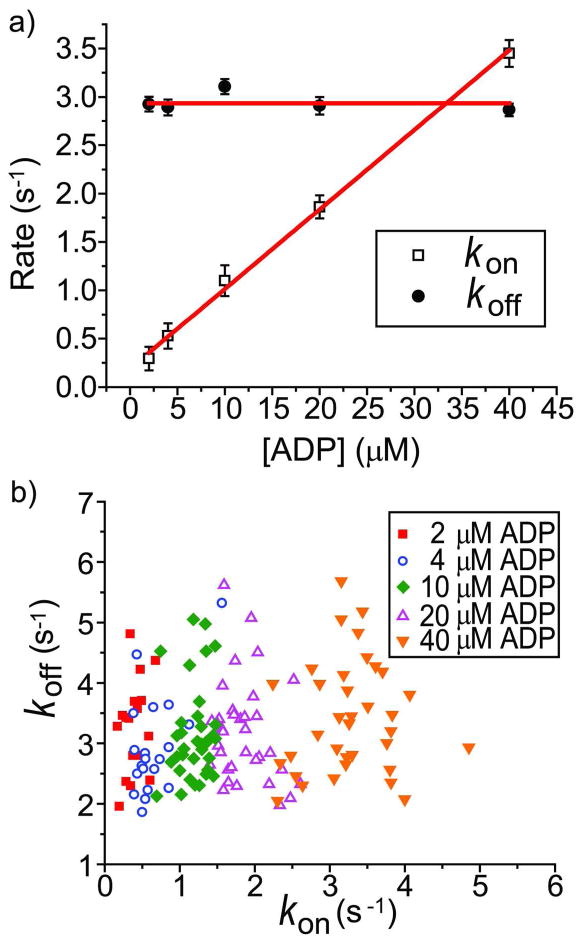
In the presence of ADP, two types of fluorescence-intensity versus time traces were observed: Type I molecules (around 100 per imaging area at all ADP concentrations tested) displayed steady (or continuous) fluorescence intensity over time until photobleaching (Figure 2b); Type II molecules (the number per imaging area increased from ~50 to ~200 as ADP concentration increased from 2 to 400 μM) display two-state transitions between a weakly-fluorescent state (nearly non-fluorescence) and a highly-fluorescent state. Figure 3a shows the representative intensity-time traces of Type II molecules with corresponding fluorescence intensity distributions at five different ADP concentrations. The weakly fluorescent state is not completely non-fluorescent (Supporting Information, Figure S2) and the fluorescence emission in the highly-fluorescent state is 20 ± 5 (mean ± s.d) times larger than that in the weakly-fluorescent state, similar to the 15-fold difference between the unquenched and quenched states determined from ensemble measurements 28. The dwell time of the weakly-fluorescent state (Δtoff) and the dwell time of the highly-fluorescent state (Δton) were collected from many Type II molecules. The histograms of Δton and Δtoff fit well with single exponential functions (Figure 3b). The transition rates between the two states at different ADP concentrations are plotted in Figure 4a. Here, kon=1/τoff and koff=1/τon, where τon and τoff are the average dwell times obtained from the single exponential fits. koff is independent of ADP concentration whereas kon displays a linear dependence on ADP concentration. These data suggest that the two-state dynamics observed in the Type II molecules represent events of single ADP binding to and dissociation from a single ParM protein carrying two active TMRs, with the unquenched state being the ADP-bound state and the quenched state being the ADP-unbound state. Therefore, ADP dissociation rate is equal to koff, which is 2.9 ± 0.04 s−1 (mean ± s.e.m.) and the bimolecular association rate between ADP and ParM is 0.082 ± 0.002 s−1 μM−1 (mean ± s.e.m.), yielding a dissociation constant Kd = 35 ± 1 μM (mean ± s.e.m.). These values are all consistent with the values obtained previously by stopped-flow experiments 28.
Figure 3.
a) Representative fluorescence-intensity time traces for the molecules showing two-state dynamics at five different ADP concentrations with the corresponding fluorescence intensity distributions. b) and c) Dwell time analysis for the two states respectively at the five ADP concentrations. The dwell time histograms were built from 50–100 molecules at each ADP concentration. The red lines are the single exponential fits to the dwell time histograms. τon or τoff obtained from the fit is shown next to each histogram.
Figure 4.
a) The transition rates between the quenched and unquenched states at five ADP concentrations. The best fit horizontal was performed for koff and the best linear fit was performed for kon. b) Scatter plots of the transition rates among many different individual molecules at five ADP concentrations.
To examine the heterogeneity further among different ParM molecules, we plotted the distribution of transition rates for each molecule obtained at five different ADP concentrations (Figure 4b). The scatter plot indicates that the rates of ParM conformational changes are heterogeneous among different molecules even with the same ADP concentration. The intermolecular heterogeneity has been ubiquitously observed in single-molecule studies for the conformational kinetics and enzymatic activity of biomolecules, possibly due to local environment differences, sampling of conformational sub-states or small imperfections during the protein synthesis 5, 41, 42.
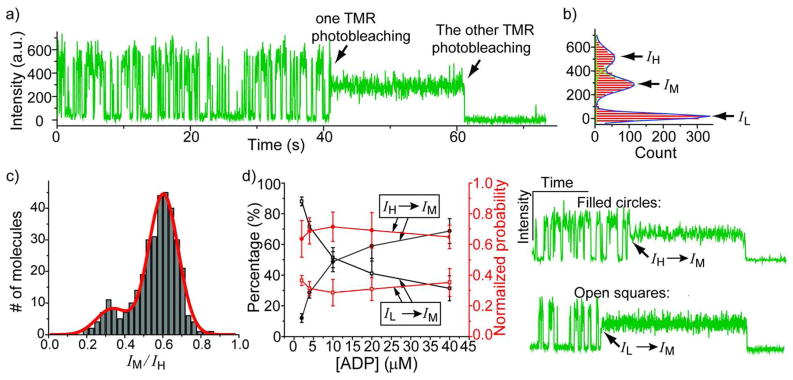
As mentioned above, a fraction of molecules (Type I) emitted steady/continuous fluorescence over time both in the absence and presence of ADP (Figure 2b). A large fraction of molecules initially showing two-state dynamics (Type II) switched to Type I behavior (Figure 5a). In contrast, none of the molecules initially showing Type I behavior switched to Type II behavior. The mechanism of TMR self-quenching is not well-understood, but we speculate that the self-quenching of TMR requires that both TMR monomers are not photobleached so that once one of the two TMRs is photobleached the remaining TMR emits steadily. The fluorescence intensity histogram for a molecule that changed from Type II to Type I behavior showed three peaks (Figure 5b). The peak at near zero fluorescence intensity (IL) represents the molecule in the quenched state, whereas the peak at the high fluorescence intensity (IH) represents the unquenched state. The peak at the middle fluorescence intensity (IM) represents the fluorescence emission when the molecule switches into the ‘steady’ fluorescence state. After a dynamic molecule switches into the IM state, only one more photobleaching event was observed (Figure 5a), indicating that only one active TMR is present in the IM state whereas there are two active TMRs present in its initial dynamic phase. From many similar time traces, we collected IH and IM values from Gaussian fits of the intensity histograms and calculated the ratio IM/IH for each molecule. The distribution of the ratio IM/IH obtained from all molecules showed two Gaussian peaks centered at 0.35 and 0.61, indicating two different IM levels. We notice that the sum of the two peak values is ~1. Given the fact that the fluorescence level of a single TMR varies with environment (on D63C or D224C positions; data not shown), each of the two different intermediate fluorescence levels could represent the protein population containing either of the two active TMRs. The peak at IM/IH=0.61 has a larger population probably because the TMR at one position can be photobleached faster than the other despite the lower emission rate.
Figure 5.
a) and b) A representative fluorescence-intensity time trace for the molecules showing conversion from two-state dynamics to steady fluorescence and the corresponding fluorescence intensity distribution (This trace was taken at 20 μM ADP). c) Distribution of the ratio IM/IH built from 343 molecules that show the type of time trace in a). The red line is the fit to the sum of two Gaussian peaks. d) The percentages of the molecules that convert from the unquenched to the IM state or from the quenched to the IM state when the molecule switches from a dynamic to a steady phase at five ADP concentrations, with calculated probabilities normalized to the average dwell time of the state before the conversion. The example conversion traces (from IH to IM, from IL to IM) are shown in the right.
Finally, we asked whether TMR photobleaching occurs significantly also from the stacked state or occurs only when the TMR molecules are unstacked. We further analyzed the intensity time traces of the molecules that show conversion from a dynamic to a steady phase and determined the state immediately before the conversion event. We found the molecule could be either in quenched (IL) or unquenched (IH) state before the conversion to the IM state at all the five ADP concentrations tested. Figure 5d shows that the percentage of the molecules observed to switch from IH to IM increases as the ADP concentration increases, whereas the percentage of the molecules that show IL to IM transition decreases. However, if we consider the average dwell time of the ADP bound and unbound states and normalize each percentage value by the fraction of time spent in the two states (see also Experimental Section), we found that the normalized probabilities for IL to IM and IH to IM transitions are both essentially independent of ADP concentration (0.32 ± 0.03 and 0.68 ± 0.03 respectively). This suggests that the probability for the TMR photobleaching to occur in the quenched, stacked state is half that for the TMR photobleaching to occur in the unquenched, unstacked state. We find this observation peculiar because one would normally imagine that in the stacked state, non-radiative decay to the ground state would occur much faster and the likelihood of photobleaching per photo-excitation would greatly decrease.
The dissociation constant of free TMR dimers (5′-isomers) in aqueous solutions is very high, ~137 μM 43 and indirect evidence indicates that TMR stacking itself does not greatly affect the affinity for the ligand, ADP or Pi 28, 31. Overall, it is reasonable to assume that TMR stacking and unstacking rates do not limit the ParM conformational changes induced by ADP binding and dissociation, and are likely to occur on a much faster time scale than ADP binding and dissociation. There is likely to be a small but significant amount, for example 5%, of unstacked TMRs in rapid equilibrium with stacked TMRs in the apo (or weakly-fluoresent) state that could be responsible for the low fluorescence rather than the non-fluorescence. In addition, it is also possible that fluorescence quenching by stacking is not complete because of conformational constraints exerted on the TMRs by tethering them to the protein surface. Even the ADP bound, unquenched state may represent a rapid equilibrium between the stacked and unstacked states favoring the unstacked state.
In conclusion, we demonstrated a surface-tethered single molecule assay to study the intramolecular conformational dynamics of biomolecules in short distance range (1–3 nm) based on self-quenching of two TMRs. We have shown that a sub-nanometer distance change (between 1.6 and 2.1 nm) between the two TMRs attachment points on a ADP sensing protein caused by the protein conformational dynamics can be sensitively detected by ~20-fold fluorescence intensity change. This single molecule assay is applicable to the studies of small conformational dynamics of other nano-devices based on biomolecules at short distances as long as rhodamines are positioned correctly, through a screening process, to take advantage of the structural changes 31. Our method based on fluorescence quenching of two stacked rhodamine should be able to extend the single molecule analysis of biomolecules and other nano-scale machineries to the FRET-insensitive distance range, opening up many new opportunities. In addition, our work provides new insights about photophysics of rhodamine dimers that could not have been obtained otherwise.
Experimental Section
Sample Preparation
Flow chambers were prepared on mPEG-coated quartz slides doped with biotin-PEG as described 16, 44. 0.2 mg/ml neutravidin (Thermo) was incubated for 5 min to generate neutravidin-coated flow chambers and the unbound excess neutravidin molecules were flushed away. 10 nM of biotinylated penta-His antibody (Qiagen) was then incubated for 10 min on the neutrAvidin-coated surface followed by flushing away the unbound excess antibodies as previously described 39 (this step was omitted for the control experiment where we showed ParM proteins were indeed immobilized on surface through specific interactions). 1 nM of ParM was incubated for 5 min and the imaging buffer containing 30 mM Tris-HCl (pH 7.5), 25 mM KCl, 3 mM MgCl2, 4 mM Trolox, 0.1 mg/ml BSA with an oxygen scavenging system (1 mg/ml glucose oxidase, 0.4% (w/v) D-glucose and 0.04 mg/ml catalase) was injected into the flow chamber for single-molecule data acquisition. The measurements were performed at room temperature (22 ± 1°C). ParM, labeled with rhodamines, at stock concentration of 322 μM was obtained and stored using standard buffer (30 mM Tris-HCl, 1 mM DTT, 150 mM KCl, 1 mM EDTA) as previously described 28 and diluted into 1 nM concentration right before each experiment.
Single-Molecule Data Acquisition
The prism type total internal reflection fluorescence microscopy (TIRF) 16, 44 was used to acquire all the single-molecule data. Briefly, a Nd:YAG laser with 532 nm wavelength was guided through the prism to generate an evanescent field of illumination. A water-immersion objective (60×, numerical aperture 1.2, Olympus) was used to collect the signal and the scattered light was removed using a 550 nm long-pass filter. Although the laser was set up specifically for Cy3-Cy5 FRET experiment, this set up can be used for rhodamine, which has a similar spectroscopic profile to Cy3 fluorophore. The fluorescence signal was sent to a high-speed CCD camera (iXon DV 887-BI, Andor Technology). Time resolution of 0.03 s was used for data acquisition.
Data Analysis
The florescent spots were determined using a custom DSL program described before 39. The average number of the fluorescent spots per imaging area (2,700 μm2) was calculated from 20 or more TIRF images taken from different regions. For the two-state fluorescence dynamics, the dwell times in each state were estimated from intensity-time traces (having at least ten turnovers; 50–100 sec long) using a custom MATLAB (Mathworks) routines using a thresholding criterion described before 45. Dwell time histograms were built from 50–100 molecules at each ADP concentration and fitted to single exponential functions to obtain the average dwell times (τon and τoff). Rate constants were estimated as the inverse of the average dwell times.
To obtain the normalized probabilities in Figure 5d, we consider the average life time of the state immediately before the molecule converts from a dynamic to a static phase (τon if the state was IH, τoff if the state was IL. We define the percentage of the molecules that show IL to IM transition is xi and the percentage of the molecules that show IH to IM transition is yi at the ADP concentration of i (i = 2, 4, 10, 20, 40 μM; xi+yi=1). The normalized probability for the molecules that show IL to IM transition is given by and the normalized probability for the molecules that show IH to IM transition is given by , where .
Supplementary Material
Acknowledgments
We thank all the members of Ha laboratory for experimental help and discussions. This work was supported by grants from the National Institutes of Health and the National Science Foundation. TH is an employee of the Howard Hughes Medical Institute. MRW and SK were supported by Medical Research Council Technology and by the Medical Research Council, UK (ref. U117512742).
Footnotes
Supporting Information Available: Representative fluorescence-intensity time traces of a single TMR fluorophore with and without Trolox in the imaging buffer. Representative fluorescence-intensity time traces of a single ParM-based ADP sensor for differentiating the fluorescence emission in the quenched state from the background. This material is available free of charge via the Internet at http://pubs.acs.org.
References
- 1.Chen P, Zhou X, Shen H, Andoy NM, Choudhary E, Han KS, Liu G, Meng W. Chem Soc Rev. 2010;39(12):4560–4570. doi: 10.1039/b909052p. [DOI] [PubMed] [Google Scholar]
- 2.Agrawal A, Deo R, Wang GD, Wang MD, Nie S. P Natl Acad Sci USA. 2008;105(9):3298–303. doi: 10.1073/pnas.0712351105. [DOI] [PMC free article] [PubMed] [Google Scholar]
- 3.Zhang CY, Yeh HC, Kuroki MT, Wang TH. Nat Mater. 2005;4(11):826–31. doi: 10.1038/nmat1508. [DOI] [PubMed] [Google Scholar]
- 4.Joo C, Balci H, Ishitsuka Y, Buranachai C, Ha T. Annu Rev Biochem. 2008;77:51–76. doi: 10.1146/annurev.biochem.77.070606.101543. [DOI] [PubMed] [Google Scholar]
- 5.Zhuang X. Annu Rev Biophys Biomol Struct. 2005;34:399–414. doi: 10.1146/annurev.biophys.34.040204.144641. [DOI] [PubMed] [Google Scholar]
- 6.Schuler B, Eaton WA. Curr Opin Struct Biol. 2008;18(1):16–26. doi: 10.1016/j.sbi.2007.12.003. [DOI] [PMC free article] [PubMed] [Google Scholar]
- 7.Nienhaus GU. Methods Mol Biol. 2009;490:311–37. doi: 10.1007/978-1-59745-367-7_13. [DOI] [PubMed] [Google Scholar]
- 8.Michalet X, Weiss S, Jager M. Chem Rev. 2006;106(5):1785–813. doi: 10.1021/cr0404343. [DOI] [PMC free article] [PubMed] [Google Scholar]
- 9.Shroff H, Reinhard BM, Siu M, Agarwal H, Spakowitz A, Liphardt J. Nano Lett. 2005;5(7):1509–14. doi: 10.1021/nl050875h. [DOI] [PubMed] [Google Scholar]
- 10.Muller BK, Reuter A, Simmel FC, Lamb DC. Nano Lett. 2006;6(12):2814–20. doi: 10.1021/nl0619406. [DOI] [PubMed] [Google Scholar]
- 11.Buranachai C, McKinney SA, Ha T. Nano Lett. 2006;6(3):496–500. doi: 10.1021/nl052492p. [DOI] [PMC free article] [PubMed] [Google Scholar]
- 12.Modi S, Swetha MG, Goswami D, Gupta GD, Mayor S, Krishnan Y. Nature Nanotechnology. 2009;4(5):325–330. doi: 10.1038/nnano.2009.83. [DOI] [PubMed] [Google Scholar]
- 13.Wickersham CE, Cash KJ, Pfeil SH, Bruck I, Kaplan DL, Plaxco KW, Lipman EA. Nano Letters. 2010;10(3):1022–1027. doi: 10.1021/nl904192m. [DOI] [PMC free article] [PubMed] [Google Scholar]
- 14.Lee G, Hartung S, Hopfner KP, Ha T. Nano Lett. 2010;10(12):5123–5130. doi: 10.1021/nl103754z. [DOI] [PMC free article] [PubMed] [Google Scholar]
- 15.Ha T, Enderle T, Ogletree DF, Chemla DS, Selvin PR, Weiss S. P Natl Acad Sci USA. 1996;93(13):6264–8. doi: 10.1073/pnas.93.13.6264. [DOI] [PMC free article] [PubMed] [Google Scholar]
- 16.Roy R, Hohng S, Ha T. Nat Methods. 2008;5(6):507–16. doi: 10.1038/nmeth.1208. [DOI] [PMC free article] [PubMed] [Google Scholar]
- 17.Ha T. Curr Opin Struct Biol. 2001;11(3):287–92. doi: 10.1016/s0959-440x(00)00204-9. [DOI] [PubMed] [Google Scholar]
- 18.Seelig J, Leslie K, Renn A, Kuhn S, Jacobsen V, van de Corput M, Wyman C, Sandoghdar V. Nano Letters. 2007;7(3):685–689. doi: 10.1021/nl0627590. [DOI] [PubMed] [Google Scholar]
- 19.Doose S, Neuweiler H, Sauer M. Chemphyschem. 2009;10(9–10):1389–98. doi: 10.1002/cphc.200900238. [DOI] [PubMed] [Google Scholar]
- 20.Yang H, Luo G, Karnchanaphanurach P, Louie TM, Rech I, Cova S, Xun L, Xie XS. Science. 2003;302(5643):262–6. doi: 10.1126/science.1086911. [DOI] [PubMed] [Google Scholar]
- 21.Zhu P, Clamme JP, Deniz AA. Biophys J. 2005;89(5):L37–9. doi: 10.1529/biophysj.105.071027. [DOI] [PMC free article] [PubMed] [Google Scholar]
- 22.Bollmann S, Burgert A, Plattner C, Nagel L, Sewald N, Lollmann M, Sauer M, Doose S. Chemphyschem. doi: 10.1002/cphc.201100650. [DOI] [PubMed] [Google Scholar]
- 23.Chattopadhyay K, Elson EL, Frieden C. P Natl Acad Sci USA. 2005;102(7):2385–9. doi: 10.1073/pnas.0500127102. [DOI] [PMC free article] [PubMed] [Google Scholar]
- 24.Doose S, Neuweiler H, Barsch H, Sauer M. P Natl Acad Sci USA. 2007;104(44):17400–5. doi: 10.1073/pnas.0705605104. [DOI] [PMC free article] [PubMed] [Google Scholar]
- 25.Neuweiler H, Doose S, Sauer M. P Natl Acad Sci USA. 2005;102(46):16650–5. doi: 10.1073/pnas.0507351102. [DOI] [PMC free article] [PubMed] [Google Scholar]
- 26.Meller A, Di Fiori N. Biophysical Journal. 2010;98(10):2265–2272. doi: 10.1016/j.bpj.2010.02.008. [DOI] [PMC free article] [PubMed] [Google Scholar]
- 27.Hwang H, Kim H, Myong S. P Natl Acad Sci USA. 2011;108(18):7414–8. doi: 10.1073/pnas.1017672108. [DOI] [PMC free article] [PubMed] [Google Scholar]
- 28.Kunzelmann S, Webb MR. Acs Chemical Biology. 2010;5(4):415–425. doi: 10.1021/cb9003173. [DOI] [PMC free article] [PubMed] [Google Scholar]
- 29.Packard BZ, Toptygin DD, Komoriya A, Brand L. P Natl Acad Sci USA. 1996;93(21):11640–5. doi: 10.1073/pnas.93.21.11640. [DOI] [PMC free article] [PubMed] [Google Scholar]
- 30.Blackman MJ, Corrie JET, Croney JC, Kelly G, Eccleston JF, Jameson DM. Biochemistry. 2002;41(40):12244–12252. doi: 10.1021/bi0263661. [DOI] [PubMed] [Google Scholar]
- 31.Okoh MP, Hunter JL, Corrie JET, Webb MR. Biochemistry. 2006;45(49):14764–14771. doi: 10.1021/bi060960j. [DOI] [PubMed] [Google Scholar]
- 32.Hamman BD, Oleinikov AV, Jokhadze GG, Bochkariov DE, Traut RR, Jameson DM. Journal of Biological Chemistry. 1996;271(13):7568–7573. doi: 10.1074/jbc.271.13.7568. [DOI] [PubMed] [Google Scholar]
- 33.Bernacchi S, Mely Y. Nucleic Acids Res. 2001;29(13):E62–2. doi: 10.1093/nar/29.13.e62. [DOI] [PMC free article] [PubMed] [Google Scholar]
- 34.Rosenfeld SS, Xing J, Jefferson GM, Cheung HC, King PH. Journal of Biological Chemistry. 2002;277(39):36731–36739. doi: 10.1074/jbc.M205261200. [DOI] [PubMed] [Google Scholar]
- 35.Toprak E, Yildiz A, Hoffman MT, Rosenfeld SS, Selvin PR. Proceedings of the National Academy of Sciences of the United States of America. 2009;106(31):12717–12722. doi: 10.1073/pnas.0808396106. [DOI] [PMC free article] [PubMed] [Google Scholar]
- 36.Zhuang X, Ha T, Kim HD, Centner T, Labeit S, Chu S. P Natl Acad Sci USA. 2000;97(26):14241–4. doi: 10.1073/pnas.97.26.14241. [DOI] [PMC free article] [PubMed] [Google Scholar]
- 37.Kellermayer MSZ, Grama L, Somogyi B. Proc Natl Acad Sci U S A. 2001;98(25):14362–14367. doi: 10.1073/pnas.191494098. [DOI] [PMC free article] [PubMed] [Google Scholar]
- 38.van den Ent F, Moller-Jensen J, Amos LA, Gerdes K, Lowe J. Embo Journal. 2002;21(24):6935–6943. doi: 10.1093/emboj/cdf672. [DOI] [PMC free article] [PubMed] [Google Scholar]
- 39.Jain A, Liu RJ, Ramani B, Arauz E, Ishitsuka Y, Ragunathan K, Park J, Chen J, Xiang YK, Ha T. Nature. 2011;473(7348):484–U322. doi: 10.1038/nature10016. [DOI] [PMC free article] [PubMed] [Google Scholar]
- 40.Rasnik I, McKinney SA, Ha T. Nature Methods. 2006;3(11):891–893. doi: 10.1038/nmeth934. [DOI] [PubMed] [Google Scholar]
- 41.Ha T. Biochemistry. 2004;43(14):4055–63. doi: 10.1021/bi049973s. [DOI] [PubMed] [Google Scholar]
- 42.Herbert KM, Greenleaf WJ, Block SM. Annu Rev Biochem. 2008;77:149–76. doi: 10.1146/annurev.biochem.77.073106.100741. [DOI] [PMC free article] [PubMed] [Google Scholar]
- 43.Ajtai K, Ilich PJ, Ringler A, Sedarous SS, Toft DJ, Burghardt TP. Biochemistry. 1992;31(49):12431–40. doi: 10.1021/bi00164a019. [DOI] [PubMed] [Google Scholar]
- 44.Joo C, Ha T. Single molecule FRET with total internal reflection microscopy. In: Selvin PR, Ha T, editors. Single molecule techniques: A laboratory manual. Cold Spring Harbor Laboratory Press; New York: 2008. p. 507. [Google Scholar]
- 45.McKinney SA, Declais AC, Lilley DMJ, Ha T. Nature Structural Biology. 2003;10(2):93–97. doi: 10.1038/nsb883. [DOI] [PubMed] [Google Scholar]
Associated Data
This section collects any data citations, data availability statements, or supplementary materials included in this article.


