Abstract
Aberrant epigenetic repression of gene expression has been implicated in most cancers, including breast cancer. The nuclear amine oxidase, lysine-specific demethylase 1 (LSD1) has the ability to broadly repress gene expression by removing the activating mono- and di-methylation marks at the lysine 4 residue of histone 3 (H3K4me1 & me2). Additionally, LSD1 is highly expressed in estrogen receptor α negative (ER−) breast cancer cells. Since epigenetic marks are reversible, they make attractive therapeutic targets. Here we examine the effects of polyamine analogue inhibitors of LSD1 on gene expression, with the goal of targeting LSD1 as a therapeutic modality in the treatment of breast cancer. Exposure of the ER-negative human breast cancer cells, MDA-MB-231, to the LSD1 inhibitors, 2d or PG11144, significantly increases global H3K4me1 and H3K4me2, and alters gene expression. Array analysis indicated that 98 (75 up and 23 down) and 477 (237 up and 240 down) genes changed expression by at least 1.5-fold or greater after treatment with 2d and PG11144, respectively. The expression of twelve up-regulated genes by 2d and fourteen up-regulated genes by PG11144 was validated by quantitative RT-PCR. Quantitative chromatin immunoprecipitation (ChIP) analysis demonstrated that up-regulated gene expression by polyamine analogues is associated with increase of the active histone marks H3K4me1, H3K4me2 and H3K9ac, and decrease of the repressive histone marks H3K9me2 and H3K27me3, in the promoter regions of the relevant target genes. These data indicate that the pharmacologic inhibition of LSD1 can effectively alter gene expression and that this therapeutic strategy has potential.
Keywords: epigenetics, chromatin, histone methylation, acetylation, gene silencing
Introduction
Epigenetic regulation of gene expression is dysregulated in many cancers, including breast cancer. In addition to changes in DNA CpG island methylation, covalent modifications of histone proteins play a critical role in the aberrant silencing of various tumor suppressor genes (Wolffe and Matzke 1999; Kondo et al. 2003). Although histone acetylation is typically associated with actively transcribed genes, the effect of histone methylation is greatly dependent on the specific histone residue that is methylated and its methylation status. Di-methylation of lysine 9 of histone 3 (H3K9me2) is associated with gene repression, while methylation (mono-, di- and tri-methylation) of lysine 4 of histone 3 is associated with active gene transcription (Snowden et al. 2002; Barski et al. 2007). Lysine-specific demethylase 1 (LSD1) can specifically demethylate mono- and di-methyl H3K4, and thus has the potential to broadly repress gene expression (Barski et al. 2007; Wang et al. 2009). Importantly, LSD1 protein expression and activity have been demonstrated to be elevated in multiple tumor types, including breast cancer, thus suggesting an additional basis for tumor selectivity (Schulte et al. 2009; Lim et al. 2010).
Our previous studies demonstrated that a novel class of polyamine analogues can effectively inhibit LSD1 and induce re-expression of several aberrantly silenced genes (Huang et al. 2007; Huang et al. 2009). The purpose of this study was to examine the molecular effects of two specific polyamine analogue LSD1 inhibitors, 2d and PG11144, each of which represents a different class of analogue, on global gene expression in estrogen receptor-negative breast cancer cells. The possible mechanisms of polyamine analogue-mediated modulation of gene expression were also investigated.
Materials and Methods
Cell culture
The ER-negative human breast cancer cell line, MDA-MB-231 was cultured in Dulbecco’s modified Eagle’s medium (DMEM; Mediatech Inc., Herndon, VA) supplemented with 10% fetal bovine serum. The cells were incubated at 37°C in an atmosphere containing 5% CO2. A biguanide polyamine analogue, 2d, and an oligoamine polyamine analogue, PG11144, were synthesized as previously reported (Huang et al. 2003; Huang, et al. 2007). Compounds were dissolved in 0.01 M HCl to provide 10mM stock solutions and were diluted with culture medium to the desired concentrations. For the combination treatment, 24 hours after seeding, cells were co-treated with 5 µM of 2d or PG11144 and 0.5 µM of 5-Aza-cytidine (Aza) and/or 2.5µM MS275 for 24 h.
MTT assay and polyamine content
Growth inhibition was determined using the MTT assay as described previously (Huang et al. 2004). Briefly, cells were seeded at a density of 3000 cells/well in 96-well plates and allowed to grow overnight. Medium was aspirated and replaced with fresh medium and treated with appropriate concentrations of compounds using appropriate controls. After treatment, 200 µl of MTT reagent (1 mg/ml) were added to each well and incubated at 37°C incubator for 4h, allowing viable cells to reduce the MTT to dark-blue formazan crystals. The absorbance was measured at 595 nm using a microplate reader. Growth inhibition was measured by comparing A595 of treated cells to that of untreated controls, which were set as 100%.
The intracellular polyamine concentration of cells was determined by the pre-column dansylation, reversed phase high-performance liquid chromatography methods as previously published (Kabra et al. 1986).
Nuclear protein preparation and Western Blotting
Nuclear proteins were prepared using the NE-PER nuclear and cytoplasmic extraction reagents (Pierce, Rokford, IL) following the manufacturer’s instructions. Twenty ug of nuclear proteins were fractionated on 4–12% NuPAGE Bis-Tris gels and transferred onto PVDF membranes. Primary antibodies against H3K4me1 (07–458) and H3K4me2 (07–030) were purchased from Millipore. The Odyssey Infrared Detection System (LI-COR Biosciences, Lincoln, NE) was used to quantify relative amounts of proteins.
Microarray and data analysis
Microarray expression profiling was performed by the Microarray Core Facility of The Sidney Kimmel Comprehensive Cancer Center at Johns Hopkins. Total RNA from treated and untreated MDA-MB-231 cells was extracted using Trizol reagent (Invitrogen, Carlsbad, CA) according to the instructions provided by the manufacturer. RNA was re-purified using RNeasy mini kit (Invitrogen, Carlsbad, CA). cDNA was then synthesized, amplified and labeled with Cy5-dUTP and Cy3-dUTP for two-color microarray-based gene expression analysis, respectively, using Superscript III reverse transcriptase (Invitrogen, Carlsbad, CA). The labeled cDNA was hybridized to the Agilent whole human genome microarrays (G4112F, Agilent Technologies, Palo Alto, CA), which contain containing 45,015 features representing 41,000 unique probes including 26,605 genes with RefSeq or UniGene accession number. The hybridized arrays were scanned with an Agilent G2505B scanner controlled by Agilent scan control 7.0 software according to Agilent Technologies standard operation procedures. Data were extracted with Agilent Feature Extraction 9.1 software. Differentially expressed targets were identified by using processed data and P Value Log ratio generated by the software. Data were normalized using Feature Extraction software and analyzed with Genespring GX software (Agilent Technologies).
Reverse transcription quantitative PCR (RT-qPCR)
Total RNA extraction from treated and untreated cells was performed as described above. Reverse transcription (RT) was carried out using Superscript II reverse transcriptase (Invitrogen, Carlsbad, CA) after pretreatment with RNase-free DNase I (Roche, Indianapolis, IN). The primer sequences for each gene are shown in Table 1. Glyceraldehyde 3-phosphate dehydrogenase (GAPDH) was used as an internal control. The comparative cycle threshold (Ct) method was used to quantify relative gene expression level.
Table 1.
| gene | primer | Sequence |
|---|---|---|
| mt1f | F | CCTGCACCTGCGCTGGTTCC |
| R | ACAGCCCTGGGCACACTTGC | |
| mt1x | F | GGACCCCAACTGCTCCTGCTC |
| R | TTTGCAGATGCAGCCCTGGGC | |
| nupr1 | F | CTGCGGAGGAAGGAGGAC |
| R | CTCAGTCAGCGGGAATAAGTC | |
| mt1m | F | CTAGCAGTCGCTCCATTTATCG |
| R | CAGCTGCAGTTCTCCAACGT | |
| mt1e | F | TGCGCCGGCTCCTGCAAGTGC |
| R | ATGCCCCTTTGCAGACGCAGC | |
| mt2a | F | CTCTTCAGCACGCCATGGAT |
| R | CGCGTTCTTTACATCTGGGA | |
| ddit4 | F | AGACACGGCTTACCTGGATG |
| R | CTGGCTTACCAACTGGCTAGG | |
| stk32b | F | CAGCAGAATGTGCATTTCACAG |
| R | ACCGTCGCTATGTTGAAGTCT | |
| ifit2 | F | ATGTGCAACCTACTGGCCTAT |
| R | TGAGAGTCGGCCCATGTGATA | |
| slc301A1 | F | TACATGGAGGTGGCTAAAACA |
| R | TGTCCCACAACATTGCTTCAAA | |
| slc301A2 | F | CGGCAATCCGGTCATACAC |
| R | AGATGGCAGAGGCTACATACAG | |
| gdf15 | F | GGGCAAGAACTCAGGACGG |
| R | TCTGGAGTCTTCGGAGTGCAA | |
| egr1 | F | GGTCAGTGGCCTAGTGAGC |
| R | TGCTGTCGTTGGATGGCAC | |
| aardc4 | F | TTCTCGGAGGTGGAGTACCTG |
| R | CCAAAGGTTCAGATGGAAGTTGA | |
| rrad | F | AGGGCACACCTATGATCGCT |
| R | CCCTTGTCCGTCACTGAGT | |
| txnip | F | GGTCTTTAACGACCCTGAAAAGG |
| R | CGAAGTCTGTTTGCACTGCT | |
| cdh16 | F | CTTTATACCTGACCAAGTTGCCG |
| R | TGACCTGTAGCTGGTACTCTG | |
| atf3 | F | GAGGATTTTGCTAACCTGACGC |
| R | GGCTACCTCGGCTTTTGTGAT | |
| dusp1 | F | CAGTACCCCACTCTACGATCA |
| R | ACCCTCAAAATGGTTGGGACA | |
| wnk4 | F | GCGCTCTTCTCGTCTCAGC |
| R | GGGGTTCTTTGGAGCTAGGC | |
| hdac9 | F | AGCCCATCTCACCTTTAGACC |
| R | GTGCTGCCGTGTCAAGTTC | |
| ccnb1ip | F | TATCGAAAGTGTCGCATCAAACT |
| R | AGGCAGGACAGATAGCTGGT | |
| id2 | F | GACCCGATGAGCCTGCTATAC |
| R | AATAGTGGGATGCGAGTCCAG | |
| serpine1 | F | ATTCAAGCAGCTATGGGATTCAA |
| R | CTGGACGAAGATCGCGTCTG | |
| tex14 | F | CCTGAAGAAGATAGACTCCCCG |
| R | GAGCAGAAATGACTCCAGCTTT | |
| dusp2 | F | TGTCCCGATCTGTGCTCTGA |
| R | ACCCTGGTCGTAGACAGGAG |
Chromatin immunoprecipitation
The EZ Chip kit (Millipore, Billerica, MA) was used for chromatin immunoprecipitation assays. Cells were cross-linked with 37% formaldehyde to final concentration of 1% at room temperature for 10 min. Cross-linking was stopped and unreacted formaldehyde was quenched by adding glycine to a final concentration of 0.125 M. Cells were washed in cold PBS twice and sonicated with a microtip ultransonicator on ice 6 times for 10 sec each. Anti-H3 (ab1791, Abcam), -H3K4me1 (07–458, Millipore), -H3K4me2 (07–303, Millipore), -H3K9ac (17–609, Millipore), -H3K9me2 (07–441, Millipore) and -H3K27me3 (07–449, Millipore) were subsequently incubated, where indicated, with soluble chromatin on a rotating platform overnight at 4°C. The antibody/DNA complex was collected by binding with 60 ul of protein A/G agarose. The agarose was washed with wash buffer and TE buffer. The precipitated chromatin was eluted from the agarose beads. Reversal of cross-links was carried out by incubation at 65°C overnight followed by RNase and proteinase K treatment. DNA was purified using a MinElute Reaction cleanup spin column (Qiagen, Valencia, CA). qPCR was carried out to quantify precipitated DNA using gene specific primers which are spanning −1000 to +500 bp around the transcription start site of each gene (Table 2).
Table 2.
| gene | primer | Sequence | |
|---|---|---|---|
| egr1 | A | F | ACTAGGGAACAGCCTTTCG |
| R | CTATGGCACGGTGTCTTTC | ||
| B | F | ACACCGTGCCATAGATCGAG | |
| R | GTTCTATCGCTGTCATCCAGG | ||
| C | F | TGGATGACAGCGATAGAACC | |
| R | CTCCAAATAAGGTGCTGCC | ||
| D | F | ACCTTATTTGGAGTGGCCC | |
| R | GGAAGCCCTAATATGGCAGG | ||
| E | F | CCGTTCCAGACCCTTCAAATAG | |
| R | AACACTGAGAAGCGTGCAG | ||
| F | F | TGCACGCTTCTCAGTGTTC | |
| R | GTTGCTCAGCAGCATCATC | ||
| cdh16 | A | F | CCCCTCATTCCAGACTCCCAG |
| R | GTGAGCAGTACATGAGTGGAAGTG | ||
| B | F | CACCCATCCTTTGCAACCTCCAG | |
| R | CCCTCACACCATGCCATGTGC | ||
| C | F | AGGGGCATTCCCAGAGGAGG | |
| R | AGCACAGCCCAGGAGGTATTC | ||
| D | F | GGAGTGCCAGGCCAACCATC | |
| R | ACTGGCTCCCTTGGTCCAGC | ||
| E | F | AAGGGAGCCAGTCTTGGGCG | |
| R | TTCCAGCCCTTGTCATGGAGC | ||
| F | F | GGAAAATGATGAGACAAGGGCCG | |
| R | AGACTTGGAGGGTCACTTCCTG | ||
| mt1f | A | F | GGCACAGACTCAACCTTAAGCA |
| R | ATCGCACCATTTTTGCACTC | ||
| B | F | CGCCTTCAGTGATCTCGCTTC | |
| R | TCTCTAGCATTGCCTGTCCCTG | ||
| C | F | CGAAGGTCACATCCTCGGCCTG | |
| R | ATTGCCTGCTACACCCGCCC | ||
| D | F | GGCGAAACTGGGAAGGGCG | |
| R | GCAGGTGGAAGGCGTGGTG | ||
| E | F | CCCACTGCTTCTTCGCTTCTC | |
| R | GTACCCTCAACGCTGACACAG | ||
| F | F | AGGCTCAAGGCTGTCCTGCTCC | |
| R | CTGTCCTGAACCCCGAAGAGGC | ||
| nupr1 | A | F | GAGACAGGGTCTCCCTCTGT |
| R | GTTGGAGAGTTCAGGGTCTG | ||
| B | F | CTAGGTGAGGGAGATTACATTAC | |
| R | CCGAATAGCTGGGATTATAG | ||
| C | F | AGGAGAATTGCTTGAACCTG | |
| R | AGATGCAGGACGTGAGGAAG | ||
| D | F | CTTCCTCACGTCCTGCATCT | |
| R | ATCCAGCCCAGTAAACACAG | ||
| E | F | CCTGCCTCTCTTCTTCTCCT | |
| R | CCTGCCTCTCTTCTTCTCCT | ||
| F | F | AAGAGAGGCAGGGAAGACAA | |
| R | GATTTCGGGAGAGGAGGAAG |
Results
Cell growth inhibition by 2d and PG11144
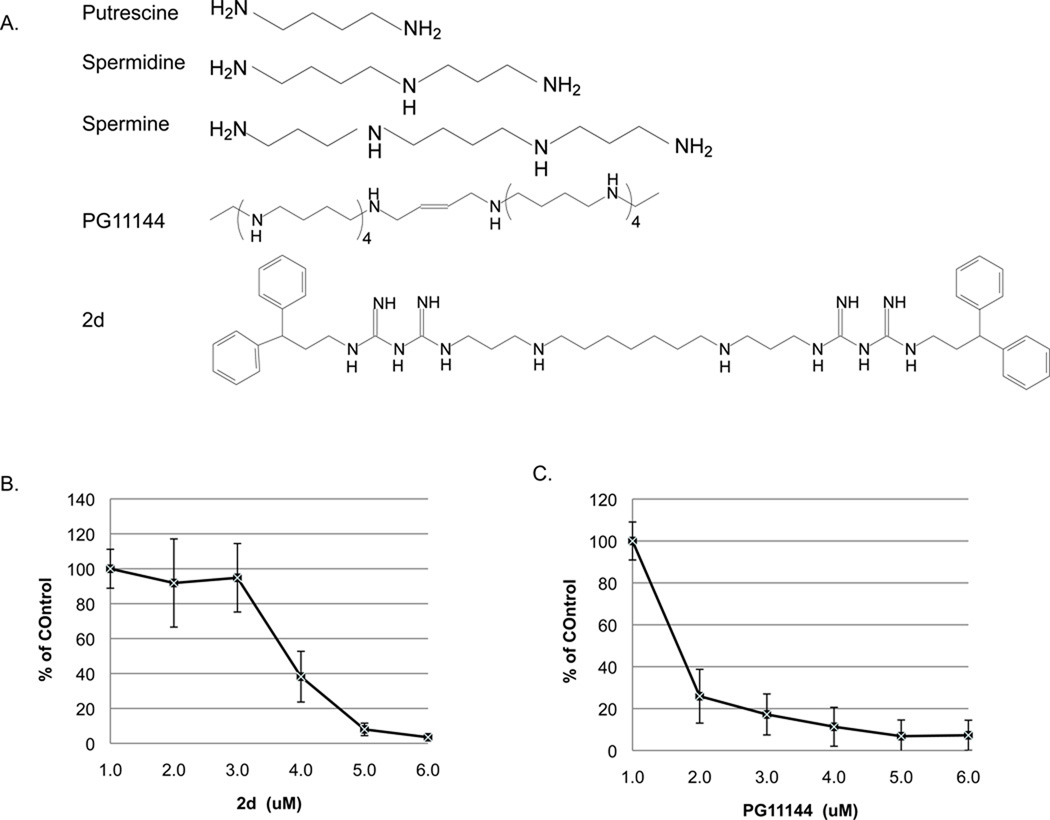
Approximately 25% of breast cancer patients have tumors that are ER-negative and do not benefit from endocrine therapies. For these patients, treatment options are limited. Lysine-specific demethylase 1 (LSD1) was found highly expressed in ER-negative breast cancers and may represent a valid biomarker for the aggressive, hormone unresponsive breast tumors (Lim, et al. 2010). Importantly, it may also represent an important therapeutic target. Our group has identified novel classes of polyamine analogues that can inhibit LSD1activity (Huang et al. 2007; Huang et al. 2009). To test the efficacy of these newly identified analogues in ER-negative (ER−) breast cancer cells, we chose the biguanide analogue, 2d and the oligoamine analogue, PG11144 (Fig. 1 A) and used the estrogen receptor negative (ER−) cell line, MDA-MB-231 as a model. Both 2d and PG11144 inhibited growth of MDA-MB-231 cells in a time-and dose-dependent manner (Fig. 1 B & C). The observed IC50 for 2d is ≤6 µM and ≤ 1 µM for PG11144 for a 96 h treatment.
Fig. 1.
Cell growth inhibition by polyamine analogues. A. Structures of natural polyamines and polyamine analogues used in this study. Effects of 2d (B) and PG11144 (C) on the growth of MDA-MB-231 cells. MDA-MB-231 cells were seeded at a density of 3000 cells/well in 96-well plates and allowed to grow overnight. Media was aspirated and replaced with fresh media and treated with increased concentration of 2d or PG11144 for 96h. After treatment, cell viability was measured by added 200 µl of MTT reagent (1 mg/ml) were added to each well and incubated at 37°C incubator for 4h. The absorbance was measured at 595 nm using a microplate reader. The results are the mean ± S.E. of three independent experiments performed in triplicate.
As polyamine analogues can mimic natural polyamines in their regulation of polyamine metabolism. The cellular polyamine content after 48 hrs of 2d or PG11144 treatment was determined. PG11144 treatment reduced the levels of all three intracellular polyamines in MDA-MB-231 cells. By contrast, 2d treatment led to reduced putrescine (Put) and spermidine (Spd) levels and a slight increase in spermine (Spm) was observed (Table 3).
Table 3.
| Put (nmol/mg protein) | Spd (nmol/mg protein) | Spm (nmol/mg protein) | ||||
|---|---|---|---|---|---|---|
| 24h | 48h | 24h | 48h | 24h | 48h | |
| Control | N/A | 0.625±0.048 | 10.97±0.53 | 12.23±0.78 | 14.02±0.99 | 15.62±1.40 |
| 2d | N/A | N/A | 7.78±1.71 | 7.15±0.31 | 19.93±4.32 | 18.28±1.98 |
| PG11144 | N/A | N/A | 6.36±2.46 | 0.77±0.03 | 8.84±1.61 | 4.66±0.70 |
Induced ERα expression in MDA-MB-231 cells by inhibiting LSD1
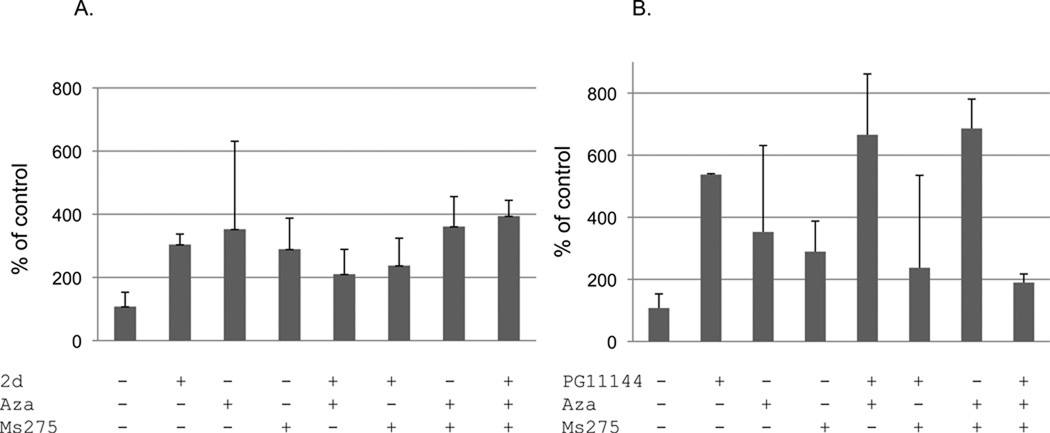
It has been demonstrated that there are densely methylated CpG islands at the ERα promoter region in MDA-MB-231 cells (Ottaviano et al. 1994). By inhibiting DNA methyltransferase (DNMT) and/or histone deacetylase (HDAC) activity using the pharmacological modulators of DNMT and HDAC, Aza and/or TSA, ERα expression was induced (Ferguson et al. 1997; Yang et al. 2001; Yan et al. 2003). To test if polyamine analogue-induced inhibition of LSD1 could also induce ERα expression, we first determined dose and time-dependent growth responses for 2d and PG11144 (data not shown). To optimize ER gene re-expression while maintaining minimum cellular toxicity, 5 µM of 2d or PG11144 was used in our treatments. As shown in Fig. 2, ERα mRNA was induced 3 to 5-fold by treatment with 2d or PG11144, respectively. There are no synergistic effects when 2d was co-treated with the DNMT inhibitor Aza, and only a slight additive effect when it was combined with Aza and MS-275. For PG11144, although there is an additive effect between Aza and MS-275, no synergistic or additive effects were detected when all three reagents were combined.
Fig. 2.
Effects of LSD1 inhibitors and DNMT inhibitor and/or HDAC inhibitor on ERα expression. MDA-MB-231 cells were treated with LSD1inhibitor 2d (A) or PG11144 (B) alone or with DNMT inhibitor (Aza) and/or HDAC inhibitor (MS275) for 24 h. Total RNA was extracted and cDNA was synthesized. The qRT-PCR was used to measure the gene expression. GAPDH expression was used as an internal control. The results are the mean ± S.E. of three independent experiments performed in triplicate.
Gene expression profiles after 2d or PG11144 treatment in MDA-MB-231 cells
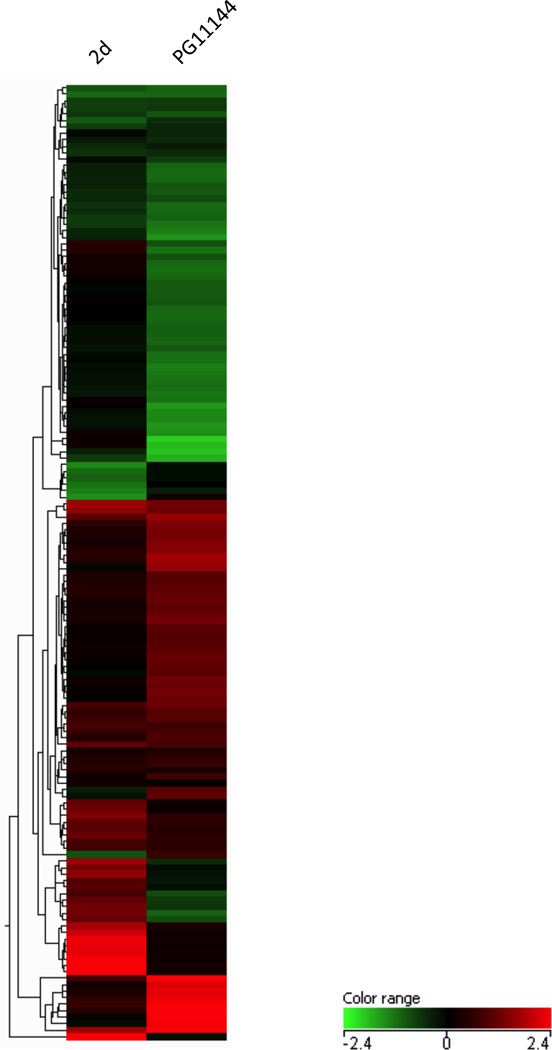
Previous studies have used a candidate gene approach to examine the effects of LSD1 Inhibition on gene expression (Huang et al. 2007; Huang et al. 2009). To obtain a more comprehensive genome-wide profile of genes whose expression is altered by inhibiting LSD1, RNA from 2d- or PG11144-treated samples were analyzed using the Agilent 44K human genome microarrays. Overall, after a 24 h treatment, expressions of 98 genes were changed by equal or more than 1.5 fold by 2d. These genes are involved in cell cycle regulation, apoptosis and DNA synthesis. Among these genes, the most prominently upregulated genes were the stress response genes, antioxidant metallothionein 1 (mt1f, mt2a, mt1e, mt1x, mt1m, mt1b, mt1g, mt1h, mt1a,), DNA-damage-inducible transcript 4 (ddit4), and activating transcription factor 3 (atf3). A total of 477 genes were observed to be modulated by PG11144 treatment with changes of 1.5-fold or greater (Fig. S1). The heat map generated by GeneSpring GX 9 using Pearson’s correlation for similarity measure and an average linkage clustering algorithm (Fig. 3) demonstrates the differences and similarities between the two LSD1 inhibitors.
Fig. 3.
2d and PG11144 modulate gene expression. Clustering of the expression profiles of genes that displayed at least a 1.5-fold change after treatment of MDA-MB-231 cells with 5µM 2d or PG11144 for 24 h. Each horizontal bar represents one gene. The bar color indicates the relative transcription level from green (low) to red (high).
Functional pathway analysis
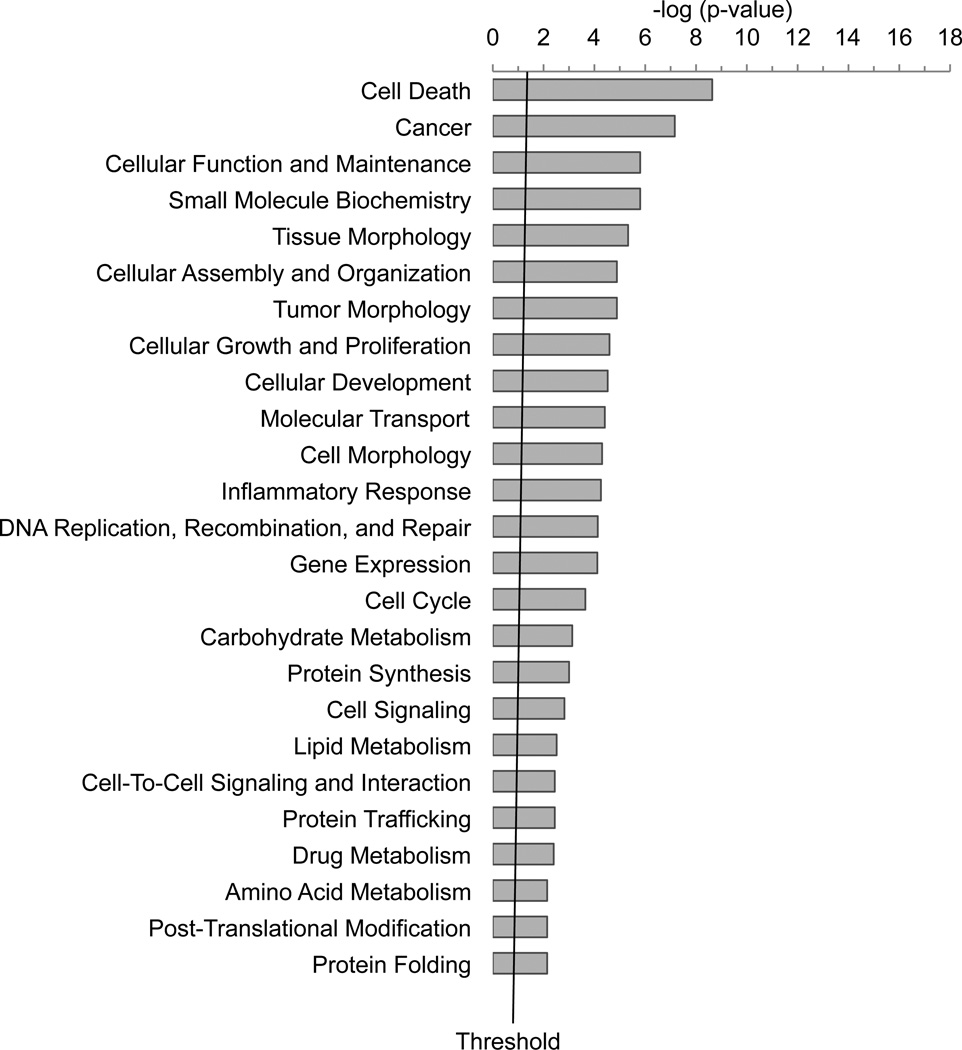
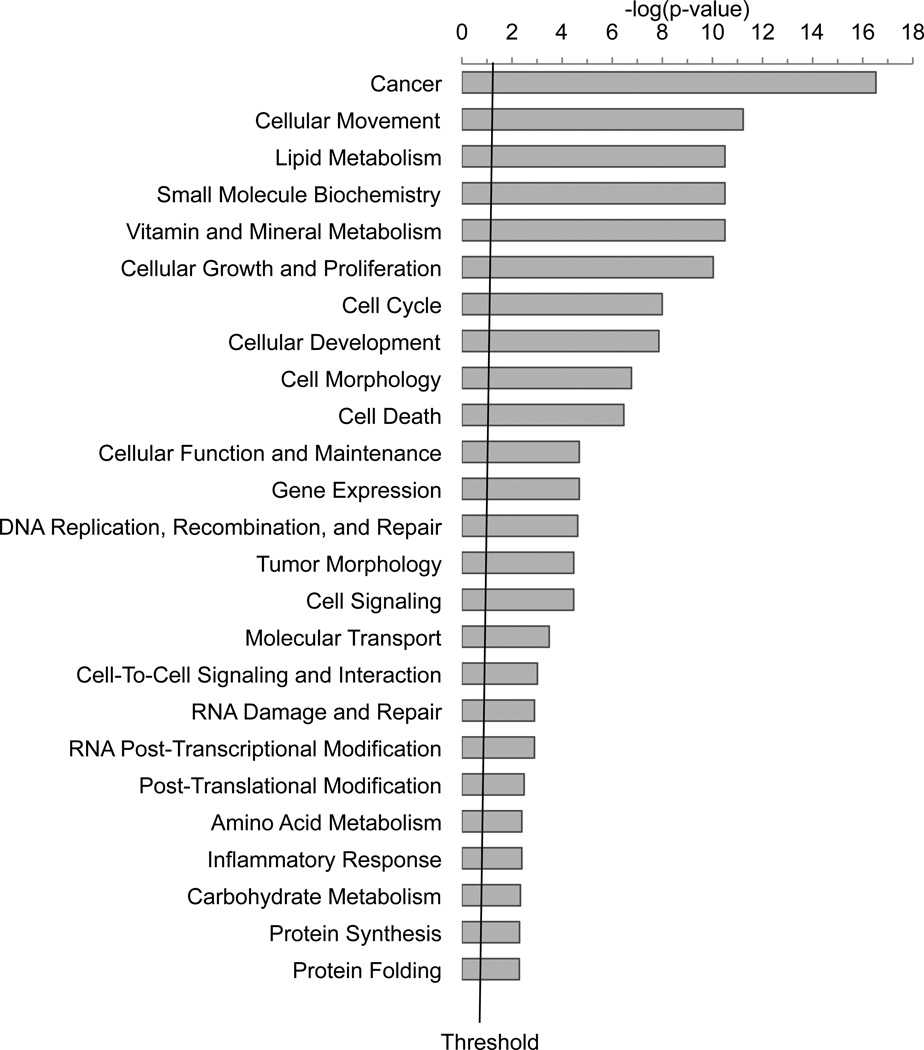
To investigate the biological relevance from the datasets representing altered gene expression after 2d or PG11144 treatment, we conducted a functional pathway analysis using the Ingenuity Pathway Analysis (IPA) application. Seventy of 98 2d-modulated genes and 429 of 477 PG11144 modulated genes were mapped to define genetic networks in the IPA knowledge database. There are 4 and 22 networks, where the score is ≥ 10 (-Log (p-value) ≥10), that are altered by 2d and PG11144, respectively. Among these networks, four of them were altered by both 2d and PG11144. These networks were associated with gene expression, cell death, proliferation and cellular movement/morphology pathways. Representative gene networks that were modulated by 2d and PG11144 are provided in Fig. S1. Fig. S1B, depicts a network centered on MYC and TGFβ. The genes within the network correspond to cell cycle, cellular growth, proliferation and cell death genes. Fig S1F, depicts a network modulated by PG11144 that is associated with cell cycle, cancer and cellular movement genes. These data demonstrate that many of 2d- or PG11144-regulated genes are functionally connected in the form of biologically relevant gene networks and are associated with numerous critical cellular processes (Fig. 4).
Fig. 4.
Functional analysis of genes whose expression is modulated by 2d (A) or PG11144 (B). The bar graphs were identified by Ingenuity Pathway Analysis (IPA). Seventy of 98 2d regulated genes and 427 of 477 PG11144 regulated genes were mapped to defined genetic networks in IPA knowledge database. Fisher’s exact test was used to calculate the significance, p-value. The threshold line shows the cutoff for significance (p-value, 0.05).
qRT-PCR validation of microarray data
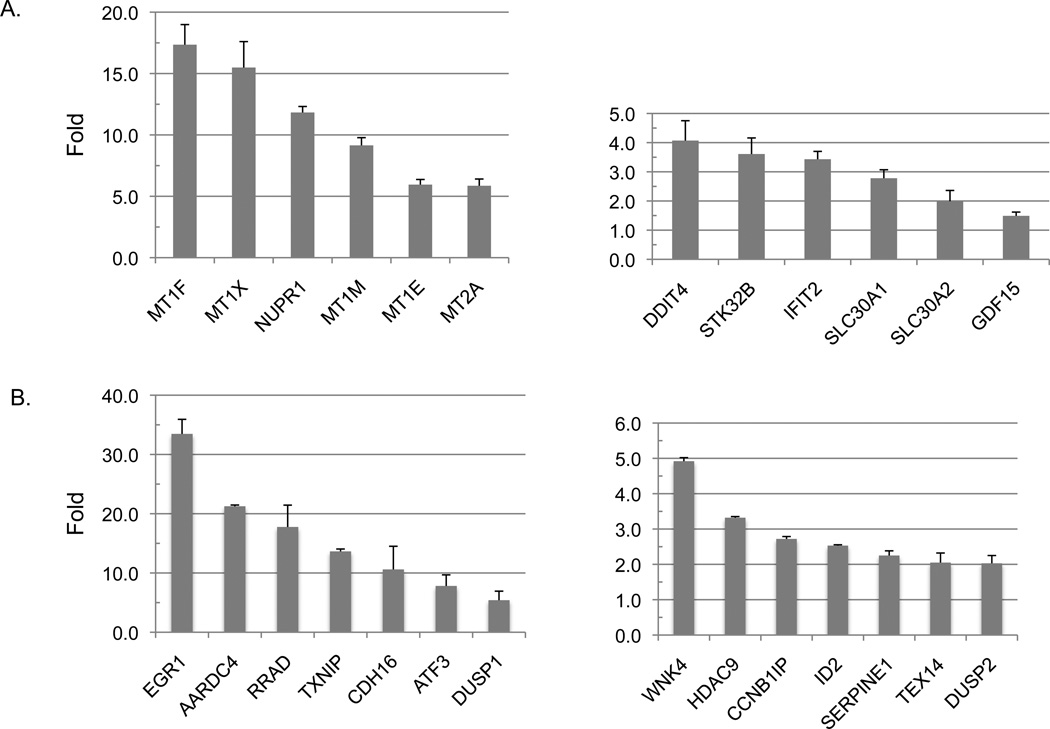
To validate the microarray results, we chose a total of 26 genes whose expression level were either up-regulated by 2d or PG11144 in the microarray analysis. The same set of mRNAs used for microarray analysis was reverse transcribed and qPCR was conducted to measure the gene expression using pairs of gene-specific primers (Table 1). A pair of primers for GAPDH was used for normalization. In the selected 26 genes, half of them were highly induced by 2d or PG11144 (5- to 30-fold induction) and half of them were induced by 1- to 5-fold. Thus the qPCR results were consistent with microarray results for all of the selected 26 candidate genes (Fig. 5).
Fig. 5.
Up-regulated gene expression by 2d and PG11144. Real-time reverse transcription PCR (RT-qPCR) was used to measure relative expression levels compared to untreated sample. 2d and PG11144 up-regulated genes are shown in (A) and (B), respectively. The results are the mean ± S.E. of three independent experiments performed in triplicate.
2d and PG11144 treatment changes chromatin structure
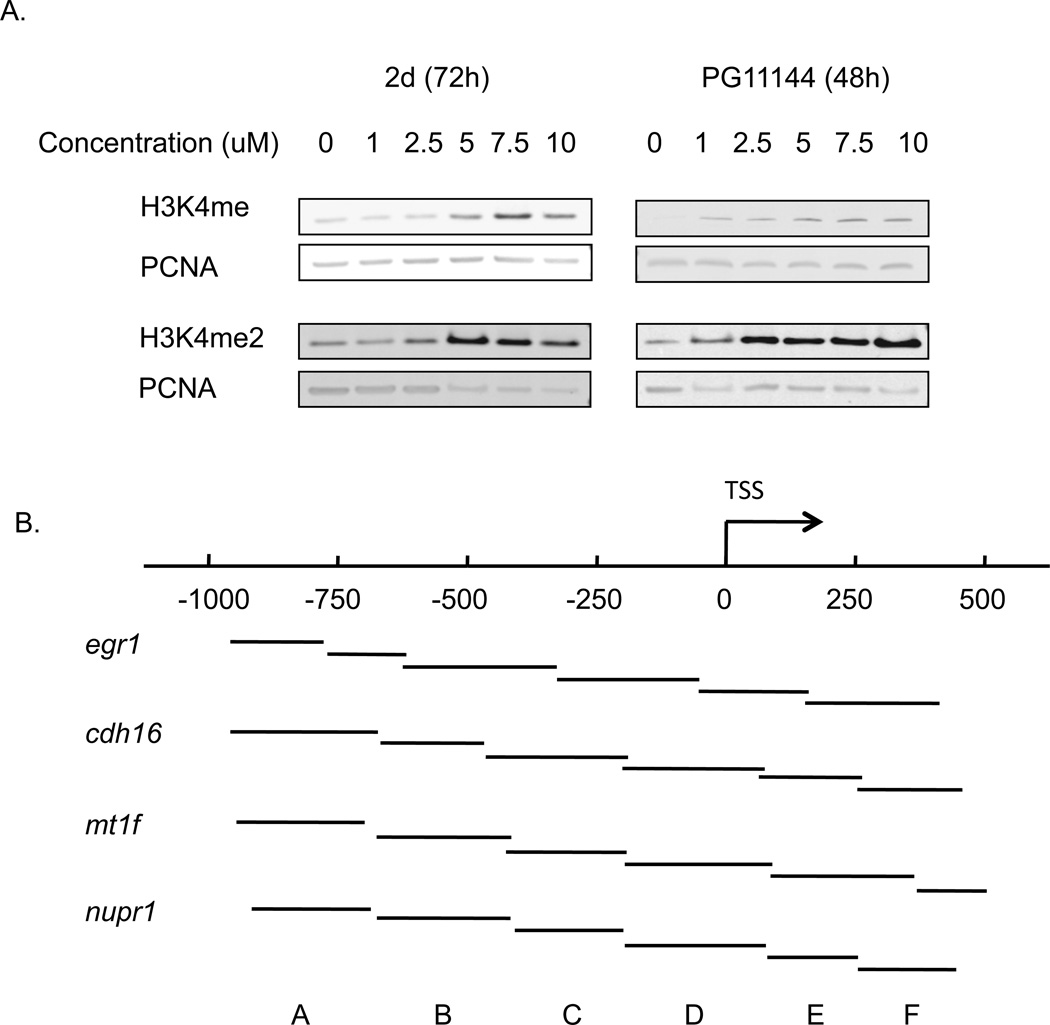
Our previous study demonstrated that treatment of HCT116 human colon adenocarcinoma cells with 2d or PG11144 results in increased H3K4 methylation (Huang et al. 2007; Huang et al. 2009) and re-expression of aberrantly silenced genes. To assess if 2d and PG11144 could inhibit LSD1 activity and affect global H3K4 methylation in MDA-MB-231 cells, cells were exposed to increasing concentrations of 2d or PG11144 for 48 or 72 h, respectively. Treatment with 2d or PG11144 significantly increases both global H3K4me1 and H3K4me2 levels, which are specific substrates of LSD1 (Fig. 6A). These results demonstrate that 2d and PG11144 functionally inhibit LSD1activity in MDA-MB-231 cells.
Fig. 6.
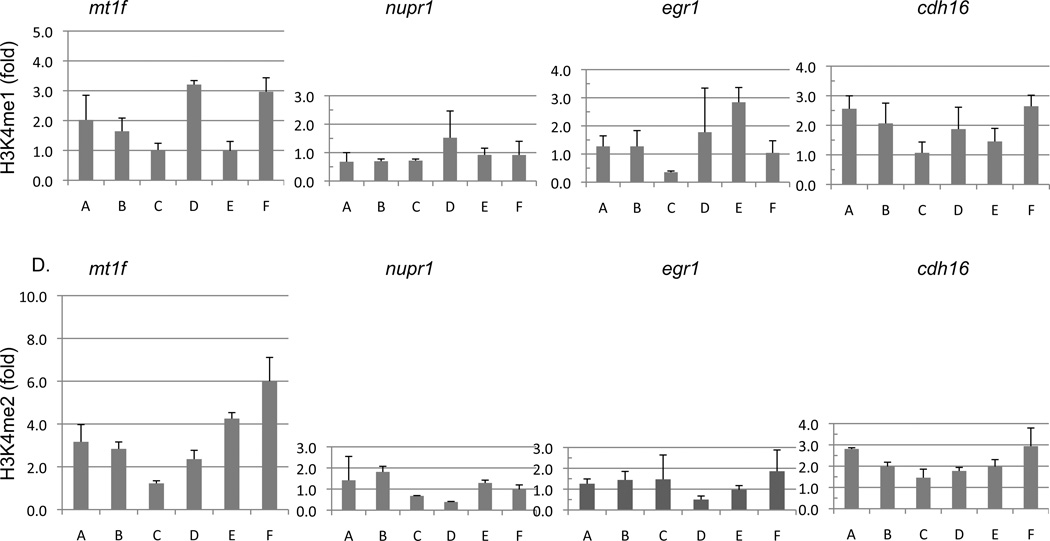
2d and PG11144 treatment alters the global and local level of mono-methylation of lysine 4 of histone 3 (H3K4me) and di-methylation of lysine 4 of histone 3 (H3K4me2). Nuclear histones were prepared from MDA-MB-231 cells after treatment with 5µM 2d or PG11144 for 72h or 48 h, respectively. Proteins were fractionated by NuPAGE and global levels of H3K4me and H3K4me2 were detected with anti-H3K4me and H3K4me2 antibody (A). Six sets of primers (A to E) were designed spanning from −1000 to +500 around the transcription sites of egr1, cdh16, mt1f and nupr1 that were up-regulated by 2d or PG11144 treatment (B). Local H3K4me and H3K4me2 levels around the TSS were measured by chromatin immunoprecipitation followed by qPCR (C) and (D) respectively. The results are the mean ± S.E. of three independent experiments performed in triplicate.
To determine if increased global H3K4 methylation caused by 2d and PG11144 treatment was accompanied by local chromatin changes and changes in gene transcription, we chose 4 genes, mt1f, nupr, egr1, and cdh16, whose expression was induced by 2d or PG11144 to measure the levels of promoter-associated H3K4 methylation. Gene expression of mt1f and nupr1 were induced 18- and 12-fold, respectively, by 2d. The expression of the egr1 and cdh16 genes was up-regulated 33- and 10-fold, respectively, by PG11144 (Fig. 5). Quantitative ChIP analyses were performed to evaluate the effect of LSD1 inhibitors on histone marks in the promoter regions of these genes. Primers spanning the proximal promoter region from approximately −1,000 to +500 bp relative to the transcriptional start site (TSS) (Fig. 6. B) for each gene were designed for use in these analyses. MDA-MB-231 cells were exposed to 5 µM 2d or PG11144 for 24 h and then analyzed for changes in methylation of promoter-associated H3K4. ChIP-qPCR results revealed that 2d or PG11144 induced gene induction was accompanied by increases of H3K4me1 (Fig. 6C) and H3K4me2 (Fig. 6D) at the promoters. The elevated local enrichment of H3K4 methylation is consistent with the findings of up-regulated gene expression and global H3K4 methylation. The H3K4me1 and H3K4me2 around the promoter region of mt1f and cdh16 were significantly increased by 2d and PG11144, respectively. The H3K4me1 and H3K4me2 around the promoter region of nupr1 and egr1 were also increased.
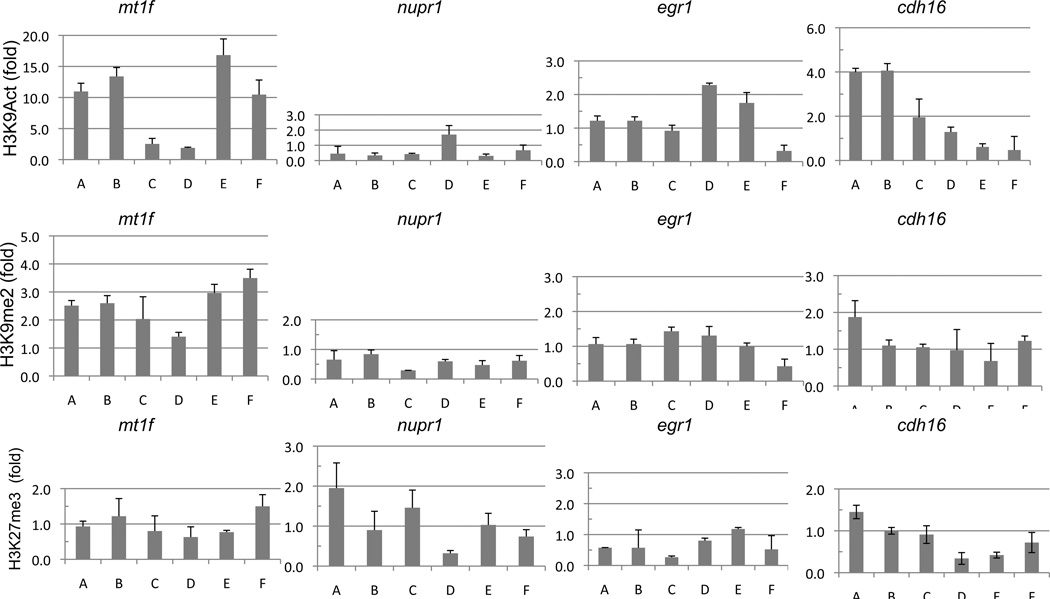
To provide an overall view of the local chromatin modulation by the LSD1-inhibiting analogues, we expanded our CHIP-qPCR analysis to other histone marks. Di-methylation of H3K9 (H3K9me2) has been implicated in heterochromatin formation and gene silencing (Barski et al. 2007). While acetylation of H3K9 (H3K9ac) is enriched in the promoter region of activated genes (Bernstein et al. 2005; Roh et al. 2005; Heintzman et al. 2007). The ChIP-qPCR results show that both 2d and PG11144 enhanced the level of the activating mark, H3K9ac, and decreased the repressive mark, H3K9me2, in the promoter regions of the genes studied, with the exception of mt1f (Fig. 7) where the increase in acetylation of H3K9 was not observed. We also measured the level of the transcriptional repressive polycomb mark, H3K27me3. At the promoter region, treatment with either 2d or PG11144 resulted in a decrease of H3K27me3 occupancy (Fig. 7).
Fig. 7.
2d and PG11144 treatment changes the local level of acetylation of lysine 9 of histone 3 (H3K9Act, top panel), dimethylation of lysine 9 of histone 3 (H3K9me2, middle panel) and tri-methylation of lysine 27 of histone 3 (H3K27me3, bottom panel). MDA-MB-231 cells were treated with 2d or PG11144 for 24h. Local H3K9Act, H3K9me2 and H3K27me3 occupancies around the TSS were measured by CHIP-qPCR. mt1f and nupr1 were up-regulated by 2d and egr1 and cdh16 were up-regulated by PG11144. The results are the mean ± S.E. of three independent experiments performed in triplicate.
Discussion
Endocrine therapy is the front line therapy for the ER-positive breast cancer patients. Unfortunately, about 25% of breast cancer tumors are ER-negative and these tumors are more aggressive and resistant to hormonal therapy (Putti et al. 2005; Carey et al. 2007). The need for new therapeutic targets and new therapeutic strategies is urgent. LDS1 was found to be highly expressed in ER-negative breast cancers and is a predictive marker for tumor progression, suggesting that LSD1 might be a novel epigenetic target for breast cancer therapy (Schulte et al. 2009; Lim et al. 2010). LSD1 functions as a flavin-dependent amine oxidase that catalyzes the removal of mono- and di-methylation of lysine 4 of histone 3 (H3K4me and H3K4me2) (Shi et al. 2004) and it is associated with suppression of transcription. Methylation of histone 3 at lysine 4 is typically linked to active gene transcription. Our previous studies demonstrated that novel classes of polyamine analogues can effectively inhibit LSD1activity and induce re-expression of epigenetically silenced tumor suppressor genes in colorectal cancer cells (Huang et al. 2007; Huang et al. 2009).
In the work presented here, inhibition of LSD1 using novel classes of polyamine analogues was investigated in MDA MB-231 ER-negative breast cancer cells, by both candidate and non-candidate approaches. 2d and PG11144 inhibit MDA-MB-231 cell proliferation in a dose and time dependent manner. Both 2d and PG11144 induce ERα expression alone or in combination with the DNMT inhibitor Aza and/or the HDAC inhibitor MS-275, however, we did not detect a significant up-regulation of ERα expression with these LSD1 inhibitors in our microarray analyses. This is likely due to very low background expression of ERα and lack of sensitivity of the microarray analysis.
Compared with 2d, PG11144 is more potent in growth inhibition in MDA-MB-231 cells, which is consistent with our previous observations (Huang et al. 2003; Huang et al. 2007; Huang et al. 2009). It also appears that PG11144 has a more significant effect on gene expression, as evidenced by the greater number of genes whose expression is altered in response to treatment. This observation could be a result of more efficient in situ inhibition of LSD1, greater inhibition of growth, additional off target effects due to the oligoamine’s greater chromatin binding capabilities, or some combination of these effects (Feuerstein et al. 1991; Basu et al. 1993; Huang et al. 2003). Additionally, it appears that PG11144 has a somewhat greater effect on polyamine homeostasis than 2d. This decrease in polyamines is not a result of significant changes in polyamine catabolism, but is likely due to a result of down regulation of ODC by ODC antizyme as demonstrated by Mitchell and coworker (Mitchell et al. 2002), and as we have previously observed (Huang et al. 2004; Huang et al. 2007). That alterations in polyamine or polyamine analogue content can affect changes in chromatin has been well established. Gilmour and colleagues (Hobbs and Gilmour 2000; Hobbs et al. 2002; Hobbs et al. 2003; Hobbs et al. 2006; Wei et al. 2007) have demonstrated that changes in polyamines can lead to significant changes in chromatin acetylation. More importantly, the oligoamines have been shown to be potent inducers of nucleosomal array oligomerization (Carruthers et al. 2007), thus emphasizing their potential for direct effects on chromatin in addition to inhibition of LSD1. However, additional studies are required to determine the precise basis of the differential effects of these two polyamine analogues.
Inhibition of LSD1 by 2d or PG11144 resulted in significant increases of global H3K4me1 and H3K4me2. The local H3K4 methylation proximal to the transcription start sites of multiple genes was also significantly altered in a biphasic manner typically observed for actively transcribed genes, and is likely the result of a combination of nucleosomal positioning in concert with the repressive and/or activating complexes (Bernstein et al. 2006; Wang et al. 2008). The analogue-induced change in chromatin marks was found to be gene and location specific. However, the general trend was that polyamine analogues enhanced both the global and local level of H3K4me and H3k4me2.
In order to have a better understanding of the local chromatin structure that surrounds the transcription start site region after inhibition of KDM1/LSD1, we measured the levels of the active histone mark H3K9ac and the heterochromatin marks H3K9me2 and H3K27me3. Inhibition of LSD1 leads to changes in the local level of these marks. In our current study, there was no evidence of wholesale inhibition of H3K9 methylation and we only observed a slight increase of H3K9me2 in the promoter of mt1f, but not in the other three genes tested. Although 2d and PG11144 are only known to directly inhibit LSD1 (Huang, et al. 2007; Huang, et al. 2009), it is not surprising that local levels of H3K9ac and H3K27me3 were also changed by inhibiting LSD1. As the inhibition of LSD1 clearly leads to increased expression of specific genes, the likely result is the recruitment of transcriptional activation complexes to the induced genes that contain histone acetyltransferases and JmjC containing demethylases, thereby resulting not only in an increase in the activating H3K4 methylation, but also an increase in the activating H3K9ac mark and a decrease in the repressive H3K9 and H3K27 methyl marks. These results are similar to those observed in cells treated with the DNMT inhibitors leading to the expression of silenced genes (Rhee et al. 2002; McGarvey et al. 2006; McGarvey et al. 2008).
Although the precise mechanisms responsible for changes in gene expression in response to the LSD1-inhibiting polyamine analogues are not entirely known, these analogues demonstrate considerable promise in targeting epigenetic regulation of gene expression in breast cancer. Additionally our results suggest a therapeutic strategy for the treatment of ER-negative breast cancer either by using these analogs alone, or in combination with HDAC and/or DNMT inhibitors, that merits further investigation.
Supplementary Material
Representative gene networks altered by 2d or PG11144. The networks altered by 2d corresponds functionally to cell death, gene expression and carbohydrate metabolism (A); cell cycle, cellular growth and proliferation and cell death (B); cellular growth and proliferation, hematological system development and function, inflammatory response (C). PG11144 changes lipid metabolism, small molecule biochemistry, vitamin and mineral metabolism (D); cell cycle, nutritional disease, cardiovascular disease (E); cancer, cell cycle and cellular movement networks (F).
Acknowledgements
This work was funded by NIH grants CA51085, CA98454, and CA149095, Susan G. Komen for the Cure KG088923, and the Samuel Waxman Cancer Research Foundation.
Abbreviations used
- Aza
5-azacytidine
- LSD1
lysine-specific demethylase 1
- DNMT
DNA methyltransferase
- GAPDH
glyceraldehyde 3-phosphate dehydrogenase
- HDAC
histone deacetylase
- ODC
ornithine decarboxylasae
- H3K4
lysine 4 of histone 3
- H3K9ac
acetylated lysine 9 of histone 3
- H3K27
lysine 27 of histone 3
- me1
monomethyl
- me2
dimethyl
- me3
trimethyl
- ChIP
chromatin immunoprecipitation
- mt1f
metallothionein 1F
- nupr
nuclear protein/transcription regulator 1
- egr1
early growth response 1
- cdh16
cadherin 16/KSP-cadherin
References
- Barski A, Cuddapah S, Cui K, Roh TY, Schones DE, Wang Z, Wei G, Chepelev I, Zhao K. High-resolution profiling of histone methylations in the human genome. Cell. 2007;129:823–837. doi: 10.1016/j.cell.2007.05.009. [DOI] [PubMed] [Google Scholar]
- Basu HS, Pellarin M, Feuerstein BG, Shirahata A, Samejima K, Deen DF, Marton LJ. Interaction of a polyamine analogue, 1,19-bis-(ethylamino)-5,10,15- triazanonadecane (BE-4-4-4-4), with DNA and effect on growth, survival, and polyamine levels in seven human brain tumor cell lines. Cancer Res. 1993;53:3948–3955. [PubMed] [Google Scholar]
- Bernstein BE, Kamal M, Lindblad-Toh K, Bekiranov S, Bailey DK, Huebert DJ, McMahon S, Karlsson EK, Kulbokas EJ, 3rd, Gingeras TR, Schreiber SL, Lander ES. Genomic maps and comparative analysis of histone modifications in human and mouse. Cell. 2005;120:169–181. doi: 10.1016/j.cell.2005.01.001. [DOI] [PubMed] [Google Scholar]
- Bernstein BE, Mikkelsen TS, Xie X, Kamal M, Huebert DJ, Cuff J, Fry B, Meissner A, Wernig M, Plath K, Jaenisch R, Wagschal A, Feil R, Schreiber SL, Lander ES. A bivalent chromatin structure marks key developmental genes in embryonic stem cells. Cell. 2006;125:315–326. doi: 10.1016/j.cell.2006.02.041. [DOI] [PubMed] [Google Scholar]
- Carey LA, Dees EC, Sawyer L, Gatti L, Moore DT, Collichio F, Ollila DW, Sartor CI, Graham ML, Perou CM. The triple negative paradox: primary tumor chemosensitivity of breast cancer subtypes. Clin Cancer Res. 2007;13:2329–2334. doi: 10.1158/1078-0432.CCR-06-1109. [DOI] [PubMed] [Google Scholar]
- Carruthers LM, Marton LJ, Peterson CL. Polyamine analogues: potent inducers of nucleosomal array oligomerization and inhibitors of yeast cell growth. Biochem J. 2007;405:541–545. doi: 10.1042/BJ20061347. [DOI] [PMC free article] [PubMed] [Google Scholar]
- Ferguson AT, Vertino PM, Spitzner JR, Baylin SB, Muller MT, Davidson NE. Role of estrogen receptor gene demethylation and DNA Methyltransferase.DNA adduct formation in 5-aza-2'deoxycytidine-induced cytotoxicity In human breast cancer cells. J.Biol.Chem. 1997;272:32260–32266. doi: 10.1074/jbc.272.51.32260. [DOI] [PubMed] [Google Scholar]
- Feuerstein BG, Williams LD, Basu HS, Marton LJ. Implications and concepts of polyamine-nucleic acid interactions. J Cell Biochem. 1991;46:37–47. doi: 10.1002/jcb.240460107. [DOI] [PubMed] [Google Scholar]
- Heintzman ND, Stuart RK, Hon G, Fu Y, Ching CW, Hawkins RD, Barrera LO, Van Calcar S, Qu C, Ching KA, Wang W, Weng Z, Green RD, Crawford GE, Ren B. Distinct and predictive chromatin signatures of transcriptional promoters and enhancers in the human genome. Nat Genet. 2007;39:311–318. doi: 10.1038/ng1966. [DOI] [PubMed] [Google Scholar]
- Hobbs CA, Gilmour SK. High levels of intracellular polyamines promote histone acetyltransferase activity resulting in chromatin hyperacetylation. J Cell Biochem. 2000;77:345–360. [PubMed] [Google Scholar]
- Hobbs CA, Paul BA, Gilmour SK. Deregulation of polyamine biosynthesis alters intrinsic histone acetyltransferase and deacetylase activities in murine skin and tumors. Cancer Res. 2002;62:67–74. [PubMed] [Google Scholar]
- Hobbs CA, Paul BA, Gilmour SK. Elevated levels of polyamines alter chromatin in murine skin and tumors without global changes in nucleosome acetylation. Exp Cell Res. 2003;290:427–436. doi: 10.1016/s0014-4827(03)00352-5. [DOI] [PubMed] [Google Scholar]
- Hobbs CA, Wei G, DeFeo K, Paul B, Hayes CS, Gilmour SK. Tip60 protein isoforms and altered function in skin and tumors that overexpress ornithine decarboxylase. Cancer Res. 2006;66:8116–8122. doi: 10.1158/0008-5472.CAN-06-0359. [DOI] [PubMed] [Google Scholar]
- Huang Y, Hager E, Phillips D, Dunn V, Hacker A, Frydman B, Kink J, Valasinas A, Reddy V, Marton L, Casero R, Jr, Davidson N. A novel polyamine analog inhibits growth and induces apoptosis in human breast cancer cells. Clin Cancer Res. 2003;9:2769–2777. [PMC free article] [PubMed] [Google Scholar]
- Huang Y, Hager ER, Phillips DL, Dunn VR, Hacker A, Frydman B, Kink JA, Valasinas AL, Reddy VK, Marton LJ, Casero RA, Jr, Davidson NE. A novel polyamine analog inhibits growth and induces apoptosis in human breast cancer cells. Clin Cancer Res. 2003;9:2769–2777. [PMC free article] [PubMed] [Google Scholar]
- Huang Y, Keen JC, Hager E, Smith R, Hacker A, Frydman B, Valasinas AL, Reddy VK, Marton LJ, Casero RA, Jr, Davidson NE. Regulation of polyamine analogue cytotoxicity by c-Jun in human MDA-MB-435 cancer cells. Mol Cancer Res. 2004;2:81–88. [PubMed] [Google Scholar]
- Huang Y, Greene E, Murray Stewart T, Goodwin AC, Baylin SB, Woster PM, Casero RA., Jr Inhibition of lysine-specific demethylase 1 by polyamine analogues results in reexpression of aberrantly silenced genes. Proc Natl Acad Sci U S A. 2007;104:8023–8028. doi: 10.1073/pnas.0700720104. [DOI] [PMC free article] [PubMed] [Google Scholar]
- Huang Y, Stewart TM, Wu Y, Baylin SB, Marton LJ, Perkins B, Jones RJ, Woster PM, Casero RA., Jr Novel oligoamine analogues inhibit lysine-specific demethylase 1 and induce reexpression of epigenetically silenced genes. Clin Cancer Res. 2009;15:7217–7228. doi: 10.1158/1078-0432.CCR-09-1293. [DOI] [PMC free article] [PubMed] [Google Scholar]
- Kabra PM, Lee HK, Lubich WP, Marton LJ. Solid-phase extraction and determination of dansyl derivatives of unconjugated and acetylated polyamines by reversed-phase liquid chromatography: improved separation systems for polyamines in cerebrospinal fluid, urine and tissue. J Chromatogr. 1986;380:19–32. doi: 10.1016/s0378-4347(00)83621-x. [DOI] [PubMed] [Google Scholar]
- Kondo Y, Shen L, Issa JP. Critical role of histone methylation in tumor suppressor gene silencing in colorectal cancer. Mol Cell Biol. 2003;23:206–215. doi: 10.1128/MCB.23.1.206-215.2003. [DOI] [PMC free article] [PubMed] [Google Scholar]
- Lim S, Janzer A, Becker A, Zimmer A, Schule R, Buettner R, Kirfel J. Lysine-specific demethylase 1 (LSD1) is highly expressed in ER-negative breast cancers and a biomarker predicting aggressive biology. Carcinogenesis. 2010;31:512–520. doi: 10.1093/carcin/bgp324. [DOI] [PubMed] [Google Scholar]
- McGarvey K, Fahrner J, Greene E, Martens J, Jenuwein T, Baylin S. Silenced tumor suppressor genes reactivated by DNA demethylation do not return to a fully euchromatic chromatin state. Cancer Res. 2006;66:3541–3549. doi: 10.1158/0008-5472.CAN-05-2481. [DOI] [PubMed] [Google Scholar]
- McGarvey KM, Van Neste L, Cope L, Ohm JE, Herman JG, Van Criekinge W, Schuebel KE, Baylin SB. Defining a chromatin pattern that characterizes DNA-hypermethylated genes in colon cancer cells. Cancer Res. 2008;68:5753–5759. doi: 10.1158/0008-5472.CAN-08-0700. [DOI] [PMC free article] [PubMed] [Google Scholar]
- Mitchell JL, Leyser A, Holtorff MS, Bates JS, Frydman B, Reddy VK, Marton LJ. Antizyme induction by polyamine analogues as a factor in cell growth inhibition. Biochem J. 2002;366:663–671. doi: 10.1042/BJ20011612. [DOI] [PMC free article] [PubMed] [Google Scholar]
- Ottaviano YL, Issa JP, Parl FF, Smith HS, Baylin SB, Davidson NE. Methylation of the estrogen receptor gene CpG island marks loss of estrogen receptor expression in human breast cancer cells. Cancer Research. 1994;54:2552–2555. [PubMed] [Google Scholar]
- Putti TC, El-Rehim DM, Rakha EA, Paish CE, Lee AH, Pinder SE, Ellis IO. Estrogen receptor-negative breast carcinomas: a review of morphology and immunophenotypical analysis. Mod Pathol. 2005;18:26–35. doi: 10.1038/modpathol.3800255. [DOI] [PubMed] [Google Scholar]
- Rhee I, Bachman KE, Park BH, Jair KW, Yen RW, Schuebel KE, Cui H, Feinberg AP, Lengauer C, Kinzler KW, Baylin SB, Vogelstein B. DNMT1 and DNMT3b cooperate to silence genes in human cancer cells. Nature. 2002;416:552–556. doi: 10.1038/416552a. [DOI] [PubMed] [Google Scholar]
- Roh TY, Cuddapah S, Zhao K. Active chromatin domains are defined by acetylation islands revealed by genome-wide mapping. Genes Dev. 2005;19:542–552. doi: 10.1101/gad.1272505. [DOI] [PMC free article] [PubMed] [Google Scholar]
- Schulte JH, Lim S, Schramm A, Friedrichs N, Koster J, Versteeg R, Ora I, Pajtler K, Klein-Hitpass L, Kuhfittig-Kulle S, Metzger E, Schule R, Eggert A, Buettner R, Kirfel J. Lysine-specific demethylase 1 is strongly expressed in poorly differentiated neuroblastoma: implications for therapy. Cancer Res. 2009;69:2065–2071. doi: 10.1158/0008-5472.CAN-08-1735. [DOI] [PubMed] [Google Scholar]
- Shi Y, Lan F, Matson C, Mulligan P, Whetstine J, Cole P, Casero R, Shi Y. Histone demethylation mediated by the nuclear amine oxidase homolog LSD1. Cell. 2004;119:941–953. doi: 10.1016/j.cell.2004.12.012. [DOI] [PubMed] [Google Scholar]
- Snowden AW, Gregory PD, Case CC, Pabo CO. Gene-specific targeting of H3K9 methylation is sufficient for initiating repression in vivo. Curr Biol. 2002;12:2159–2166. doi: 10.1016/s0960-9822(02)01391-x. [DOI] [PubMed] [Google Scholar]
- Wang Z, Zang C, Rosenfeld JA, Schones DE, Barski A, Cuddapah S, Cui K, Roh TY, Peng W, Zhang MQ, Zhao K. Combinatorial patterns of histone acetylations and methylations in the human genome. Nat Genet. 2008;40:897–903. doi: 10.1038/ng.154. [DOI] [PMC free article] [PubMed] [Google Scholar]
- Wang Z, Zang C, Cui K, Schones DE, Barski A, Peng W, Zhao K. Genome-wide mapping of HATs and HDACs reveals distinct functions in active and inactive genes. Cell. 2009;138:1019–1031. doi: 10.1016/j.cell.2009.06.049. [DOI] [PMC free article] [PubMed] [Google Scholar]
- Wei G, Hobbs CA, Defeo K, Hayes CS, Gilmour SK. Polyamine-mediated regulation of protein acetylation in murine skin and tumors. Mol Carcinog. 2007;46:611–617. doi: 10.1002/mc.20350. [DOI] [PubMed] [Google Scholar]
- Wolffe AP, Matzke MA. Epigenetics: regulation through repression. Science. 1999;286:481–486. doi: 10.1126/science.286.5439.481. [DOI] [PubMed] [Google Scholar]
- Yan L, Nass SJ, Smith D, Nelson WG, Herman JG, Davidson NE. Specific Inhibition of DNMT1 by Antisense Oligonucleotides Induces Re-expression of Estrogen Receptor-alpha (ER) in ER-Negative Human Breast Cancer Cell Lines. Cancer Biol Ther. 2003;2:552–556. doi: 10.4161/cbt.2.5.469. [DOI] [PubMed] [Google Scholar]
- Yang X, Phillips DL, Ferguson AT, Nelson WG, Herman JG, Davidson NE. Synergistic activation of functional estrogen receptor (ER)-alpha by DNA methyltransferase and histone deacetylase inhibition in human ER-alpha-negative breast cancer cells. Cancer Res. 2001;61:7025–7029. [PubMed] [Google Scholar]
Associated Data
This section collects any data citations, data availability statements, or supplementary materials included in this article.
Supplementary Materials
Representative gene networks altered by 2d or PG11144. The networks altered by 2d corresponds functionally to cell death, gene expression and carbohydrate metabolism (A); cell cycle, cellular growth and proliferation and cell death (B); cellular growth and proliferation, hematological system development and function, inflammatory response (C). PG11144 changes lipid metabolism, small molecule biochemistry, vitamin and mineral metabolism (D); cell cycle, nutritional disease, cardiovascular disease (E); cancer, cell cycle and cellular movement networks (F).


