

Abstract
Kidney diseases manifest in progressive loss of renal function, which ultimately leads to complete kidney failure. The mechanisms underlying the origins and progression of kidney diseases are not fully understood. Multiple factors involved in the pathogenesis of kidney diseases have made the traditional candidate gene approach of limited value toward full understanding of the molecular mechanisms of these diseases. A systems biology approach that integrates computational modeling with large-scale data gathering of the molecular changes could be useful in identifying the multiple interacting genes and their products that drive kidney diseases. Advances in biotechnology now make it possible to gather large data sets to characterize the role of the genome, epigenome, transcriptome, proteome, and metabolome in kidney diseases. When combined with computational analyses, these experimental approaches will provide a comprehensive understanding of the underlying biological processes. Multiscale analysis that connects the molecular interactions and cell biology of different kidney cells to renal physiology and pathology can be utilized to identify modules of biological and clinical importance that are perturbed in disease processes. This integration of experimental approaches and computational modeling is expected to generate new knowledge that can help to identify marker sets to guide the diagnosis, monitor disease progression, and identify new therapeutic targets.
Keywords: cell signaling, gene transcription, kidney disease, microarray analysis, protein interaction
Most kidney diseases have complex pathogenesis involving the interplay of genetic and environmental factors. Diagnostic and treatment decisions are typically based on kidney histology, a limited set of serologic markers, and clinical manifestations of the disease. Currently, we do not have sufficiently sensitive or specific tests to detect early disease, predict disease progression, or monitor treatment response. Previous studies have identified many candidate genes involved in the pathogenesis of kidney diseases. Although many of these genes have important roles in disease progression and pathophysiology, they do not independently serve as reliable indicators of the clinical disease state and progression rate. Many important questions regarding kidney diseases remain unanswered: What are the temporal and causal relationships between glomerular and tubular injuries? What are the interactions and temporal relationships among podocyte, mesangial, and endothelial cell injuries? Why proteinuria does not always correlate with the decline of kidney function? What are the drivers of kidney disease progression? To address these complex questions, it is critical to understand the regulatory networks that underlie the functions of and interactions between various types of cells within the kidney. Such an understanding is best obtained from studying the regulatory networks within and between cells. Systems biology allows us to analyze these regulatory networks in a temporal and spatial manner. Detailed characterization of kidney diseases at the systems level could yield the needed integrative knowledge to better understand the molecular relationships underlying the pathogenesis of different types of kidney diseases, to develop more reliable biomarker sets for diagnosis and treatment, and to personalize the care of individual patients.
With the advent of next-generation sequencing technologies and methods to identify molecular species and interactions at the genome-wide scale, it is theoretically feasible to generate a global picture of cellular functions in the kidney from a molecular perspective and to link phenotype to the molecular networks that govern pathophysiological changes. This approach presents an opportunity to identify the key pathways and genes operative in disease and health and to characterize mechanistic details that contribute to the phenotype of the disease. In addition, the ability to collect genomic data on individual patients in a more affordable and expeditious manner allows us to better elucidate the role of genomic variation in disease manifestation under varying environmental conditions.
The field of systems biology has grown in the past decade because of the development of new experimental and computational tools that enable us to connect gene–cell– organ regulatory mechanisms at multiple scales and integrate findings from molecular and cell biology with kidney structure and function. Here, we provide an overview of systems biology approaches applied to the study of kidney diseases. We focus on the rationale rather than the detailed methodology of these approaches and provide salient examples in which systems biology approaches have advanced our understanding of kidney diseases. Limitations of current applications of systems biology in kidney disease are also discussed. Through this review, we hope that both clinicians and researchers could better understand the rationale and appreciate the potential of systems biology approaches, and that researchers could gain additional knowledge on the advantages, limitations, and applications of systems biology approaches in the study of kidney diseases.
Experimental Approaches
A unique identifiable characteristic of experimental approaches used in systems biology is the capacity to measure multiple entities simultaneously. Genomics, transcriptomics, proteomics, metabolomics, and other genome-wide-scale experimental methods referred to as ‘omics’ technologies are capable of measuring changes in a large number of components and interactions to provide an overview of different conditions: healthy versus diseased state, before versus after drug treatment, and one cell type versus another. Data from these experiments are analyzed to identify groups of components and patterns of interactions that change upon perturbation. Databases that integrate and organize data from such omics-type profiling experiments, focused on the kidney, are available. The different regulatory layers of data can be classified as genomics, epigenomics, DNA/transcription factor regulomics, transcriptomics, proteomics, kinomics, and metabolomics (summarized in Figure 1). Specific examples of omic-level analysis related to the kidney are presented in Table 1. Major advantages and limitations of omic approaches are summarized in Table 2. Online repositories and catalogs of omic-level data sets and studies are listed in Table 3.
Figure 1. ‘Omic’ approaches to profile cellular processes.
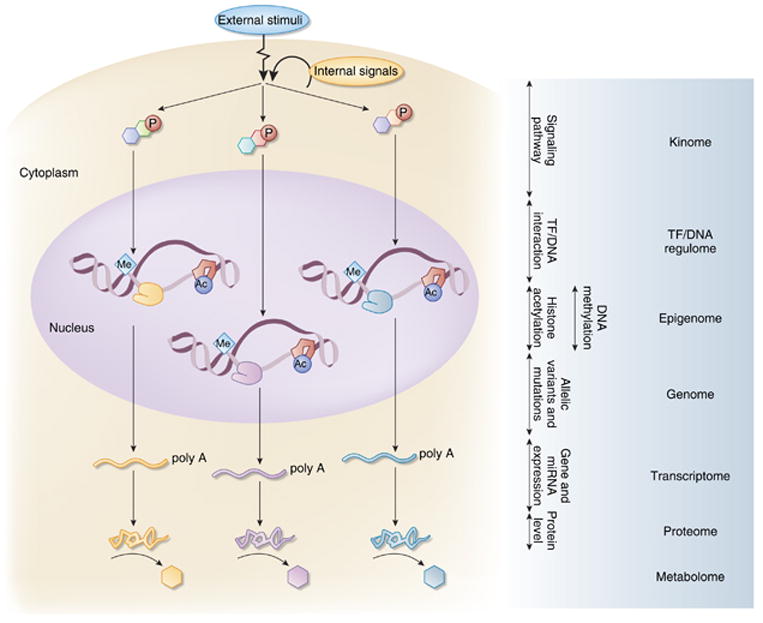
Both external stimuli and internal signals can initiate the activation of downstream signaling pathways through post-transcriptional modification of signaling molecules, such as protein kinases, by phosphorylation. Activation of the signaling cascade leads to either transcriptional activation by recruitment and assembly of the transcriptional complex on the DNA, transcription factor/DNA (TF/DNA) interaction, or inhibition of transcriptional activation by exclusion of key TFs from the complex. Covalent modifications of the DNA by methylation and of histones by acetylation have a major role in the regulation of gene expression. Variations in the coding region of the genome result in mutations of the gene transcripts, and changes in non-coding region could affect the regulation of gene expression. Gene transcripts as messenger RNAs in the cytoplasm are translated into proteins. The protein products synthesized in response to the initial signal serve to maintain cellular integrity and react to perturbations in the systems by initiating additional signals or catalyze reactions that generate specific metabolites as a by-product. Characterization of these processes at the systems level is known as the ‘omics’ approaches: kinome for phosphorylation of proteins, TF/DNA regulome for regulation of transcription by the interaction of TF with DNA, epigenome for modification of histones and DNA, genome for the sequence of DNA, transcriptome for the mRNA transcripts of the expressed genes, proteome for the protein composition, and metabolome for the metabolites that are generated in a specific tissue or cell (Red P = phosphorylation, Me=methylation, Ac = acetylation, line with poly A tail=mRNA). miRNA, microRNA.
Table 1. Specific examples of omic-level analysis in nephrology.
| Omic approaches | Methods | Reference | Brief description of the results | Disease/biological process | Animal and/or human |
|---|---|---|---|---|---|
| Genomic | GWAS and admixture linkage-based approaches | Kottgen et al.2 | Identified genetic susceptibility loci for GFR and CKD by GWAS in population cohorts. | CKD | Human |
| Pezzolesi et al.3 | Identified two susceptibility loci for the development of DN in a cohort of patient with type 1 diabetes using a GWA scan. | DN | Human | ||
| Schelling et al.4 | Discovered multiple chromosomal regions that are linked to GFR as a quantitative trait by admixture linkage analysis in diabetic sibpairs from different ethnic backgrounds recruited for the Family Investigation of Nephropathy and Diabetes study. | DN | Human | ||
| Feehally et al.5 | Identified a region of the MHC locus to be associated with IgA nephropathy using both family-based association and case-based analyses. | IgA | Human | ||
| Kao et al.6 | A region of chromosome 22q12, which includes MYH9, is associated with excess African ancestry and nondiabetic ESRD by admixture mapping. Several SNPs in MYH9 accounts for a large percentage of the risk for ESRD observed in African Americans. | CKD in African American | Human | ||
| Kopp et al.7 | Identified a strong linkage disequilibrium that centered on MYH9 in a region of ch22 using an admixture-mapping genome scan on African Americans with FSGS and controls. | CKD in African American | Human | ||
| Genovese et al.8 | Identified genetic variants in the region of ch22 containing part of the MYH9 and APOL1 genes associated with increased risk of FSGS in African Americans, but not in European Americans. | CKD in African American | Human | ||
| Papeta et al.13 | eQTL analysis of podocyte genes in a murine model of HIVAN revealed that HIV-1 transgene expression interferes with the expression of a podocyte-specific gene, Nphs2, which is controlled by other loci in the genome that had been previously shown to confer susceptibility to the development of HIVAN in mice. | HIVAN | Animal | ||
| Transcriptomic | Expression profiling by microarray | Baelde et al.117 | Identified 615 differentially expressed mRNAs that are involved in cytoskeleton formation and tissue injury repair machinery by comparing the gene expression profile of glomerular RNA isolated from two patients with DN and two normal patients. | DN | Human |
| Berthier et al.18 | Gene expression profiling was performed on kidney biopsy samples from control subjects and early and progressive type 2 DN, as well as kidney samples from two murine models of diabetic nephropathy. Janus kinase–signal transducer and activator of transcription pathway was highly regulated in the glomeruli and tubulointerstitial samples from human with DN, but not murine models of DN. | DN | Human, animal | ||
| Moczulski et al.118 | mRNA expression profiles of peripheral blood mononuclear cells from type I diabetic patients with and without DN were determined. The expression of 198 candidate genes suggested to be involved in DN from previous publications was analyzed. Thrombospondin 1 and cyclooxygenase were overexpressed, but matrix metalloproteinase 9 and cyclooxygenase 2 genes were underexpressed in patients with DN. | DN | Human | ||
| Hodgin et al.19 | Glomeruli mRNA from formalin-fixed and paraffin-embedded biopsy samples of 21 patients with biopsy-proven MCD, FSGS, or collapsing variant of FSGS and normal renal biopsies were profiled by microarray. Class comparison analysis of FSGS + collapsing FSGS combined versus normal + MCD revealed 316 differentially regulated genes, including podocyte slit diaphragm genes. Genes involved in development, differentiation, and morphogenesis, cell motility and migration, cytoskeleton organization, and signal transduction are overrepresented in this list of differentially regulated genes. | Glomerular diseases (MCD, FSGS, collapsing FSGS) | Human | ||
| Peterson et al.20 | Microarray analysis of isolated glomeruli from patients with proliferative lupus GN revealed significant heterogeneity in transcript expression between samples. Four gene clusters from the expression profiling identified the presence of B cells, several myelomonocytic lineages, fibroblast and epithelial cell proliferation, matrix alterations, and expression of type I IFN-inducible genes. | Proliferative lupus GN | Human | ||
| Ju et al.21 | Expression profiling on kidneys of TGF-β 1 transgenic (Tg) mice identified 43 genes that were able to discriminate kidneys based on the severity of glomerular cell apoptosis. Expression profiles of human orthologs of these 43 genes in human kidney biopsies were significantly related to the kidney function. Protein expression patterns of selected genes were validated by immunohistochemistry in Tg mice and patients with IgA nephropathy and CKD. | TGF-β 1 transgenic model of CKD, IgA | Animal, human | ||
| Bhavnani et al.22 | Expression profiles of microdissected renal tubules from kidney biopsy of 106 patients with renal disease were determined. Network visualization and topology analysis were applied to the expression profiles of each renal disease to determine the relationship between disease, genes, and regulation of genes. Results suggest that many genes associated with a single disease and fewer genes associated with many diseases. There are unexpected combinations of renal diseases that share relatively large numbers of genes. For instance, FSGS, which is believed to be predominantly a non-inflammatory process, shares more genes with SLE, which is a predominantly an inflammatory process, than with another non-inflammatory disease such as membranous glomerulopathy. | IgAN, SLE, FSGS, MGN, MCD, TMD, DN | Human | ||
| Teramoto et al.24 | Gene expression analysis of microdissected glomeruli from a murine model of SLE revealed upregulation of genes encoding for complement proteins, adhesion molecules, chemokines and receptors, and antigen-presenting machinery. Genes involved in Th1 response and induced by interferon-gamma were observed. | SLE | Animal | ||
| Susztak et al.23 | Microarray and phenotype analysis were performed on two murine models of DN. Weighted vote-based supervised analytical methods were used to identify genes whose expression can classify samples based on the presence or absence of mesangial matrix expansion. Hydroxysteroid dehydrogenase-3β isotype 4 and osteopontin were lead classifier genes. | DN | Animal | ||
| Schmid et al.30 | mRNA expression screening of the tubulointerstitial compartments of human renal biopsies combined with hypothesis-driven pathway analysis were used to evaluate pathogenic factors implicated in DN. A specific NF-κB promoter module was identified in the promoter regions of regulated NF-κB targets. | DN | Human | ||
| Wiggins et al.25 | Gene expression patterns of aging in the rat glomeruli resembled atherosclerosis. Authors identified and confirmed NF-κB as a likely transcriptional regulator of these events. | Aging | Animal | ||
| Godwin et al.37 | Global miRNA expression analysis was performed on kidneys of mice that underwent unilateral warm ischemia. Nine differentially expressed miRNAs were identified. | Renal ischemia reperfusion injury | Animal | ||
| Epigenomic | Kikuchi et al.33 | To determine DNA methylation-dependent regulation of gene silencing as the mechanism of differential expression of organic anion transporters in the liver and kidney, the authors profiled the region near the transcription start sites of mouse solute carrier transporters for tissue-dependent differentially methylated regions. A role of DNA methylation in the kidney-specific expression of amino acid transporters was identified. | Differential expression of organic anion transporters in the liver and kidney | Animal | |
| Bechtel et al.34 | Genome-wide methylation screen was performed on fibroblasts isolated from fibrotic and nonfibrotic kidneys. RASAL1, encoding an inhibitor of the Ras oncoprotein, is hypermethylated in fibroblasts from fibrotic kidneys. Hypermethylation of RASAL1 is associated with the perpetuation of fibroblast activation and fibrogenesis in the kidney. | Kidney fibrogenesis | Human, animal | ||
| Proteomic | DIGE | Sharma et al.119 | DIGE was used to study the urine of three DN patients. Alpha 1 antitrypsin (AAT) was found to be higher in the urine of diabetic patients. Immunostaining for AAT is increased in fibrotic regions of the kidneys. | DN | Human |
| Rao et al.120 | DIGE-based analysis of urine from controls and type 2 diabetic patients with normoalbuminuria, microalbuminuria, and macroalbuminuria identified 62 unique proteins. Eleven proteins were differentially regulated with progressive albuminuria. | DN | Human | ||
| Mass spectroscopy | Mischak et al.121 | Urinary polypeptide patterns from normal and type 2 diabetic patients were compared by capillary electrophoresis–mass spectrometry. A specific polypeptide pattern was observed in patients with albumin excretion rate > 100mg albumin/l and to a lesser degree in patients with lower rates of albumin excretion. | DN | Human | |
| Kim et al.122 | 2D gel electrophoresis was used to identify serum protein markers that can predict the progressive nephropathy in type 2 diabetic patients (normo- and microalbuminuria, and those with chronic renal failure). Serum proteins were further selected and identified by ESI-Q-TOF mass spectrometry. Serum extracellular glutathione peroxidase and apolipoprotein E were identified as potential serum biomarkers for the diagnosis of type 2 diabetics with nephropathy. | DN | Human | ||
| Meier et al.123 | High-resolution capillary electrophoresis coupled to mass spectrometry was used to investigate urinary polypeptides and proteins from type 1 diabetic patient. Clusters of polypeptides were identified in diabetic patients. Specific polypeptide patterns characteristic for healthy controls and diabetic patients and subdivision of patients were observed. | DN | Human |
Abbreviations: CKD, chronic kidney disease; DIGE, differential in gel electrophoresis; DN, diabetic nephropathy; ESRD, end-stage renal disease; eQTL, expression quantitative trait locus; FSGS, focal segmental glomerulosclerosis; GFR, glomerular filtration rate; GN, glomerulonephritis; GWAS, genome-wide association study; HIVAN, HIV-1-associated nephropathy; IgA, immunoglobulin A; IgAN, immunoglobulin A nephritis; IFN, interferon; MCD, minimal change disease; MGN, membranous glomerulonephritis; MHC, major histocompatibility complex; miRNA, micro ribonucleic acid; mRNA, messenger ribonucleic acid; NF-κB, nuclear factor kappa B; SLE, systemic lupus erythematosus; SNP, single-nucleotide polymorphism; TGF-β 1, transforming growth factor beta 1; TMD, thin basement membrane disease.
Table 2. Advantages and limitations of systems biology approaches.
| Advantages | Limitations | |
|---|---|---|
| Genomics | Potential for early detection and risk prediction of disease | Large sample size and cost required for genomic studies |
| Provide the molecular basis for rational drug design | Extreme multiple testing with predisposition of false positives | |
| Understand why different individuals respond differently to the same drugs and allow prediction of response to therapy (pharmacogenomics). | Relatively low coverage of the genotyping platforms, particularly in regions with high levels of genetic heterogeneity | |
| For most complex traits identified in humans, the sum of genetic effects comprises less than half of the total trait heritability. | ||
| Epigenomics (DNA methylation, histone modification) | Provide information on the regulation of gene expression that cannot be captured by gene expression profiles | The ‘histone code’ is not fully deciphered |
| Relatively large amount of specimen (DNA, chromatin) is required | ||
| Potential for earlier disease detection as methylation changes occurs early and frequently in certain biological processes (i.e., tumorigenesis) | Several different assays may be required to study different types of epigenetic changes (DNA methylation, histone acetylation, and methylation) | |
| Epigenomic profiles are relatively stable and resistant to changes in physiological state or sample-collection changes. | Cell and tissue specificity of epigenetic modifications would require sample collection from the diseased organ | |
| Difficulties with determining a reference cell epigenomic state as epigenetic modifications are variable across cell type, differentiation state, hormonal, and environmental conditions. | ||
| Transcriptomics (mRNA and miRNA) | More affordable compared with other omics assays | mRNA transcript level does not necessarily correspond to protein level or activity |
| Standardized experimental methodology | ||
| Availability of tissue- and disease-specific data sets for comparison | Analytical tools to extrapolate expression to upstream signaling pathway activation are not standardized nor reliable | |
| Microarrays provide comprehensive coverage of the cellular transcriptomic repertoire. | Incomplete knowledge of gene targets regulated by a given miRNA and computational prediction of miRNAs targets are not exact. | |
| Protein-DNA regulomics | Provides information on the regulation of gene expression by DNA binding proteins (including transcription factors) and upstream signaling pathways | ChIP is not a functional assay therefore does not provide functional significance (e.g., enrichment of DNA fragments that are located near a protein does not necessarily reflect either activation or repression of transcription of the associated gene) |
| Allows true genome-wide discovery of protein bindings sites on DNA without comprehensive previous knowledge of genomic sequences | ||
| Relatively low sample input amount required (50 ng of fragmented, ChIP-enriched DNA). | Immunoprecipitation-based assay is heavily dependent on the availability and quality of specific antibodies | |
| ChIP assay often provides low signals in comparison with negative controls, which can lead to false negative or inconclusive results (e.g., low signal/noise ratio). | ||
| Proteomics (urine proteome and kidney proteome) | Urine proteins are relatively stable | Quality and quantity of urine proteins are affected by diet and exercise |
| Non-invasive, repeat sampling of urine is feasible | ||
| Urine contains fewer proteins than serum | Higher amount of urine protein in disease could bias results (e.g., nephrotic range proteinuria) | |
| Potentially more reflective of phenotype. | Proteomic analysis of kidney tissue might not be possible using percutaneous biopsy samples due to limitation in sample quantity | |
| Sample storage, preparation and analysis could affect results | ||
| Low-abundance proteins are not well characterized withavailable methods. | ||
| Metabolomics | Potentially more reflective of the phenotype. | Not yet validated in kidney disease. |
Abbreviations: ChIP, chromatin immunoprecipitation; miRNA, microRNA; mRNA, messenger RNA.
Table 3. Online resources.
| Omics repositories: | National Human Genome Research Institute, Office of Population Genomics (http://www.genome.gov/gwastudies/) | A catalog of GWAS publications to date. This includes GWAS on kidney diseases. |
| Nephromine (http://www.nephromine.org) | A web-based platform for integrative data mining of gene expression data sets specifically for renal diseases. | |
| Gene Expression Omnibus (http://www.ncbi.nlm.nih.gov/geo) | A collection of gene expression experiments across many platforms. | |
| ArrayExpress Archive and Gene Expression Atlas (http://www.ebi.ac.uk/arrayexpress) | A database of functional genomics experiments including gene expression. A small subset of the database can be queried for gene expression under different biological conditions. | |
| Stanford Microarray Database (http://smd.stanford.edu/index.shtml) | A resource for storage, annotation, visualization, and sharing of microarray data generated from various model organisms, experimental conditions in different microarray platforms. | |
| The database contains microarray analysis of human kidney. | ||
| Human Kidney and Urine Proteome Project (http://www.hkupp.org) | Databases of proteomic data generated from normal human kidney glomerulus and urine. | |
| Human glomerular SAGE transcriptome database (http://cgap.nci.nih.gov/SAGE) | SAGE library constructed using glomeruli isolated from the unaffected pole of a kidney of a male patient surgically removed for renal cell carcinoma. | |
| Data preprocessing: | Bioconductor (http://www.bioconductor.org/) | Tools for the pre-processing, quality assessment, and analysis of omic data including microarrays and sequence data sets. |
| dChip (https://sites.google.com/site/dchipsoft/) | Software for the analysis and visualization of gene expression and SNP microarrays. | |
| Functional annotation: | Database for Annotation, Visualization, and Integrated | A set of tools that allow users to derive biological meaning from a list of genes. |
| Discovery (http://david.abcc.ncifcrf.gov/) | ||
| GoMiner (http://discover.nci.nih.gov/gominer/index.jsp) | A tool that takes lists of genes generated from omic analysis and uses GO to identify biological processes, functions, and components represented in these lists. | |
| Protein ANalysis THrough Evolutionary Relationships (http://www.pantherdb.org/) | A classification system where genes are classified by their functions based on published data and evolutionary relationships to predict function. | |
| Pathway and interaction network analysis | Biogrid (http://thebiogrid.org/) | An online repository of protein and genetic interactions based on publications. |
| Pathway Commons—Human Protein Reference Database (http://www.hprd.org/) | A platform for visualization and integration information pertaining to domain architecture, post-translational modifications, interaction networks, and disease association for each protein in the human proteome. | |
| Pathway Interaction Database (http://pid.nci.nih.gov/) | A curated collection of information about known biomolecular interactions and key cellular processes assembled into signaling pathways. | |
| Kyoto Encyclopedia of Genes and Genomes (http://www.genome.jp/kegg/) | An integrated database resource consisting of 16 main databases that are broadly categorized into systems information, genomic information, and chemical information. It is widely used as a reference knowledge base for biological interpretation of large-scale data sets. | |
| STRING (http://string-db.org/) | A database of known and predicted protein interactions. | |
| FunCoup (http://funcoup.sbc.su.se/) | A statistical framework of data integration for finding function coupling between proteins. It contains a whole predicted interactome for eight organisms. | |
| Gene Set Enrichment Analysis (http://www.broadinstitute.org/gsea/index.jsp) | A computational method that determines whether an a priori defined set of genes shows statistically significant, concordant differences between two biological states. | |
| Lists2Networks (http://amp.pharm.mssm.edu/lachmann/upload/register.php) | A web-based system that allows user to upload lists of mammalian genes/proteins into a server-based program for analysis. The system allows user to expand lists using existing mammalian networks of protein–protein interactions, co-expression correlation, as well as to apply gene-list enrichment analyses against many gene-list libraries. |
Abbreviations: GO, gene ontology; GWAS, genome-wide association study; SAGE, serial analysis of gene expression; SNP, single-nucleotide polymorphism.
Genome-wide profiling of kidney diseases
Great progress in genome-wide mapping of complex traits in humans was made by genome-wide association (GWA) studies and the admixture linkage analyses. A GWA study correlates allele frequencies in an unbiased manner at each of several hundred thousand markers spaced throughout the genome with trait variation in a population-based sample.1 In contrast, admixture mapping relies on the presence of extended haplotypes from parental ancestry to map a trait or disease that is more prevalent in one ethnic population than another. These approaches have been used to characterize chronic kidney disease,2 diabetic nephropathy,3,4 immunoglobulin A nephropathy,5 and focal segmental glomerulosclerosis (FSGS).6–8 For a detailed discussion about study design and execution of GWA analysis, readers are referred to Sale et al.9 and Iles.10
Most GWA studies have shown that disease traits are associated with small to moderate effects at several loci, and only a few loci with large effects have been identified. Similarly, when investigators from the Family Investigation of Nephropathy and Diabetes study used glomerular filtration rate as a quantitative trait to detect susceptibility loci for diabetic nephropathy in patients from different ethnic populations by admixture linkage analysis, they found that multiple loci of small effects were linked to glomerular filtration rate but none had large effects.4 Other studies that use admixture scan in end-stage renal disease patients of African ancestry have found that the MYH9 gene is highly associated with FSGS and human immunodeficiency virus-associated nephropathy.6,7 More recently, Genovese et al.11 examined the risk alleles linked to FSGS in a large cohort of African Americans, using the GWA approach, and identified strong association of FSGS with two alleles of the ApoL1 gene, which is located on the same region of chromosome 22 as MYH9. In fact, the statistical significance of the two ApoL1 variants was 35 orders of magnitude stronger than that for the MYH9 single-nucleotide polymorphisms. When the effects of ApoL1 variants were excluded, no residual association remained after correction for multiple single-nucleotide polymorphism testing.11
For most complex traits identified in humans, the sum of genetic effects comprises less than half of the total trait heritability. The remaining effects are thought to be due to untested rare variants, gene–gene, and gene–environment interactions. To improve the quality of GWA studies, the candidate locus could be re-sequenced in large cohorts, and eventually whole-genome sequencing of large numbers of subjects would be needed. An alternative approach is to integrate the functional biological knowledge with gene association analyses at a systems level. Systems genetics can be used to integrate large sets of genetic variants and/or genes with other functional data sets, such as protein–protein interactions and cell-signaling pathways, to further characterize the biology of the complex traits.12 The approach of identifying genomic loci, where genetic variants significantly affect gene expression patterns, is called expression quantitative trait locus (eQTL) mapping. Papeta et al.13 have used the eQTL approach to understand the mechanisms of kidney disease. They performed eQTL analysis of podocytes in HIV-1 transgenic mice to gain insight into the genetic susceptibility of human immunodeficiency virus-associated nephropathy.13 They found that transcript levels of the podocyte gene nephrosis 2 homolog (Nphs2) were heritable and controlled by an ancestral eQTL. In addition, Nphs2 expression was controlled by two eQTLs that localized to the nephropathy susceptibility intervals in the genome loci of their origin. These data demonstrate that transcript levels of Nphs2 and related genes expressed in the podocytes are networked, and suggest that the genetic lesions introduced by human immunodeficiency virus-associated nephropathy susceptibility alleles perturb this regulatory network and transcriptional responses to HIV-1
With the development of second-generation sequencing technology that enables massively parallel sequencing, it is now possible for individual laboratories to sequence the whole human genome. Although technically feasible, the cost and capacity to sequence the whole human genome of many individuals is still prohibitive for most laboratories. Although complete sequencing of the genome has the ability to discover the complete spectrum of genomic changes including base substitutions, rearrangements, and copy number, less comprehensive approaches with incomplete coverage—such as whole or partial exome and transcriptome sequencing—can provide the same depth of coverage in less time and reduced cost.14 Targeted sequencing approaches, such as whole or partial exome and transcriptome sequencing, can be applied to diseases in which the causative genes have been identified, or if the mutation is known to occur in the exome. Investigators can apply specific capture methods to select for the desired genomic region before massively parallel sequencing. As the human exome comprises approximately 1% of the genome, significant greater sequence coverage can be achieved with a lower cost than whole-genome sequencing. Whole-exome sequencing has not been applied to the study of kidney disease, but has been used successfully in identifying a novel coding variant as a result of a missense substitution in a gene, SLC26A3, known to cause congenital chloride-losing diarrhea15 and variants in the DHODH gene that causes Miller syndrome.16
Transcriptomics and protein–DNA regulomics of kidney diseases
Transcriptomics is defined as the analysis of mRNA expression patterns at the genome-wide scale. Such experiments have been the most widely applied systems-level approach so far. Changes in the mRNA levels are measured by microarray technology, which is being replaced by high-throughput sequencing of mRNAs, also known as RNA-seq. Efforts to combine transcriptomic data from biological samples annotated with clinical parameters have been made to generate a broad and unbiased view of disease processes and to identify transcriptomic fingerprints associated with defined clinical outcomes. Transcriptomic studies have been conducted to profile expression changes in diabetic nephropathy (DN),17,18 FSGS,19 lupus nephritis,20 chronic kidney disease,21 and glomerular diseases,22 as well as in animal models of DN,23 chronic kidney disease,21 lupus nephritis,24 and aging.25 Transcriptomic data sets have provided insights into the mechanisms of disease processes and identified novel genes responsible for the progression of kidney diseases. Transcriptomic analysis has the potential to define the molecular patterns of disease, allowing early diagnosis, prediction of prognosis, and response to therapy. The current use of transcriptomics in kidney disease research has several limitations. The heterogeneity of kidney tissue (different cell types), as well as the genomic variability of human samples, makes the interpretation of transcriptomic data challenging. Although attempts have been made to differentiate the compartmental gene expression in the glomerulus and tubulointerstitium by microdissection or laser capture, each of these compartments comprised several cell types— endothelial cells, podocytes, and mesangial cells in the glomerulus and tubular epithelial cells, endothelial cells, and infiltrating cells from the circulation in the tubulointer-stitium—and the gene expression profile of the different cell types in the compartments could be variable and not able to be distinguished from each other even with microdissection. In addition, changes in mRNA levels do not always reflect changes in the protein level or protein function due to multiple layers of regulation occurring from transcription to protein synthesis and post-translational modifications needed for understanding regulatory mechanisms.
Quantitative changes in mRNA levels do not directly explain how regulatory mechanisms are altered during disease to induce changes in gene expression, and in turn lead to changes in cellular- and tissue-level phenotypes. Genome-wide measurements of protein–DNA interactions by chromatin immunoprecipitation (ChIP) combined with quantitative measurements of transcriptomes are increasingly used to connect regulatory inputs with transcriptional outputs. Although genome-wide screening of binding sites by DNA binding proteins with ChIP had mostly relied on DNA microarray technology in the past, ChIP followed by high-throughput sequencing (ChIP-seq), which offers distinct advantages in increased specificity, sensitivity, and genome-wide comprehensiveness, is now being used more widely.26 The key challenge for ChIP-seq algorithms is to identify reproducibly true binding locations while including as few false positives as possible.27 The main advantage of ChIP-seq experiments is that identified binding sites for transcription factors can be directly correlated with transcriptional changes, connecting gene expression to the first layer of regulation. Transcriptional regulatory networks upstream of gene expression can be deduced by combining in silico promoter motif-based analyses combined with enrichment analysis of integrated results from ChIP-chip or ChIP experiments.28 This approach has been recently described by Ma'ayan and He.29
It is important to understand how the transcriptional regulatory networks are altered in kidney diseases. The transcription regulatory networks involved in the pathogenesis of DN were studied in a cohort of patients with progressive DN.30 By comparing the gene expression profiles in the tubulointerstitial compartment of patients with DN with those with mild disease, it was revealed that inflammation-stress response genes such as nuclear factor kappa B (NF-κB) target genes are differentially expressed. Systematic promoter module analysis of the upregulated NF-κB-dependent genes identified an enrichment of a specific NF-κB-binding module in the promoter regions of known NF-κB targets that were upregulated in the patients with progressive DN, but not in patients with mild disease or the controls.30 Using this specific NF-κB module, they were able to correctly predict other genes that are upregulated in the patients with progressive DN.
Epigenetics profiling of kidney diseases
The term epigenetics broadly refers to regulatory mechanisms that arise due to differences in the state of chromatin and the proteins associated with it. Such differences arise because of covalent modifications such as histone acetylation or DNA methylation. These modifications are thought to alter chromatin density and accessibility of the transcriptional machinery to the DNA, thereby modulating the expression of genes. Epigenetic regulation has a crucial role in normal physiological development, as well as in pathological conditions. Epigenetics of kidney development has been reviewed previously.31,32 DNA methylation on epigenetic signatures of kidney-specific transporters was examined by Yagi et al.33 They demonstrated a central role for DNA methylation in kidney-specific expression of amino acid transporters.33 Bechtel et al.34 compared primary human fibroblasts from fibrotic kidneys with fibroblasts from non-fibrotic kidneys using a genome-wide methylation screen. This screen revealed 12 genes that were methylated in all seven tested fibrotic fibroblast samples and non-methylated in all tested non-fibrotic fibroblast samples. They identified RASAL1 as a candidate that may facilitate fibroblast activation and progression of renal fibrosis. These two studies demonstrate that environmental conditions influence the epigenetic state of a cell. Epigenetics provide an added layer of regulation that could mediate the relationship between genotype and environmental factors. Therefore, characterization of the epigenomic profile of kidney disease could help us understand the disease pathogenesis, as well as identify potential new biomarkers for disease diagnosis. Integration of DNA methylation profile with gene expression profile could give us a better understanding of gene regulation in kidney disease.
MicroRNA profiling to study kidney disease
MicroRNAs (miRNAs) are a class of endogenous, small, non-coding 21- or 22-nt-long RNAs that have been implicated in the regulation of multiple biological processes. MiRNAs are critical in the maintenance of glomerular homeostasis and in the progression of renal disease.35 When Dicer, an enzyme that converts pre-miRNAs into functional small-interfering RNAs, was inactivated in mouse podocytes, the mice developed proteinuria and died subsequently from renal failure.36 Similarly, interruption of miRNA biogenesis in mouse podocytes resulted in proteinuria, podocyte dediffer-entiation, and crescent formation, leading to end-stage kidney diseases.35 Global miRNA expression profiling on samples prepared from the kidneys of C57BL/6 mice that underwent unilateral warm ischemia revealed nine miRNAs that are differentially expressed following ischemia–reperfusion injury when compared with sham controls.37 One of these nine miRNAs is miR-21, which may have a role in protecting renal tubular epithelial cells from death. Recent studies suggest that miR-192 may also regulate transforming growth factor-β/Smad3 signaling in the development of renal fibrosis.38–40
The expression profile of miRNA offers some important potential advantages over standard mRNA or other protein-based profiles. MiRNAs appear to be very stable in tissues and biological fluids, including urine.41 They are protected from endogenous RNase by virtue of their small size and perhaps by packaging within exosomes, which protect miRNAs from RNase degradation.41 In addition, the tissue-specific nature of miRNA expression makes them potentially ideal candidates for serving as biomarkers.42 The total number of human miRNAs, estimated to be between 700 and 1000, is considerably smaller than the number of protein-coding mRNAs (>22,000).43 MiRNAs have been detected in urine and could be used as biomarkers for kidney disease.44 These urinary miRNAs may be filtered directly from the kidney or the urinary tract; alternatively, miRNAs from detached cells or packaged in exosome may also contribute to the miRNAs detected in the urine. However, there are still major challenges to overcome before expression profiling of miRNAs can be used widely. For instance, miRNA biology and regulation are still unclear and bioinformatics prediction of miRNA-target pairs is still unreliable.
Proteomics profiling to study kidney diseases
The use of proteomics in kidney disease research has grown substantially over the past decade. The proteomics approach has been applied to study renal physiology and this has been reviewed by Hoorn et al.45 Proteomics technologies have been used to identify promising new biomarkers for acute kidney injury and chronic kidney disease. Proteomics may also help to identify new uremic toxins in renal failure patients. Proteomic analysis has been performed to profile normal human and rat renal cortices,46 human renal glomerulus,47,48 urine,49,50 and urinary exosomes.51 Many of these studies have tried to identify a single biomarker for kidney disease. This has not been successful because of the biological variability and complex pathophysiology of kidney diseases. Development of classifiers based on sets of protein biomarkers may be more predictive for kidney disease progression.
Urinary proteins can originate from the filtering of plasma, vascular damage and/or leakage, alterations in tubular metabolism, and the reabsorption or direct shedding and/or secretion of proteins by cells throughout the urological tract. Urine represents an attractive source of potential biomarkers in renal diseases because of the non-invasive nature, easy collection, and low amount of proteins and peptides that are required for analysis. Numerous protein biomarkers have been identified in both health and disease. Urinary proteomics has been used to identify the early biomarkers of acute kidney injury.52 Specific protein panels from urine could help in early diagnosis of acute kidney injury and assess the severity and duration of the disease. However, the sensitivity and specificity of these markers needs to be validated in large clinical studies.53 Proteomic studies have also been conducted to identify biomarkers to predict the development and progression of diabetic kidney disease (reviewed in Merchant and Klein54 and Rossing et al.55) and immunoglobulin A nephropathy.56 Proteomics has also been used to study patients with other glomerular diseases, patients on dialysis, or recipients of kidney transplant.57,58 The proteomic resources of human kidney tissue and urine have been reviewed recently by Yamamoto.59
Proteomics-based approaches have generated large amount of data in clinical medicine. These data could be used to discover novel biomarker sets and gain mechanistic insights of disease origins. However, there are substantial experimental and computational challenges. Methods used to concentrate the proteins and remove salts often affect the yield. Numerous methodological and biological variables can influence peptide profiles.60 One major issue is the standardization of procedures for clinical applications. Given the large numbers and varying abundances of different proteins in biological samples, no single experimental approach appears adequate for the reproducible characterization of the whole proteome state. The nature, number, and quality of clinical samples, temperature and length of storage, and nature of sample receptacle are all critical. The Human Kidney and Urine Proteome Project have been developing a standardized protocol for urine collection and storage (http://www.hkupp.org). Standardization of techniques is required to obtain more reliable proteomics data to study kidney disease.
Metabolomics profiling to study kidney disease
Whereas proteomics profiling tracks the global expression of proteins, metabolomics profiling characterizes and quantifies metabolites. Only a subset of proteins is responsible for processing metabolites, and thus the information from proteomics and metabolomics are complimentary, whereas the combination of these approaches often provides a better appreciation of cells', organs', or organism's molecular state. The advantage of metabolomics is that it could reveal changes in both phenotype and genotype.61 Computational approaches that would integrate metabolomics and proteomics data sets may provide more reliable biomarker sets.
Metabolomics has been used to study kidney diseases for the last several years, although the data are still quite limited. Studies of metabolite profile in blood, kidney tissue, and urine have been used to identify early biomarkers for kidney disease.62,63 It was reported that changes in urine metabolite profile such as glucose, amino acids, and fatty acids could be used as early biomarkers for cisplatin-induced acute kidney injury.62 Metabolomics is also used to identify biomarkers to distinguish acute rejection from acute kidney injury in kidney transplant patients.63 However, the application of metabolomics in kidney disease is still at an early stage. Validation of these metabolic biomarkers with respect to reproducibility, sensitivity, and specificity will need to be performed. Clinical applications are currently limited because of technical challenges.
Computational Approaches
Computational systems biology is an evolving field that encompasses a range of approaches from statistical correlation-based methods to network topology analyses, to dynamical models of biochemical and physiological functions, to detailed stochastic simulations of few components, to multiscale dynamical models that describe molecular networks in space and time and physiological functions of organs and organisms. The large data sets collected at the different layers of regulatory interactions require the development of databases and modeling algorithms capable of integrating such data to convert information into knowledge.
Statistical models
Genomic studies, transcriptional profiling, genome-wide ChIP analyses, miRNAs profiling, proteomics, phosphoproteomics, and metabolomics produce high-dimensional data sets. Commonly, these data sets are analyzed by statistical methods to cluster genes and proteins based on correlated expression, and then the clusters are linked to functional categories.20 Clusters identified based on expression similarity64 are commonly linked to biological themes where sets of co-regulated or co-expressed genes are linked to prior biological knowledge to assess enrichment for pathways or other properties.65,66 Correlated changes in the expression or activity of molecular components are also linked with the physiological or pathophysiological effects at the organ and organism levels. Such analyses serve as the starting point for understanding the molecular consequences of the different experimental conditions or disease states. This type of analyses produce ranked lists of components that vary with the underlying pathophysiology. Often it is discovered that such lists of components share biological themes that can explain observed outcomes. For example, Gene Ontology enrichment analysis67 is used to score how components from observed changes in expression belong to the same biochemical function or are present in a specific cellular or extracellular location. However, such analyses do not provide a full understanding of the mechanisms underlying disease origins or progression. Lacking in this type of analyses is the regulatory relationships between components in ranked lists of differentially expressed genes. However, such relationships can be deduced statistically using Bayesian approaches68,69 or by linking list members to networks developed from prior biological knowledge65,66,70,71 (Table 3 contains a list of tools and databases for functional annotation and pathway and interaction network analysis). The next step is to integrate such networks toward mechanistic understanding. To obtain such mechanistic understanding, there are two broad challenges that are currently actively being pursued: how do we integrate data from different type of profiling experimental approaches at different regulatory levels of cellular regulation? And how do we combine different classes of genome-wide experimental data with clinical measurements?
Building and analyzing networks
Lists from omic studies can be used to reconstruct models of cellular networks. This can be done using statistical methods. Methods used to develop networks directly from expression data include methods such as Bayesian networks68,69 or information theory-based approaches.72 Networks can also be created using prior knowledge such as protein–protein interactions or cell signaling networks developed from biochemistry and cell biology literature.65,66,70,71 In addition, integrating data from different types of profiling experimental approaches, such as those described above, can be achieved by anchoring genes within prior knowledge networks.73 A similar approach allows the construction of molecular networks that connect diseases to genes based on GWA studies, miRNAs to the mRNAs they target,74 protein/DNA interactions based on ChIP analyses,28 protein–protein interactions,65,66,70,71 metabolic pathway interactions, virus/host protein interactions,75 and drug–target interactions76 to each other to form heterogeneous networks made of different types of nodes and different types of links (Figure 2). Such networks can be analyzed using clustering algorithms to identify modules altered in various kidney diseases. Such modules can serve as sets of disease biomarkers, and components of the modules can become potential drug targets. Network analysis algorithms can be used to identify such modules robustly (see review by Ma'ayan77). Once such modules are identified, quantitative dynamical modeling approaches can be applied to further understand the dynamical behavior of such modules, and how the dynamics are altered during pathophysiology.
Figure 2. Construction of molecular networks.
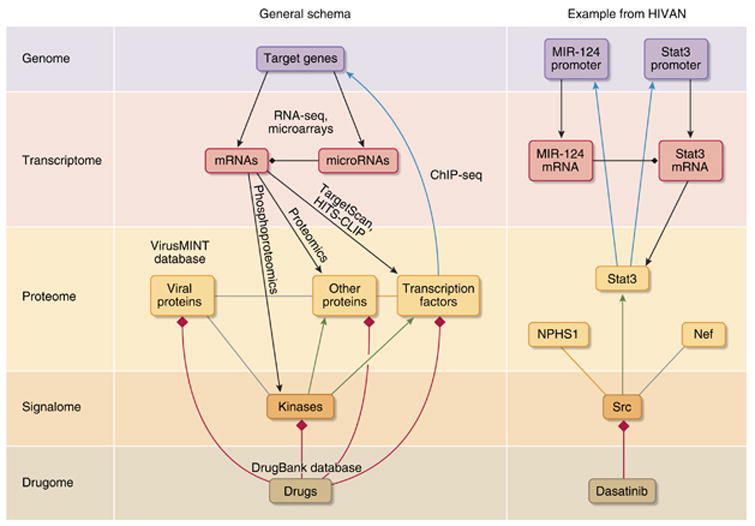
Networks that integrate binary interactions from heterogeneous sources, such as microRNAs (miRNAs) targeting mRNAs (from databases such as TargetScan or through experiments such as Argonaute HITS-CLIP124 (black diamond heads), protein/DNA interactions based on ChIP followed by high-throughput sequencing (ChIP-seq) analyses (cyan arrows), protein–protein interactions (orange links)125, virus/host protein interactions from databases such as VirusMINT75 (gray lines), kinase–substrate interactions126 (green arrows), and drug–target interactions76 (red diamond heads) from databases such as the DrugBank127, can be used to build networks made of different types of nodes and links. An example of such network for key components that have a role in human immunodeficiency virus-associated nephropathy (HIVAN) is given on the right. Dasatinib is an Src inhibitor used for the treatment of oncologic disorder, but could be tested for its therapeutic potential in the treatment of HIV-associated nephropathy. Arrowheads indicate activations and diamond heads denote inhibition. NPHS1, nephrosis 1 homolog.
Dynamical models of renal physiology
The major functions of the kidney include clearance of toxins and maintenance of fluids, electrolytes, and acid–base balance. Normal kidney function is maintained by coordinated regulation at different levels of organization (Figure 3). At the organ level, the heart perfuses the kidney, which is regulated by the neuro–hormonal system. At the nephron (a single functional unit of the kidney) level, autoregulation of renal blood flow, tubuloglomerular feedback loop, and nephro–vascular exchanges in the medulla are all required to maintain normal nephron function. At the cellular level, normal structure and function of endothelium/glomerular basement membrane/podocyte are essential for the maintenance of the glomerular filtration barrier, and polarized tubular epithelial cells are required for reabsorption and secretion of fluid and electrolytes along the nephron.
Figure 3. Multiscale analysis of kidney function.
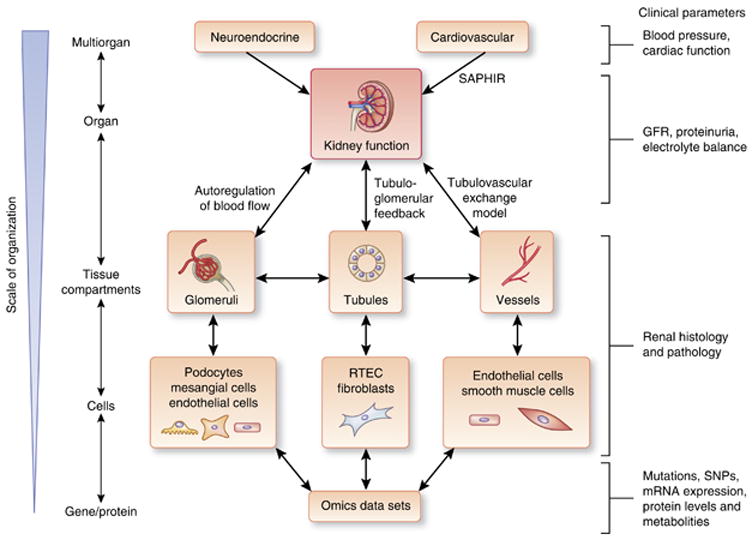
Maintenance of renal function requires the coordinated regulation from other organ systems (neuroendocrine and cardiovascular) and various tissue compartments and cells within the kidney. To recapitulate normal renal physiology in biological models, this multiscale organization from organ systems down to cell/gene level will need to be determined. The interactions at several levels have been described: Systems Approach for Physiological Integration of Renal, Cardiac, and Respiratory (SAPHIR) models, as well as models of autoregulation of glomerular blood flow, tubuloglomerular feedback, and tubulovascular exchange. Clinical parameters that we can use to assess and infer the function of organ systems and organs include blood pressure and cardiac function for cardiovascular and neuroendocrine input into the kidney, glomerular filtration rate (GFR), and proteinuria as determinants of the filtration function of the glomeruli, balance of electrolytes as an indicator of tubular function, podocyte number, foot process effacement, mesangial deposition, glomerulosclerosis, and tubulointerstitial fibrosis on renal histology as indicators of disease severity, and genetic variations (mutations, single-nucleotide polymorphisms (SNPs)) and mRNA and protein expression levels as indices of cellular response to internal and external stimuli. RTEC, renal tubular epithelial cell.
There are several types of computational models of kidney physiology with varying level of organization: multiorgan models, models of kidney function at the organ level, models of the tissue compartments within the kidney, and models of kidney cell types. The SAPHIR (a Systems Approach for Physiological Integration of Renal, Cardiac, and Respiratory function) is the best example of a multiorgan model.78 This is a model of body fluid homeostasis and blood pressure regulation and has been reviewed by Thomas.79 Karaaslan et al.80 developed an integrated cardiovascular/renal model with emphasis on the role of renal sympathetic nerve activity. In the 1960s, Guyton et al.81 were the first to develop a global model of kidney function and the overall regulation of blood pressure. Ikeda et al.82 extended the Guyton model to the regulation of acid–base balance. The classical models from Guyton and Ikeda constitute the basis for current development of a core model for fluid and solute regulation. Several whole kidney models have been also developed to study the genesis of the medullary osmotic gradient.83,84
Many computational models have been developed to study different aspects of the local renal physiology, including membrane and epithelial transport of fluid and electrolytes for different segments of the nephron,85 autoregulation of renal blood flow,86,87 and tubuloglomerular feedback.88 At the glomerular level, many modeling studies analyze factors involved in single-nephron glomerular filtration rate89 and structural defect for reduced glomerular filtration capacity.90 Glomerular transcriptional profiles and protein–protein interaction network in the glomerulus have been used to identify molecular signatures responsible for these physiological changes.91 Models of different tubular segments have been developed to address absorption and secretion (reviewed by Weinstein92).
Structural models of various aspects of the renal anatomy have been described. Because of advances in imaging technologies, detailed three-dimensional reconstructions of the nephron and surrounding blood vessels can be obtained from serial sections.93,94 Nordsletten et al.95 reconstructed rat renal vasculature from micro-computed tomography scans. Other detailed three-dimensional glomerular reconstructions have also been published.96,97 Recent studies have used scanning electron microscopy with a high-sensitivity detector to image the deepest regions of the filtration slits and visualize the porous structure of the slit diaphragm.98 In the future, it will be important to connect these morphological characteristics to physiological functions and in turn to cellular regulatory networks.
The application of systems biology approaches to understand renal physiology is now termed as renal physiome. Technological advances allow us to obtain quantitative measurements of renal physiologic parameters and detailed morphology. Development of detailed computational models would help to integrate quantitative information of renal physiology at different scales from renal cells to the whole kidney. Independently, high-throughput genomics and proteomics data sets, as described above, are being collected at the tissue and cellular levels. Integrated models that merge genomic and proteomic data with physiological data at the cellular level are needed. Such models will have to successfully merge the network analyses used to study the omics data sets with differential equation-based dynamical analyses used for physiological models. The development of simulation environments, such as the Virtual Cell, makes this approach feasible.99 Such models will serve as the base for building the kidney physiome. The multiple levels of models that need to be considered during the construction of an overall multi-scale computational model of the functional kidney (i.e., the kidney physiome) are summarized in Figure 3. A major challenge in this field is how to integrate the multiscale data. There is still a large gap between the functionality and the true ability to use ontological data at the organ level to inform molecular pathways. Furthermore, there is a lack of strategies for integration of quantitative biological sources stored in different standards.
Systems Biomedicine Of Kidney Diseases
Computational modeling of the multiple scales of disease processes is at the core of systems biomedicine (Figure 4). To capture the quantitative properties of diseases (i.e., severity, manifestation of various signs and symptoms of the disease, and rate of progression), investigators in the field of oncology have linked clinical data from patients to molecular signatures identified from malignant cells or tissues.100 High-quality data on clinical and pathological features and specific molecular makers of diseases, which permitted the linking of phenotype-to-genotypic variation in the study of cancer biology, is still largely lacking in the field of nephrology. One notable exception is the European Renal cDNA Bank-Kröner–Fresenius Biopsy Bank, which has collected renal biopsy samples, as well as clinical and histology reports. Data compiled by the European Renal cDNA Bank-Kröner–Fresenius Biopsy Bank have been used in the study of several kidney diseases (reviewed in Neusser et al.101). However, none of the published studies have fully linked clinical data to molecular makers in a systems-wide manner. Some studies have used one type of clinical data (for example, histological diagnosis, severity of renal impairment, rate of disease progression, extent of proteinuria, or specific lab values) and correlated with data on gene expression.102–104 Although this is a necessary starting point, the next step is to use a systems approach to profile the relationship of multiple clinical data points with omic data sets (for example, genome, transcriptome, or proteome) and construct a genotype–phenotype interaction map as it had been described for oncologic diseases.105,106 This relationship between clinical characteristics and molecular features can serve as bookend for the development of the kidney physiome and increase our understanding of the regulatory networks underlying the disease processes.
Figure 4. Systems biomedicine of kidney diseases.
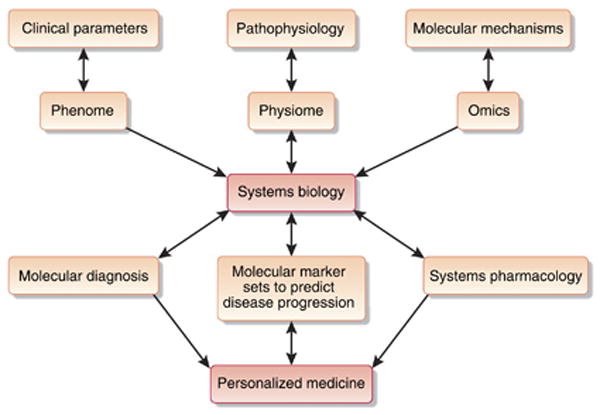
The capability to integrate clinical parameters, understand disease pathophysiology, and discover molecular mechanisms of diseases on the systems level will enable physicians to make more accurate molecular diagnosis, to predict the prognosis of disease, and to formulate targeted therapeutic agents. Together these approaches will facilitate the individualization of patient care.
The major challenge in the field of systems medicine is the imbalance between the large number of omic data sets and the small sample size of patients with a well-defined disease category. This causes significant issues for data analysis and interpretation, leading to a so-called ‘multiple testing’ problem. To overcome this issue, it is critical to develop national and international collaborative studies for collecting large number of samples with strict disease classification criteria. An example of this approach is the Nephrotic Syndrome Study Network, which is a major multicenter initiative funded by the National Institutes of Health to enroll patients with nephrotic syndrome (http://clinicaltrials.gov NCT01209000). The aims of the project are to investigate the underlying causes of the FSGS, minimal change disease, and membranous nephropathy, identify effective treatment for each disease, and develop meaningful approach to classify these disorders in order to inform the selection of the most effective treatments. Clinical data and biological samples (kidney biopsy, urine, and blood) will be collected prospectively. Transcriptomic profiles generated from the biological samples will be used to identify transcriptional networks and classify participants into distinct molecular subgroups. Such an approach to prospectively enroll patients, gather biological samples, and collect clinical data will be an invaluable resource for future investigations as newer technologies become available. With this we can expect to fill in the voids in our molecular understandings of a group of clinical disease categories that do not necessarily share the same molecular underpinning.
In the current practice of renal medicine, nephrologists formulate a clinical diagnosis, treatment plan, or prediction on disease progression using a rather restricted set of clinical parameters. These clinical findings are direct and indirect reflections of the underlying molecular and cellular processes. Different diseases often share similar clinical manifestation and cannot be distinguished from each other using the currently available knowledge and tools. To better characterize disease processes, software systems that are capable of handling the analysis of multivariant data and predict disease classification by machine-learning approaches have been developed. The goal is to achieve further characterization and classification of disease processes using currently available clinical and molecular data sets as biological classifiers. Instead of sorting patients into broad clinical categories, such as responder versus non-responder to a particular treatment, the systems biomedicine approach is to refine the categorization of diseases and be able to distinguish the genetic and phenotypic individuality of any given patient and tailor a specific therapeutic plan. Systems level analysis may identify a particular set of single-nucleotide polymorphism variants, transcriptomic profile, and urine proteomic and metabolomic characteristics that could be translated into clinical tests to help identify patients who are more or less likely to respond to a particular treatment or have a faster or slower progression of renal function loss leading to more personalized medicine.
Another major challenge in the field of chronic kidney disease is the lack of the early hard outcomes for clinical studies because disease progression usually takes decades. Biomarkers derived from omics studies could help predict the response of drugs at an early stage without waiting for the development of ‘hard outcomes’ such as doubling of creatinine or progression to end-stage renal disease, which might take years. Validation of omics biomarkers as early predictors of disease in prospective studies is required but hard to achieve, given the relatively low incidence of glomerular diseases, with the exception of DN. Therefore, the national and international collaborative studies are needed to study these diseases with low incidence.
Drug Discovery Using Systems Pharmacology
Treatment options for kidney disease are currently quite limited. Most primary glomerular diseases are still treated with steroids and immunosuppressive medications. Long-term use of these medications can cause significant side effects, including severe infections and malignancies. Attempts have been made to develop more specific drugs to treat diabetic kidney disease. Although multiple phase II clinical trials had shown promising results, the only successful examples are studies using angiotensin-converting enzyme inhibitors or angiotensin receptor blockers,107–111 whereas many trials including aminoguanidine112,113 and sulodexide (http://clinicaltrials.gov identifier NCT00130208) failed in phase III clinical trials. A large body of evidence suggests that transforming growth factor-β has a key role in kidney fibrosis. Many drug companies have tried to develop anti-transforming growth factor-β agents in the last decade. However, they are limited to phase II studies. It is generally believed that podocyte injury is an early event leading to glomerular disease. Therefore, several groups have tried to develop specific drugs to prevent podocyte injury. We have recently found that retinoic acid can protect podocytes from injury in an animal model of human immunodeficiency virus-associated nephropathy.114 However, these approaches are still limited to experimental models of disease. Overall, traditional approaches to discover drugs to treat kidney disease have not been largely successful. This lack of success indicates that a different approach is needed.
Systems pharmacology is an alternative approach to discover drugs to treat complex diseases such as kidney diseases. Systems pharmacology views therapeutic targets of drugs as parts of cellular networks that control physiological responses.115 This approach is useful in understanding drug action both therapeutic and adverse. We have used this approach to study cardiac arrhythmia.115 Network analyses of arrhythmias suggest that the genes involved in arrhythmias form an identifiable region (subnetwork) within the human interactome. Identifying such disease-specific subnetworks within the human interactome and determining whether key components within these subnetworks are expressed in the tissue of interest are potential approaches to identify new drug targets and disease-specific genes. Omics studies that are used to develop biomarker sets for disease progression can also be used to identify disease-specific subnetworks within the human interactome, which can serve as the basis for identifying new drug targets. In addition, such subnetworks can also be used to repurpose current drugs for the treatment of kidney diseases if their therapeutic targets fall within the disease-specific subnetworks. Such potential drug targets could then be computationally validated using dynamical models to determine whether drug-dependent change in activity of the target will affect overall physiological function. This type of computational prescreening could help reduce the cost of developing new drugs for kidney diseases and predict adverse events in susceptible populations.
Conclusions and Perspective
It is increasingly clear that diseases, such as most kidney diseases, with complex pathophysiologies will require that we understand the physiology at the level of molecular and cellular networks at the genome-wide scale, both to predict disease progression and to develop drugs for treatment. Systems biology approaches can be used to develop an understanding of how alterations in cellular components and interactions lead to pathophysiology. Integrated analyses of omics profiles derived from the genome, transcriptome, proteome, and metabolome levels is the first step in realizing a systems view of cellular processes. However, merging these different experimental data sets, for example, mRNA concentration and protein abundance profiles, is not straightforward, as a direct overlap of differentially regulated/abundant features, resulting from transcriptomics and proteomics, is often limited. Furthermore, it is important to consider the regulatory mechanisms of transcription by post-translational modifications and protein degradation, and epigenetic regulation. Some studies suggest that the analysis of transcriptomic and proteomic data on the level of protein interaction networks may be a way of identifying the link between the two data sets.116 Changes in metabolite levels do not necessarily parallel changes in the transcriptome or the proteome because changes in the level of a particular transcript do not necessarily result in an instantaneous change in enzymatic activity. Therefore, it is essential to investigate the changes in gene transcripts, proteins, and metabolites of the same individual over multiple time points in order to understand their regulatory relationship at a systems level. Although this is a challenge that needs to be addressed within the context of basic systems biology, such integration is critical for the development of systems biomedicine as a clinically useful discipline.
A major challenge in unraveling the complexity of disease mechanisms is to integrate GWA studies with gene expression patterns in order to establish the mechanistic connections between the measured genotype and observed phenotype. For renal disease, the availability of both tissue- and disease-specific expression data sets makes such a strategy feasible. Computational approaches in systems biology such as network analysis will have a major role in developing this genotype-to-phenotype connection. Connecting experimental data at different scales from genes to cellular networks to organ function will help to identify molecular signatures for renal physiology and physiopathology. Integration of omic data sets obtained over extended time periods during the progression of kidney diseases could provide the mechanistic understanding of how multiple factors coordinately regulate the induction and progression of kidney diseases. Integration of these dynamic changes at molecular levels with clinical parameters will be the key step in the process of identifying the biological basis and developing biomarkers and therapeutic agents of kidney diseases.
When comparing large data sets with millions of data points, the likelihood of detecting a false positive is high. One of the major challenges is to identity and sort out changes on the molecular and physiological levels that actually have an impact on the clinical outcome of the individual. Qualitative and strict statistical interpretation of findings needs to be applied first in order to avoid spurious findings and interpretations.
There is no doubt that there is considerable work that needs to be done at both the experimental and computational levels to successfully apply systems biology to treat kidney diseases. Challenges range all the way from developing appropriate standard techniques to obtain patient samples to the development of complex multiscale models that explicitly integrate genomic information with clinical data. In spite of these challenges, the systems biology approaches described here provide a clearly identifiable path by which our knowledge of biological mechanisms can be used to better diagnose and treat kidney diseases (Figure 4).
The focus of future systems biology studies in kidney disease is to identify reliable early biomarkers for molecular diagnosis and prediction of disease progression. The discovery of the reliable biomarkers requires massive efforts from nephrologists to collect a large number of samples from patients with well-defined disease category. To achieve this, we need to develop international collaboration among the physicians, epidemiologists, molecular biologists, statisticians, and systems biologists with computer science and mathematical backgrounds. The discovery of new biomarkers will improve the design of clinical trials and identify patients at an earlier stage of the disease. Integrating the large omic data sets with drug and disease databases could guide the prediction of drug efficacy and side effects. These systems approaches could eventually help us reduce the chance of fails when we move clinical trials of new drugs from phase II to phase III. Advancements in this field will eventually lead to personalized medicine to treat patients with different subtypes of kidney diseases at different stages of progression.
Acknowledgments
JCH is supported by NIH 1R01DK078897 and VA Merit Award; JCH and AM are supported by NIH 1R01DK088541 and 1RC4DK090860; AM is supported by NIH RC2LM010994-01. RI and AM are supported by the Systems Biology Center grant 5P50GM071558; RI and JCH are supported by NIH 5R01DK087650. PYC is supported by NIH 5K08DK082760.
Footnotes
Disclosure: All the authors declared no competing interests.
References
- 1.Stranger BE, Stahl EA, Raj T. Progress and promise of genome-wide association studies for human complex trait genetics. Genetics. 2010;187:367–383. doi: 10.1534/genetics.110.120907. [DOI] [PMC free article] [PubMed] [Google Scholar]
- 2.Kottgen A, Glazer NL, Dehghan A, et al. Multiple loci associated with indices of renal function and chronic kidney disease. Nat Genet. 2009;41:712–717. doi: 10.1038/ng.377. [DOI] [PMC free article] [PubMed] [Google Scholar]
- 3.Pezzolesi MG, Poznik GD, Mychaleckyj JC, et al. Genome-wide association scan for diabetic nephropathy susceptibility genes in type 1 diabetes. Diabetes. 2009;58:1403–1410. doi: 10.2337/db08-1514. [DOI] [PMC free article] [PubMed] [Google Scholar]
- 4.Schelling JR, Abboud HE, Nicholas SB, et al. Genome-wide scan for estimated glomerular filtration rate in multi-ethnic diabetic populations: the Family Investigation of Nephropathy and Diabetes (FIND) Diabetes. 2008;57:235–243. doi: 10.2337/db07-0313. [DOI] [PubMed] [Google Scholar]
- 5.Feehally J, Farrall M, Boland A, et al. HLA has strongest association with IgA nephropathy in genome-wide analysis. J Am Soc Nephrol. 2010;21:1791–1797. doi: 10.1681/ASN.2010010076. [DOI] [PMC free article] [PubMed] [Google Scholar]
- 6.Kao WH, Klag MJ, Meoni LA, et al. MYH9 is associated with nondiabetic end-stage renal disease in African Americans. Nat Genet. 2008;40:1185–1192. doi: 10.1038/ng.232. [DOI] [PMC free article] [PubMed] [Google Scholar]
- 7.Kopp JB, Smith MW, Nelson GW, et al. MYH9 is a major-effect risk gene for focal segmental glomerulosclerosis. Nat Genet. 2008;40:1175–1184. doi: 10.1038/ng.226. [DOI] [PMC free article] [PubMed] [Google Scholar]
- 8.Genovese G, Tonna SJ, Knob AU, et al. A risk allele for focal segmental glomerulosclerosis in African Americans is located within a region containing APOL1 and MYH9. Kidney Int. 2010;78:698–704. doi: 10.1038/ki.2010.251. [DOI] [PMC free article] [PubMed] [Google Scholar]
- 9.Sale MM, Mychaleckyj JC, Chen WM. Planning and executing a genome wide association study (GWAS) Methods Mol Biol. 2009;590:403–418. doi: 10.1007/978-1-60327-378-7_25. [DOI] [PubMed] [Google Scholar]
- 10.Iles MM. Genome-wide association studies. Methods Mol Biol. 2011;713:89–103. doi: 10.1007/978-1-60327-416-6_7. [DOI] [PubMed] [Google Scholar]
- 11.Genovese G, Friedman DJ, Ross MD, et al. Association of trypanolytic ApoL1 variants with kidney disease in African Americans. Science. 2010;329:841–845. doi: 10.1126/science.1193032. [DOI] [PMC free article] [PubMed] [Google Scholar]
- 12.Mackay TF, Stone EA, Ayroles JF. The genetics of quantitative traits: challenges and prospects. Nat Rev Genet. 2009;10:565–577. doi: 10.1038/nrg2612. [DOI] [PubMed] [Google Scholar]
- 13.Papeta N, Chan KT, Prakash S, et al. Susceptibility loci for murine HIV-associated nephropathy encode trans-regulators of podocyte gene expression. J Clin Invest. 2009;119:1178–1188. doi: 10.1172/JCI37131. [DOI] [PMC free article] [PubMed] [Google Scholar]
- 14.Teer JK, Mullikin JC. Exome sequencing: the sweet spot before whole genomes. Hum Mol Genet. 2010;19:R145–R151. doi: 10.1093/hmg/ddq333. [DOI] [PMC free article] [PubMed] [Google Scholar]
- 15.Choi M, Scholl UI, Ji W, et al. Genetic diagnosis by whole exome capture and massively parallel DNA sequencing. Proc Natl Acad Sci USA. 2009;106:19096–19101. doi: 10.1073/pnas.0910672106. [DOI] [PMC free article] [PubMed] [Google Scholar]
- 16.Ng SB, Turner EH, Robertson PD, et al. Targeted capture and massively parallel sequencing of 12 human exomes. Nature. 2009;461:272–276. doi: 10.1038/nature08250. [DOI] [PMC free article] [PubMed] [Google Scholar]
- 17.Martini S, Eichinger F, Nair V, et al. Defining human diabetic nephropathy on the molecular level: integration of transcriptomic profiles with biological knowledge. Rev Endocr Metab Disord. 2008;9:267–274. doi: 10.1007/s11154-008-9103-3. [DOI] [PMC free article] [PubMed] [Google Scholar]
- 18.Berthier CC, Zhang H, Schin M, et al. Enhanced expression of Janus kinase-signal transducer and activator of transcription pathway members in human diabetic nephropathy. Diabetes. 2009;58:469–477. doi: 10.2337/db08-1328. [DOI] [PMC free article] [PubMed] [Google Scholar]
- 19.Hodgin JB, Borczuk AC, Nasr SH, et al. A molecular profile of focal segmental glomerulosclerosis from formalin-fixed, paraffin-embedded tissue. Am J Pathol. 2010;177:1674–1686. doi: 10.2353/ajpath.2010.090746. [DOI] [PMC free article] [PubMed] [Google Scholar]
- 20.Peterson KS, Huang JF, Zhu J, et al. Characterization of heterogeneity in the molecular pathogenesis of lupus nephritis from transcriptional profiles of laser-captured glomeruli. J Clin Invest. 2004;113:1722–1733. doi: 10.1172/JCI19139. [DOI] [PMC free article] [PubMed] [Google Scholar]
- 21.Ju W, Eichinger F, Bitzer M, et al. Renal gene and protein expression signatures for prediction of kidney disease progression. Am J Pathol. 2009;174:2073–2085. doi: 10.2353/ajpath.2009.080888. [DOI] [PMC free article] [PubMed] [Google Scholar]
- 22.Bhavnani SK, Eichinger F, Martini S, et al. Network analysis of genes regulated in renal diseases: implications for a molecular-based classification. BMC Bioinformatics. 2009;10(Suppl 9):S3. doi: 10.1186/1471-2105-10-S9-S3. [DOI] [PMC free article] [PubMed] [Google Scholar]
- 23.Susztak K, Bottinger E, Novetsky A, et al. Molecular profiling of diabetic mouse kidney reveals novel genes linked to glomerular disease. Diabetes. 2004;53:784–794. doi: 10.2337/diabetes.53.3.784. [DOI] [PubMed] [Google Scholar]
- 24.Teramoto K, Negoro N, Kitamoto K, et al. Microarray analysis of glomerular gene expression in murine lupus nephritis. J Pharmacol Sci. 2008;106:56–67. doi: 10.1254/jphs.fp0071337. [DOI] [PubMed] [Google Scholar]
- 25.Wiggins JE, Patel SR, Shedden KA, et al. NFkappaB promotes inflammation, coagulation, and fibrosis in the aging glomerulus. J Am Soc Nephrol. 2010;21:587–597. doi: 10.1681/ASN.2009060663. [DOI] [PMC free article] [PubMed] [Google Scholar]
- 26.Wold B, Myers RM. Sequence census methods for functional genomics. Nat Methods. 2008;5:19–21. doi: 10.1038/nmeth1157. [DOI] [PubMed] [Google Scholar]
- 27.Pepke S, Wold B, Mortazavi A. Computation for ChIP-seq and RNA-seq studies. Nat Methods. 2009;6:S22–S32. doi: 10.1038/nmeth.1371. [DOI] [PMC free article] [PubMed] [Google Scholar]
- 28.Lachmann A, Xu H, Krishnan J, et al. ChEA: transcription factor regulation inferred from integrating genome-wide ChIP-X experiments. Bioinformatics. 2010;26:2438–2444. doi: 10.1093/bioinformatics/btq466. [DOI] [PMC free article] [PubMed] [Google Scholar]
- 29.Ma'ayan A, He JC. Protein kinase target discovery from genome-wide messenger RNA expression profiling. Mt Sinai J Med. 2010;77:345–349. doi: 10.1002/msj.20192. [DOI] [PMC free article] [PubMed] [Google Scholar]
- 30.Schmid H, Boucherot A, Yasuda Y, et al. Modular activation of nuclear factor-kappaB transcriptional programs in human diabetic nephropathy. Diabetes. 2006;55:2993–3003. doi: 10.2337/db06-0477. [DOI] [PubMed] [Google Scholar]
- 31.Dressler GR. Epigenetics, development, and the kidney. J Am Soc Nephrol. 2008;19:2060–2067. doi: 10.1681/ASN.2008010119. [DOI] [PubMed] [Google Scholar]
- 32.Mohtat D, Susztak K. Fine tuning gene expression: the epigenome. Semin Nephrol. 2010;30:468–476. doi: 10.1016/j.semnephrol.2010.07.004. [DOI] [PMC free article] [PubMed] [Google Scholar]
- 33.Kikuchi R, Yagi S, Kusuhara H, et al. Genome-wide analysis of epigenetic signatures for kidney-specific transporters. Kidney Int. 2010;78:569–577. doi: 10.1038/ki.2010.176. [DOI] [PubMed] [Google Scholar]
- 34.Bechtel W, McGoohan S, Zeisberg EM, et al. Methylation determines fibroblast activation and fibrogenesis in the kidney. Nat Med. 2010;16:544–550. doi: 10.1038/nm.2135. [DOI] [PMC free article] [PubMed] [Google Scholar]
- 35.Ho J, Ng KH, Rosen S, et al. Podocyte-specific loss of functional microRNAs leads to rapid glomerular and tubular injury. J Am Soc Nephrol. 2008;19:2069–2075. doi: 10.1681/ASN.2008020162. [DOI] [PMC free article] [PubMed] [Google Scholar]
- 36.Shi S, Yu L, Chiu C, et al. Podocyte-selective deletion of dicer induces proteinuria and glomerulosclerosis. J Am Soc Nephrol. 2008;19:2159–2169. doi: 10.1681/ASN.2008030312. [DOI] [PMC free article] [PubMed] [Google Scholar]
- 37.Godwin JG, Ge X, Stephan K, et al. Identification of a microRNA signature of renal ischemia reperfusion injury. Proc Natl Acad Sci USA. 2010;107:14339–14344. doi: 10.1073/pnas.0912701107. [DOI] [PMC free article] [PubMed] [Google Scholar]
- 38.Wang B, Herman-Edelstein M, Koh P, et al. E-cadherin expression is regulated by miR-192/215 by a mechanism that is independent of the profibrotic effects of transforming growth factor-beta. Diabetes. 2010;59:1794–1802. doi: 10.2337/db09-1736. [DOI] [PMC free article] [PubMed] [Google Scholar]
- 39.Chung AC, Huang XR, Meng X, et al. miR-192 mediates TGF-beta/Smad3-driven renal fibrosis. J Am Soc Nephrol. 2010;21:1317–1325. doi: 10.1681/ASN.2010020134. [DOI] [PMC free article] [PubMed] [Google Scholar]
- 40.Krupa A, Jenkins R, Luo DD, et al. Loss of MicroRNA-192 promotes fibrogenesis in diabetic nephropathy. J Am Soc Nephrol. 2010;21:438–447. doi: 10.1681/ASN.2009050530. [DOI] [PMC free article] [PubMed] [Google Scholar]
- 41.Mitchell PS, Parkin RK, Kroh EM, et al. Circulating microRNAs as stable blood-based markers for cancer detection. Proc Natl Acad Sci USA. 2008;105:10513–10518. doi: 10.1073/pnas.0804549105. [DOI] [PMC free article] [PubMed] [Google Scholar]
- 42.Liang Y, Ridzon D, Wong L, et al. Characterization of microRNA expression profiles in normal human tissues. BMC Genomics. 2007;8:166. doi: 10.1186/1471-2164-8-166. [DOI] [PMC free article] [PubMed] [Google Scholar]
- 43.Berezikov E, Guryev V, van de Belt J, et al. Phylogenetic shadowing and computational identification of human microRNA genes. Cell. 2005;120:21–24. doi: 10.1016/j.cell.2004.12.031. [DOI] [PubMed] [Google Scholar]
- 44.Melkonyan HS, Feaver WJ, Meyer E, et al. Transrenal nucleic acids: from proof of principle to clinical tests. Ann NY Acad Sci. 2008;1137:73–81. doi: 10.1196/annals.1448.015. [DOI] [PubMed] [Google Scholar]
- 45.Hoorn EJ, Hoffert JD, Knepper MA. The application of DIGE-based proteomics to renal physiology. Nephron Physiol. 2006;104:p61–p72. doi: 10.1159/000093288. [DOI] [PubMed] [Google Scholar]
- 46.Magni F, Sarto C, Valsecchi C, et al. Expanding the proteome two-dimensional gel electrophoresis reference map of human renal cortex by peptide mass fingerprinting. Proteomics. 2005;5:816–825. doi: 10.1002/pmic.200401077. [DOI] [PubMed] [Google Scholar]
- 47.Yoshida Y, Miyazaki K, Kamiie J, et al. Two-dimensional electrophoretic profiling of normal human kidney glomerulus proteome and construction of an extensible markup language (XML)-based database. Proteomics. 2005;5:1083–1096. doi: 10.1002/pmic.200401075. [DOI] [PubMed] [Google Scholar]
- 48.Miyamoto M, Yoshida Y, Taguchi I, et al. In-depth proteomic profiling of the normal human kidney glomerulus using two-dimensional protein prefractionation in combination with liquid chromatography-tandem mass spectrometry. J Proteome Res. 2007;6:3680–3690. doi: 10.1021/pr070203n. [DOI] [PubMed] [Google Scholar]
- 49.Oh J, Pyo JH, Jo EH, et al. Establishment of a near-standard two-dimensional human urine proteomic map. Proteomics. 2004;4:3485–3497. doi: 10.1002/pmic.200401018. [DOI] [PubMed] [Google Scholar]
- 50.Pieper R, Gatlin CL, McGrath AM, et al. Characterization of the human urinary proteome: a method for high-resolution display of urinary proteins on two-dimensional electrophoresis gels with a yield of nearly 1400 distinct protein spots. Proteomics. 2004;4:1159–1174. doi: 10.1002/pmic.200300661. [DOI] [PubMed] [Google Scholar]
- 51.Pisitkun T, Shen RF, Knepper MA. Identification and proteomic profiling of exosomes in human urine. Proc Natl Acad Sci USA. 2004;101:13368–13373. doi: 10.1073/pnas.0403453101. [DOI] [PMC free article] [PubMed] [Google Scholar]
- 52.Coca SG, Parikh CR. Urinary biomarkers for acute kidney injury: perspectives on translation. Clin J Am Soc Nephrol. 2008;3:481–490. doi: 10.2215/CJN.03520807. [DOI] [PMC free article] [PubMed] [Google Scholar]
- 53.Devarajan P. Proteomics for biomarker discovery in acute kidney injury. Semin Nephrol. 2007;27:637–651. doi: 10.1016/j.semnephrol.2007.09.005. [DOI] [PMC free article] [PubMed] [Google Scholar]
- 54.Merchant ML, Klein JB. Proteomics and diabetic nephropathy. Semin Nephrol. 2007;27:627–636. doi: 10.1016/j.semnephrol.2007.09.003. [DOI] [PubMed] [Google Scholar]
- 55.Rossing K, Mischak H, Dakna M, et al. Urinary proteomics in diabetes and CKD. J Am Soc Nephrol. 2008;19:1283–1290. doi: 10.1681/ASN.2007091025. [DOI] [PMC free article] [PubMed] [Google Scholar]
- 56.Haubitz M, Wittke S, Weissinger EM, et al. Urine protein patterns can serve as diagnostic tools in patients with IgA nephropathy. Kidney Int. 2005;67:2313–2320. doi: 10.1111/j.1523-1755.2005.00335.x. [DOI] [PubMed] [Google Scholar]
- 57.Smith MP, Banks RE, Wood SL, et al. Application of proteomic analysis to the study of renal diseases. Nat Rev Nephrol. 2009;5:701–712. doi: 10.1038/nrneph.2009.183. [DOI] [PubMed] [Google Scholar]
- 58.Mischak H, Rossing P. Proteomic biomarkers in diabetic nephropathy– reality or future promise? Nephrol Dial Transplant. 2010;25:2843–2845. doi: 10.1093/ndt/gfq363. [DOI] [PubMed] [Google Scholar]
- 59.Yamamoto T. Proteomics database in chronic kidney disease. Adv Chronic Kidney Dis. 2010;17:487–492. doi: 10.1053/j.ackd.2010.09.005. [DOI] [PubMed] [Google Scholar]
- 60.Fiedler GM, Baumann S, Leichtle A, et al. Standardized peptidome profiling of human urine by magnetic bead separation and matrix-assisted laser desorption/ionization time-of-flight mass spectrometry. Clin Chem. 2007;53:421–428. doi: 10.1373/clinchem.2006.077834. [DOI] [PubMed] [Google Scholar]
- 61.Fiehn O. Metabolomics—the link between genotypes and phenotypes. Plant Mol Biol. 2002;48:155–171. [PubMed] [Google Scholar]
- 62.Portilla D, Schnackenberg L, Beger RD. Metabolomics as an extension of proteomic analysis: study of acute kidney injury. Semin Nephrol. 2007;27:609–620. doi: 10.1016/j.semnephrol.2007.09.006. [DOI] [PMC free article] [PubMed] [Google Scholar]
- 63.Wishart DS. Metabolomics: a complementary tool in renal transplantation. Contrib Nephrol. 2008;160:76–87. doi: 10.1159/000125935. [DOI] [PubMed] [Google Scholar]
- 64.Mendez-Ferrer S, Michurina TV, Ferraro F, et al. Mesenchymal and haematopoietic stem cells form a unique bone marrow niche. Nature. 2010;466:829–834. doi: 10.1038/nature09262. [DOI] [PMC free article] [PubMed] [Google Scholar]
- 65.Lachmann A, Ma'ayan A. Lists2Networks: integrated analysis of gene/protein lists. BMC Bioinformatics. 2010;11:87. doi: 10.1186/1471-2105-11-87. [DOI] [PMC free article] [PubMed] [Google Scholar]
- 66.Subramanian A, Tamayo P, Mootha VK, et al. Gene set enrichment analysis: a knowledge-based approach for interpreting genome-wide expression profiles. Proc Natl Acad Sci USA. 2005;102:15545–15550. doi: 10.1073/pnas.0506580102. [DOI] [PMC free article] [PubMed] [Google Scholar]
- 67.Gene Ontology Consortium. Creating the gene ontology resource: design and implementation. Genome Res. 2001;11:1425–1433. doi: 10.1101/gr.180801. [DOI] [PMC free article] [PubMed] [Google Scholar]
- 68.Sachs K, Perez O, Pe'er D, et al. Causal protein-signaling networks derived from multiparameter single-cell data. Science. 2005;308:523–529. doi: 10.1126/science.1105809. [DOI] [PubMed] [Google Scholar]
- 69.Guan Y, Myers CL, Lu R, et al. A genomewide functional network for the laboratory mouse. PLoS Comput Biol. 2008;4:e1000165. doi: 10.1371/journal.pcbi.1000165. [DOI] [PMC free article] [PubMed] [Google Scholar]
- 70.Snel B, Lehmann G, Bork P, et al. STRING: a web-server to retrieve and display the repeatedly occurring neighbourhood of a gene. Nucleic Acids Res. 2000;28:3442–3444. doi: 10.1093/nar/28.18.3442. [DOI] [PMC free article] [PubMed] [Google Scholar]
- 71.Alexeyenko A, Sonnhammer EL. Global networks of functional coupling in eukaryotes from comprehensive data integration. Genome Res. 2009;19:1107–1116. doi: 10.1101/gr.087528.108. [DOI] [PMC free article] [PubMed] [Google Scholar]
- 72.Margolin AA, Nemenman I, Basso K, et al. ARACNE: an algorithm for the reconstruction of gene regulatory networks in a mammalian cellular context. BMC Bioinformatics. 2006;7(Suppl 1):S7. doi: 10.1186/1471-2105-7-S1-S7. [DOI] [PMC free article] [PubMed] [Google Scholar]
- 73.Tanay A, Sharan R, Kupiec M, et al. Revealing modularity and organization in the yeast molecular network by integrated analysis of highly heterogeneous genomewide data. Proc Natl Acad Sci USA. 2004;101:2981–2986. doi: 10.1073/pnas.0308661100. [DOI] [PMC free article] [PubMed] [Google Scholar]
- 74.Friedman RC, Farh KK, Burge CB, et al. Most mammalian mRNAs are conserved targets of microRNAs. Genome Res. 2009;19:92–105. doi: 10.1101/gr.082701.108. [DOI] [PMC free article] [PubMed] [Google Scholar]
- 75.Chatr-aryamontri A, Ceol A, Peluso D, et al. VirusMINT: a viral protein interaction database. Nucleic Acids Res. 2009;37:D669–D673. doi: 10.1093/nar/gkn739. [DOI] [PMC free article] [PubMed] [Google Scholar]
- 76.Ma'ayan A, Jenkins SL, Goldfarb J, et al. Network analysis of FDA approved drugs and their targets. Mt Sinai J Med. 2007;74:27–32. doi: 10.1002/msj.20002. [DOI] [PMC free article] [PubMed] [Google Scholar]
- 77.Ma'ayan A. Network integration and graph analysis in mammalian molecular systems biology. IET Syst Biol. 2008;2:206–221. doi: 10.1049/iet-syb:20070075. [DOI] [PMC free article] [PubMed] [Google Scholar]
- 78.Thomas S, Abdulhay E, Baconnier P, et al. SAPHIR - a multi-scale, multi-resolution modeling environment targeting blood pressure regulation and fluid homeostasis. Conf Proc IEEE Eng Med Biol Soc. 2007;2007:6649–6652. doi: 10.1109/IEMBS.2007.4353884. [DOI] [PubMed] [Google Scholar]
- 79.Thomas SR, Baconnier P, Fontecave J, et al. SAPHIR: a physiome core model of body fluid homeostasis and blood pressure regulation. Philos Transact A Math Phys Eng Sci. 2008;366:3175–3197. doi: 10.1098/rsta.2008.0079. [DOI] [PubMed] [Google Scholar]
- 80.Karaaslan F, Denizhan Y, Kayserilioglu A, et al. Long-term mathematical model involving renal sympathetic nerve activity, arterial pressure, and sodium excretion. Ann Biomed Eng. 2005;33:1607–1630. doi: 10.1007/s10439-005-5976-4. [DOI] [PubMed] [Google Scholar]
- 81.Guyton AC, Coleman TG, Granger HJ. Circulation: overall regulation. Annu Rev Physiol. 1972;34:13–46. doi: 10.1146/annurev.ph.34.030172.000305. [DOI] [PubMed] [Google Scholar]
- 82.Ikeda N, Marumo F, Shirataka M, et al. A model of overall regulation of body fluids. Ann Biomed Eng. 1979;7:135–166. doi: 10.1007/BF02363132. [DOI] [PubMed] [Google Scholar]
- 83.Chandhoke PS, Saidel GM, Knepper MA. Role of inner medullary collecting duct NaCl transport in urinary concentration. Am J Physiol. 1985;249:F688–F697. doi: 10.1152/ajprenal.1985.249.5.F688. [DOI] [PubMed] [Google Scholar]
- 84.Stephenson JL, Mejia R, Tewarson RP. Model of solute and water movement in the kidney. Proc Natl Acad Sci USA. 1976;73:252–256. doi: 10.1073/pnas.73.1.252. [DOI] [PMC free article] [PubMed] [Google Scholar]
- 85.Weinstein AM. Mathematical models of renal fluid and electrolyte transport: acknowledging our uncertainty. Am J Physiol Renal Physiol. 2003;284:F871–F884. doi: 10.1152/ajprenal.00330.2002. [DOI] [PubMed] [Google Scholar]
- 86.Feldberg R, Colding-Jorgensen M, Holstein-Rathlou NH. Analysis of interaction between TGF and the myogenic response in renal blood flow autoregulation. Am J Physiol. 1995;269:F581–F593. doi: 10.1152/ajprenal.1995.269.4.F581. [DOI] [PubMed] [Google Scholar]
- 87.Just A. Mechanisms of renal blood flow autoregulation: dynamics and contributions. Am J Physiol Regul Integr Comp Physiol. 2007;292:R1–17. doi: 10.1152/ajpregu.00332.2006. [DOI] [PubMed] [Google Scholar]
- 88.Layton HE, Davies JM, Casotti G, et al. Mathematical model of an avian urine concentrating mechanism. Am J Physiol Renal Physiol. 2000;279:F1139–F1160. doi: 10.1152/ajprenal.2000.279.6.F1139. [DOI] [PubMed] [Google Scholar]
- 89.Oken DE, Thomas SR, Mikulecky DC. A network thermodynamic model of glomerular dynamics: application in the rat. Kidney Int. 1981;19:359–373. doi: 10.1038/ki.1981.27. [DOI] [PubMed] [Google Scholar]
- 90.Drumond MC, Kristal B, Myers BD, et al. Structural basis for reduced glomerular filtration capacity in nephrotic humans. J Clin Invest. 1994;94:1187–1195. doi: 10.1172/JCI117435. [DOI] [PMC free article] [PubMed] [Google Scholar]
- 91.He L, Sun Y, Takemoto M, et al. The glomerular transcriptome and a predicted protein-protein interaction network. J Am Soc Nephrol. 2008;19:260–268. doi: 10.1681/ASN.2007050588. [DOI] [PMC free article] [PubMed] [Google Scholar]
- 92.Weinstein AM. Insights from mathematical modeling of renal tubular function. Exp Nephrol. 1998;6:462–468. doi: 10.1159/000020556. [DOI] [PubMed] [Google Scholar]
- 93.Zhai XY, Thomsen JS, Birn H, et al. Three-dimensional reconstruction of the mouse nephron. J Am Soc Nephrol. 2006;17:77–88. doi: 10.1681/ASN.2005080796. [DOI] [PubMed] [Google Scholar]
- 94.Pannabecker TL, Dantzler WH. Three-dimensional architecture of collecting ducts, loops of Henle, and blood vessels in the renal papilla. Am J Physiol Renal Physiol. 2007;293:F696–F704. doi: 10.1152/ajprenal.00231.2007. [DOI] [PubMed] [Google Scholar]
- 95.Nordsletten DA, Blackett S, Bentley MD, et al. Structural morphology of renal vasculature. Am J Physiol Heart Circ Physiol. 2006;291:H296–H309. doi: 10.1152/ajpheart.00814.2005. [DOI] [PubMed] [Google Scholar]
- 96.Inkyo-Hayasaka K, Sakai T, Kobayashi N, et al. Three-dimensional analysis of the whole mesangium in the rat. Kidney Int. 1996;50:672–683. doi: 10.1038/ki.1996.364. [DOI] [PubMed] [Google Scholar]
- 97.Neal CR, Crook H, Bell E, et al. Three-dimensional reconstruction of glomeruli by electron microscopy reveals a distinct restrictive urinary subpodocyte space. J Am Soc Nephrol. 2005;16:1223–1235. doi: 10.1681/ASN.2004100822. [DOI] [PubMed] [Google Scholar]
- 98.Gagliardini E, Conti S, Benigni A, et al. Imaging of the porous ultrastructure of the glomerular epithelial filtration slit. J Am Soc Nephrol. 2010;21:2081–2089. doi: 10.1681/ASN.2010020199. [DOI] [PMC free article] [PubMed] [Google Scholar]
- 99.Walker DC, Southgate J. The virtual cell—a candidate co-ordinator for ′middle-out′ modelling of biological systems. Brief Bioinform. 2009;10:450–461. doi: 10.1093/bib/bbp010. [DOI] [PubMed] [Google Scholar]
- 100.Roukos DH. Novel clinico-genome network modeling for revolutionizing genotype-phenotype-based personalized cancer care. Expert Rev Mol Diagn. 2010;10:33–48. doi: 10.1586/erm.09.69. [DOI] [PubMed] [Google Scholar]
- 101.Neusser MA, Lindenmeyer MT, Kretzler M, et al. Genomic analysis in nephrology–towards systems biology and systematic medicine? Nephrol Ther. 2008;4:306–311. doi: 10.1016/j.nephro.2008.04.003. [DOI] [PubMed] [Google Scholar]
- 102.Rudnicki M, Perco P, Enrich J, et al. Hypoxia response and VEGF-A expression in human proximal tubular epithelial cells in stable and progressive renal disease. Lab Invest. 2009;89:337–346. doi: 10.1038/labinvest.2008.158. [DOI] [PubMed] [Google Scholar]
- 103.Song X, Di Giovanni V, He N, et al. Systems biology of autosomal dominant polycystic kidney disease (ADPKD): computational identification of gene expression pathways and integrated regulatory networks. Hum Mol Genet. 2009;18:2328–2343. doi: 10.1093/hmg/ddp165. [DOI] [PubMed] [Google Scholar]
- 104.Lindenmeyer MT, Kretzler M, Boucherot A, et al. Interstitial vascular rarefaction and reduced VEGF-A expression in human diabetic nephropathy. J Am Soc Nephrol. 2007;18:1765–1776. doi: 10.1681/ASN.2006121304. [DOI] [PubMed] [Google Scholar]
- 105.Vakiani E, Basso K, Klein U, et al. Genetic and phenotypic analysis of B-cell post-transplant lymphoproliferative disorders provides insights into disease biology. Hematol Oncol. 2008;26:199–211. doi: 10.1002/hon.859. [DOI] [PubMed] [Google Scholar]
- 106.van de Vijver MJ, He YD, van't Veer LJ, et al. A gene-expression signature as a predictor of survival in breast cancer. N Engl J Med. 2002;347:1999–2009. doi: 10.1056/NEJMoa021967. [DOI] [PubMed] [Google Scholar]
- 107.Taguma Y, Kitamoto Y, Futaki G, et al. Effect of captopril on heavy proteinuria in azotemic diabetics. N Engl J Med. 1985;313:1617–1620. doi: 10.1056/NEJM198512263132601. [DOI] [PubMed] [Google Scholar]
- 108.Lewis EJ, Hunsicker LG, Bain RP, et al. The effect of angiotensin-converting-enzyme inhibition on diabetic nephropathy. The Collaborative Study Group. N Engl J Med. 1993;329:1456–1462. doi: 10.1056/NEJM199311113292004. [DOI] [PubMed] [Google Scholar]
- 109.Lewis EJ, Hunsicker LG, Clarke WR, et al. Renoprotective effect of the angiotensin-receptor antagonist irbesartan in patients with nephropathy due to type 2 diabetes. N Engl J Med. 2001;345:851–860. doi: 10.1056/NEJMoa011303. [DOI] [PubMed] [Google Scholar]
- 110.Brenner BM, Cooper ME, de Zeeuw D, et al. Effects of losartan on renal and cardiovascular outcomes in patients with type 2 diabetes and nephropathy. N Engl J Med. 2001;345:861–869. doi: 10.1056/NEJMoa011161. [DOI] [PubMed] [Google Scholar]
- 111.Parving HH, Lehnert H, Brochner-Mortensen J, et al. The effect of irbesartan on the development of diabetic nephropathy in patients with type 2 diabetes. N Engl J Med. 2001;345:870–878. doi: 10.1056/NEJMoa011489. [DOI] [PubMed] [Google Scholar]
- 112.Freedman BI, Wuerth JP, Cartwright K, et al. Design and baseline characteristics for the aminoguanidine Clinical Trial in Overt Type 2 Diabetic Nephropathy (ACTION II) Control Clin Trials. 1999;20:493–510. doi: 10.1016/s0197-2456(99)00024-0. [DOI] [PubMed] [Google Scholar]
- 113.Thornalley PJ. Use of aminoguanidine (Pimagedine) to prevent the formation of advanced glycation endproducts. Arch Biochem Biophys. 2003;419:31–40. doi: 10.1016/j.abb.2003.08.013. [DOI] [PubMed] [Google Scholar]
- 114.Ratnam KK, Feng X, Chuang PY, et al. Role of the retinoic acid receptor-alpha in HIV-associated nephropathy. Kidney Int. 2011;79:624–634. doi: 10.1038/ki.2010.470. [DOI] [PMC free article] [PubMed] [Google Scholar]
- 115.Berger SI, Ma'ayan A, Iyengar R. Systems pharmacology of arrhythmias. Sci Signal. 2010;3:ra30. doi: 10.1126/scisignal.2000723. [DOI] [PMC free article] [PubMed] [Google Scholar]
- 116.Perco P, Muhlberger I, Mayer G, et al. Linking transcriptomic and proteomic data on the level of protein interaction networks. Electrophoresis. 2010;31:1780–1789. doi: 10.1002/elps.200900775. [DOI] [PubMed] [Google Scholar]
- 117.Baelde HJ, Eikmans M, Doran PP, et al. Gene expression profiling in glomeruli from human kidneys with diabetic nephropathy. Am J Kidney Dis. 2004;43:636–650. doi: 10.1053/j.ajkd.2003.12.028. [DOI] [PubMed] [Google Scholar]
- 118.Moczulski DK, Fojcik H, Wielgorecki A, et al. Expression pattern of genes in peripheral blood mononuclear cells in diabetic nephropathy. Diabet Med. 2007;24:266–271. doi: 10.1111/j.1464-5491.2006.02067.x. [DOI] [PubMed] [Google Scholar]
- 119.Sharma K, Lee S, Han S, et al. Two-dimensional fluorescence difference gel electrophoresis analysis of the urine proteome in human diabetic nephropathy. Proteomics. 2005;5:2648–2655. doi: 10.1002/pmic.200401288. [DOI] [PubMed] [Google Scholar]
- 120.Rao PV, Lu X, Standley M, et al. Proteomic identification of urinary biomarkers of diabetic nephropathy. Diabetes Care. 2007;30:629–637. doi: 10.2337/dc06-2056. [DOI] [PubMed] [Google Scholar]
- 121.Mischak H, Kaiser T, Walden M, et al. Proteomic analysis for the assessment of diabetic renal damage in humans. Clin Sci (Lond) 2004;107:485–495. doi: 10.1042/CS20040103. [DOI] [PubMed] [Google Scholar]
- 122.Kim HJ, Cho EH, Yoo JH, et al. Proteome analysis of serum from type 2 diabetics with nephropathy. J Proteome Res. 2007;6:735–743. doi: 10.1021/pr060489g. [DOI] [PubMed] [Google Scholar]
- 123.Meier M, Kaiser T, Herrmann A, et al. Identification of urinary protein pattern in type 1 diabetic adolescents with early diabetic nephropathy by a novel combined proteome analysis. J Diabetes Complications. 2005;19:223–232. doi: 10.1016/j.jdiacomp.2004.10.002. [DOI] [PubMed] [Google Scholar]
- 124.Chi SW, Zang JB, Mele A, et al. Argonaute HITS-CLIP decodes microRNA-mRNA interaction maps. Nature. 2009;460:479–486. doi: 10.1038/nature08170. [DOI] [PMC free article] [PubMed] [Google Scholar]
- 125.Berger SI, Posner JM, Ma′ayan A. Genes2Networks: connecting lists of gene symbols using mammalian protein interactions databases. BMC Bioinformatics. 2007;8:372. doi: 10.1186/1471-2105-8-372. [DOI] [PMC free article] [PubMed] [Google Scholar]
- 126.Lachmann A, Ma′ayan A. KEA: kinase enrichment analysis. Bioinformatics. 2009;25:684–686. doi: 10.1093/bioinformatics/btp026. [DOI] [PMC free article] [PubMed] [Google Scholar]
- 127.Wishart DS, Knox C, Guo AC, et al. DrugBank: a knowledgebase for drugs, drug actions and drug targets. Nucleic Acids Res. 2008;36:D901–D906. doi: 10.1093/nar/gkm958. [DOI] [PMC free article] [PubMed] [Google Scholar]