Abstract
The optical properties of gold rods electrochemically deposited in anodic aluminum oxide templates have been investigated. Homogeneous suspensions of rods with average diameter of 85 nm and varying lengths of 96, 186, 321, 465, 495, 578, 641, 735, and 1175 nm were fabricated. The purity and dimensions of these rod nanostructures allowed us to observe higher order multipole resonances for the first time in a colloidal suspension. The experimental optical spectra agree with discrete dipole approximation calculations that have been modeled from the dimensions of the gold nanorods.
Keywords: gold nanorods, multipoles, anodic aluminum oxide template, discrete dipole approximation
1. Introduction
Metal nanostructures have been of significant interest as a result of their many uses in photonics1, electronics2, biodetection3, and catalysis.4 These materials have unique optical and chemical properties that are quite different from the bulk or atomic species. Gold and silver nanoparticles are particularly interesting because their plasmon resonance excitation gives rise to intense colors, Raman enhancing capabilities, and their utility as labels in biodetection platforms. The wavelength of the plasmon resonance can be tuned by the size and shape of the nanoparticle, and by its surrounding dielectric medium.5 For example, when a spherical nanoparticle’s diameter is approximately 5–50 nm, the plasmon resonance is dipolar in nature because the conduction electrons in the metal are excited in-phase with the incident electromagnetic field. However, when the dimensions are larger, the excitation of higher order harmonics or multipoles can be excited5 as a result of phase retardation of the applied field inside the material. Such multipole resonances are of fundamental interest, and the near-field profiles and the far-field scattering patterns of multipolar harmonics can be useful in applications pertaining to light signal routers, light manipulators, or multi-step enhancers in processes like second harmonic generation.6 In addition, higher order modes provide a spectroscopic fingerprint of the material that can be used to characterize and assess the quality of such structures.
In past work quadrupole and higher order multipoles have been detected in both isotropic and anisotropic gold or silver materials including shells,6 spheres,7 and prisms.8 The multipoles also have been observed in lithographically generated analogs of gold and silver platelets,9 but no one has generated free-standing rods in the form of a colloid with spectroscopically observed higher order resonances. Herein we present the first experimental observation of higher order surface plasmon modes for colloidal cylindrical gold rods. In addition we use discrete dipole approximation (DDA) calculations to identify the number of expected modes for the size rods studied.
Typically gold nanorods are synthesized via wet-chemical techniques10 or hard template-directed methods,11 and have received much attention for their potential use in therapeutics,12,13 chemical separations,14 sensing,12,15 and optics.12,10 In the wet-chemical synthesis, metal ions are reduced onto the surface of gold seeds in the presence of various surfactants.13 The resulting shape is dependent on the reaction conditions, seed, and surfactant or capping agent used. Although this technique proved to be useful in terms of controlling the length of nanorods, usually the rod diameter varied from ~5 to 55 nm.15a,16,17 Therefore, only two surface plasmon resonance peaks have been observed. One is parallel to the short axis of the rod (transverse mode) and is typically in the range of 500 to 550 nm, while the other is parallel to the long axis (longitudinal mode) and is substantially more variable with the plasmon wavelength depending on the length of the rods. In addition, this wet-chemical method also can produce spherical particles or other shape materials as byproducts, which can greatly affect the optical response. Therefore, if one is interested in mapping out the fundamental optical properties of high purity rod structures, hard template-directed synthesis that utilize polycarbonate membranes and anodic aluminum oxide (AAO) templates, 11 at present provide a more reliable means of preparing such structures than the solution phase methods. Herein we show that these AAO templates provide access to rod structures that exhibit higher order surface plasmon resonances, which have never been observed in the context of a colloid.
2. Experimental Section
AAO Fabrication
Following a two-step anodization process similar to that established by Masuda and co-workers,18 we synthesized an AAO template with 85 ± 10 nm diameter pores (Supporting Information Figure 1). During this experimental set-up, aluminum served as the anode while graphite served as the cathode in the electrochemical cell. A high-purity (99.999%) thin sheet of aluminum (PVD Materials) was first electropolished in a mixture of ethanol (Aldrich) and perchloric acid (Aldrich) (8:1, v/v) at 15 V in order to reduce the surface roughness of the aluminum. Then the smooth aluminum was anodized in 0.3 M oxalic acid (Acros) at 40 V and 1° C for 20 h to initiate the growth of the porous alumina. The alumina was next removed using an aqueous mixture of chromic acid (Aldrich) (1.8 wt%) and phosphoric acid (Aldrich) (6 wt%). A second anodization followed in 0.3 M oxalic acid at 40 V and 1° C for 24 h to insure highly ordered porous alumina. The remaining aluminum was subsequently removed in a saturated HgCl2 (Aldrich) solution resulting in porous AAO templates. These templates were then subjected to a 6 wt% phosphoric acid etchant for pore widening.
Gold Rod Synthesis
Gold nanorods were electrochemically deposited in the pores of the AAO template following a similar protocol pioneered by Martin and Moskovits.11 A layer of silver (200nm) was evaporated on one side of the AAO. After making a contact with aluminum foil in a Teflon cell, this material served as a cathode in the electrochemical cell, in which Ag/AgCl served as a reference electrode and platinum wire acted as a counter electrode. The nanopores were filled with Ag plating solution (Technic Inc.) at a constant potential, −0.9 V vs Ag/AgCl followed by Au plating solution (Technic Inc.) also at −0.9 V vs Ag/AgCl.
The lengths of the rods were controlled by monitoring the number of coulombs passed during the deposition process. The rods were then released from the template in a 3M NaOH solution, rinsed four times with water, two times with ethanol, and then resuspended in D2O so that the near infrared (NIR) optical properties of the rods could be observed. The rods were suspended via sonication and no surfactant or stabililizer was used.
Materials Characterization
Scanning electron microscopy (SEM) images were taken on a Leo 1525 courtesy of Northwestern University Nuance Facility. Experimental extinction spectra did not use polarized light and were collected on a Cary 5000 UV-vis-NIR spectrophotometer.
3. Results
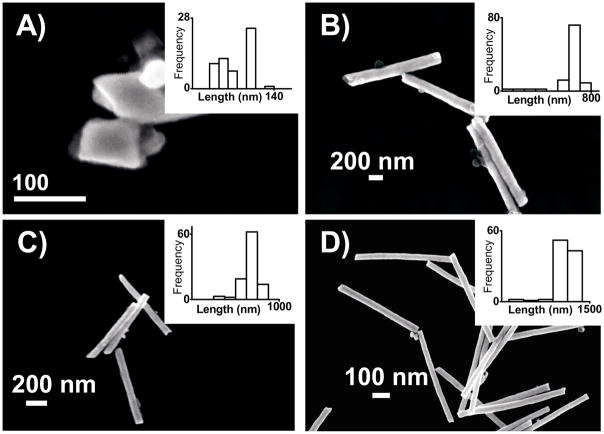
We were able to synthesize rods with an average diameter of 85 nm and average lengths of 96 (Figure 1A), 186, 321, 465, 495, 578, 641 (Figure 1B), 735 (Figure 1C), and 1175 nm (Figure 1D). Scanning electron microscopy (SEM) images and histograms reveal that only rod shaped materials with a narrow size distribution are present in the solution, Figure 1.
Figure 1.
SEM images of rods A) 96 ± 18 nm, B) 641 ± 47 nm, C) 735 ± 48 nm, and D) 1175 ± 49 nm long with 85 ± 10 nm diameters. All of these images and the corresponding histograms found in the insets illustrate the homogeneous nature of the gold rods in solution.
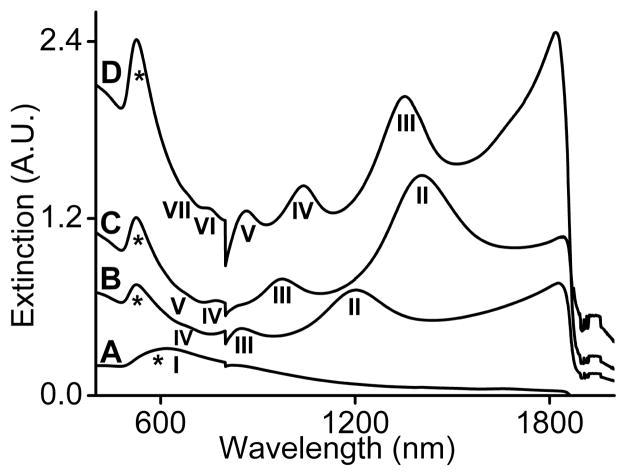
The optical properties of these rods were investigated using UV-vis-NIR spectroscopy. When the length is 96 nm, one prominent broad peak around 600 nm is observed, which is indicative of both the transverse and longitudinal dipole modes, Figure 2A. The longitudinal plasmon, labeled I, overlaps the transverse dipole mode because the aspect ratio (length over diameter) is close to 1, and the rod spectrum resembles that of a near isotropic sphere or disc. However, Gans theory predicts that when the aspect ratio increases, the longitudinal mode will red-shift to longer wavelengths and the transverse mode will blue-shift to slightly shorter wavelengths.19 This trend was observed in gold nanorods made via solution phase synthesis.15,17 The gold nanorods synthesized via the hard template-directed method exhibit a similar trend, Figure 2 and (Supporting Information Figure 2). One particularly interesting feature is the appearance of both even (labeled II, IV, VI) and odd (labeled I, III, V, VII) higher order multipole resonances when the aspect ratio is greater than 4, Figure 2B–D. These multipole resonances have not been observed previously in a colloidal suspension of gold nanorods and are assigned based on theoretical calculations which are discussed in further detail below.
Figure 2.
UV-vis-NIR spectra of the A) 96, B) 641, C) 735, and D) 1175 nm long gold rods in D2O. The Roman numeral labels the multipole order associated with each plasmon resonance. Orders were assigned based on theoretical calculations.
When increasing the rod aspect ratio, both the even and odd higher order longitudinal modes (II–VII) red-shift to longer wavelengths, Figure 2B–D. Another noticeable feature is the increase in the number of multipole resonances. When the length of the rod reaches 641 nm, the transverse dipole mode, labeled * in Figure 2B appears at 530 nm while two other higher order modes, II and III, are observed at 846 nm and 1197 nm respectively. In this size regime the longitudinal dipole mode, I, is red-shifted to longer wavelengths and not detectable in the spectral range studied. Also a small shoulder is visible around 660 nm, which corresponds to the onset of multipole IV. Again, as the aspect ratio increases, the transverse mode remains around 530 nm, while the higher order modes red-shift and increase in intensity and number, Figure 2C. When the length is 735 nm, the II, III, and IV multipoles are at 1397 nm, 966 nm, 775 nm, respectively, and multipole V appears at around 660 nm. This same trend is followed in the spectrum for the rods that are 1175 nm long and up to seven multipoles are detected, Figure 2D. In the spectra each higher order mode is resolved from the transverse mode at around 650 to 700 nm. The minimum at around 800 nm is due to detector and lamp changeover in the instrument. The assignments in Figure 2 are based upon the characterization of these rods by SEM and electrodynamics results which we discuss below.
4. Electrodynamics Calculations
We have studied the optical properties of the gold rods using the discrete dipole approximation (DDA) method. In this method,20 the particle is represented as a cubic array of point dipoles. The polarization of each dipole arises in response to the total electromagnetic field at that site in the array as described by
| (1) |
where α is the polarizability, is the incident field, and A is an interaction matrix. The polarizability is determined by the dielectric constant of gold (here we have used values from Johnston and Christy21) using a lattice dispersion relation.22 The total field is the superposition of an incident plane wave, and the fields radiating from all of the other dipoles in the array given by
| (2) |
Assigning the diagonal elements of matrix A to be permits rearrangement of Eq. (1) to
| (3) |
where P and Einc are 3N-dimensional vectors and A is a 3N×3N matrix. For the number of dipoles necessary to represent large nanoparticles, direct matrix inversion to obtain P is not feasible, so an iterative solution is utilized to find the polarization of each dipole. Once the dipole polarizations are known, the extinction cross section can be computed using
| (4) |
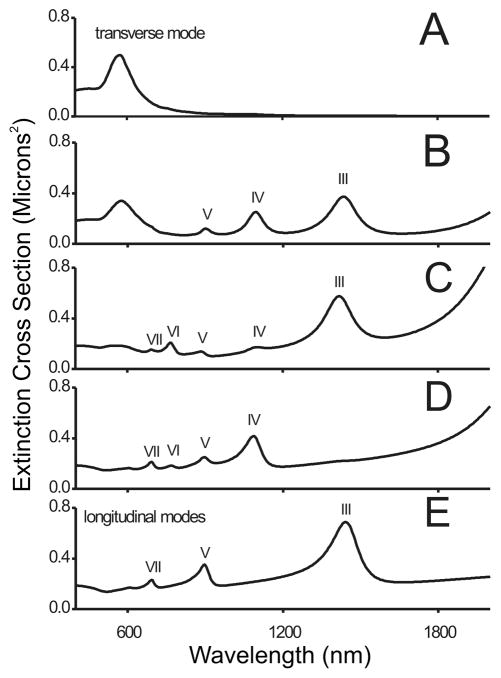
An important consideration in making comparison of theory and experiment concerns the effect of averaging over orientation of the rod relative to the polarization vector. Figure 3 shows DDA results for a rod that is 1175 nm in length and 85 nm in diameter as a function of the angle θ between the rod axis and the polarization vector. θ = 90 refers to transverse excitation (Figure 3A) and we see the expected resonance at 580 nm. θ = 0 is for longitudinal excitation (Figure 3E) and this shows that only odd order modes (labeled III, V, VII as mode I is at longer than 2 μm) are excited in this case. The suppression of the even modes results from symmetry of the induced polarization when the wavevector is perpendicular to and the polarization is parallel to the rod axis. This leads to an induced polarization that is antisymmetric with respect to reflection through a plane that bisects the rod, and only odd-order modes are excited. The intermediate angles (Figure 3B–D) show that a mixture of transverse and longitudinal excitations is required to see all the multipolar resonances. In particular the resonances are at 1400, 1090, 900, 780 and 690 nm for modes III, IV, V, VI and VII, respectively. Note that in past work with lithographically fabricated rectangular rods on surfaces, the polarization was only chosen to be in the longitudinal direction so only the odd-order modes were observed.9b
Figure 3.
Extinction spectra (from DDA calculations) for 1175 nm rods, showing the effect of varying the orientation of the rod relative the polarization direction. A) θ = 90, B) θ = 67.5, C) θ = 45, D) θ = 22.5, E) θ = 0 where θ is the angle between the rod and polarization direction.
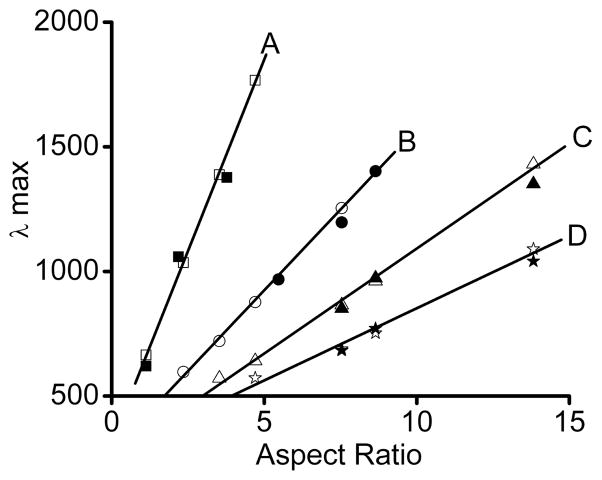
In addition, the plot of λ max vs. aspect ratio in Figure 4 further supports the multipole assignments in Figure 2. The graph illustrates where multipoles I, II, III, IV (Figure 4A–D) are expected for varying lengths of gold rods with 85 nm diameters. The All theoretical plots show a good linear fit with R2 values of 0.99 and provide linear equations for determining where the multipoles appear in the infrared for 85 nm diameter gold rods in solution. In addition the experimental plots (filled shapes) agree well with the calculated plots. Therefore, the multipole assignments in the experimental spectra are correctly labeled.
Figure 4.
Plot of λmax vs. aspect ratio for 85 nm diameter gold rods in solution. Theoretical points are represented by hollow shapes while experimental are represented by filled shapes for multipole A) I, B) II, C) III, and D) IV.
5. Comparison of Theory and Experiment
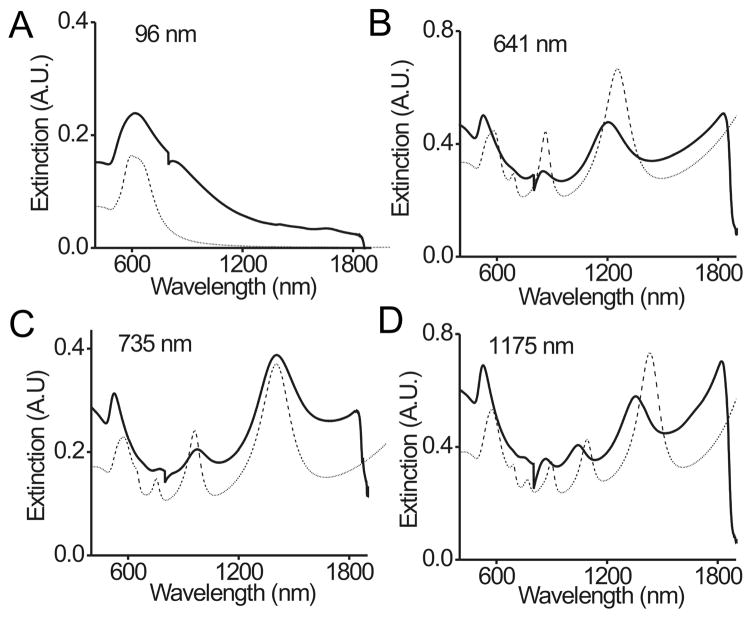
Figure 5 presents a comparison of experimentally measured spectra and DDA results. The extinction spectra are in generally good agreement. For example, the theoretical and experimental extinction spectra for 96 nm long gold rods have one broad peak at ~ 600 nm, Figure 5A. The spectra for the 641 nm long rods, Figure 5B, both exhibit three higher order plasmon resonances at approximately 685 nm, 895 nm, and 1200 nm and a transverse mode at ~530 nm. Comparing the spectra for the 735 nm long rods, Figure 5C, a transverse mode is observed at 530 nm and 571 nm for the experimental and theoretical spectra, respectively. Four more multipole resonances are also evident in both spectra at 650, 760, 960, and 1400 nm wavelengths. In addition both the theoretical and experimental spectra for the 1175 nm long rods, Figure 5D, show a transverse band around 550 nm and higher order plasmon resonances VII, VI, V, IV, and III at 680, 760, 875, 1060, and 1410 nm, respectively. The differences between the transverse and longer wavelength multipoles are due to the size distribution in both the length and diameter of the nanorods in the experimental samples, Figure 1. However, the theoretical spectra for all the different aspect ratio rods agree well with the experimental data both quantitatively and qualitatively in that both the theoretical and experimental spectra for all aspect ratios have the same number of multipoles at similar wavelengths.
Figure 5.
Theoretical (DDA) extinction spectra (dashed line) compared to experimental extinction spectra (solid line) for gold rods with a fixed 85 nm diameter and A) 96, B) 641, C) 735, and D) 1175 nm lengths.
5. Conclusion
In conclusion we have observed multiple higher order plasmon resonances in colloidal cylindrical gold nanorods for the first time. The AAO template provided a synthetic route that resulted in a homogeneous suspension of rods with the proper dimensions to observe these modes. As in the lithographically generated patterns,10 both the even and odd modes were detected up to the 7th order and were in good agreement with DDA calculations. Unlike the lithographically generated patterns,10 these rods are not dependent on surface selection rules, and both even and odd multipoles can be observed. These results are of significant fundamental importance and could potentially impact the aforementioned applications. Perhaps the most important contribution is a set of benchmark spectra for evaluating the quality of a colloid of gold rods prepared in any manner. Solution spectra can be quite informative, and the presence of the multipole resonances is a signature of a high quality preparatory procedure that will guide other researchers in determining the homogeneity of their anisotropic structures. In addition, this synthetic technique enables the fabrication of multi-component nanorods that can provide multiple surface plasmon resonances for applications in which solution phase methods and lithographically generated patterns are limited.
Supplementary Material
Supporting Information Figure 1: SEM image of anodic aluminum oxide template with 85 nm diameter pore.
Supporting Information Figure 2: A) UV-vis-NIR spectra for: 96 nm (bottom), 186 nm (middle), and 321 nm (top) long gold rods. SEM images of: B) 96 nm, C) 186 nm, and D) 321 nm long gold rods.
Acknowledgments
This work was supported by the NSF-NSEC, the ONR, and the AFOSR. GCS is grateful for support from the DOE (DEFGO2-02-ERIS 487). CAM acknowledges a NIH Director’s Pioneer Award.
Footnotes
Supporting Information Available: SEM image of anodic aluminum template. Extinction spectra and SEM images of other size gold rods. This material is available free of charge via the Internet at http://pubs.acs.org.
Contributor Information
Emma Kathryn Payne, Department of Chemistry and International Institute for Nanotechnology, Northwestern University, 2145 Sheridan Road, Evanston, IL 60208-3113 (USA), Fax: (+1) 847-467-5123.
Kevin L. Shuford, Department of Chemistry and International Institute for Nanotechnology, Northwestern University, 2145 Sheridan Road, Evanston, IL 60208-3113 (USA)
Sungho Park, Department of Chemistry & Sungkyunkwan Advanced Institute of Nanotechnology, Sungkyunkwan University, Suwon 440-746 (Korea).
Prof. George C. Schatz, Department of Chemistry and International Institute for Nanotechnology, Northwestern University, 2145 Sheridan Road, Evanston, IL 60208-3113 (USA)
Prof. Chad A. Mirkin, Email: chadnano@northwestern.edu, Department of Chemistry and International Institute for Nanotechnology, Northwestern University, 2145 Sheridan Road, Evanston, IL 60208-3113 (USA), Fax: (+1) 847-467-5123
References
- 1.Synthesis and Plasmonic Properties of Nanostructures. Mater Res Bull. 2005:30. [Google Scholar]
- 2.(a) Duan X, Huang Y, Cui Y, Wang J, Lieber CB. Nature. 2001;409:66. doi: 10.1038/35051047. [DOI] [PubMed] [Google Scholar]; (b) Huang Y, Duan X, Wei Q, Lieber CB. Science. 2001;291:630. doi: 10.1126/science.291.5504.630. [DOI] [PubMed] [Google Scholar]; (c) Cobden DH. Nature. 2001;409:32. doi: 10.1038/35051205. [DOI] [PubMed] [Google Scholar]; (d) Tseng GY, Ellenbogen JC. Science. 2001;294:1293. doi: 10.1126/science.1066920. [DOI] [PubMed] [Google Scholar]; (e) Service RF. Science. 2001;293:782. doi: 10.1126/science.293.5531.782. [DOI] [PubMed] [Google Scholar]; (f) Park S, Chung S-W, Mirkin CA. J Am Chem Soc. 2004;126:11772. doi: 10.1021/ja046077v. [DOI] [PubMed] [Google Scholar]; (g) Kovtyukhova NI, Kelley BK, Mallouk TE. J Am Chem Soc. 2004;126:12738. doi: 10.1021/ja046033m. [DOI] [PubMed] [Google Scholar]; (h) Kovtyukhova NI, Mallouk TE. Adv Mater. 2005;17:187. [Google Scholar]; (i) Quin L, Park S, Huang L, Mirkin CA. Science. 2005;309:113. doi: 10.1126/science.1112666. [DOI] [PubMed] [Google Scholar]
- 3.(a) Mirkin CA, Letsinger RL, Mucic RC, Storhoff JJ. Nature. 1996;382:607. doi: 10.1038/382607a0. [DOI] [PubMed] [Google Scholar]; (b) Alivisatos AP, Johnsson KP, Peng X, Wilson TE, Loweth CJ, Bruchez MP, Jr, Schultz PG. Nature. 1996;382:609. doi: 10.1038/382609a0. [DOI] [PubMed] [Google Scholar]; (c) Taton TA, Mirkin CA, Letsinger RL. Science. 2000;289:1757. doi: 10.1126/science.289.5485.1757. [DOI] [PubMed] [Google Scholar]; (d) Park SJ, Taton TA, Mirkin CA. Science. 2002;295:1503. doi: 10.1126/science.1067003. [DOI] [PubMed] [Google Scholar]; (e) Cao YC, Jin R, Mirkin CA. Science. 2002;297:1536. doi: 10.1126/science.297.5586.1536. [DOI] [PubMed] [Google Scholar]; (f) Nam JM, Thaxton CS, Mirkin CA. Science. 2003;301:1884. doi: 10.1126/science.1088755. [DOI] [PubMed] [Google Scholar]; (g) Katz E, Willner I. Angew Chem. 2004;116:6166. [Google Scholar]; Angew Chem Int Ed. 2004;43:6042. [Google Scholar]; (h) Nam JM, Stoeva SI, Mirkin CA. J Am Chem Soc. 2004;126:5932. doi: 10.1021/ja049384+. [DOI] [PubMed] [Google Scholar]; (i) Georganopoulou DG, Chang L, Nam JM, Thaxton CS, Mufson EJ, Klein WL, Mirkin CA. Proc Natl Acad Sci U S A. 2005;102:2273. doi: 10.1073/pnas.0409336102. [DOI] [PMC free article] [PubMed] [Google Scholar]; (j) Rosi NL, Mirkin CA. Chem Rev. 2005;105:1547. doi: 10.1021/cr030067f. [DOI] [PubMed] [Google Scholar]
- 4.(a) Martin CR. Adv Mater. 1991;3:457. [Google Scholar]; (b) Bonnemann H, Richards RM. Eur J Inorg Chem. 2001:2455. [Google Scholar]; (c) Bell AT. Science. 2003;299:1688. doi: 10.1126/science.1083671. [DOI] [PubMed] [Google Scholar]; (d) Zhang H, Guo Y, Wan L, Bai CL. Chem Commun. 2003;24:3022. doi: 10.1039/b309624f. [DOI] [PubMed] [Google Scholar]; (e) Burda C, Chen X, Narayanan R, El-Sayed MA. Chem Rev. 2005;105:1025. doi: 10.1021/cr030063a. [DOI] [PubMed] [Google Scholar]
- 5.(a) Bohren CF, Huffman DR. Absorption and Scattering of Light by Small Particles. John Wiley & Sons; New York: 1998. [Google Scholar]; (b) Mulvaney P. Langmuir. 1996;12:788. [Google Scholar]; (c) Kreibig U, Schmitz B, Brewer HD. Phys Rev B. 1987;36:5027. doi: 10.1103/physrevb.36.5027. [DOI] [PubMed] [Google Scholar]; (d) Ruppin R. Electromagnetic Surface Modes. John Wiley & Sons; New York: 1982. [Google Scholar]; (e) Ruppin R. Phys Rev B. 1975;11:2871. [Google Scholar]; (f) Clagnet R. Optik. 1972;35:180. [Google Scholar]; (g) Doremus R. J Chem Phys. 1965;42:414. [Google Scholar]
- 6.Oldenburg SJ, Jackson JB, Westcott SL, Halas N. J Appl Phys Lett. 1999;75:2897. [Google Scholar]
- 7.(a) Kumbhar AS, Kinnan MK, Chumanov G. J Am Chem Soc ASAP. 2005 doi: 10.1021/ja053242d. [DOI] [PubMed] [Google Scholar]; (b) Evanoff DD, Jr, Chumanov G. J Phys Chem B. 2004;108:13948. doi: 10.1021/jp0475640. [DOI] [PubMed] [Google Scholar]; (c) Evanoff DD, Jr, Chumanov G. J Phys Chem B. 2004;108:13957. doi: 10.1021/jp0475640. [DOI] [PubMed] [Google Scholar]; (d) Malynych S, Chumanov G. J Amer Chem Soc. 2003;125:2896. doi: 10.1021/ja029453p. [DOI] [PubMed] [Google Scholar]
- 8.(a) Hulteen JC, Van Duyne RP. J Vac Sci Technol A. 1995;13:1553. [Google Scholar]; (b) Jin R, Cao Y, Mirkin CA, Kelly KL, Schatz GC, Zheng JG. Science. 2001;294:1901. doi: 10.1126/science.1066541. [DOI] [PubMed] [Google Scholar]; (c) Jin R, Cao YC, Mirkin CA. Nature. 2003;425:487. doi: 10.1038/nature02020. [DOI] [PubMed] [Google Scholar]; (d) Millstone JE, Park S, Shuford KL, Qin L, Schatz GC, Mirkin CA. J Am Chem Soc. 2005;127:5312. doi: 10.1021/ja043245a. [DOI] [PubMed] [Google Scholar]
- 9.(a) Krenn JR, Schider G, Rechberger W, Lamprecht B, Leitner A, Aussenegg FR, Weeber JC. Appl Phys Letts. 2000;77:3379. [Google Scholar]; (b) Schaich WL, Schider G, Krenn JR, Leitner A, Aussenegg FR, Puscasu I, Monacelli B, Boreman G. Applied Optics. 2003;42:5714. doi: 10.1364/ao.42.005714. [DOI] [PubMed] [Google Scholar]; (c) Laurent G, Felidj N, Aubard J, Levi G, Krenn JR, Hohenau A, Schider G, Leitner A, Aussenegg FR. J Chem Phys. 2005;122 doi: 10.1063/1.1845411. on line. [DOI] [PubMed] [Google Scholar]; (d) Laurent G, Felidj N, Aubard J, Levi G, Krenn JR, Hohenau A, Schider G, Leitner A, Aussenegg FR. Physical Review B. 2005;71 doi: 10.1063/1.1845411. [DOI] [PubMed] [Google Scholar]; (e) Hohenau A, Krenn JR, Schider G, Dilbacher H, Leitner A, Aussenegg FR, Schaich WL. Europhys Lett. 2005;69:538. [Google Scholar]
- 10.(a) Li T, Hunyadi SE, Gou L, Gao J, Orendorff CJ, Gole AM, Sau T, Murphy CJ. J Phys Chem B. 2005;109:13857. doi: 10.1021/jp0516846. [DOI] [PubMed] [Google Scholar]; (b) Soennichsen C, Alivisatos AP. Nano Letts. 2005;5:301. doi: 10.1021/nl048089k. [DOI] [PubMed] [Google Scholar]
- 11.(a) Penner RM, Martin CR. Anal Chem. 1987;59:2625. [Google Scholar]; (b) Martin CR. Adv Mater. 1991;3:457. [Google Scholar]; (c) Martin CR. Science. 1994;266:1961. doi: 10.1126/science.266.5193.1961. [DOI] [PubMed] [Google Scholar]; (d) Martin CR. Chem Mater. 1996;8:1739. [Google Scholar]; (e) Routkevitch, Bigioni T, Moskovits M, Xu JM. J Phys Chem. 1996;100:14037. [Google Scholar]; (f) Thompson GE, Furneaux RC, Wood GC, Richardson JA, Gode JS. Nature. 1978;272:433. [Google Scholar]; (g) Diggle JW, Downie TC, Goulding CW. Chem Rev. 1968;69:365. [Google Scholar]; (h) Keller F, Hunter MS, Robinson DL. J Electrochem Soc. 1953;100:411. [Google Scholar]
- 12.Perez-Juste J, Pastoriza-Santos I, Liz-Marzan LM, Mulvaney P. Coord Chem Revs. 2005;249:1870. [Google Scholar]
- 13.(a) Salem AK, Searson PC, Leong KW. Nature Mater. 2003;2:668. doi: 10.1038/nmat974. [DOI] [PubMed] [Google Scholar]; (b) Salem AK, Hung CF, Kim TW, Wu TC, Searson PC, Leong KW. Nanotechnol. 2005;16:484. [Google Scholar]
- 14.(a) Lee KB, Park S, Mirkin CA. Angew Chem. 2004;116:3110. doi: 10.1002/anie.200454088. [DOI] [PubMed] [Google Scholar]; Angew Chem Int Ed. 2004;43:3048. [Google Scholar]; (b) Oh B-K, Park S, Lee SW, Lee K-B, Mirkin CA. unpublished results [Google Scholar]
- 15.(a) Jana NR, Gearheart L, Murphy CJ. J Phys Chem B. 2001;105:4065. [Google Scholar]; (b) Kim F, Song JH, Yang P. J Am Chem Soc. 2002;124:14316. doi: 10.1021/ja028110o. [DOI] [PubMed] [Google Scholar]; (c) Johnson CJ, Dujardin E, Davis SA, Murphy CJ, Mann S. J Mater Chem. 2002;12:1765. [Google Scholar]; (d) Nikoobakht B, El-Sayed MA. Chem Mater. 2003;15:1957. [Google Scholar]
- 16.(a) Foss CA, Jr, Hornyak GL, Stockert JA, Martin CR. J Phys Chem. 1994;98:2963. [Google Scholar]; (b) van der Zande BMI, Bohmer MR, Fokkink LGJ, Schonenberger C. J Phys Chem B. 1997;101:852. [Google Scholar]; (c) van der Zande BMI, Bohmer MR, Fokkink LGJ, Schonenberger C. Langmuir. 2000;16:451. [Google Scholar]; (d) van der Zande BMI, Dhont JKG, Bohmer MR, Philipse AP. Langmuir. 2000;16:459. [Google Scholar]
- 17.(a) Link S, Burda C, Nikoohakht B, El-Sayed MA. J Phys Chem B. 2000;104:6152. [Google Scholar]; (b) Busbee BD, Obare SO, Murphy CJ. Adv Mater. 2003;15:414. [Google Scholar]; (c) Sau TK, Murphy CJ. Langmuir. 2004;20:6414. doi: 10.1021/la049463z. [DOI] [PubMed] [Google Scholar]; (d) Gou L, Murphy CJ. Chem Mater. 2005;17:3668. [Google Scholar]
- 18.(a) Masuda H, Fukuda K. Science. 1995;268:1466. doi: 10.1126/science.268.5216.1466. [DOI] [PubMed] [Google Scholar]; (b) Masuda H, Mizuno T, Baba N, Ohmori T. J Electroanal Chem. 1994;368:333. [Google Scholar]; (c) Masuda H, Nishio K, Baba N. Thin Solid Films. 1993;223:1. [Google Scholar]
- 19.(a) Gans R. Ann Phys. 1912;37:881. [Google Scholar]; (b) Gans R. Ann Phys. 1915;47:270. [Google Scholar]
- 20.(a) Draine BT, Flatau PJ. J Opt Soc Am A. 1994;11:1491. [Google Scholar]; (b) Purcell EM, Pennypacker CR. Astrophys J. 1973;186:705. [Google Scholar]; (c) Draine BT. Astrophys J. 1988;333:848. [Google Scholar]
- 21.Johnson PB, Christy RW. Phys Rev B. 1972;6:4370. [Google Scholar]
- 22.Draine BT, Goodman J. Astrophys J. 1993;405:685. [Google Scholar]
Associated Data
This section collects any data citations, data availability statements, or supplementary materials included in this article.
Supplementary Materials
Supporting Information Figure 1: SEM image of anodic aluminum oxide template with 85 nm diameter pore.
Supporting Information Figure 2: A) UV-vis-NIR spectra for: 96 nm (bottom), 186 nm (middle), and 321 nm (top) long gold rods. SEM images of: B) 96 nm, C) 186 nm, and D) 321 nm long gold rods.


