


Abstract
The awareness of important biological role played by functional, non coding (nc) RNA has grown tremendously in recent years. To perform their tasks, ncRNA molecules typically unite with protein partners, forming ribonucleoprotein complexes. Structural insight into their architectures can be greatly supplemented by computational docking techniques, as they provide means for the integration and refinement of experimental data that is often limited to fragments of larger assemblies or represents multiple levels of spatial resolution. Here, we present a coarse-grained force field for protein-RNA docking, implemented within the framework of the ATTRACT program. Complex structure prediction is based on energy minimization in rotational and translational degrees of freedom of binding partners, with possible extension to include structural flexibility. The coarse-grained representation allows for fast and efficient systematic docking search without any prior knowledge about complex geometry.
INTRODUCTION
In recent years, the known inventory of functional RNAs that do not belong to protein coding messenger (m) RNA class has increased dramatically (1–3). These so-called non-coding (nc) RNAs appear to play important roles in diverse cellular activities such as RNA processing and modification, translation, gene expression, protein trafficking or chromosome maintenance. In doing so, RNA molecules typically unite with protein partners in functional ribonucleoprotein complexes (4–6). Structural insight into such assemblies is essential for our understanding of their mechanism of action as well as for the future ability to design new diagnostic tools or therapeutic strategies.
The awareness for the importance of ncRNA grows much faster, however, than the available body of structural data. In spite of spectacular successes, such as obtaining high-resolution structures of small and large ribosomal subunits (7,8), protein–RNA complexes comprise currently only ~4% of records deposited in the Protein Data Bank (PDB) (9), while at the same time it is estimated that the portion of genome transcribed into ncRNA may be even 20 times larger than the protein coding part (3). X ray crystallography of macromolecular complexes, particularly containing nucleic acids, is a more difficult task than the determination of isolated components. Thus, computational docking techniques, aiming at the prediction of the complex structure based on its components, are becoming increasingly important. Even though they still need to tackle many challenges before becoming a reliable standalone tool (10), they already play an important role in the integration of structural data coming from experimental methods that provide different levels of spatial resolution (11,12).
To date, most computational efforts for ribonucleoproteins were focused on the characterization of binding interfaces (13–17) or the localization of RNA binding sites on proteins (18–23) rather than docking. In contrast to protein–protein docking that has an established record (10), to our knowledge, only very few preliminary attempts have been made for the actual protein–RNA binding mode prediction (24–26). They are based on distance-dependent atomic statistical potentials for protein–RNA interactions (24,25) or statistically derived propensities for protein–RNA pairing at the residue level (26). Descriptors developed for quantifying protein–RNA interactions were demonstrated to distinguish between native structures and provided decoys (24,25), or to improve ranking of near-native solutions obtained using shape complementarity-based scoring (26).
Recently, protein–RNA complexes were included as targets in the Critical Assessment of PRediction of Interactions (CAPRI) competition (27). Most of the participating groups adapted for this occasion methods developed for protein–protein docking and used experimental restraints to facilitate native-like geometry selection. Out of two ribonucleoprotein targets, one required homology modeling of both binding partners and was not solved by any of the competing groups, while the second, with provided bound RNA geometry, allowed for a number of successful, medium accuracy predictions. The presence of protein–RNA targets for the first time in CAPRI competition indicates the growing interest in computational prediction of ribonucleoprotein structures and consequently, the need for new methods, targeted specifically on protein–RNA docking problems.
In the current study, we design and parametrize a distance-dependent, coarse-grained forcefield for protein–RNA interactions. This forcefield is compatible with an earlier parameter set developed for protein–protein docking by Zacharias (28,29). It allows for fully systematic protein–RNA docking by energy minimization in the rotational and translational degrees of freedom of the binding partners. Unlike propensity-based descriptors, the distance-dependent potential function provides all necessary means for finding realistic bound geometries and their subsequent scoring by the resulting potential energy. Structure representation at the sub residual coarse-grained level allows for efficient calculations, yet at the same time maintains reasonable details of physicochemical features.
In the following sections, we describe forcefield development and testing based on 110 crystallographic structures of protein–RNA complexes. We also consider its application to few protein–RNA complexes with available structural data for bound state as well as unbound components.
METHODS
Coarse-grained representation
The presented potential for protein–RNA interactions is designed to be compatible with the earlier coarse-grained parametrization developed for proteins by Zacharias (28,29). In Zacharias model, each amino acid is represented by up to four pseudoatoms (beads): two corresponding to main chain nitrogen and oxygen, and one or two describing short and long side chains, respectively. In total, there are 31 pseudoatom types. To extend this model for nucleotides, 17 new bead types were introduced. They include three pseudoatoms for phosphate/ribose part, and three or four for purine and pyrimidine bases, respectively (Figure 1).
Figure 1.

Coarse-grained representation for nucleotides. Beads (dashed circles) are either centered on particular atoms or at geometric centers of a few atoms (dots).
The assumed, pairwise additive interactions between protein and RNA beads are described by a distance-dependent potential that has two different forms, corresponding to attractive and repulsive interactions (Figure 2). The attractive potential is of Lennard–Jones type, with a soft repulsive term:
| (1) |
Pairwise-specific parameters σij and ϵij govern interaction range and strength, respectively. The repulsive potential is defined as:
| (2) |
where  and
and  correspond to the position and value of
  minimum. Such formula provides a smooth, easily implemented potential, albeit with non-physically vanishing force at rm. Unlike in the Zacharias model for proteins, no separate electrostatic terms were introduced, thus assuming that the above potentials account for all effective intermolecular interactions.
Figure 2.

Repulsive and attractive potential form. rm and Um: the position and value of Uattr minimum.
Potential parametrization
The interaction of each pair ij of protein and RNA beads is described by two parameters (σij and ϵij), hence giving in total 1054 parameters for protein–RNA force field. They were derived in a knowledge-based manner, using a set of protein–RNA crystallographic complexes. At first, distance-dependent statistical potentials  were constructed for each bead pair, and the initial values of σ and ϵ parameters were obtained by fitting Equations (1) and (2) to
  . The resulting parameter values were subsequently adjusted to optimize docking results in terms of finding the right (close to native) binding mode and its proper scoring. The details of parametrization procedure are given in the following.
‘Protein–RNA complexes’ were selected from crystallographic structures used recently for the analysis of protein–RNA binding sites (22,23). The provided lists of non-redundant complexes, having resolution better than 3 Å, were merged together, and a search for homologous structures was performed using Smith and Waterman algorithm (30) for proteins, with the similarity threshold of 70% sequence identity, and nucleotide BLAST algorithm (31) for RNA, with the similarity threshold of 80% sequence identity. Two complexes were deemed redundant, if similarity thresholds were simultaneously exceeded by their both binding partners, thus allowing single binding component to be considered for docking with different partners. A list of complexes sharing one similar binding component is given in the Supplementaty Data.
The non-redundant structures were than subjected to manual analysis with the following rules:
complexes in which a DNA molecule was found to bind protein and RNA molecules were discarded;
structures with multiple missing side chains or nucleotides were discarded;
structures with protein–RNA contact involving <5 nt were discarded;
structures in which one of the binding partners was ribosome were excluded from the optimization of ϵ parameters (see below) and from the test set for docking; and
homopolymers were identified and their multiplicity (n) was taken into account in the derivation of statistical potentials: polymers were analyzed as monomers, but their contribution to bead pair statistics was counted with weight 1/n.
All protein chains were processed with pdb2pqr program (32) in order to standardize atomic names and, if possible, reconstruct missing chemical groups. Complex geometry was left as submitted in the crystallographic structure. Finally, all structures were converted to coarse-grained representation.
The above procedure resulted in 109 protein–RNA complexes, including 20 structures with ribosomal RNA. Out of this group, 84 structures, including all ribosomal complexes, were used for the statistical potential derivation and the optimization of σ parameters, and 64 of them (non-ribosomal) were used for the optimization of ϵ parameters. The remaining 25 non-ribosomal complexes were assigned to the test set.
‘Statistical potentials’ for protein–RNA interactions were derived, using the following formula:
| (3) |
Here, Nobs and Nexp represent the number of observed and expected occurrences of a given ij bead pair at a distance d ± δ. In the calculations, d spacing of 0.5 Å was used, with δ of 0.25 Å, and a distance range up to 14 Å was considered. While obtaining Nobs for the known atomic coordinates of protein–RNA complexes is rather straightforward, Nexp requires more attention. It should correspond to the number of observations expected for the random, interaction-independent placements of protein with respect to RNA, given their average structural features and (pseudo)atomic composition.
Nexp was defined based on geometric considerations as :
| (4) |
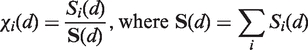
Here, NTot(d) corresponds to the total number of pairs found with distance d between beads, while χi(d), and analogously χj(d), is a probability that any bead can be placed at a distance d from the bead of type i, given average structural features of protein (or RNA) molecules.
χi(d) values are obtained as the i-th fraction of the total accessible surface of radius d, S(d), that can be constructed for protein (or separately RNA) structures extracted from the available complexes:
 |
(5) |
Si(d) is the contribution to the total accessible surface area due to all surfaces of type i beads. Those surfaces are defined as points accessible to the center of a probe of radius RP, remaining at a distance d from the bead of interest (Figure 3).
Figure 3.

The accessible surface of radius d for a bead of type i located at  . Rp is a probe radius.
 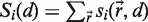 .
.
The beads radii were estimated using the acquired Nobs(i, j, d), as an average of half distance of closest approach for all considered interaction partners for a given bead. The probe radius, in turn, was defined as an average of all bead radii, yielding Rp = 1.78 Å. The numerical results for χ(d) appeared to be insensitive for small (~0.1 Å) variations in the applied radii.
Parameters optimization
The initial parameter set was obtained by fitting Equations (1) and (2) to the derived statistical potentials and choosing the (σ, ϵ) pair providing the lowest root mean square deviation (RMSD) from  . In order to optimize the performance of the obtained parameter set for protein–RNA docking, the parameters were further adjusted using a two-stage procedure.
In the first stage, only σ parameters were optimized to provide possibly best stability of native structures. Due to large dimensionality of parameter space, a random, Monte Carlo-like optimization scheme was introduced. The following optimization block was iterated until no further improvement was observed (In practical application, steps (3) and (4) were modified for better efficacy: the search started from a given σ value, proceeded in positive and than negative direction, but each search direction was interrupted before checking all k values as only the score started to decrease.):
start with the current parameter set;
randomly select one σ parameter from those that were not yet selected;
for each of 2k + 1 values: σ − kΔσ,‥, σ,‥, σ + kΔσ perform potential energy minimizations for the set of native complexes, and score the results;
keep the σ value that provides the best score;
if some σ parameters remain to be scanned, go to point 2
The energy minimization was done in protein (ligand) translational and rotational degrees of freedom, with both binding partners kept rigid. The scoring performed in point (3) was based on the following criteria applied to each minimized complex:
if alpha carbon RMSD of minimized versus native protein position was greater than >5 Å, a ‘large penalty’ (LP) was applied; and
if RMSD was between 1.0 and 5.0 Å, its square was accumulated in ΣRMSD variable.
The best score was considered to have the lowest number of LP or smallest ΣRMSD value among the scores with the same number of LP. Such scoring scheme was tuned for finding solutions close to native (with RMSD <5 Å) with possibly low RMSD, but deeming unimportant RMSD variations below 1.0 Å. In practical application, k = 6 was chosen for each optimization round, and Δσ value was set as 0.1/N Å, where N corresponded to the optimization round number.
The second optimization stage involved the adjustments of ϵ parameters to enhance scoring of native-like complexes. In order to evaluate the scoring efficiency, a set of 200 decoys was introduced for each considered protein–RNA complex. They were obtained as low energy solutions of systematic docking run whose RMSD from native structure was >5 Å. Such systematic docking was performed from starting points evenly distributed over the receptor surface, hence the locations of the decoys were not limited to the area of binding interface (see ‘Docking protocols’ section below).
A following optimization scheme was repeated until no further improvement in the number of correctly ranked complexes was observed:
start with the current parameter set and perform energy minimization for native complexes and all decoys;
randomly select one ϵ parameter from those that were not yet selected;
for each of 2k + 1 values: ϵ − kΔϵ,‥, ϵ,‥, ϵ + kΔϵ perform a single point energy evaluation for all structures;
keep the ϵ value that provides the best ranking of native complexes;
if some ϵ parameters remain to be scanned, go to point (2).
The criterion for the best overall ranking was based on the ability to provide the lowest energy for native-like (energy minimized) complexes with respect to their corresponding decoys. The best ϵ value was regarded as having the highest number of properly ranked (i.e. with rank 1) native-like complexes. If a few ϵ values resulted in identical ranking, the one with lowest penalty score was then chosen. The penalty score was calculated for complexes that did not rank properly. It depended on the RMSD of native-like complex (native complexes with high RMSD after energy minimization were not expected to be ranked as precisely as complexes with low RMSD), the actual rank of native-like complex among its decoys (the higher the rank the smaller penalty) and the difference in energy between the native-like complex and the best ranked decoy. For the ϵ optimization procedure, k = 2 and Δϵ = 0.1 kcal/mol were chosen. For further details, see the Supplementary Data.
Parameter set evaluation
The random optimization scheme does not guarantee reaching single, globally best parameter set, even if (unlikely) such set exists. In order to obtain insight into the validity of the adopted optimization procedure, three independent parameters optimizations were carried out. The three resulting interaction potentials for each bead pair were compared with the analysis of standard deviations of their minima or saddle point positions with respect to their mean location. Minimum or saddle point position is a simple function of σ parameter (on the distance scale) and ϵ parameter (on the energy scale). In order to combine the deviations in σ and ϵ components, they were normalized by the respective average σ or ϵ deviations over all bead pairs. Such normalized deviations, Sσ and Sϵ, were then combined, yielding a single value 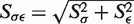 , measuring the variability of a given bead pair interaction across the three sets.
Finally, an average, consensus parameter set was constructed, and docking efficacy of all four potentials was compared.
Docking protocols
All docking simulations performed in the current study were carried out with the ATTRACT program (28). They involved two rigid partners in coarse-grained representation: an RNA structure treated as an immobile receptor and a protein structure treated as a movable ligand. No additional information such as distance constraints or binding region location was submitted. Prior to docking, a set of starting ligand positions evenly distributed with spacing of ~12 Å around the receptor at distances precluding receptor-ligand overlaps was generated. For each such position, 208 initial ligand orientations were considered. A single docking attempt consisted of five stages of potential energy minimization in ligand translational and rotational degrees of freedom, with decreasing distance cutoff for pairwise interactions. The initial cutoff was set to 50 Å and final cutoff was set to be 8 Å.
The solutions with converged potential energy were then clustered according to their pairwise RMSD distances in order to remove redundant ligand poses. Scoring of the results was done according to their potential energy.
RESULTS AND DISCUSSION
Potential parameters
The obtained statistical potentials provide a valuable characterization of the assumed interaction model (see Supplementary Data for the corresponding plots): they reasonably indicate attractive and repulsive pseudoatom pairs, define the distances of closest approach and give the estimate of interaction strength.
Their use as a definite and only basis for deriving interaction potentials in the form of Equations (1) or (2) is, however, limited. First, due to a relatively small number of available, high-quality protein–RNA complexes, for some particularly infrequent bead pairs, considerable unphysical oscillations in the statistical potential are observed, rendering the fitting procedure inaccurate. Second, in some cases the statistical potential does not reach the zero baseline for distances as large as 14 Å, requiring an arbitrary decision whether the potential should be shifted before fitting, and if yes, what offset value should be used. Finally, the assumption that a statistical potential between two beads describes their pairwise interaction in the context of specific macromolecular environment is not physically justified (33).
Due to these reasons, the statistical potentials were used to generate only an initial guess for the parameter set (called ‘set 0’ in the following), with its subsequent optimization, specifically for docking and scoring application, in mind. Given the large dimensionality of parameter space and relatively limited size of the training set, it is reasonable to expect that the result of parameter optimization would be sensitive to the order of pairwise potentials adjustments. As no indisputably superior adjustment sequence was determined, a random scheme was adopted and three independent optimization procedures were carried out. In addition, a consensus parameter set was constructed, obtained by averaging of respective σ and ϵ parameters of all three sets.
Pairwise interactions amplitudes—well depths (negative values) for attractive potentials or saddle point heights (positive values) for repulsive potentials—for the consensus set (Figure 4), agree, in general, with the expected protein–RNA interaction characteristics. If the percentage of strong interactions (defined as having an amplitude higher than average repulsive or attractive interaction plus their respective one standard deviation) offered by a given bead is a measure of its importance for the specificity of protein–RNA recognition, the aromatic protein side chains (Tyr, Trp, Phe, His) appear to be the most contributing group, in line with the traditional view (34). They preferentially interact with nucleic bases rather than RNA backbone, which reflects stacking interactions they are supposed to make.
Figure 4.

Color map: average amplitudes—well depths (negative values) or saddle point heights (positive values)—of interaction potentials for all bead pairs. Side plots: the percentage of strong interactions for each bead; strong interactions are defined as having an amplitude higher than average plus 1 SD.
Strong, mostly attractive interactions are observed for positively charged arginine. They are directed predominantly toward nucleic bases, at least if its distal, ARGS, bead is concerned. Interestingly, a similarly charged lysine appears to favor the RNA backbone instead, while the rest of its interactions is only moderate, with the exception of strong attraction to GG4 guanine pseudoatom. As expected, strong attraction is also observed between protein backbone nitrogen and pseudoatoms representing hydrogen bonds acceptors on nucleic bases.
The repulsive interactions, while not driving the complex formation, are also important for binding specificity. A significant repulsion is observed between negatively charged RNA phosphate groups and ionized side chains of Glu and Asp, and also for Gln, Asn and protein backbone oxygen. Interestingly, Cys appears to be in general the most RNA-repelling amino acid, both when phosphate backbone and nucleic bases are concerned, even though it does not carry a net charge.
The weakest interacting beads, in turn, belong to hydrophobic residues (Ile, Leu, Val, Ala, Gly) on the protein side, and sugar moiety on the RNA side.
As expected, the exact values of parameters for the optimized interaction potentials vary across all three parameter sets. An average deviation for pairwise interaction with respect to mean location of its potential minimum or saddle point is 0.07 Å on distance scale (Sσ) and 0.18 kcal/mol on energy scale (Sϵ). The observed combined deviations (see ‘Methods’ section) differ considerably among all pairwise potentials (Figure 5). To some extent, they reflect a statistical uncertainty due to an absolute number of bead pairs used to derive a given potential: rarely observed pseudoatoms like those in Trp or Met tend to have greater variability in their interaction potentials, whereas frequent beads like those in RNA or protein backbone tend to contribute to more repetitive potentials. Such trend is also visible for nucleic bases with most often encountered guanine having on average lower deviations than less frequent uracil and adenine. For some ubiquitous pseudoatoms, however, like those in Arg, Lys or protein backbone oxygen, average deviations, though still below the mean for all protein beads, remain relatively high. Interestingly, those pseudoatoms are among the group that seems to particularly contribute to protein–RNA recognition. Perhaps, having high impact on docking performance, they are also exceptionally sensitive to the order of parameter optimization, and each time their interactions are being optimized, the adjustment depends on the actual state of all other pairwise potentials. It indicates that there are many local optima in the interaction parameters space, resulting in similar docking efficiency for the limited training set. In order to mitigate the effect of such random parameters overfitting toward the training set structures, a consensus parameter set was constructed by averaging all respective σ and ϵ values of the three optimized sets.
Figure 5.

Deviations of minimum or saddle point locations for three sets of pairwise potentials with respect to consensus set. Side plots: average deviations for each pseudoatom type (points), relative frequencies of pseudoatoms found in interacting pairs (histograms). All data normalized such that average values equal one.
Docking performance
Upon completion of parameters derivation, a systematic docking search was carried out for all non-ribosomal complexes from the training set (64 in total) and the test set (25 in total). Docking performance was evaluated based on interface RMSD (iRMSD) relative to the native interface composed of protein–RNA bead pairs found within the cutoff distance of 8 Å in the crystallographic structure, and the fraction of established native contacts (fNC) within such interface. A docked ligand pose was considered as a ‘hit’, with iRMSD ≤2 Å and fNC ≥0.3, or iRMSD ≥1 Å with fNC ≥0.5. Such criteria are equivalent to ‘hit’ being ‘high’ or ‘medium’ quality solution according to the CAPRI challenge (35) guidelines. Separately, the statistics for hits of only ‘high’ quality (i.e. with iRMSD ≤1.0 Å and fNC ≥0.5) was determined.
Before performing a systematic docking search, in order to evaluate forcefield ability to provide stable complexes consistent with experimental binding modes, potential energy minimization of crystallographic structures was carried out. For each parameter set, except the non-optimized set 0, all complexes, both in the training and test set (Table 1), were found to be stable in the sense that the converged energy minimum met the adopted criteria for ‘hit’. Most of the the optimized geometries (~85%) corresponded to high-quality solutions. Interestingly, in some cases when crystallographic complex distortion exceeded the assumed tolerance for high-quality model, such solution was found during systematic docking search, though not necessarily scored as the best. It is worth stressing that crystallographic structures are usually computationally optimized with the use of atomic forcefields, and some residual strains are likely to be encountered when switching to a different set of interaction potentials. Hence, the imbalance of particular receptor-ligand geometry during rigid body energy minimization does not preclude the forcefield ability to provide energy minimum that corresponds to physically equivalent binding mode.
Table 1.
Docking results for the initial parameter set (0), three optimized parameter sets (1, 2, 3) and the consensus set (C)
| Parameter set | Training set |
Test set |
||||||
|---|---|---|---|---|---|---|---|---|
| Ns | N1 | N10 | Nall | Ns | N1 | N10 | Nall | |
| 0 | 88 (72) | 19 (19) | 23 (23) | 67 (50) | 92 (60) | 4 (4) | 8 (8) | 72 (48) |
| 1 | 100 (86) | 50 (41) | 75 (59) | 86 (66) | 100 (84) | 36 (36) | 56 (56) | 92 (76) |
| 2 | 100 (89) | 52 (42) | 81 (62) | 92 (70) | 100 (80) | 40 (40) | 64 (56) | 88 (76) |
| 3 | 100 (84) | 62 (53) | 73 (58) | 86 (66) | 100 (84) | 40 (40) | 52 (52) | 88 (80) |
| C | 100 (83) | 61 (53) | 80 (66) | 88 (70) | 100 (84) | 48 (44) | 76 (72) | 100 (84) |
Numbers correspond to the percentage of hits for crystallographic structure energy minimization (Ns), and for systematic search within best rank solutions (N1), within 10 best solutions (N10), and within all docked poses (Nall). Numbers in brackets correspond to solutions of ‘high’ quality (see text for definition).
The performance of parameter set obtained solely upon fitting to statistical potentials (set 0) in terms of providing stable native-like geometries, was surprisingly good, given that its parameters were not tuned in any way to achieve this task. Around 90% of complexes remained stable, and majority of the ‘optimized’ geometries corresponded to high-quality solutions, with no significant difference between the training and test set.
The results of systematic docking searches are presented in Table 1. For optimized and consensus potentials, native-like solutions in training set complexes are found to have the highest rank (lowest potential energy) in 50–62% cases, depending on parameter set used. The success rate increases significantly when native-like solutions are allowed to have up to 10th rank, and further increase in rank threshold brings only moderate improvement (Figure 6). For the test set, optimal ranking is achieved for 36–48% of structures, and the success rate tends to saturate at higher rank threshold (Figure 6). Interestingly, portions of generally found native-like solutions are similar for both training and test sets, indicating that the force field ability to score the results is more prone to overfitting than its ability to provide proper geometries. This can be understood, as binding geometries depend mostly on effective pseudoatomic radii, while energy values are additionally sensitive to amplitudes of interaction potentials.
Figure 6.

The percentage of hits at given rank threshold obtained for three optimized parameter sets and the consensus set. Lower set of dashed lines: the numbers of hits with rank 1, upper set of dashed lines: the numbers of generally found native-like solutions.
As expected, the performance of parameters from set 0 is much worse compared with optimized and consensus potentials. While the fraction of generally found solutions is moderately good, in accordance with the number of stable structures found during crystallographic complex energy minimization, the ability of non-optimized potentials to score the results is rather poor. Indeed, the position of minimum (or the range of hard core bead-bead interaction) in statistical potentials seems to be relatively reliable and error-resistant physical descriptor in contrast to interaction strength. As a result, set 0 potentials approximate shape complementarity but fail in providing a meaningful estimate of the binding free energy.
The performance of the three optimized parameter sets is generally similar within training or, separately, test set structures. The consensus parameter set does not bring much difference with respect to training set, but clearly outperforms the three optimized potentials when test set structures are considered. It suggests, that parameter averaging might indeed have contributed to the the reduction of inter parameter correlations arising from overfitting.
If obtaining a native-like solution, as the one with the lowest potential energy, is considered as an ultimate goal of docking study, the most common reason for the lack of success is improper scoring (error of type 1, E1). It accounts for ~70% of failures for the training set structures and >80% for the test set structures (Table 2). The inability of systematic search procedure to find native-like binding geometry (error of type 2, E2), corresponds to 16–38% of failures for the training set and up to 20% for the test set. As noted above, the actual percentage of structures for which systematic search fails to find a native-like geometry is similar for training and test sets (~10%), and differences in relative frequencies of E1 versus E2 errors for those sets result from generally worse scoring for the test set structures. Error distribution obtained with non-optimized parameter set 0, shows a greater proportion of E2 errors when compared with optimized and consensus parameter sets. Again, it indicates that the optimization of shape complementarity encoded in the potentials is more efficient than the optimization of their scoring capabilities.
Table 2.
Relative fractions (in %) for two types of docking errors
| Parameter set | Training set |
Test set |
||
|---|---|---|---|---|
| E1 | E2 | E1 | E2 | |
| 0 | 60 | 40 | 71 | 29 |
| 1 | 72 | 28 | 88 | 12 |
| 2 | 84 | 16 | 80 | 20 |
| 3 | 62 | 38 | 80 | 20 |
| C | 68 | 32 | 100 | 0 |
E1: the hit is found but scores improperly; E2: the hit is not found at all during systematic search.
From the structural point of view on docking efficiency, the considered protein–RNA complexes tend to be either easy (docked and scored within top 10 for all four parameter sets) or difficult (with rank worse than 10 for all four parameter sets). The fractions of complexes belonging to those two classes (Figure 7) are much higher than estimates based on the supposition that the success (or failure) in docking for one parameter set is independent from the results for other parameter sets, i.e. can be expected with probability being a product of success (or failure) probabilities in each case. Clearly, to some degree it is the effect of correlations between parameter sets, as they are derived from a common predecessor, but more importantly it is a consequence of structural properties of the investigated complexes.
Figure 7.

Left: the distribution of easy, medium and difficult docking structures, and an estimate of their relative frequencies assuming no correlation between docking efficiency and structural properties. Right: the distribution of structural features among difficult complexes; R IB, L IB—the number of interfacial beads in receptor and ligand, R S, L S—receptor and ligand accessible surface area. Features ranges are normalized with 0 and 100 corresponding to the lowest and highest observed values, respectively.
In most cases, complexes regarded as difficult have small interface region (see Figure 9 for examples: 2F8S, 2DLC, 1YYW). The number of interfacial beads on both receptor and ligand side for ~80% of difficult structures is within the lowest 20% of interfacial bead numbers for all complexes (Figure 7). Typically in such cases, a native-like geometry is found but scores badly, as alternative solutions provide more, albeit usually worse, contacts. On the contrary, in 2 of 11 difficult cases (1F7U, 1FFY) the interface size is exceedingly large (close to the maximum of the observed interfacial bead number range). For those complexes, native-like solutions are not found at all during systematic search, as tightly packed, large binding region precludes successful docking of rigid partners, even though crystallographic structures correspond to stable energy minima. In general, the size of protein interface appears to be slightly more important for docking efficiency. Perhaps, it is due to greater contribution of protein partners to specific recognition (22), which is a consequence of greater variability among protein polymer building blocks in comparison with just four types of standard RNA nucleotides.
Figure 9.

Examples of crystallographic structures (marked by PDB-id) for ‘difficult’ cases (upper row), successful unbound docking (middle row) and unsuccessful unbound docking (lower row). Green: bound receptor; blue: unbound receptor; gray: native ligand geometry; red: best docked solution. Below PDB-id is the rank of the presented solution and its iRMSD/fNC.
The absolute size (accessible surface area) of binding partners seems to have little influence on docking efficiency. Structures of different sizes are in general evenly distributed among difficult and non-difficult complexes (Figure 7), with the exception of three largest ligands. Two of them, however, (2F8S, 1SER) appear to have rather small interface regions, while the third one (1FFY) was already mentioned as having extremely large and tight interface.
Improving docking performance
As noted above, proper scoring of docked geometries appears to be the major factor that affects docking performance. A possible way to increase scoring efficiency is to use information about the expected interface location in order to amplify ligand–receptor interactions originating from this area. To date, a number of methods have been developed for the prediction of RNA binding sites on proteins (18–23). Unfortunately, predicting protein binding sites on RNA is much more difficult task and, apart from general characterization of protein binding interface on RNA (13–17), to our knowledge no predictive methods exist to tackle this problem. Due to this reason, only the influence of protein interface predictions will be considered.
Instead of evaluating the usefulness of particular approaches for the prediction of RNA binding region in proteins, a generic estimate of the predictive power required to improve scoring was carried out. The true protein interface was assumed to consist of beads involved in the formation of native contacts with RNA (see above for definition). Its status was perturbed to the desired level of specificity and selectivity by randomly introducing some false positive and false negative interfacial beads to protein structure. Finally, for each such ‘prediction’, two hundred lowest energy solutions of systematic docking search for each complex were rescored with the interactions for ligand ‘interfacial’ beads scaled up by some weight factor (W). An alternative scheme, in which only attractive interactions were scaled, was also considered but the results were qualitatively the same and, hence, are not shown. Due to random character of beads reassignment, interface perturbation and rescoring of docking results were repeated five times for each prediction quality and weight factor combination, and average numbers of best ranked native-like geometries were recorded.
Moderate scaling (W = 1.25) of the predicted native interactions appears to have in general a small beneficial effect on scoring efficiency (Figure 8). Even with relatively low prediction quality, it provides up to ~10% increase in top ranked hits. Greater weighting factors allow reaching better results, up to ~30% increase in optimal scores. This effect tends to saturate, however, and interaction scaling above W = 5 does not improve the results, even for ideally ‘predicted’ interface (with sensitivity and selectivity of 1). This is understandable, as predictions affect only the protein binding partner and thus, false solutions, in which a correct protein region binds to an incorrect RNA region, can also benefit from interaction scaling.
Figure 8.

Rescoring of 200 lowest energy solutions with protein interfacial interactions scaled by weight W. NW/N1—the ratio of best ranked hits for weight W to original result with W = 1. Sensitivity and specificity refer to the prediction quality of protein interface region. Black dots indicate prediction quality of some available methods taken from Ref. (23).
Interestingly, higher W values require better prediction quality in order to improve scoring efficiency. In fact, poor predictions tend to even worsen the original (W = 1) results, and this effect becomes increasingly evident with growing W. At the same time, high sensitivity appears to be somewhat more beneficial than specificity, suggesting that finding as many interfacial pseudoatoms as possible, even at the expense of false positive predictions, is favorable to capturing only few, but truly interfacial beads. Indeed, in the latter case, some false solutions that partially overlap with the correct binding region may easily benefit from high W values, if only they involve contact through singular promoted interfacial beads.
Confronting the above considerations with the expected effectiveness of currently available methods for RNA binding site prediction (Fig. 8), indicates that making use of their results would improve scoring efficiency by 10–20% with moderate interaction scaling (W < 5). For W = 5 and above, most methods seem to give prediction quality that may not be sufficient for such improvement, or may even deteriorate scoring.
The inability of systematic search procedure to find native-like binding geometry (E2 error type) was the second reason for the lack of docking success. In some cases, like those with large and tight interface, relatively little can be done to avoid this type of failure within the framework of rigid structures docking. In other cases, with just narrow ‘binding funnel’ leading from starting points for energy minimization to a bound complex, an increase in the density of initial ligand placements should be of help. Indeed, a 2-fold increase of starting points density limits the fraction of complexes with no native-like solution from 12% to 5% for the training set (results for the consensus parameter set). Furthermore, three out of all five newly found hits score with top rank (and represent ‘high’-quality solutions), indicating that E2 errors occur indeed due to geometrical constraints rather than forcefield inability to provide a proper energy landscape. In the case of test set, there were no structures with E2 error for the consensus parameter set, hence no improvement in this respect was observed, but one additional high-quality solution was found when the number of starting points was doubled. Certainly, an increase in the number of initial ligand placements results in a proportional increase in the time needed for systematic search, but such computational burden can be reduced by the inclusion of information about the putative binding site location on RNA and appropriate starting point density modulation.
Docking of unbound structures
The docking of protein to RNA in their unbound conformations represents scenario encountered in real-life applications. On top of difficulties related to obtaining proper ligand placement and its scoring, a significant obstacle arises due to local and global conformational changes that likely occur upon binding and need to be predicted for successful docking. Addressing this issue is beyond the scope of the present report, focused on the development of an intermolecular interaction potential. Nonetheless, the performance of rigid docking with the use of consensus parameter set was checked on few available unbound structures of both binding partners in order to give an estimate for the level of structural deformation that still does not preclude successful docking.
Unbound structures were required to have at least 95% sequence identity of the overlapping region with bound version, both in the case of RNA and proteins. As there are very few such instances, in the case of bound RNA in the form of straight double helix, for which exists an unbound protein partner, a modeling of 3D structure was performed using secondary structure as an input. The program Assemble (36) was used for this task. The criteria applied so far for the detection of ‘hit’ were extended to incorporate solutions of ‘acceptable’ quality according to CAPRI classification, that is having iRMSD ≤4.0 Å and 0.1 ≤fNC <0.3, or iRMSD >2.0 Å and fNC ≥0.3.
Though the statistics based on just few presented cases is not particularly meaningful, it allows to divide the results in two classes.
In cases when the protein partner binds on the surface of double RNA helix (Figure 9, 1DFU, 1JBR, 2AZ2, 2RKJ), docking results appear to be more sensitive to the distortion on protein rather than RNA side (Table 3). RMSD up to 2.8 Å on the RNA side did not preclude finding a hit or acceptable solution within the top 20 solutions, when docking of protein in its bound conformation was considered. At the same time, for bound RNA–unbound protein pair, there was no correspondingly high ranked solutions, even for relatively low protein RMSD. Such result may be expected, as in those cases specific binding occurs due to, generally movable, protein side chains, while the topology of RNA minor and major groves remains relatively unchanged. The stability of helical RNA and rather loose binding geometries account also for quite successful docking of two partners in their unbound conformations: in all three cases, solutions were found within 100 top geometries.
Table 3.
Results for docking with unbound structures
| Complex | Receptor | Ligand | br:bl | ur:bl | br:ul | ur:ul |
|---|---|---|---|---|---|---|
| 1DFUmn:p | 364Dabc (2.8) | 1B75 (3.8) (3.8) |
3 | 1 | −[18] | −[4] |
| 1JBRd:b | 430Da (2.8) | 1AQZa (0.6) | 14 | 18 | 30[2] | 100 |
| 1K8Wb:a | 2K4C (2.8) (2.8) |
1R3Fa (1.5) | 1 | – | 2[1] | – |
| 1TTTd:a | 6TNAa (2.6) | 1TUIa (10.1) | 1 | −[480] | 291 | – |
| 2RKJc:a,b | 1Y0Qa (2.6) | 1Y42aa (1.1) | 2 | −[13] | −[>1k] | −[>1k] |
| 2AZ2cd:ab | model (1.4) | 2B9Z (1.5) (1.5) |
3 | 3[1] | >1k[349] | >1k[43] |
| 2E9Tbc:a | model (3.3) | 1U09a(0.8) | 2 | −[712] | >1k | −[-] |
Subscripts at PDB id denote involved chains, numbers in brackets correspond to RMSD (P atoms for receptor and Cα for ligand) versus bound structure (in case of multiple NMR models an average value is provided); br, bl, ur, ul—bound/unbound receptor/ligand; numbers correspond to the ranks of ‘hits’ or ‘acceptable’ solutions (in square brackets).
Asterisk denote NMR structure.
The situation is more difficult in the case of protein binding to single-stranded termini of RNA chains (Figure 9, 1TTT, 2E9T). Here, the distortion of unbound RNA allows for finding only poorly scored solutions of ‘acceptable’ quality. Also, as binding is generally tighter than in previous cases, even small change in protein structure (RMSD of 0.8 Å for 2E9T) gives unfavorable score for the hit found. In both cases, docking of two unbound partners was unsuccessful.
The remaining complex (Figure 9, 1K8W) does not belong to the above classification. Here, binding involves a long RNA loop with most bases in flipped out geometry. The docking of unbound protein to bound RNA is surprisingly successful, but solutions for unbound RNA conformation are not found. This, however, does not need to result from the changes in the geometry of binding site on RNA, but from the fact that unbound RNA represents a complete molecule (tRNA) whose fold outside the region overlapping with bound structure causes significant sterical clashes with bound protein, thus precluding any successful binding. Whether tRNA needs to refold upon binding, or the crystallographic structure of complex involving incomplete RNA does not represent real geometry, remains an open question.
CONCLUDING REMARKS
A new coarse-grained force field for protein–RNA interactions targeted on docking applications was presented. It is compatible with earlier representation developed for protein complexes and suitable to use within the ATTRACT docking protocol (28), based on intermolecular potential energy minimization. The force field was parametrized and tested with the use of 110 crystallographic structures of protein–RNA complexes. It showed a good performance in systematic docking search for protein–RNA binding geometries when two partners were considered in their bound conformations. The presented results were obtained without any additional constraints based on information regarding the putative binding site location; however, the possible role of such information in augmenting docking efficiency was demonstrated.
The application to unbound structures showed promising results in the cases with loose binding interfaces, for which moderate deformations of global structure do not affect much the topology of native contacts. In the cases where complex formation involves local conformational changes and the creation of sterically tight interpenetrating binding interfaces, rigid body docking was obviously unsuccessful, however, due to reasons not related to forcefield performance.
Addressing the issue of global and local conformational changes in protein and RNA binding partners is a significant challenge, remaining within the scope of not only docking, but also folding community. An important problem, particularly affecting the development of docking methodologies, is the small amount of available structural data representing both the geometry of a complex and its components in free forms. The currently presented forcefield, providing a reasonable estimate of intermolecular interaction energy at low computational expense, is a good basis to be coupled with existing and future methods accounting for molecular deformability at different structural levels. Such combination, leading to flexible protein–RNA docking, is in the center of our ongoing efforts.
SUPPLEMENTARY DATA
Supplementary Data are available at NAR Online.
FUNDING
Funding for open access charge: DFG (Deutsche Forschungsgemeinschaft) grant (Za153/19-1).
Conflict of interest statement. None declared.
Supplementary Material
REFERENCES
- 1.Eddy SR. Non-coding RNA genes and the modern RNA world. Nat. Rev. Genet. 2001;2:919–929. doi: 10.1038/35103511. [DOI] [PubMed] [Google Scholar]
- 2.Storz G. An expanding universe of noncoding RNAs. Science. 2002;296:1260–1263. doi: 10.1126/science.1072249. [DOI] [PubMed] [Google Scholar]
- 3.Matera AG, Terns RM, Terns MP. Non-coding rnas: lessons from the small nuclear and small nucleolar RNAs. Nat. Rev. Mol. Cell. Biol. 2007;8:209–220. doi: 10.1038/nrm2124. [DOI] [PubMed] [Google Scholar]
- 4.Lunde BM, Moore C, Varani G. RNA-binding proteins: modular design for efficient function. Nat. Rev. Mol. Cell. Biol. 2007;8:479–490. doi: 10.1038/nrm2178. [DOI] [PMC free article] [PubMed] [Google Scholar]
- 5.Hogg JR, Collins K. Structured non-coding RNAs and the RNP renaissance. Curr. Opin. Chem. Biol. 2008;12:684–689. doi: 10.1016/j.cbpa.2008.09.027. [DOI] [PMC free article] [PubMed] [Google Scholar]
- 6.Glisovic T, Bachorik JL, Yong J, Dreyfuss G. RNA-binding proteins and post-transcriptional gene regulation. FEBS Lett. 2008;582:1977–1986. doi: 10.1016/j.febslet.2008.03.004. [DOI] [PMC free article] [PubMed] [Google Scholar]
- 7.Wimberly BT, Brodersen DE, Clemons WM, Morgan-Warren RJ, Carter AP, Vonrhein C, Hartsch T, Ramakrishnan V. Structure of the 30s ribosomal subunit. Nature. 2000;407:327–339. doi: 10.1038/35030006. [DOI] [PubMed] [Google Scholar]
- 8.Ban N, Nissen P, Hansen J, Moore PB, Steitz TA. The complete atomic structure of the large ribosomal subunit at 2.4 a resolution. Science. 2000;289:905–920. doi: 10.1126/science.289.5481.905. [DOI] [PubMed] [Google Scholar]
- 9.Berman HM, Westbrook J, Feng Z, Gilliland G, Bhat TN, Weissig H, Shindyalov IN, Bourne PE. The protein data bank. Nucleic Acids Res. 2000;28:235–242. doi: 10.1093/nar/28.1.235. [DOI] [PMC free article] [PubMed] [Google Scholar]
- 10.Moreira IS, Fernandes PA, Ramos MJ. Protein-protein docking dealing with the unknown. J. Comput. Chem. 2009;31:317–342. doi: 10.1002/jcc.21276. [DOI] [PubMed] [Google Scholar]
- 11.Cowieson NP, Kobe B, Martin JL. United we stand: combining structural methods. Curr. Opin. Struct. Biol. 2008;18:617–622. doi: 10.1016/j.sbi.2008.07.004. [DOI] [PubMed] [Google Scholar]
- 12.Steven AC, Baumeister W. The future is hybrid. J. Struct. Biol. 2008;163:186–195. doi: 10.1016/j.jsb.2008.06.002. [DOI] [PubMed] [Google Scholar]
- 13.Allers J, Shamoo Y. Structure-based analysis of protein-RNA interactions using the program entangle. J. Mol. Biol. 2001;311:75–86. doi: 10.1006/jmbi.2001.4857. [DOI] [PubMed] [Google Scholar]
- 14.Jones S, Daley DT, Luscombe NM, Berman HM, Thornton JM. Protein-RNA interactions: a structural analysis. Nucleic Acids Res. 2001;29:943–954. doi: 10.1093/nar/29.4.943. [DOI] [PMC free article] [PubMed] [Google Scholar]
- 15.Morozova N, Allers J, Myers J, Shamoo Y. Protein-RNA interactions: exploring binding patterns with a three-dimensional superposition analysis of high resolution structures. Bioinformatics. 2006;22:2746–2752. doi: 10.1093/bioinformatics/btl470. [DOI] [PubMed] [Google Scholar]
- 16.Ellis JJ, Broom M, Jones S. Protein-RNA interactions: structural analysis and functional classes. Proteins. 2007;66:903–911. doi: 10.1002/prot.21211. [DOI] [PubMed] [Google Scholar]
- 17.Bahadur RP, Zacharias M, Janin J. Dissecting protein-RNA recognition sites. Nucleic Acids Res. 2008;36:2705–2716. doi: 10.1093/nar/gkn102. [DOI] [PMC free article] [PubMed] [Google Scholar]
- 18.Terribilini M, Lee J-H, Yan C, Jernigan RL, Honavar V, Dobbs D. Prediction of RNA binding sites in proteins from amino acid sequence. RNA. 2006;12:1450–1462. doi: 10.1261/rna.2197306. [DOI] [PMC free article] [PubMed] [Google Scholar]
- 19.Wang L, Brown SJ. Bindn: a web-based tool for efficient prediction of DNA and RNA binding sites in amino acid sequences. Nucleic Acids Res. 2006;34:W243–W248. doi: 10.1093/nar/gkl298. [DOI] [PMC free article] [PubMed] [Google Scholar]
- 20.Kumar M, Gromiha MM, Raghava GPS. Prediction of RNA binding sites in a protein using SVM and PSSM profile. Proteins. 2008;71:189–194. doi: 10.1002/prot.21677. [DOI] [PubMed] [Google Scholar]
- 21.Cheng C-W, Su EC-Y, Hwang J-K, Sung T-Y, Hsu W-L. Predicting RNA-binding sites of proteins using support vector machines and evolutionary information. BMC Bioinformatics. 2008;9(Suppl 12) doi: 10.1186/1471-2105-9-S12-S6. S6. [DOI] [PMC free article] [PubMed] [Google Scholar]
- 22.Pérez-Cano L, Fernández-Recio J. Optimal protein-RNA area, opra: a propensity-based method to identify RNA-binding sites on proteins. Proteins. 2009;78:25–35. doi: 10.1002/prot.22527. [DOI] [PubMed] [Google Scholar]
- 23.Liu Z-P, Wu L-Y, Wang Y, Zhang X-S, Chen L. Prediction of protein-RNA binding sites by a random forest method with combined features. Bioinformatics. 2010;26:1616–1622. doi: 10.1093/bioinformatics/btq253. [DOI] [PubMed] [Google Scholar]
- 24.Chen Y, Kortemme T, Robertson T, Baker D, Varani G. A new hydrogen-bonding potential for the design of protein-RNA interactions predicts specific contacts and discriminates decoys. Nucleic Acids Res. 2004;32:5147–5162. doi: 10.1093/nar/gkh785. [DOI] [PMC free article] [PubMed] [Google Scholar]
- 25.Zheng S, Robertson TA, Varani G. A knowledge-based potential function predicts the specificity and relative binding energy of RNA-binding proteins. FEBS J. 2007;274:6378–6391. doi: 10.1111/j.1742-4658.2007.06155.x. [DOI] [PubMed] [Google Scholar]
- 26.Pérez-Cano L, Solernou A, Pons C, Fernández-Recio J. Structural prediction of protein-RNA interaction by computational docking with propensity-based statistical potentials. Pacific Sympos. Biocomput. 2010;15:269–280. doi: 10.1142/9789814295291_0031. [DOI] [PubMed] [Google Scholar]
- 27.Fernández-Recio J, Sternberg MJE. The 4th meeting on the critical assessment of predicted interaction (capri) held at the mare nostrum, barcelona. Proteins. 2010;78:3065–3066. [PubMed] [Google Scholar]
- 28.Zacharias M. Protein-protein docking with a reduced protein model accounting for side-chain flexibility. Protein Sci. 2003;12:1271–1282. doi: 10.1110/ps.0239303. [DOI] [PMC free article] [PubMed] [Google Scholar]
- 29.Fiorucci S, Zacharias M. Binding site prediction and improved scoring during flexible protein-protein docking with attract. Proteins. 2010;78:3131–3139. doi: 10.1002/prot.22808. [DOI] [PubMed] [Google Scholar]
- 30.Smith TF, Waterman MS. Identification of common molecular subsequences. J. Mol. Biol. 1981;147:195–197. doi: 10.1016/0022-2836(81)90087-5. [DOI] [PubMed] [Google Scholar]
- 31.Altschul SF, Gish W, Miller W, Myers EW, Lipman DJ. Basic local alignment search tool. J. Mol. Biol. 1990;215:403–410. doi: 10.1016/S0022-2836(05)80360-2. [DOI] [PubMed] [Google Scholar]
- 32.Dolinsky TJ, Nielsen JE, McCammon JA, Baker NA. Pdb2pqr: an automated pipeline for the setup of poisson-boltzmann electrostatics calculations. Nucleic Acids Res. 2004;32:W665–W667. doi: 10.1093/nar/gkh381. [DOI] [PMC free article] [PubMed] [Google Scholar]
- 33.Ben-Naim A. Statistical potentials extracted from protein structures: are these meaningful potentials? J. Chem. Phys. 1997;107:3698–3706. [Google Scholar]
- 34.Baker CM, Grant GH. Role of aromatic amino acids in protein-nucleic acid recognition. Biopolymers. 2007;85:456–470. doi: 10.1002/bip.20682. [DOI] [PubMed] [Google Scholar]
- 35.Méndez R, Leplae R, Lensink MF, Wodak SJ. Assessment of capri predictions in rounds 3-5 shows progress in docking procedures. Proteins. 2005;60:150–169. doi: 10.1002/prot.20551. [DOI] [PubMed] [Google Scholar]
- 36.Jossinet F, Ludwig TE, Westhof E. Assemble: an interactive graphical tool to analyze and build rna architectures at the 2d and 3d levels. Bioinformatics. 2010;26:2057–2059. doi: 10.1093/bioinformatics/btq321. [DOI] [PMC free article] [PubMed] [Google Scholar]
Associated Data
This section collects any data citations, data availability statements, or supplementary materials included in this article.