Abstract
Pedestrian fatalities as a result of vehicle collisions are much more likely to happen at night than during day time. Poor visibility due to darkness is believed to be one of the causes for the higher vehicle collision rate at night. Existing studies have shown that night vision enhancement systems (NVES) may improve recognition distance, but may increase drivers’ workload. The use of automatic warnings (AW) may help minimize workload, improve performance, and increase safety. In this study, we used a driving simulator to examine performance differences of a NVES with six different configurations of warning cues, including: visual, auditory, tactile, auditory and visual, tactile and visual, and no warning. Older drivers between the ages of 65 and 74 participated in the study. An analysis based on the distance to pedestrian threat at the onset of braking response revealed that tactile and auditory warnings performed the best, while visual warnings performed the worst. When tactile or auditory warnings were presented in combination with visual warning, their effectiveness decreased. This result demonstrated that, contrary to general sense regarding warning systems, multi-modal warnings involving visual cues degraded the effectiveness of NVES for older drivers.
INTRODUCTION
Pedestrian fatalities as a result of vehicle collisions are much more likely to happen at night than during day time. It has been estimated that the rate of vehicle collisions against pedestrians may be 3 to 6.75 times higher in the dark than in daylight [Sullivan & Flannagan, 1999]. In 2006, 46% of all pedestrian fatalities in the United States took place during the darker hours between 8 p.m. and 3:59 am [NHTSA, 2006]. Even considering factors such as alcohol involvement and increased pedestrian activities at night and twilight hours, this is still significant, since only about a quarter of vehicle miles are driven at night. Poor visibility due to darkness is believed to be one of the causes for the higher vehicle collision rate at night.
At night under low light conditions, a driver’s focal vision, which is used to recognize objects, deteriorates rapidly, while the peripheral vision, which is used to guide one’s movement, does not decline greatly. Therefore at night drivers tend not to feel the need to slow down their vehicles to allow for sufficient stopping distance that matches the vehicle’s headlamp range, without realizing their ability to see pedestrians has deteriorated [Green, 2009]. The design of headlamps for the purpose of minimizing glare for oncoming traffic makes them even less efficient in providing sufficient contrast between pedestrians and background environment [Green, 2009]. Pedestrians’ unpredictable behavior at night, often under influence of alcohol, also contributes to the difficulty for drivers to detect them at night [Green, 2009].
Various technologies have been developed to enhance human vision at night, initially as the result of military demand. Some of them have been adapted to civilian uses, including in passenger vehicles for night time driving conditions. One such technology is infrared (IR) light based imaging. The first passenger vehicle on the consumer’s market that had an IR-based night vision enhancement system (NVES) was the 2000 model GM Cadillac DeVille [Martinelli & Seone, 1999]. Since then, IR-based NVESs have been available for vehicles from various manufacturers, either as factory option or as after-market add-ons. Recently, to increase the effectiveness of the NVESs, mechanisms to automatically identifying driving hazards such as pedestrians by processing the infrared video image have been developed, and as a result automatic warnings (AWs) have become available on some of the in-vehicle NVESs.
A great deal of research on the effectiveness of NVES during night time driving has been conducted since the first in-vehicle NVES came to the market. The University of Michigan Transportation Research Institute (UMTRI) conducted a series of studies on the effect on driving workload when an IR display was present [Sullivan et al., 2004]. Another UMTRI study [Tsimhoni, Flannagan & Minoda, 2005] compared NVESs with and without automatic visual warnings in the form of a rectangle around the detected threat on the IR display. The conclusion from these studies as well as studies by other researchers was that IR displays were effective in increasing threat detection distance, and AW helped further, but were inconclusive on effects on driving workload. A number of studies were conducted to compare the effectiveness of various configurations of the system, such as camera location, IR display configuration, IR technology, and manners of presenting the warning, including those by Druid (2002), Hollnagel and Källhammer (2003), Schenkman and Brunnström (2007), Tsimhoni et al. (2007), Rösler et al. (2006), Mahlke et al. (2007), and Tsuji et al. (2006). It has been concluded in the studies that camera location, display configuration, etc. all have effects on detection distances. While the effects are not significant, some display configurations lead to more distraction to the normal driving task. The warnings studied include visual and auditory warnings. Other warning types such as tactile/haptic or combinations of alerts have proven to be effective in other types of driving assistance systems, so it is possible that they could also be used beneficially in NVES. However, there has not been a study that does a comprehensive comparison of the effectiveness of various warning modes and their combinations when used for a NVES, in particular, how tactile warnings compare to the other warning modes.
In this paper, we present a study that was conducted on a driving simulator setup to test the effectiveness of different combinations of three warning modes (visual, auditory and tactile), referred to as warning conditions, and a no-warning condition, for an IR NVES display, in eliciting appropriate driver avoidance behaviors to detected threats. Older drivers were chosen as the participants because they are the group of drivers who are most affected by the poor visibility at night and may potentially benefit the most from a well designed night vision enhancement system. The study was completed using the NADS-2, a medium size fixed-base driving simulator instrumented with a real vehicle cab and enhanced with a simulated NVES with AW. This study used a mixed between/within-subject design with warning conditions as a between subject variable and event as a within-subject variable. Each driver experienced four different events in which a pedestrian triggered the automatic warning on the NVES and would likely collide with the vehicle if the driver did not react appropriately. The events were located in rural and suburban environments. Driving performance measures were collected, and the vehicle-pedestrian distance at the moment when the driver initiated braking response was used to evaluate the effectiveness of the NVES with different warning configurations.
METHODS
It was hypothesized that all warnings would increase the distance to the pedestrian at which drivers were able to respond. The study was designed to examine this hypothesis. The methods for this study are presented under four categories: driving simulator setup, experimental design, participant procedures, and data analysis methods.
Driving Simulator Setup
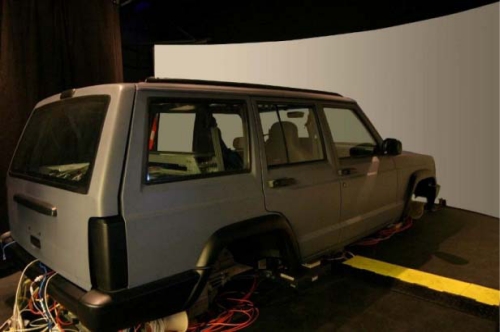
The experimental drives were conducted on the NADS-2, a medium size, fixed-base driving simulator. The simulator consisted of a Jeep Cherokee cab equipped with active feel on steering, brake, accelerator pedal, and a fully operational dashboard. The visual system featured three front visual channels with a field of view of 135 degrees. A 65-inch plasma display was used for the rear channel. Figure 1 shows the NADS-2 driving simulator.
Figure 1.
The NADS-2 driving simulator with a Jeep Cherokee cab.
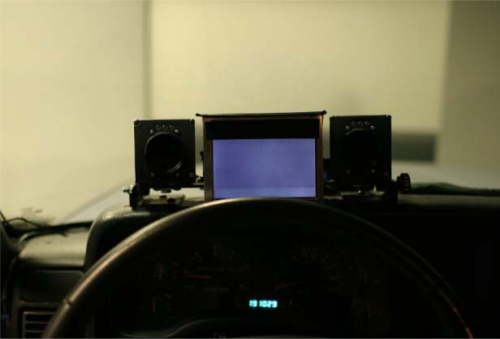
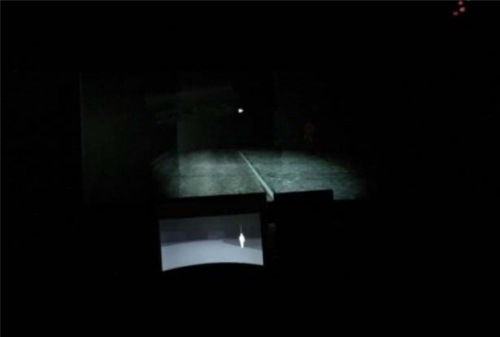
For this study, the NADS-2 simulator was enhanced with a simulated NVES. The system was based on the specifications of the NVES available on the Japanese market Honda Legend model [Tsuji et al., 2006]. It uses far IR technology for the video image in the display, which is mounted on top of the dashboard, behind the steering wheel. Figure 2 shows the location of the simulated NVES display inside the Jeep cab. Figure 3 shows how it appeared to the driver during a night time scene, with a pedestrian clearly visible in the IR display, but just outside the low-beam headlamp range, and thus almost invisible in the view out of the windshield. The rationale of modeling the experimental system after a system already in use was to avoid having to make a number of arbitrary decisions about the system and also to make the results more generalizable to actual systems.
Figure 2.
The NVES display that shows simulated infrared image and visual warnings. Mounted around it are the eye-tracking cameras.
Figure 3.
Driver’s forward out-of-windshield view and NVES display during a night time drive.
The pedestrian detection and AW mechanism was also modeled after the Honda Legend system. Detection area for pedestrians crossing the road and detection area for pedestrians moving along the road were defined following the Honda design. Pedestrians as far as 300 meters away would be visible in the IR display. They would be identified as a threat and trigger the warning as early as 4 seconds in advance of the estimated time to collision at current vehicle speed, but no farther than 100 meters away, to simulate the technical limitation of an actual NVES with AW. The issue of false alarms and missed threats, which were problems with real systems, were outside the scope of this study; therefore the simulated AW mechanism was implemented to be 100% accurate.
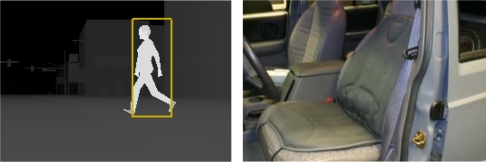
Three different types of warning cues were implemented: auditory, visual-box, and tactile. The auditory warning cue was a series of beeps lasting approximately 2 seconds. The visual-box warning cue was a yellow rectangular frame that highlights the position of the threat and traces its movement. The tactile warning cue was three light vibrations under the legs lasting about 600 milliseconds each, separated by 100-millisecond gaps. Both the auditory and tactile warnings were sent only once when an object satisfied the warning condition. On the other hand, the visual-box warning stayed on as long as the object satisfied the warning condition. Figure 4 shows the visual warning box and the tactile seat cushion installed in the simulator cab to generate the tactile warning cue.
Figure 4.
Visual and tactile warnings for the NVES. Left: a pedestrian crossing the street triggers the yellow highlight box around his IR image. Right: vibrating seat cushion used for the tactile warning cue.
Experimental Design
The study used a mixed between/within-subjects, incomplete 6 × 4 design with six warning conditions comprised of various combinations of auditory warning, visual-box warning, and tactile warning as between subject variables, and pedestrian collision event as a within-subject variable, as demonstrated in Table 1. The design did not include the following two possible combinations of warnings: auditory-tactile, and auditory-visual-tactile. These combinations were excluded due to the low likelihood that these combinations would ever be deployed in actual vehicles due to the conflict between the subtle tactile cue and the overt auditory cue.
Table 1.
Factorial Design
| Warning Mode Combination | Data Points per Cell | |||||
|---|---|---|---|---|---|---|
| Auditory | Visual | Tactile | Suburban | Rural | ||
| Child | Jaywalker | Hiker | Changer | |||
| 0 | 0 | 0 | 8 | 8 | 8 | 8 |
| 0 | 0 | 1 | 8 | 8 | 8 | 8 |
| 0 | 1 | 0 | 8 | 8 | 8 | 8 |
| 0 | 1 | 1 | 8 | 8 | 8 | 8 |
| 1 | 0 | 0 | 8 | 8 | 8 | 8 |
| 1 | 1 | 0 | 8 | 8 | 8 | 8 |
A total of 48 participants aged 65 to 74 completed data collection. It was decided a priori that participants that collided with more than two pedestrians would be dropped from the study. As a result, one participant was enrolled but dropped from the study for a total enrollment of 49 to achieve the required sample of 48 participants. Table 1 shows that are 32 data points for each warning combination, 8 for each event.
The final sample consisted of 28 males and 20 female participants. The average age of the participants was 69.8 years of age. The average reported driving experience was 53 years. Forty-three participants drove at least once per day, and the remaining five participants drove at least once per week. All drivers drove at least 2000 miles per year and reported driving at night. The average number of collisions in the last five years was 0.3.
Independent Variables
The independent variables included AW modes and event. AW modality was a between-subject variable, and event was a within-subject variable. As indicated in Table 1, three AW modes were included, and a total of six combinations, or warning conditions, were used – no warning, tactile, visual, tactile-visual, auditory, and auditory-visual. There were four different events, two in the suburban environment, and two in the rural environment. The suburban events were a child running into the street and an adult jaywalker crossing the street. The rural events were an adult hiker entering road and an adult changing a tire on the side of the road. The drivers were subject to different speed limits in the two environments, 56km/h (35mph) in suburban environment and 88km/h (55mph) in rural environment.
Dependent Variables
The driving performance measure used for this analysis was the distance to the pedestrian threat at brake response. This measure was defined as the Euclidean distance to relevant pedestrian threat at the onset of brake response. The onset of brake response was defined as the first point at which the brakes were depressed more than 2 ft-lbs after the beginning of the event.
Environment Database
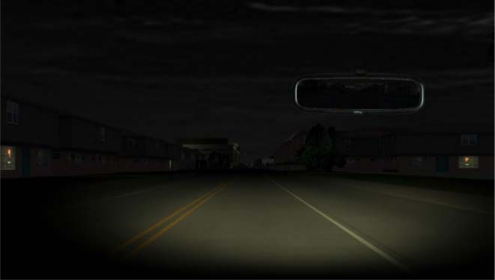
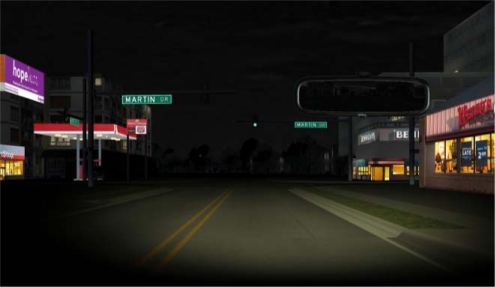
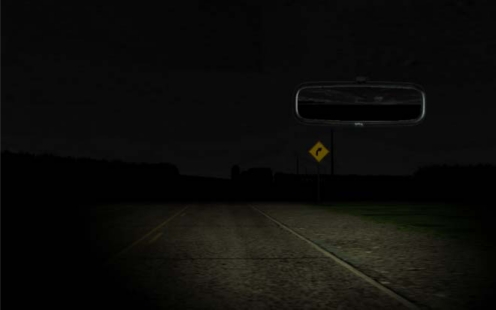
There were two driving environments, rural and suburban. In the rural environment, the road type was unlit two-lane asphalt with a gravel shoulder, and with sparse residence houses and farm buildings along the road. In the suburban environment, the road type was mostly four-lane asphalt with a raised curb, where the outer lane was a parking lane. There was a high concentration of residence houses, apartment buildings, and commercial structures along the road. Most of the suburban road sections were unlit as well. The database was constructed with gentle turns and periodic intersections. The intersections provided a mechanism to assist scenario authoring by allowing vehicles to enter and exit the route of travel near the driver. The primary route of travel was along the “main” road, with no turns necessary. Figure 5 and Figure 6 show sections of the suburban environment, while Figure 7 shows a section of the rural environment.
Figure 5.
Suburban Environment
Figure 6.
Suburban Environment near an Intersection with Traffic Lights
Figure 7.
Rural Environment
Driving Scenarios
Participants would travel from one environment to another (rural to suburban for one half of the participants and suburban to rural for the other half). The four events occurred at four locations, and the order of events was counterbalanced to avoid sequence effects. As shown in Table 1, two events were located in the suburban environment, and two were located in the rural environment. The child event involved a child running out onto the street from between two parallel parked vehicles. The Jaywalker event involved an adult jaywalking in the middle of a suburban block. The tire changer event involved an adult pedestrian changing the rear driver’s side tire of an SUV parked on the right side of the road. The hiker event involved a hiker walking on the left shoulder who would drift across the left lane and then proceed all the way to the right side of the road. The scenario was filled with light ambient vehicle traffic, and contained traffic light changes in the suburban area, which were designed to maintain a reasonable amount of driving workload. Pedestrians walking along side the roads that would not pose as hazards to the driver were also included, to add unpredictability to the scenario.
Participant Procedures
Upon arrival at the experiment facility, participants underwent low contrast sensitivity eye exams and completed the NADS Driving Survey, a survey regarding general demographic information, driving history, and general health status. Before entering the simulator, participants were shown a PowerPoint presentation that did the following: identified the purpose of the study, introduced them to the simulator cab, trained them on NVES, and provided them information on the drives. Participants were trained only on the specific warning modality present in their drives. Participants then completed a five-minute practice drive in the simulator, which allowed them the opportunity to become familiar with the simulator, the NVES display, and the warning modality present in their drives. The main drive, which contained the four events, had a duration of approximately 32 minutes. At the end of the main drive, participants completed a Wellness Survey which was used to evaluate how they were physically adapting to the simulated environment and simulated driving. Participants were then escorted to the debriefing room where they completed a series of surveys to assess workload, situation awareness, simulator realism, and acceptance and usability of the night vision enhancement system.
Data Analysis Methods
The primary method of data analysis for this study was through the use of the SAS General Linear Models (GLM) procedure to perform an analysis of variance. The difference between the warning conditions was examined, as well as the difference between events. As a follow-up, the t-test with the Sidak adjustment was used as the multiple comparison test to identify which conditions or events were different from each other. The dependent variable used for the analysis is the distance to the pedestrian threat at brake response.
RESULTS
The analysis results for distance to threat at the onset of brake response are shown in Table 2. There were significant differences by warning condition and also by event. However, there was no interaction between warning condition and event.
Table 2.
Distance to Threat at Brake Response
| Source | DF | Type III SS | Mean Square | F Value | Pr > F |
|---|---|---|---|---|---|
| Event | 3 | 46960.561 | 15653.520 | 6.34 | 0.0006 |
| Warning Condition | 5 | 114060.375 | 22812.075 | 5.36 | 0.0007 |
| Event * Warn Con | 15 | 31172.695 | 2078.180 | 0.84 | 0.6292 |
| Subject (Warn Con) | 42 | 178606.084 | 4252.526 | . | . |
| Event*Sbjt (Warn Con) | 97 | 239356.422 | 2467.592 | . | . |
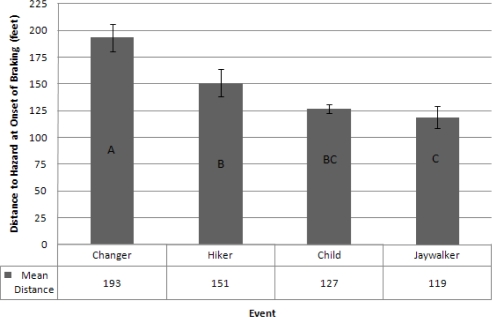
Figure 8 shows the difference in distance to the pedestrian threat at brake response by event. Distance at brake response was greatest for the tire changer (58.8 m/193 feet). Brake distance for the child (38.7 m/127 feet) event was not significantly different from the hiker (46.0 m/151 feet) or the jaywalker (36.3 m/119 feet); however, distance at brake response was greater for the hiker than for the jaywalker. These results show that, as intended, events provided a range of difficulty levels as represented by the distribution of distances at braking onset for the events. The fact that there is no interactive effect allows us to consider the effects of the warning conditions independent of the events.
Figure 8.
Distance to Threat at Onset of Braking, by Event
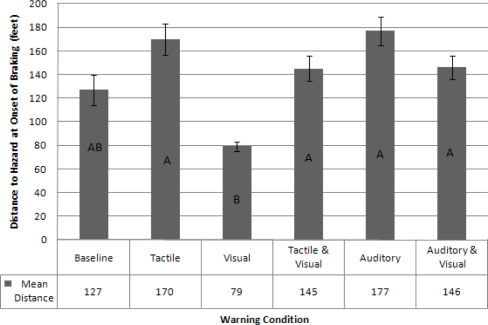
Figure 9 is a comparison of the distance to the pedestrian threat at brake response between the six different warning conditions. The distance values in the figure were averages among all four events, and therefore were not representative of particular events. Contrary to the hypothesis, when warning conditions are considered, there was no statistical difference between the baseline condition and the various warning conditions. There were, however, statistically significant differences between the conditions when a warning was present. The results show that drivers with tactile, auditory, tactile-auditory, tactile-visual and auditory-visual warnings applied the brakes at a greater distance than drivers with a visual only warning.
Figure 9.
Distance to Threat at Onset of Braking, by Warning Condition
To provide context for the results, the mean time-to-threat at first brake application for the warning conditions ranged from approximately 1 second to approximately 2.5 seconds. These later responses were not adequate for the driver’s to consistently avoid collisions with the pedestrians in all instances. The earlier responses were generally adequate for the drivers to safely avoid the pedestrians.
DISCUSSION
There are mixed findings when trying to assess the impact of the use of AWs on improving driver safety in terms of avoiding collision with pedestrians. Looking at the distance to threat at the brake response, we see that drivers under warning conditions that included auditory or tactile cues responded sooner to the pedestrians, and therefore were less likely to collide with pedestrians, compared to conditions without them. On the other hand, drivers under warning conditions that included visual-box warning cues responded later. The visual warning mode appeared to have a net negative effect, either on its own or in addition to other warning modes. For example, auditory-visual was worse than auditory only, tactile-visual was worse than tactile only, and visual only was worse than no warning.
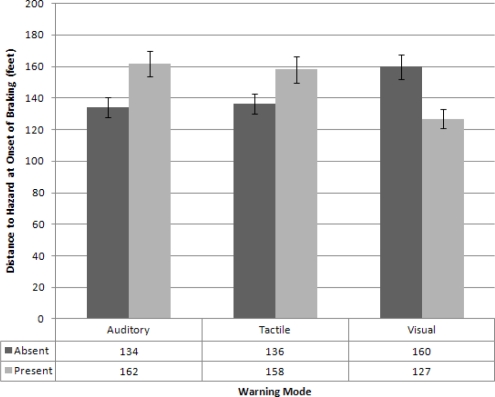
Looking at the data another way sheds some light on this issue. Figure 10 shows the mean distance at response by warning mode. The first bar in each pair represents the cases in which that warning mode was not present, and the second bar represents the cases in which that warning mode was present across all events. So, for example, for the auditory warning mode, data from the auditory only and the auditory plus visual would be used to provide the mean for the auditory present mean, and data from the other conditions would be used to provide the mean for the auditory absent mean. As can be seen, there is an increase in response distance when auditory or tactile warnings were used, but there is a decrease when a visual warning was used.
Figure 10.
Distance to Threat at Onset of Braking, by Warning Mode
There is a possible explanation for why visual warning has a negative effect. It could be that with the visual-box warning, the drivers are identifying the location of the threat on the display before initiating their response. In the case where there is no visual-box warning, it could be that the drivers just respond to the warning rather than looking to the infrared image on the display. This could have led to the delay in the driver applying the brakes that was observed. However, this does not explain the following interesting phenomenon: although statistically insignificant, the average braking distance for visual-box only warning condition was worse than the no warning condition. One explanation for this is that the visual-box warning did not catch the driver’s attention as effectively as the other warning modes. As such, the drivers with visual-box only warning condition performed poorly because they expected to be alerted by the warning, and drove with less attention, but in the end did not notice the warning; on the other hand, the drivers with the no warning condition knew they would not receive a warning and drove with more attention, thus were able to perform better than some of the drivers with visual-box only warning. Another possible explanation is that the visual-box was not viewed as a warning that required response but instead as merely another item of information for the driver. If the visual-box is indeed viewed just as more information that must be verified against the actual driving scene, response would be delayed until the pedestrian is visible and the driver confirms the conflict requires a braking response.
In interpreting the findings, it is important to consider some of the limitations of this research:
Only older drivers were used as participants, so the findings may not generalize to other age groups.
Not all possible combinations of the warnings were tested. Therefore there were no data for the warning conditions of auditory-tactile or auditory-tactile-visual. The latter two might have provided further insight into potential interactions between different warning modalities.
The study tested two-lane suburban and rural driving environments which may not generalize all other driving environments such as more cluttered urban environments. Although most vehicle pedestrian accidents occur in urban environments, these crashes are overrepresented in suburban and rural environments. In addition, these environments provided a cleaner environment for accurately capturing driver response.
This study did not evaluate the long term effects of system use with the various warning modes. Based on this study, it is not possible to predict whether long term exposure to the system might degrade the effectiveness of the warnings. Systems that provide more frequent warnings may be at a greater risk for degradation in performance; however, to minimize this risk, most production systems, consistent with our implementation, suppress warnings for pedestrians that would be visible in the vehicle headlights.
The experiment was designed such that all comparisons were done with the IR image from the NVES present. There was always a visual element involved with the system. Therefore, this study does not address the question of whether the effectiveness of the different alerts would be the same if there were no NVES visual display.
Although representative warning signals that are consistent with those available in the production systems were chosen, the impact of other approaches to warnings within a mode was not explored.
Other types of threats, such as deer, were not included, so no assessment of how warnings for animal threats is possible.
CONCLUSION
The study data indicates that automatic warning for Night Vision Enhancement Systems can have a positive impact on improving pedestrian safety by allowing drivers to respond at a greater distance. It appears that the visual-box warning does not improve driver’s performance, while the auditory and tactile warnings improve driver’s performance. Overall, the inclusion of a visual warning cue appears to have a negative impact on driver’s performance. The single modal warning conditions of auditory only and tactile only are more effective than the dual-modal conditions of auditory-visual and tactile-visual. At least, in this case, more is not always better when considering alert modalities.
Previous studies on NVES with AWs mostly concentrated on visual warnings, either warning boxes around the threats in the IR display, or abstract icons or LED lights with or without IR display. In general, the conclusions were that AWs could be beneficial in detecting pedestrians. However, some studies showed that such benefits might not be significant. Results from previous research and our study point to a conclusion that the types of warnings that do not rely on the driver looking into the video display, such as auditory, tactile, or LED light cues, are more effective than visual types of warnings that have to involve video displays.
Most NVESs currently on the market either use no AWs or use visual warning that utilizes the IR video display. Only the Honda system has non-visual warnings (audio alert). The result of this study suggests that those systems can become more effective if they are enhanced or replaced with auditory or tactile AWs.
We recommend that further studies on NVES with AWs be conducted with the following emphases:
Different approaches of visual, auditory, tactile warnings and their combination should be studied. In particular, configurations without IR video display, with IR video display at all times, and with IR video display turned on only when threats are present, should be compared. Methods of bringing driver’s attention towards the direction of the threat using auditory and tactile cues should be investigated, since one of the major perceived benefits of the video display is that it helps the driver locate the actual threat quickly. A configuration without NVES should be included in the study.
Young and middle-aged drivers should be included as study subjects.
Automatic warnings for non-pedestrian threats, mainly animals, should be tested.
The long term effects of exposure to the warnings should be studied.
Acknowledgments
This research was funded under National Highway Traffic Safety Administration (NHTSA) contract DTNH22-06-D-00043 Task Order No. 4.
REFERENCES
- Druid A.Vision Enhancement System – Does Display Position Matter?Master’s Thesis, LIU-KOGVET-D--02/17--SE, Linköping University, Linköping, Sweden, 2002
- Green M. Seeing Pedestrians At Night; 2009. Available online at http://www.visualexpert.com/Resources/pedestrian.html (Accessed 03 May 2010)
- Hollnagel E, Källhammer J. Effects of a Night Vision Enhancement System (NVES) on Driving: Results from a Simulator Study. Proceedings of the Second International Driving Symposium on Human Factors in Driver Assessment, Training and Vehicle Design; Park City, UT. 2003. [Google Scholar]
- Mahlke S, Rösler D, Seifert K, Krems JF, Thüring M. Evaluation of Six Night Vision Enhancement System: Qualitative and Quantitative Support for Intelligent Image Processing. Human Factors. 2007;49(3):518–531. doi: 10.1518/001872007X200148. [DOI] [PubMed] [Google Scholar]
- Martinelli NS, Seone R. Automotive Night Vision System. Proceedings of the SPIE. 1999;3700:343–346. [Google Scholar]
- National Highway Traffic Safety Administration Traffic Safety Facts 2006 Data, Pedestrians. DOT HS 810810, 2006.
- Rösler D, Krems JF, Mahlke S, Thüring M, Seifert K. Evaluation of Night Vision Enhancement Systems: Driver Needs and Acceptance. In: Stiler C, Maurer M, editors. Fahrerasstenzsysteme. Karlsruhe: fmrt Karlruhe eV; Germany: 2006. [Google Scholar]
- Schenkman BN, Brunnström K. Camera Position and Presentation Scale for Infrared Night Vision Systems in Cars. Human Factors and Ergonomics in Manufacturing. 2007;17(5):457–473. [Google Scholar]
- Sullivan JM, Flannagan MJ. Assessing the Potential Benefit of Adaptive Headlighting Using Crash Databases. 1999. Technical Report No. UMTRI-1999-21, The University of Michigan Transportation Research Institute.
- Sullivan J, Bargman J, Adachi G, Schoettle B. Driver Performance and Workload Using a Night Vision System. 2004. Technical Report No. UMTRI-2004-8, The University of Michigan Transportation Research Institute.
- Tsimhoni O, Flannagan MJ, Minoda T. Pedestrian Detection with Night Vision Systems Enhancement by Automatic Warnings. 2005. Technical Report No. UMTRI-2005-23, The University of Michigan Transportation Research Institute.
- Tsimhoni O, Bärgman J, Flannagan M. Pedestrian Detection with Near and Far Infrared Night Vision Enhancement. The Journal of the Illuminating Engineering Society of North America (LEUKOS) 2007;4(2):113–128. [Google Scholar]
- Tsuji T, Hashimoto H, Nagaoka N, Tasatsudo I. Development of a Nighttime Pedestrian Recognition Assistance System, SAE technical paper 2006-01-0494. Proceedings of SAE World Congress; Detroit, MI. 2006. [Google Scholar]


