

Abstract
Aims
We investigate the role of mitochondrial oxidative stress in mitochondrial proteome remodelling using mouse models of heart failure induced by pressure overload.
Methods and results
We demonstrate that mice overexpressing catalase targeted to mitochondria (mCAT) attenuate pressure overload-induced heart failure. An improved method of label-free unbiased analysis of the mitochondrial proteome was applied to the mouse model of heart failure induced by transverse aortic constriction (TAC). A total of 425 mitochondrial proteins were compared between wild-type and mCAT mice receiving TAC or sham surgery. The changes in the mitochondrial proteome in heart failure included decreased abundance of proteins involved in fatty acid metabolism, an increased abundance of proteins in glycolysis, apoptosis, mitochondrial unfolded protein response and proteolysis, transcription and translational control, and developmental processes as well as responses to stimuli. Overexpression of mCAT better preserved proteins involved in fatty acid metabolism and attenuated the increases in apoptotic and proteolytic enzymes. Interestingly, gene ontology analysis also showed that monosaccharide metabolic processes and protein folding/proteolysis were only overrepresented in mCAT but not in wild-type mice in response to TAC.
Conclusion
This is the first study to demonstrate that scavenging mitochondrial reactive oxygen species (ROS) by mCAT not only attenuates most of the mitochondrial proteome changes in heart failure, but also induces a subset of unique alterations. These changes represent processes that are adaptive to the increased work and metabolic requirements of pressure overload, but which are normally inhibited by overproduction of mitochondrial ROS.
Keywords: Mitochondria, Oxidative stress, Proteome, Pressure overload, Cardiomyopathy
1. Introduction
Heart failure affects 5.8 million adults in the USA, and accounts for more than 30% of cardiovascular mortality.1 One of the most important risk factors for the development of heart failure, as reported in the Framingham Heart Study,2 is chronic hypertension, which imposes long-standing pressure overload to the heart. Pressure overload leads to compensated cardiac hypertrophy at an early stage, which may progress to decompensated heart failure at the later stage. Several mechanisms have been proposed to play a role in the transition from cardiac hypertrophy to failure, such as increasing cardiomyocyte death and interstitial fibrosis, relative ischaemia of the hypertrophic heart, and mitochondrial energetic failure.3,4
Mitochondrial structural damage and dysfunction has been well documented in heart failure, including an increase in mitochondrial oxidative damage,5 impairment of mitochondrial respiration,6,7 and disturbance of mitochondrial substrate utilization.8 The data from patients and experimental animal models of heart failure demonstrate impaired fatty acid utilization and increased glucose metabolism in end-stage heart failure.8 This metabolic defect is consistent with observations from a recent paper applying label-free proteomic analysis of crude mitochondrial extracts in a rat heart failure model following transverse aortic constriction (TAC), which showed that in failing heart mitochondria, there was decreased abundance of proteins in fatty acid oxidation and oxidative phosphorylation as well as increased abundance of glucose oxidation proteins.9 Other than this, the characterization of mitochondrial proteome remodelling in response to pressure overload-induced heart failure is not well understood.
We have previously demonstrated that mice overexpressing catalase targeted to mitochondria (mCAT) have ∼20% extension of lifespan,10 reduction of age-dependent left ventricular hypertrophy and diastolic dysfunction, concomitant with attenuation of age-dependent increases in cardiac mtDNA deletions and oxidative damage.11 These mCAT mice were also protected from angiotensin II-induced cardiac hypertrophy and Gαq overexpression-induced heart failure, while overexpression of wild-type catalase (targeted to peroxisomes) did not show any beneficial effect in response to angiotensin II or Gαq overexpression, indicating the crucial role played by mitochondrial oxidative stress in cardiac hypertrophy and failure.5
We have previously developed an algorithm using chromatographic alignment of LC-MS data that greatly improves the sensitivity to detection of differences in abundance between complex protein mixtures.12 In the present study, we applied this label-free unbiased method to characterize the changes in the mitochondrial proteome in pressure overload-induced heart failure and mCAT protection. This is the first study to show that scavenging mitochondrial reactive oxygen species (ROS) by mitochondrial catalase (mCAT) attenuates the phenotype of TAC-induced heart failure in parallel with protection of cardiac mitochondrial proteome remodelling, including protection from metabolic remodelling, attenuation of mitochondrial unfolded protein response (UPR), and apoptotic pathways.
2. Methods
Please see Supplementary material online for detailed methods.
2.1. TAC surgery and echocardiography
All animal experiments conformed with the Guide for the Care and Use of Laboratory Animals published by the US National Institutes of Health and were approved by the University of Washington Institutional Animal Care and Use Committee. Fourteen C57Bl6/FVB F1 mice at 16–20 weeks of age were included in the TAC groups (7 WT-TAC and 7 α-myosin heavy chain-inducible-mCAT-TAC), and 8 littermate mice were controls with sham surgery (4 WT-sham and 4 mCAT-sham). Surgeries were performed 4 weeks after Tamoxifen induction. All mice were anaesthetized with ketamine (130 mg/kg, IP) and xylazine (8.8 mg/kg, IP). Adequacy of anaesthesia was assessed by monitoring the heart rate and respiratory rate as well as the loss of response to toe pinch. For TAC surgery, the mice were intubated and supported by a rodent ventilator, and then the intercostal muscles were carefully dissected to visualize the aortic arch. The aortic arch was isolated from the pulmonary artery, then a blunted 26 gauge needle was ligated tightly around the transverse aorta, and the needle was immediately removed. The lungs were inflated and the chest wall was closed in layers. The detailed procedure is described in the Supplementary material online, Methods.13,14 Echocardiography was performed at baseline, at 1 week after TAC, and at the end of experiments using M-mode, conventional, and tissue Doppler under isoflurane 0.5% mixed with O2 to provide adequate sedation but minimal cardiac suppression during echocardiography.11
2.2. Quantitative PCR and western blots
The quantitative PCR was performed using Taqman Gene Expression Assays, which include: atrial natriuretic peptide (ANP) (Mm01255747), brain natriuretic peptide (BNP) (Mm 00435304), collagen 1a2 (Mm 00483937), and PGC1-α (Mm00731216). All expression assays were normalized to 18S RNA. Antibodies used for the western blots were anti-Acadvl, anti-Aco2, anti-Prdx3, anti-elongation factor Tu (Tufm) (all from Santa Cruz Biotechnology, SC-74898, SC-130677, SC-23973, SC-12991, respectively), anti-Hk1 (Cell Signaling), anti-Opa1 (Novus Biologicals, NB110-55290), and Donkey anti-rabbit secondary antibody (Thermo Scientific).
2.3. Sample preparation and analysis by mass spectrometry
Three animals from each experimental group were processed for proteomics. Purification of cardiac mitochondria was performed as described.15 Briefly, mice were euthanized by cervical dislocation. The heart was removed immediately and rinsed in cold saline. Cardiac ventricular tissues were homogenized in cold mitochondrial isolation buffer (250 mM sucrose, 1 mM EGTA, 10 mM HEPES, 10 mM Tris–HCl pH 7.4), and then the lysates were centrifuged at 800 g for 10 min. The supernatants were further centrifuged at 4000 g for 30 min at 4°C. The crude pellets were then resuspended in 19% Percoll solution in isolation buffer and slowly layered on top of a preformed step Percoll gradient, 30 and 60% (v/v), respectively. After centrifugation at 10 000 g for 20 min, purified mitochondria were retrieved at the interface between two layers. For mass spectrometry, mitochondrial fractions were solubilized with Rapigest (Waters Corporation, Milford, MA, USA) to a final concentration of 0.1% and boiled for 5 min. The samples were treated with 5 mM DTT at 60°C for 30 min, and then with 15 mM iodoacetamide at room temperature for 30 min. Samples were digested at 37°C with trypsin at 1:100 (µg trypsin: µg protein) for 2 h. The trypsin was deactivated and Rapigest was hydrolysed with 200 mM of HCl and incubated at 37°C for 30 min. The samples were centrifuged for 10 min at 20 000 g and the supernatant saved. The digested samples were analysed by LC-MS/MS. A Waters nanoAcquity LC system was used for peptide separation, followed by electrospray ionization and mass spectrometry using a Thermo Scientific LTQ-FT Ultra, as described in the Supplementary material online, Methods.
2.4. Analysis of MS data and statistical analysis
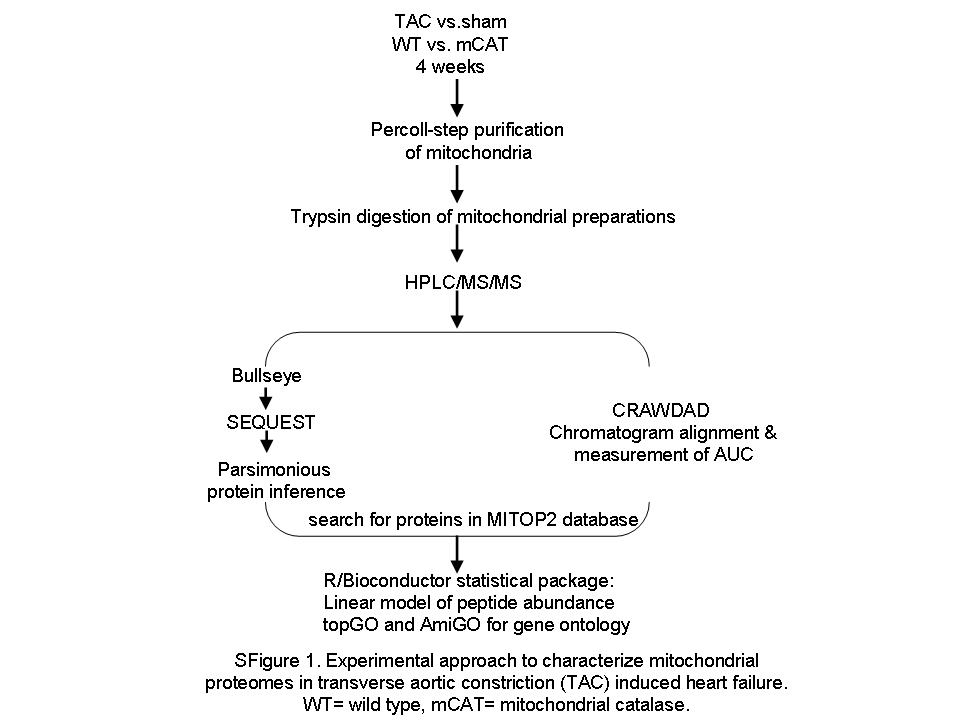
High-resolution MS data were processed by Bullseye16 to optimize precursor mass information. MS/MS spectra were searched by SEQUEST (version 27)17 against a mouse IPI database (3/25/09). The search was done with semi-tryptic specificity, a static mass modification of 57.021 on cysteines, and a precursor mass tolerance of ±10 ppm. Peptide spectrum match false discovery rates were determined by the Percolator algorithm18 with a threshold of 0.01. Parsimonious protein inference was determined using the IDPicker algorithm.19 Chromatographic alignment and peptide peak areas were determined by CRAWDAD.4 This workflow is shown in Supplementary material online, Figure S1. For proteins which were represented by more than one peptide, we took the average of multiple peptides; the mean number of peptides/protein was 6 (the median was 4). For proteins that had more than one peptide, the coefficient of variation between estimates of different peptides of the same protein was in the range 0.72–0.81. This number did not change appreciably with increasing numbers of peptides/protein.
In order to determine statistically significant changes of proteins between experimental groups, we used a linear model of peptide abundance to calculate fold changes of proteins between experimental groups in the same manner as a two-sample t-test using the R/Bioconductor software.20 For the cases where a protein consisted of more than one peptide, a paired t-test was used. The linear model output gave P-values that were adjusted for multiplicity with the Bioconductor package Q-value,21 which allows for selecting statistically significant genes while controlling the estimated false discovery rate. Since our focus was on mitochondria proteins, we only looked at those proteins we measured that were in the list of 1334 proteins of MITOP.222 (http://www.mitop.de:8080/mitop2/).
In order to determine groups of related proteins, we used biological process (BP) category analysis via the cumulative hypergeometric distribution method of determining enhanced gene ontology (GO) categories23 using the Bioconductor package topGO.20,24 This approach uses our lists of statistically significant genes and identifies GO categories by evidence of over-representation of significant genes. We employed the topGO classic and weight method. The weight method is a combination of the classic method and the elimination method. In the classic method, each GO category is treated as independent, even if there is a large overlap of member genes. In the elimination method, genes that are significant in lower level GO categories are removed from higher levels. The topGO weight method genes are weighted depending on their scores in neighbouring nodes, thereby better identifying and removing local dependencies between GO categories. The weight method has the advantage of reducing the false-positive rate,21 while at the same time not missing many truly enriched categories.
2.5. Statistical analysis for other data
Data in Figures 1 and 2 were presented as means ± SEM. One-way ANOVA was used to compare differences among multiple groups, followed by post hoc tests for significance. P< 0.05 was considered significant.
Figure 1.

Echocardiographic measurements of cardiac structure and function. (A) Left ventricular mass index (LVMI) at 1 week and 4 weeks after TAC displayed a progressive increase in WT-TAC that was attenuated in mCAT-TAC. (B) Systolic function measured by per cent fractional shortening (FS%) showed dramatic decline in WT-TAC at 4 weeks, which was ameliorated in mCAT-TAC. (C) Measurement of MPI showed a significant impairment (increase) in WT-TAC, which was better protected in mCAT-TAC. (D) Both left ventricular end-diastolic dimension (LVEDD) and end-systolic diameter (LVESD) were significantly greater after 4 weeks of TAC. *P< 0.05 for WT-sham vs. WT-TAC, #P< 0.05 for mCAT-TAC vs. WT-TAC.
Figure 2.

Pathology of TAC-induced heart failure. (A) Representative images of hearts after TAC in WT and mCAT mice. (B) Both normalized heart weight and lung weight significantly increased in WT-TAC, which were attenuated in mCAT-TAC. (C) Representative trichrome histology and (D) quantitative analysis revealed that severe interstitial fibrosis in WT-TAC was significantly protected by mCAT. (E) Quantitative PCR displayed dramatic increase in ANP in WT-TAC, which was attenuated in mCAT-TAC. (F) Quantitative PCR of BNP and collagen 1a2 showed significant increases in WT-TAC that were partially protected in mCAT-TAC. *P< 0.05 for WT-sham vs. WT-TAC, #P< 0.05 for mCAT-TAC vs. WT-TAC.
3. Results
3.1. Overexpression of mCAT attenuates pressure overload-induced heart failure
TAC induced significant LV hypertrophy in WT mice at 1 week after the surgery, as indicated by more than a two-fold increase in echocardiographic LV mass index (LVMI), P= 0.006, and mCAT significantly attenuated this hypertrophic response to pressure overload (P= 0.05, Figure 1A, left panel). After 4 weeks of TAC surgery, LVMI further increased in both WT and mCAT, and mCAT showed a trend towards attenuation of this increased LVMI (P= 0.1, Figure 1A, right panel). Systolic function measured by per cent fractional shortening (FS) significantly declined after 4 weeks of TAC in WT mice (P< 0.0001 for WT-TAC vs. WT-sham, Figure 1B), in parallel with worsening (increase) of myocardial performance index (MPI) (P= 0.0004 for WT-TAC vs. WT-sham, Figure 1C). Both the decline in FS and increase in MPI were significantly ameliorated in mCAT-TAC mice (FS: P= 0.002 for mCAT-TAC vs. WT-TAC; MPI: P= 0.01 for mCAT-TAC vs. WT-TAC, Figure 1B and C). Both LV end-diastolic diameter and end-systolic diameter markedly increased after TAC in WT mice (P< 0.001 for both compared with WT-sham, Figure 1D), and this chamber enlargement was mitigated by mCAT (Figure 1D).
Figure 2A shows an example of cardiac enlargement after 4 weeks of TAC in WT mice, which was protected in mCAT mice. As shown in Figure 2B, normalized heart weight significantly increased by 83% in WT-TAC compared with WT-sham (P< 0.01) and this was significantly attenuated in mCAT-TAC (P= 0.03 compared with WT-TAC). Consistent with the marked decline in systolic function, normalized lung weight dramatically increased by 3.4-fold in WT mice after TAC compared with sham controls, indicative of congestive heart failure (P< 0.01, Figure 2B) and this was partially protected in mCAT-TAC mice (P= 0.05, Figure 2B). Masson Trichrome staining displayed severe interstitial fibrosis in WT-TAC hearts, and quantitative image analysis demonstrated that TAC induced a greater than four-fold increase in myocardial fibrosis, as assessed by Masson's Trichrome blue staining, and this was significantly attenuated by mCAT overexpression (Figure 2C and D). Compared with WT-sham controls, WT-TAC showed significant upregulation of ANP, an indicator of cardiac hypertrophy, and BNP, a biomarker of heart failure, as well as collagen 1a2, a constituent of cardiac fibrosis. TAC-induced upregulation of ANP and collagen 1a2 was significantly suppressed in mCAT mice (P< 0.05 for mCAT-TAC vs. WT-TAC for both genes, Figure 2E and F).
3.2. Analysis of the cardiac mitochondrial proteome remodelling in TAC-induced heart failure
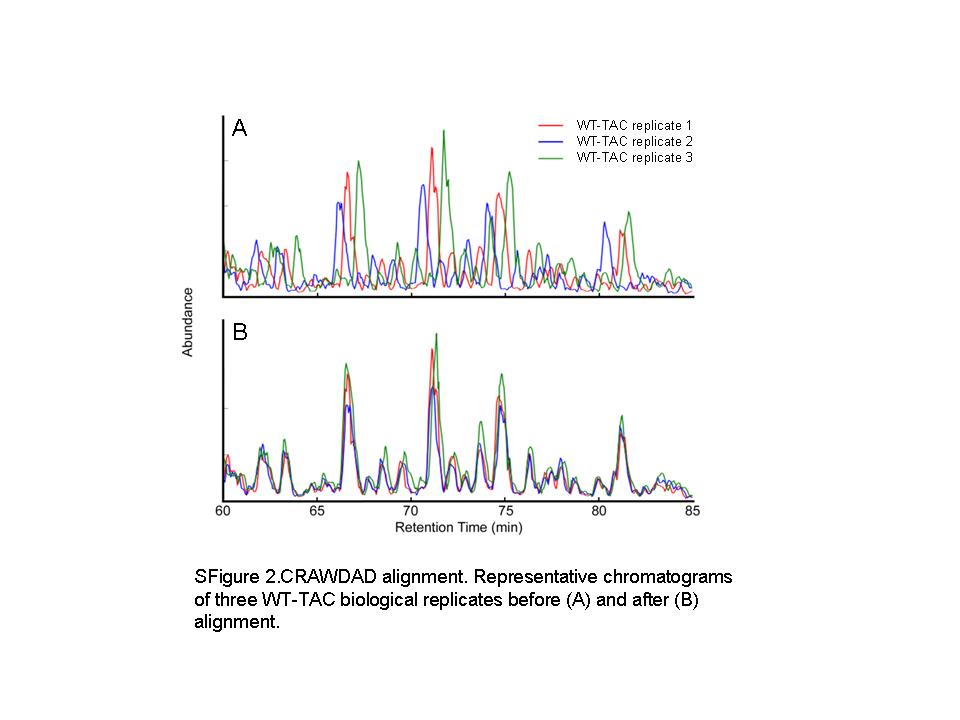
To investigate the changes in the mitochondrial proteome in pressure overload-induced heart failure and the roles of mitochondrial oxidative stress, we purified cardiac mitochondrial fractions and performed label-free quantitative analysis by shotgun proteomics. The overall flow of the analysis is shown in Supplementary material online, Figure S1. Chromatographic alignment was performed using the CRAWDAD algorithm to reduce the effect of chromatographic drift that may occur during the sample analyses and allowing comparisons of low abundance analytes that may be detected in only a single sample (Supplementary material online, Figure S2).12
3.3. Functional annotation of cardiac mitochondrial proteome remodelling in TAC-induced heart failure
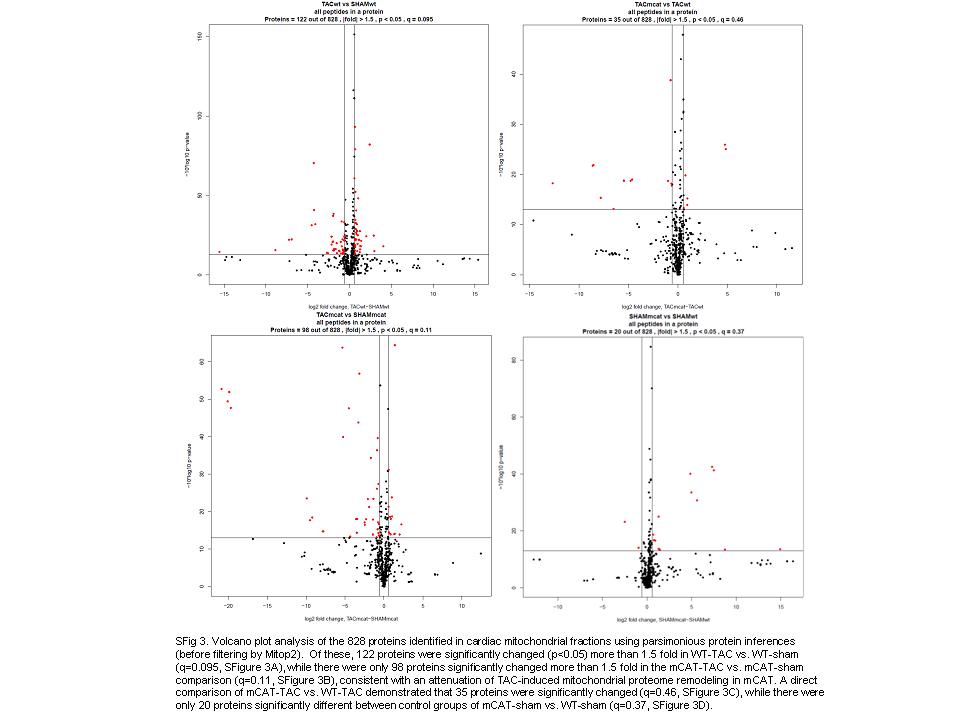
A total of 828 protein groups were identified in cardiac mitochondrial fractions using parsimonious protein inferences (see Methods19). Volcano plot analyses of these data are shown in Supplementary material online, Figure S3. The unbiased comparison of mitochondrial proteomes was performed by filtering the 828 proteins to exclude those not reported in the MITOP2 database (www.mitop.de:8080/mitop2/),22 resulting in 425 mitochondrial proteins. Of these, 140 proteins were significantly changed in at least one of the four two-group comparisons (Stab 1). The clustering of abundance differences of these 140 proteins was displayed as a heatmap of the four two-group comparisons, as shown in Figure 3. While WT-TAC vs. WT-sham and mCAT-TAC vs. mCAT-sham showed a roughly similar pattern of TAC-induced changes, TAC-induced differences were generally lower in magnitude (fainter in colour) in mCAT-TAC vs. mCAT-sham than WT-TAC vs. WT-sham comparisons; this is made more apparent in the direct comparison of mCAT-TAC vs. WT-TAC which is generally blue (lower abundance in mCAT-TAC) when WT-TAC vs. WT-sham is red (higher abundance in WT-TAC) or the converse (red, i.e. higher abundance in mCAT when WT-TAC vs. WT-sham is blue, i.e. lower abundance in WT-TAC). Interestingly, sham-treated mCAT mice compared with sham-treated WT mice also showed generally lower expression of differentially expressed proteins in the mCAT group, even among some of those that were relatively more strongly expressed in mCAT after TAC (compare mT-wT with mS-wS in Figure 3). The few exceptions to this (showing the reverse pattern) included catalase (due to mCAT expression), aldehyde dehydrogenase 1, hexokinase 2, and two subunits of complex I and one each of IV and V.
Figure 3.

Heat map presentation of four two-group comparisons of significantly changed mitochondrial proteins (from MITOP2). Blue represents decreased abundance and red represents increased abundance (in log2-fold change). The black strips above the heat maps described proteins that were significantly changed in the corresponding two-group comparison. mT, mCAT-TAC; mS, mCAT-Sham; wT, WT-TAC; wS, WT-sham.
In order to categorize the significantly changed mitochondrial proteins according to their biological functions, a systematic functional annotation was performed (Stab 1). As shown in Figure 4A, 96 proteins significantly changed in TAC-induced heart failure in WT mice when compared with sham WT controls; metabolism and electron transport chain (ETC) proteins represented 28 and 23% of the changes, respectively. Proteins involved in transmembrane transport, ATP synthesis, protein folding/proteolysis, and apoptosis represented another 30% of the TAC-induced remodelling.
Figure 4.

Functional annotation of significantly changed mitochondrial proteins. (A) For WT-TAC vs. WT-sham, 96 proteins significantly changed; (B) for mCAT-TAC vs. mCAT-sham, 36 proteins significantly changed; (C) for mCAT-TAC vs. WT-TAC, 35 proteins significantly changed; (D) for mCAT-sham vs. WT-sham, 36 proteins significantly changed. The number of proteins changed in each functional category is shown in parentheses.
Fatty acid metabolism accounts for a large part of changes in metabolic proteins, with a concurrent decline of eight enzymes related to fatty acid beta-oxidation, including the key enzymes Acyl-CoA dehydrogenases, enoyl-CoA hydratase, and mitochondrial 3-oxoacyl-Coenzyme A thiolase (Stab 1). This is consistent with the finding based on our qPCR measurement of mRNA expression (data not shown) that the master regulator of fatty acid oxidation and mitochondrial biogenesis, PGC1α, was downregulated 25% in WT-TAC compared with WT-sham mice (P< 0.05). Consistent with previous reports that myocardial substrate metabolism switched from predominantly fatty acids to glucose during development of heart failure,25 we found that the abundance of hexokinase 1, a key enzyme in glycolysis, was upregulated more than five-fold in WT-TAC mice (Stab 1). Two of six TCA cycle enzymes significantly increased in heart failure, isocitrate dehydrogenase, and malate dehydrogenase, while another TCA cycle enzyme, dihydrolipoamide S-succinyltransferase (E2 component of α-ketoglutarate complex) was significantly decreased. We also observed a significant decline in pyruvate dehydrogenase complex (PDC) and increased abundance of pyruvate dehydrogenase kinase (which phosphorylates and inactivates PDC) in WT-TAC mice. These changes are predicted to hinder the utilization of pyruvate from glycolysis in oxidative phosphorylation (Stab 1).
In the large category of ETC proteins changed in heart failure after TAC, there were 10 subunits of complex I (NADH dehydrogenase), 2 subunits of complex III (ubiquinol-cytochrome c reductase), and 2 subunits of complex IV (cytochrome c oxidase), all significantly increased. In addition, two subunits of complex IV and one of each subunit of complexes I and III significantly decreased after TAC in WT mice. Four subunits of ATP synthase complex F0 and F1 components significantly increased and one subunit decreased in WT-TAC (Stab 1). Proteins related to apoptosis, protein folding, and proteolysis as well as proteins involved in transcription and translation were also significantly altered, mostly by upregulation, in TAC-induced heart failure (Stab 1).
3.4. The effect of mCAT overexpression in cardiac mitochondrial proteomes
Consistent with the partial protection of mCAT against TAC-induced heart failure (Figures 1 and 2), the remodelling of cardiac mitochondrial proteome was also attenuated by mCAT. As shown in Figure 4B, only 36 proteins significantly changed in mCAT-TAC, when compared with mCAT-sham. Among these, two enzymes of fatty acid metabolism increased after TAC in mCAT, in contrast to 10 that declined in WT-TAC (Stab 1). This was consistent with the qPCR analysis of PGC1α mRNA which showed 1.98-fold increased expression in mCAT-TAC vs. WT-sham mice (P< 0.05). Three subunits of complex IV and one subunit of complex I were decreased in mCAT-TAC, while two subunits of complex I and one subunit of complex III, together with electron transferring flavoprotein dehydrogenase, were increased after TAC in mCAT (Stab 1).
A direct comparison between mCAT-TAC vs. WT-TAC displayed 35 significantly changed proteins (Figure 4C). mCAT-TAC had significantly lower glycolytic enzymes and higher hydroxyacyl-coenzyme A dehydrogenase, an enzyme of fatty acid oxidation, indicated partial protection from substrate switching. Furthermore, several proteins involved in apoptosis, proteolysis, transcription, and translation were concurrently downregulated in mCAT-TAC, when compared with WT-TAC (Stab 1).
The baseline comparison between mCAT and WT-sham controls (Figure 4D) showed 36 significantly differentially expressed proteins. Interestingly, mCAT-sham controls showed significantly lower abundance in TCA cycles enzyme, proteins involved in proteolysis and amino-acid catabolism as well as mitochondrial protein translation (Stab 1).
3.5. Gene ontology analysis
To systematically uncover the BPs that had altered representation in the mitochondrial proteomes of failing hearts, we generated a list of GO terms associated with the 425 mitochondrial proteins that were identified in our samples. The BP GO categories with smallest weighted P-values indicated the categories that were overrepresented in each comparison (see Stab 2). The top three GO categories overrepresented in the WT-TAC vs. WT-sham comparison are fatty acid beta-oxidation, oxidation reduction, and embryonic morphogenesis; for mCAT-TAC vs. WT-TAC, these are fatty acid beta-oxidation, cholesterol metabolic process, and regulation of molecular function. Notably, while proteins involved in fatty acid oxidation were overrepresented in the changes from normal (WT-sham) to failing heart (WT-TAC), these were protected by mCAT (significant in the comparison of mCAT-TAC vs. WT-TAC).
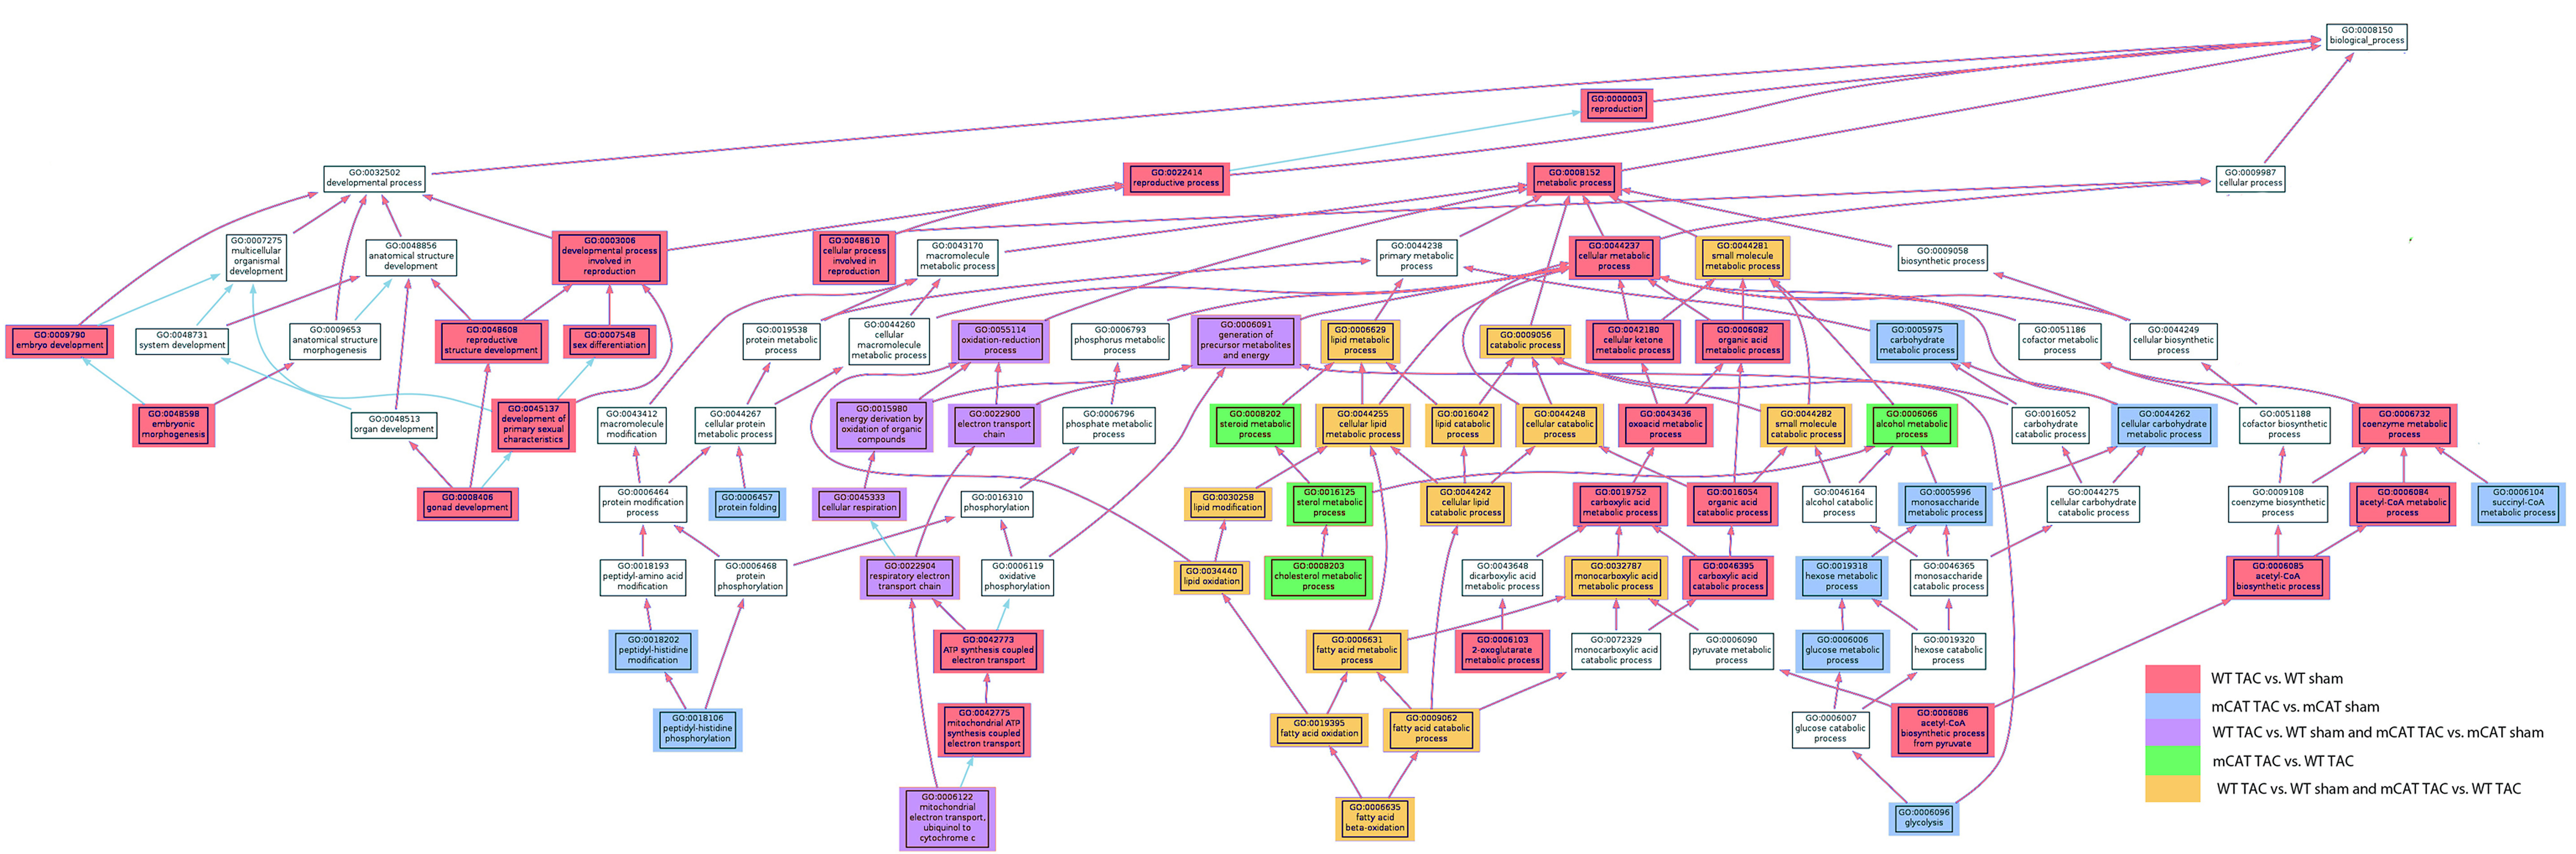
Analysis of the BP GO categories differentially affected by TAC and by MCAT was facilitated by generating an AmiGO dendrogram (amigo.geneontology.org). The full AmiGO analysis is shown in Supplementary material online, Figure S4; the portion of this figure showing altered metabolic, electron transport, and developmental processes is displayed in Figure 5. TAC-induced heart failure in WT mice was overrepresented by lipid, ketones, and organic acid metabolic process BP GO categories (red and orange boxes in Figure 5). The partial protection conferred by mCAT was overrepresented in lipid and alcohol metabolic processes (orange and green boxes, Figure 5). Most interestingly, carbohydrate/monosaccharide metabolic processes were uniquely overrepresented in mCAT but not in WT mice in response to TAC (blue boxes, Figure 5). Protein folding and peptidyl-histine modification categories were also only represented in mCAT, but not in WT mice in response to TAC. In addition, only WT-TAC (not mCAT-TAC) produced overrepresented changes in eight BP GO categories within embryonic and reproductive developmental processes (pink boxes at left, Figure 5); these included mitochondrial proteins Opa1, Phb2, Letm1, and Sod1. Changes in ETC and cellular respiration BP GO categories (purple boxes, middle left of Figure 5) confirm the results shown in Stab 1 that significant changes are seen in both mCAT and WT-TAC compared with their sham controls. Alterations within the MAPKKK cascade and signalling, significant only in WT-TAC, are reflected in the rightmost portion of Supplementary material online, Figure S4.
Figure 5.

AmiGO dendrogram of BP GO category under metabolic and developmental processes. The significantly overrepresented GO categories, as well as those overrepresented in both of two comparisons are shown in colour using the key indicated. Please see Supplementary material online for a larger version of this figure, Figure S5.
3.6. Western blots confirmation
Western blots using cardiac whole tissue lysates were performed for six essential mitochondrial proteins, members of the GO categories described above (Stab 1). These included acyl-coA dehydrogenase very long-chain (Acadvl, lipid metabolism), aconitase 2 (Aco2, TCA cycle), hexokinase 1 (Hk1, hexose metabolism), optic atrophy 1 (Opa1, developmental process), peroxiredoxin-3 (Prdx-3, response to oxidative stress), and mitochondrial elongation factor Tu (Tufm, transcription and translation). Figure 6 demonstrates that the densitometric analyses of the western blots (normalized to GAPDH) are fully concordant with the MS spectra in direction of changes. When the magnitude of changes was compared, the western blots densitometry data were approximate to the data from proteomics analysis in 8 out of 12 pairwise comparisons (Figure 6G). We also normalized the densitometric analysis of the western blots to Ponceau S staining (total loaded protein), as shown in Stab 3. While the changes in protein abundance observed by MS are generally replicated in the data normalized to Ponceau S, the overall correlation with MS abundance was better when normalized to GAPDH than to Ponceau S. The uncertainty of selection for loading control in western blot analysis revealed another strength of mass spectroscopy analysis which is that normalization to total ionic current provides an independent control for total protein loading.
Figure 6.

Comparison between mean spectra of representative peptides and western blots (from three biological replicates) of corresponding proteins for (A) acyl-coA dehydrogenase, very long-chain (Acadvl); (B) aconitase 2 (Aco2); (C) hexokinase 1 (Hk1); (D) optic atrophy 1 (Opa1); (E) peroxiredoxin-3 (Prdx-3); (F) mitochondrial elongation factor Tu (Tufm). (G) Comparison between western blots densitometry and proteomics analysis. Western blots were quantified by densitometry of total protein lysate normalized to GAPDH; MS proteomics data were quantified by integrating the areas of the extracted ion current area under the curves of the multiple detected peptides of the corresponding protein, normalized to total mitochondrial peptide area. *P< 0.05 for WT-TAC vs. WT-sham; #P< 0.05 for mCAT-TAC vs. WT-TAC.
4. Discussion
We have previously shown that mitochondrial ROS is an important mechanism leading to mitochondrial oxidative damage and dysfunction that contributes to the development of cardiac hypertrophy in angiotensin II-treated mice and heart failure in Gαq-overexpressing mice.5 The present study is the first to demonstrate the critical role of mitochondrial ROS in TAC-induced heart failure. TAC-induced changes in cardiac structure and function, as assessed by echocardiographic parameters LVMI, FS, MPI and LVESD, are all ameliorated by mCAT. Pathologic changes (organ weight and fibrosis) and key mRNA indicator of cardiac hypertrophy (ANP) in TAC are attenuated in mCAT mice. This protection confirms the key role of mitochondrial ROS in signalling pathways that mediate cardiac failure and extends previous observations made with angiotensin II-induced hypertrophy and Gaq overexpression-induced failure.7 Using a label-free shotgun proteomics approach, we were able to characterize the remodelling of the mitochondrial proteome in pressure overload-induced heart failure. Scavenging mitochondrial ROS by catalase targeted to mitochondria (mCAT) significantly attenuated and altered mitochondrial proteome remodelling.
Almost all the ATP that is used by the beating heart is generated by oxidative phosphorylation in mitochondria. Mitochondrial ATP production is fuelled by the proton gradient generated during electron transfer using NADH and FADH2. In healthy hearts, these reducing equivalents are mainly generated by fatty acid oxidation and the TCA cycle, and to a much lesser extent from glycolysis and pyruvate dehydrogenase.26 Downregulation of the enzymes of the fatty acid oxidation pathways has been consistently shown in various animal models of experimental heart failure, including pacing-induced end-stage heart failure in dogs,27 rat models of heart failure induced by chronic myocardial infarction,27 TAC, or spontaneous hypertension in rats.9,28 These changes are also seen in hearts from cardiac failure patients.8 Our proteomic analysis confirmed that the decline in fatty acid oxidation is the predominant feature of mitochondrial proteome remodelling in TAC-induced heart failure (Stabs 1 and 2, Figure 5). Protection from mitochondrial ROS by mCAT attenuates the decline in fatty acid oxidation, in agreement with the changes in the master regulator PGC1α, which was found to be downregulated in WT-TAC, but upregulated in mCAT-TAC.
Suppression of fatty acid oxidation in heart failure is thought to stimulate increased glucose utilization. In WT-TAC, we found a significant increase in hexokinase, the enzyme in the first-step of glycolysis, but a decrease in PDC (which converts pyruvate from glycolysis into acetyl-CoA, a substrate for the TCA cycle) and an increase in pyruvate dehydrogenase kinase, which phosphorylates and inactivates PDC. The increase in glycolysis without a concomitant increase in glucose oxidation suggests that less favourable and inefficient anaerobic glycolysis has been used as an energy source for the late-stage failing heart of WT-TAC, consistent with a prominent defect in glucose oxidation in the rat model of TAC-induced heart failure.9 Upregulation of the glycolytic pathway is also observed in mCAT, but to a much lesser extent, as the fatty acid oxidation pathway is significantly better preserved in mCAT.
While defects in ETC complexes have been described in experimental animals and human patients with heart failure,29–31 mainly including complexes I, III, and IV, paradoxical increases in ETC enzymes have been reported in other studies. In 20-month-old spontaneous hypertensive rats with LV dysfunction, iTRAQ-assisted quantification of mitochondrial proteome revealed increases in several subunits of complexes I, III, and IV.28 In contrast, Bugger et al.9 reported that more than 50% of ETC proteins decreased after TAC-induced heart failure in rats, with an increase in some subunits of complexes I, II, and V. This inconsistency in the changes of ETC complexes was also observed in the present study, though with more subunits increased rather than decreased after TAC (Stab 1). However, the fact that most studies have consistently shown a decline in mitochondrial respiratory function in heart failure and considering that ETC complexes are susceptible to oxidative damage, we suggest the possibility that the increase in some ETC component abundance after TAC might relate to a larger fraction of dysfunctional damaged proteins.
We have previously shown that increased mitochondrial damage and protein oxidation in response to angiotensin II activates autophagy to remove damaged mitochondria.5 In the present study, we further observed concurrent increases in several proteins in the mitochondrial UPR pathway, including mitochondrial heat shock protein 9, leucine aminopeptidase 3 as well as lon peptidase (Stab 1). These proteins are known to maintain accurate protein folding and complex assembly and to degrade damaged proteins in mitochondria. Furthermore, several proteins involved in apoptosis were also upregulated in heart failure (WT-TAC), including apoptotic inducing factor and VDAC, an anion channel protein that plays a key role in modulating mitochondrial permeability transition pore opening. VDAC overexpression has previously been shown to increase apoptotic cell death.32 As mitochondrial oxidative damage can stimulate mitochondrial biogenesis to generate new mitochondria,5 we observed an increased abundance of proteins involved in mitochondrial translation such as mitochondrial elongation factor Tu (Tufm) and G (Gfm1) after TAC in WT (but not mCAT) mice (Stab 1). However, the master regulator of mitochondrial biogenesis PGC1α was downregulated in late-stage heart failure in WT-TAC (but not mCAT) mice, indicating that mitochondrial biogenesis fails to keep pace with accelerated damage and increase demand in pressure overload in WT mice.
The display of GO relationships using the AmiGO tool (Figure 5 and Supplementary material online, Figure S4) proved to be insightful. Lipid metabolism was the topGO category overrepresented in both TAC-induced heart failure in the WT and the amelioration of failure by mCAT (orange colour, Figure 5). Interestingly, the GO categories that were only overrepresented in mCAT-TAC vs. mCAT-sham but not in the WT-TAC vs. WT-sham included hexose metabolism and protein folding/proteolysis (blue boxes, Figure 5). This suggests that reduction in ROS by mCAT allows an augmentation of glucose oxidative capacity as well as protein folding/proteolysis that are otherwise not a response of WT hearts to failure (Stabs 1 and 2). We hypothesize that these are pathways and processes that are adaptive to the increased work and metabolic requirements of pressure overload, but which are normally inhibited by overproduction of ROS in the WT hearts. Thus, augmentation of these responses is a unique aspect of protection from mitochondrial ROS, beyond the effects of simply attenuating deleterious WT responses.
Conclusion
In summary, mitochondrial oxidative stress plays a critical role in pressure overload-induced heart failure. Using an improved method of label-free shotgun proteomics, we demonstrate that mitochondrial proteome remodelling in TAC-induced heart failure mainly include decrease abundance in proteins involved in fatty acid metabolism with compensatory increase in glycolytic enzymes, as was previously reported in the rat model,9 but also an increase in proteins involved in apoptosis, protein folding and proteolysis, transcription and translational control, responses to stimuli as well as developmental processes. Scavenging mitochondrial ROS by mCAT significantly attenuated mitochondrial proteome remodelling in response to TAC, including better preservation of proteins involved in fatty acid metabolism and attenuation of increased apoptosis. mCAT also uniquely augmented glucose oxidative capacity, protein folding responses, and proteolysis.
Supplementary material
Supplementary material is available at Cardiovascular Research online.
Funding
This work was supported by the National Institutes of Health grants number: HL101186, AG000751, AG013280.
Conflict of interest: none declared.
Supplementary Material
References
- 1.Lloyd-Jones D, Adams RJ, Brown TM, Carnethon M, Dai S, De Simone G, et al. Heart disease and stroke statistics—2010 update: a report from the American Heart Association. Circulation. 2010;121:e46–e215. doi: 10.1161/CIRCULATIONAHA.109.192667. [DOI] [PubMed] [Google Scholar]
- 2.Levy D, Larson MG, Vasan RS, Kannel WB, Ho KK. The progression from hypertension to congestive heart failure. JAMA. 1996;275:1557–1562. [PubMed] [Google Scholar]
- 3.Oka T, Komuro I. Molecular mechanisms underlying the transition of cardiac hypertrophy to heart failure. Circ J. 2008;72(Suppl. A):A13–A16. doi: 10.1253/circj.cj-08-0481. [DOI] [PubMed] [Google Scholar]
- 4.Rosca MG, Hoppel CL. Mitochondria in heart failure. Cardiovasc Res. 2010;88:40–50. doi: 10.1093/cvr/cvq240. [DOI] [PMC free article] [PubMed] [Google Scholar]
- 5.Dai DF, Johnson SC, Villarin JJ, Chin MT, Nieves-Cintron M, Chen T, et al. Mitochondrial oxidative stress mediates angiotensin II-induced cardiac hypertrophy and G{alpha}q overexpression-induced heart failure. Circ Res. 2011;108:837–846. doi: 10.1161/CIRCRESAHA.110.232306. [DOI] [PMC free article] [PubMed] [Google Scholar]
- 6.Sharov VG, Todor AV, Silverman N, Goldstein S, Sabbah HN. Abnormal mitochondrial respiration in failed human myocardium. J Mol Cell Cardiol. 2000;32:2361–2367. doi: 10.1006/jmcc.2000.1266. [DOI] [PubMed] [Google Scholar]
- 7.Boudina S, Laclau MN, Tariosse L, Daret D, Gouverneur G, Bonoron-Adele S, et al. Alteration of mitochondrial function in a model of chronic ischemia in vivo in rat heart. Am J Physiol Heart Circ Physiol. 2002;282:H821–H831. doi: 10.1152/ajpheart.00471.2001. [DOI] [PubMed] [Google Scholar]
- 8.Sack MN, Rader TA, Park S, Bastin J, McCune SA, Kelly DP. Fatty acid oxidation enzyme gene expression is downregulated in the failing heart. Circulation. 1996;94:2837–2842. doi: 10.1161/01.cir.94.11.2837. [DOI] [PubMed] [Google Scholar]
- 9.Bugger H, Schwarzer M, Chen D, Schrepper A, Amorim PA, Schoepe M, et al. Proteomic remodelling of mitochondrial oxidative pathways in pressure overload-induced heart failure. Cardiovasc Res. 2010;85:376–384. doi: 10.1093/cvr/cvp344. [DOI] [PubMed] [Google Scholar]
- 10.Schriner SE, Linford NJ, Martin GM, Treuting P, Ogburn CE, Emond M, et al. Extension of murine life span by overexpression of catalase targeted to mitochondria. Science. 2005;308:1909–1911. doi: 10.1126/science.1106653. [DOI] [PubMed] [Google Scholar]
- 11.Dai DF, Santana LF, Vermulst M, Tomazela DM, Emond MJ, MacCoss MJ, et al. Overexpression of catalase targeted to mitochondria attenuates murine cardiac aging. Circulation. 2009;119:2789–2797. doi: 10.1161/CIRCULATIONAHA.108.822403. [DOI] [PMC free article] [PubMed] [Google Scholar]
- 12.Finney GL, Blackler AR, Hoopmann MR, Canterbury JD, Wu CC, MacCoss MJ. Label-free comparative analysis of proteomics mixtures using chromatographic alignment of high-resolution muLC-MS data. Anal Chem. 2008;80:961–971. doi: 10.1021/ac701649e. [DOI] [PubMed] [Google Scholar]
- 13.Kim Y, Phan D, van Rooij E, Wang DZ, McAnally J, Qi X, et al. The MEF2D transcription factor mediates stress-dependent cardiac remodeling in mice. J Clin Invest. 2008;118:124–132. doi: 10.1172/JCI33255. [DOI] [PMC free article] [PubMed] [Google Scholar]
- 14.Tarnavski O, McMullen JR, Schinke M, Nie Q, Kong S, Izumo S. Mouse cardiac surgery: comprehensive techniques for the generation of mouse models of human diseases and their application for genomic studies. Physiol Genomics. 2004;16:349–360. doi: 10.1152/physiolgenomics.00041.2003. [DOI] [PubMed] [Google Scholar]
- 15.Zhang J, Li X, Mueller M, Wang Y, Zong C, Deng N, et al. Systematic characterization of the murine mitochondrial proteome using functionally validated cardiac mitochondria. Proteomics. 2008;8:1564–1575. doi: 10.1002/pmic.200700851. [DOI] [PMC free article] [PubMed] [Google Scholar]
- 16.Hsieh EJ, Hoopmann MR, MacLean B, MacCoss MJ. Comparison of database search strategies for high precursor mass accuracy MS/MS data. J Proteome Res. 2010;9:1138–1143. doi: 10.1021/pr900816a. [DOI] [PMC free article] [PubMed] [Google Scholar]
- 17.Ducret A, Van Oostveen I, Eng JK, Yates JR, 3rd, Aebersold R. High throughput protein characterization by automated reverse-phase chromatography/electrospray tandem mass spectrometry. Protein Sci. 1998;7:706–719. doi: 10.1002/pro.5560070320. [DOI] [PMC free article] [PubMed] [Google Scholar]
- 18.Kall L, Canterbury JD, Weston J, Noble WS, MacCoss MJ. Semi-supervised learning for peptide identification from shotgun proteomics datasets. Nat Methods. 2007;4:923–925. doi: 10.1038/nmeth1113. [DOI] [PubMed] [Google Scholar]
- 19.Zhang B, Chambers MC, Tabb DL. Proteomic parsimony through bipartite graph analysis improves accuracy and transparency. J Proteome Res. 2007;6:3549–3557. doi: 10.1021/pr070230d. [DOI] [PMC free article] [PubMed] [Google Scholar]
- 20.Gentleman RC, Carey VJ, Bates DM, Bolstad B, Dettling M, Dudoit S, et al. Bioconductor: open software development for computational biology and bioinformatics. Genome Biol. 2004;5:R80. doi: 10.1186/gb-2004-5-10-r80. [DOI] [PMC free article] [PubMed] [Google Scholar]
- 21.Tusher VG, Tibshirani R, Chu G. Significance analysis of microarrays applied to the ionizing radiation response. Proc Natl Acad Sci USA. 2001;98:5116–5121. doi: 10.1073/pnas.091062498. [DOI] [PMC free article] [PubMed] [Google Scholar]
- 22.Elstner M, Andreoli C, Klopstock T, Meitinger T, Prokisch H. The mitochondrial proteome database: MitoP2. Methods Enzymol. 2009;457:3–20. doi: 10.1016/S0076-6879(09)05001-0. [DOI] [PubMed] [Google Scholar]
- 23.Camon E, Magrane M, Barrell D, Binns D, Fleischmann W, Kersey P, et al. The Gene Ontology Annotation (GOA) project: implementation of GO in SWISS–PROT, TrEMBL, and InterPro. Genome Res. 2003;13:662–672. doi: 10.1101/gr.461403. [DOI] [PMC free article] [PubMed] [Google Scholar]
- 24.Alexa A, Rahnenfuhrer J, Lengauer T. Improved scoring of functional groups from gene expression data by decorrelating GO graph structure. Bioinformatics. 2006;22:1600–1607. doi: 10.1093/bioinformatics/btl140. [DOI] [PubMed] [Google Scholar]
- 25.Lopaschuk GD, Ussher JR, Folmes CD, Jaswal JS, Stanley WC. Myocardial fatty acid metabolism in health and disease. Physiol Rev. 2010;90:207–258. doi: 10.1152/physrev.00015.2009. [DOI] [PubMed] [Google Scholar]
- 26.Stanley WC, Recchia FA, Lopaschuk GD. Myocardial substrate metabolism in the normal and failing heart. Physiol Rev. 2005;85:1093–1129. doi: 10.1152/physrev.00006.2004. [DOI] [PubMed] [Google Scholar]
- 27.Osorio JC, Stanley WC, Linke A, Castellari M, Diep QN, Panchal AR, et al. Impaired myocardial fatty acid oxidation and reduced protein expression of retinoid X receptor-alpha in pacing-induced heart failure. Circulation. 2002;106:606–612. doi: 10.1161/01.cir.0000023531.22727.c1. [DOI] [PubMed] [Google Scholar]
- 28.Jullig M, Hickey AJ, Chai CC, Skea GL, Middleditch MJ, Costa S, et al. Is the failing heart out of fuel or a worn engine running rich? A study of mitochondria in old spontaneously hypertensive rats. Proteomics. 2008;8:2556–2572. doi: 10.1002/pmic.200700977. [DOI] [PubMed] [Google Scholar]
- 29.Buchwald A, Till H, Unterberg C, Oberschmidt R, Figulla HR, Wiegand V. Alterations of the mitochondrial respiratory chain in human dilated cardiomyopathy. Eur Heart J. 1990;11:509–516. doi: 10.1093/oxfordjournals.eurheartj.a059743. [DOI] [PubMed] [Google Scholar]
- 30.Casademont J, Miro O. Electron transport chain defects in heart failure. Heart Fail Rev. 2002;7:131–139. doi: 10.1023/a:1015372407647. [DOI] [PubMed] [Google Scholar]
- 31.Marin-Garcia J, Goldenthal MJ, Moe GW. Abnormal cardiac and skeletal muscle mitochondrial function in pacing-induced cardiac failure. Cardiovasc Res. 2001;52:103–110. doi: 10.1016/s0008-6363(01)00368-6. [DOI] [PubMed] [Google Scholar]
- 32.Tomasello F, Messina A, Lartigue L, Schembri L, Medina C, Reina S, et al. Outer membrane VDAC1 controls permeability transition of the inner mitochondrial membrane in cellulo during stress-induced apoptosis. Cell Res. 2009;19:1363–1376. doi: 10.1038/cr.2009.98. [DOI] [PubMed] [Google Scholar]
Associated Data
This section collects any data citations, data availability statements, or supplementary materials included in this article.