Background: It is unknown whether neuromuscular transmission or muscle gap junctions synchronize neighboring muscle cells in C. elegans.
Results: Synchrony was greatly reduced by the elimination of gap junction function but not by pharmacological inhibition of neuromuscular transmission.
Conclusion: Gap junctions are responsible for muscle synchrony.
Significance: The present study helps to understand how a basic locomotion behavior is generated.
Keywords: C. elegans, Calcium Imaging, Cholinergic Receptor, GABA Receptors, Gap Junctions, Action Potential, Body Wall Muscle, Coupling Coefficient, unc-1, unc-9
Abstract
The sinusoidal locomotion of Caenorhabditis elegans requires synchronous activities of neighboring body wall muscle cells. However, it is unknown whether the synchrony results from muscle electrical coupling or neural inputs. We analyzed the effects of mutating gap junction proteins and blocking neuromuscular transmission on the synchrony of action potentials (APs) and Ca2+ transients among neighboring body wall muscle cells. In wild-type worms, the percentage of synchronous APs between two neighboring cells varied depending on the anatomical relationship and junctional conductance (Gj) between them, and Ca2+ transients were synchronous among neighboring muscle cells. Compared with the wild type, knock-out of the gap junction gene unc-9 resulted in greatly reduced coupling coefficient and asynchronous APs and Ca2+ transients. Inhibition of unc-9 expression specifically in muscle by RNAi also reduced the synchrony of APs and Ca2+ transients, whereas expression of wild-type UNC-9 specifically in muscle rescued the synchrony defect. Loss of the stomatin-like protein UNC-1, which is a regulator of UNC-9-based gap junctions, similarly impaired muscle synchrony as unc-9 mutant did. The blockade of muscle ionotropic acetylcholine receptors by (+)-tubocurarine decreased the frequencies of APs and Ca2+ transients, whereas blockade of muscle GABAA receptors by gabazine had opposite effects. However, both APs and Ca2+ transients remained synchronous after the application of (+)-tubocurarine and/or gabazine. These observations suggest that gap junctions in C. elegans body wall muscle cells are responsible for synchronizing muscle APs and Ca2+ transients.
Introduction
The nematode Caenorhabditis elegans moves by propagating a sinusoidal body wave in the dorsal-ventral plane. The mechanism for generating this locomotion wave is a subject of great interest because, with a locomotory system consisting mainly of five pairs of command interneurons, 57 ventral cord motoneurons, and 95 body wall muscle cells (1–4), C. elegans potentially allows a comprehensive description of the cellular and molecular basis for a basic locomotory behavior.
The sinusoidal locomotion of the worm requires synchronized contractions and relaxations of neighboring body wall muscle cells at the same position along the longitudinal body axis. It is unclear how the muscle cells get synchronized. Neural control could be important because each motoneuron forms synapses with several muscle cells that are located at the same longitudinal level (5, 6). In addition, gap junctions could play a role because muscle cells in parallel are electrically coupled, whereas those in series are not (7). However, precise roles of neural inputs and muscle gap junctions in synchronizing muscle activities are poorly defined. Mutations of body wall muscle acetylcholine or GABA receptors cause severe locomotion defects (8–12), but it is unclear whether the locomotory defects simply result from a change in muscle contractility or are also contributed by asynchrony. Injection of a small current comparable with that of the junctional currents (Ij) into a muscle cell causes significant membrane depolarization of the cell (7). However, mathematical modeling has led to controversial conclusions. Although one study suggested that body wall muscle electrical coupling is required for propagating the undulatory locomotion wave (13), another study concluded that the Ij between body wall muscle cells is too small to be of physiological significance (14). Thus, further studies are needed to assess the roles of neuromuscular transmission and gap junctions in synchronizing muscle activities.
Gap junctions have been implicated in the synchrony of a variety of cells. For example, neighboring body wall muscle cells of Ascaris lumbricoides, which is phylogenetically related to C. elegans, are electrically coupled (15) and fire action potentials (APs)2 synchronously (16). The synchrony of APs was thought to result from electrical coupling of the muscle cells (16), but no experimental evidence exists to back up this assumption. In mammalian brain, network oscillations, which are important to cognition (17), depend on synchronous electrical activities of inhibitory interneurons, and the synchrony requires the function of gap junctions but could be driven by chemical synaptic transmission (18–25).
Gap junctions in C. elegans are formed by innexins (26). The innexin UNC-9 is a major component of gap junctions in C. elegans body wall muscle cells (7) and requires UNC-1, a homologue of human stomatin, to function (27). Recent studies show that C. elegans body wall muscle cells fire all-or-none APs (28, 29) and produce Ca2+ transients that are associated with muscle contractions (28). It remains to be determined whether APs and Ca2+ transients are synchronized in neighboring body wall muscle cells and whether gap junctions are important to the synchrony. In the present study, we analyzed the effects of muscle gap junction deficiency and neuromuscular transmission blockade on the synchrony of C. elegans body wall muscle cells. We found that muscle gap junctions played a central role in synchronizing muscle APs and Ca2+ transients. This information is potentially useful to improving the existing models regarding C. elegans locomotion (1–3, 13, 30–32).
EXPERIMENTAL PROCEDURES
Growth and Culture of C. elegans
C. elegans hermaphrodites were grown on agar plates with a layer of OP50 Escherichia coli either at room temperature (21–22 °C) or inside an environmental chamber (21 °C).
Electrophysiology
Adult hermaphrodite animals were immobilized and dissected as described previously (33, 34). Briefly, an animal was immobilized on a glass coverslip by applying VetbondTM tissue adhesive (3M Company). Application of the adhesive was generally restricted to the dorsal middle portion of the animal, allowing the head and tail to sway during the experiment. A longitudinal incision was made in the dorsolateral region. After clearing the viscera, the cuticle flap was folded back and glued to the coverslip, exposing the ventral nerve cord and the two adjacent muscle quadrants. A Nikon FN-1 microscope equipped with a 40× water immersion objective and 15× eyepieces was used for viewing the preparation. Borosilicate glass pipettes with a tip resistance of 3–5 MΩ were used as electrodes for current- and voltage clamp recordings in the classical whole cell patch clamp configuration with a Multiclamp 700B amplifier (Molecular Devices, Sunnyvale, CA) and the Clampex software (version 10, Molecular Devices). Series resistance was compensated to 75–80% in voltage clamp experiments. The data were sampled at a rate of 10 kHz after filtering at 2 kHz.
Recordings of APs and Ij
Spontaneous APs were recorded simultaneously from specific pairs of neighboring body wall muscle cells without current injection. For recording Ij, the membrane voltage (Vm) of both cells was held at −30 mV, from which a series of voltage steps (−110 to +50 mV at 10-mV intervals and 250-ms duration) were applied to one cell (Cell 1), whereas the other cell (Cell 2) was held constant to record Ij. Junctional voltage (Vj) was defined as Vm of Cell 2 minus Vm of Cell 1.
Measurement of Coupling Coefficient
Negative currents of 1-s duration and various amplitudes (10, 20, and 30 pA) were injected into one cell, whereas the membrane voltage changes in response to the current injections were recorded from both the injected cell and a neighboring muscle cell.
Recording of Postsynaptic Currents
Spontaneous postsynaptic currents (referred to as “minis”) were recorded from wild-type worms, whereas evoked inhibitory postsynaptic currents (IPSCs) were recorded from an integrated transgenic strain expressing mCherry-tagged channel rhodopsin-2 in GABAergic neurons under the control of unc-47 (vesicular GABA transporter) promoter (35) at a holding potential of −10 mV. IPSCs were evoked by applying a pulse (3 ms) of blue light using a 470 ± 20-nm excitation filter (filter 59222; Chroma Technology Corp.) and a light source equipped with a shutter (Lambda XL with SmartShutter; Sutter Instrument) (36).
Solutions and Chemicals
The standard extracellular solution contained 140 mm NaCl, 5 mm KCl, 5 mm CaCl2, 5 mm MgCl2, 11 mm dextrose, and 5 mm HEPES (pH 7.2). The standard pipette solution contained 120 mm KCl, 20 mm KOH, 5 mm Tris, 0.25 mm CaCl2, 4 mm MgCl2, 36 mm sucrose, 5 mm EGTA, and 4 mm Na2ATP (pH 7.2). In the experiments analyzing the effects of gabazine on minis and IPSCs, the standard pipette solution was modified by substituting 113.2 mm KCl with equal molar potassium gluconate. In the experiments analyzing the effects of TBC and gabazine on APs, the extracellular solution contained 150 mm NaCl, 5 mm KCl, 5 mm CaCl2, 1 mm MgCl2, 10 mm dextrose, 5 mm sucrose, and 15 mm HEPES (pH 7.2), and the pipette solution contained 25 mm KCl, 115 mm potassium gluconate, 5 mm MgCl2, 0.1 mm CaCl2, 1 mm K4BAPTA, 10 mm HEPES, 5 mm Na2ATP, 0.5 mm Na2GTP, 0.5 mm cAMP, and 0.5 mm cGMP (pH 7.2). The compositions of these two solutions were partially based on those used in a previous study (29). TBC (T2397; Sigma-Aldrich) and gabazine (S106; Sigma-Aldrich) were dissolved in the extracellular solution to make frozen stocks and added to the recording chamber by pipetting after diluting with the extracellular solution.
Ca2+ Imaging
An integrated Pmyo-3::GCaMP2 transgene (28) was crossed into different mutant backgrounds. The worms were glued and filleted to image spontaneous fluorescence changes of GCaMP2 in body wall muscle cells using an electron-multiplying CCD camera (iXonEM+885; Andor Technology, Belfast, Northern Ireland), a FITC filter (59222; Chroma Technology Corp., Bellows Falls, VT), a light source (Lambda XL; Sutter Instrument, Novato, CA), and the NIS-Elements software (Nikon). The images were acquired at 16 frames/s with 10–40 ms of exposure time (no binning) for 4 or 5 min. The bath solution used in these experiments was the standard extracellular solution.
RNA Interference
Based on an established method (37), a portion (1–397 bp) of the unc-9 cDNA (R12H7.1, www.wormbase.org) was cloned into a worm expression vector containing the muscle-specific myo-3 promoter (pPD118.20) in both the sense and antisense directions to generate two separate worm expression plasmids: Pmyo-3::unc-9(1–397 sense) (wp872) and Pmyo-3::unc-9(1–397 antisense) (wp873). The two plasmids were coinjected into the wild type together with a Pmyo-2::DsRED plasmid (wp568), which served as a transformation marker, to generate a transgenic strain for analyzing the effects of unc-9 RNAi on APs, Gj, and Ca2+ transients. The transgene was also crossed into a wild-type strain expressing Pmyo-3::UNC-9::GFP (27) to verify the effectiveness of RNAi.
unc-9 Rescue
To rescue unc-9 defect specifically in muscle, a plasmid (wp223) with wild-type unc-9 cDNA downstream of the myo-3 myosin heavy chain promoter (Pmyo-3) (38) was expressed in unc-9(fc16) mutant following standard transgenic procedures (39). A plasmid containing Pmyo-3 and GFP cDNA (pPD118.20) was coinjected to serve as a transformation marker. Muscle cells showing GFP fluorescence were used for electrophysiological analyses. To determine the effect of muscle UNC-9 on Ca2+ transients, wp223 was injected into unc-9(fc16) mutant expressing the integrated Pmyo-3::GCaMP2 transgene, together with wp568 to serve as a transgenic marker.
Data Analyses
Analysis of APs
The peak times of the cell with a lower AP frequency were subtracted from those of the cell with a higher AP frequency. Two consecutive APs (one from each cell) with the shortest interpeak interval were assigned as a pair and used to calculate the peak time difference. APs that could not be assigned into pairs (because of the absence of events in the other cell) were excluded from the analysis.
Analysis of Ij
The averaged Ij traces from four runs of voltage steps were used for statistical analyses after filtering at 300 Hz. The apparent mean steady-state current during the last 100 ms of the voltage steps was determined with Clampfit (Molecular Devices) and used to plot the Ij-Vj relationship. Gj was determined from the slope of the Ij-Vj relationship at the liner portion (Vj = −30 to +30 mV) and compared among the different groups. Ij traces are displayed at 20-mV Vj intervals in figures for clarity, although the data were acquired and analyzed at 10-mV Vj intervals.
Analysis of Coupling Coefficient
The mean membrane voltage between 300 and 800 ms of each current injection step was quantified with Clampfit. The coupling coefficient was the ratio of the mean membrane voltage change of the uninjected cell over that of the injected cell at each current injection step.
Analysis of Ca2+ Imaging Data
To determine whether Ca2+ transients were synchronous among neighboring cells, all of the muscle cells with Ca2+ transients within the camera imaging field (typically around 10 cells) were assigned as separate regions of interest. The fluorescence intensities in the regions of interest over successive frames were first plotted as absolute fluorescence intensity over time using the NIS-Elements software and then converted to F/F0 using the MATLAB software (The MathWorks, Inc., Natick, MA) running a custom module. The Ca2+ transient traces (F/F0 over time) of all the cells within the camera imaging field were visually inspected to determine whether or not the events were synchronous. Cells without Ca2+ transients (e.g. some cells in unc-9 and/or unc-1 mutants) were excluded from analysis. The frequency, amplitude, and area of Ca2+ transients were first determined separately for all the cells with Ca2+ transients within the camera imaging field and then averaged.
Analysis of Minis and IPSCs
The frequency of mPSCs was determined using MiniAnalysis (Synaptosoft, Decatur, GA) from an uninterrupted trace of 15 s before and 15 s after the application of gabazine. A detection threshold of 10 pA was used in initial automatic analysis, followed by visual inspections to include missed events (≥5 pA) and to exclude false events resulting from baseline fluctuations. The peak amplitudes of IPSCs were measured with Clampfit. Three consecutive IPSCs immediately before gabazine and three immediately after the application of gabazine were averaged separately.
Data Graphing and Statistical Analyses
Data graphing and statistical analyses were performed with OriginPro (version 8.5; OriginLab Corporation, Northampton, MA). Either paired t test or one-way ANOVA with Bonferroni post hoc test, as specified in the figure legends, were used for comparing the means. The data are shown as the means ± S.E. p < 0.05 is considered to be statistically significant. The sample size (n) is equal to the number of cell pairs (for APs, Ij and the coupling coefficient), cells (for minis and IPSCs), or worm preparations (for Ca2+ transients).
RESULTS
AP Synchrony Occurred among Selected Neighboring Cells and Was Related to the Strength of Electrical Coupling
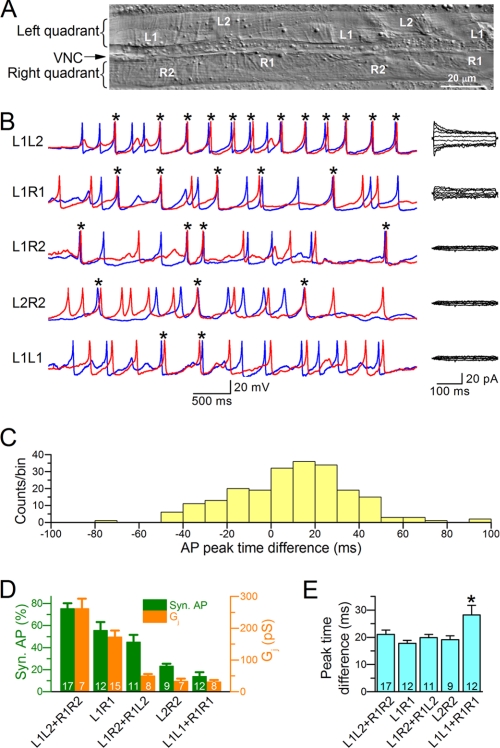
We first determined whether APs were synchronous in neighboring muscle cells and whether AP synchrony was related to Gj by performing current and voltage clamp experiments for various pairs of contacting muscle cells. The analyzed pairs of contacting muscle cells included L1L2, R1R2, L1R1, L1R2, R1L2, L2R2, L1L1, and R1R1 (Fig. 1A). Among them, data from six pairs were pooled into three groups: L1L2+R1R2, L1R2+R1L2, and L1L1+R1R1, because the two pairs within each pooled group have analogous anatomical locations and are indistinguishable in functional properties. Sample traces of APs and Ij from the different cell pairs are shown in Fig. 1B. Two APs were considered to be synchronous if the time difference between their peaks was ≤50 ms. This criterion was used because the majority of the events were within ± 50 ms when the AP peak times of one cell are subtracted from those of the other cell in the L1L2 and R1R2 pairs (Fig. 1C), which had the highest Gj, and because the probability for the peak time difference to occur within ± 50 ms by random chance was reasonably low, ∼17% ((2 × 50)/600 = 16.7%) based on the mean interspike interval of 600 ms in wild-type worms (28).
FIGURE 1.
The percentage of synchronous APs corresponded to the level of junctional conductance (Gj). A, photo of a filleted wild-type worm showing the two ventral quadrants of body wall muscle cells and the ventral nerve cord (VNC) between them. Muscle cells in the right quadrant are designated as R1 and R2, whereas those in the left quadrant are designated as L1 and L2. B, representative traces of APs (left panel) and junctional currents (right panel) recorded from various pairs of body wall muscle cells. The red and blue traces show temporal correlation between APs from the two cells in each pair. The asterisks indicate synchronized APs (≤50 ms in peak time difference). C, distribution of peak time differences for consecutive APs recorded from the L1L2 and R1R2 pairs. D, percentages of synchronous AP and levels of Gj in different pairs of muscle cells. E, the mean peak time difference for synchronous APs in different pairs of muscle cells. Several columns (e.g. L1L2+R1R2) represent pooled data of two different pairs of muscle cells because the two cell pairs have analogous anatomical locations and are indistinguishable in functional properties. The asterisk indicates a significant difference compared with the other groups (p < 0.05, one-way ANOVA with Bonferroni post hoc test). In both D and E, the data are shown as the means ± S.E., and the number of cell pairs analyzed is indicated inside the column.
The percentage of synchronized APs varied among the different pairs of muscle cells with the mean value being 75% in L1L2 and R1R2, 55% in L1R1, 44% in L1R2 and R1L2, 23% in L2-R2, and 13% in L1L1 and R1R1 (Fig. 1D). The value for the L1L1 and R1R1 pairs was close to that estimated for pure chance (17%), which is consistent with the fact that Gj was very low in this pair of cells. A larger percentage of synchronous APs generally corresponded to a higher Gj (Fig. 1D). Subsequent analyses of AP synchronization and Gj were performed only with the L1L2 and R1R2 pairs because their higher Gj and AP synchrony made the analyses more reliable.
We also calculated the mean peak time difference for synchronous APs. The difference was ∼20 ms in all except for the L1L1 and R1R1 pairs, which showed a significantly larger peak time difference (Fig. 1E). It is not immediately obvious what underlay the larger time difference in this pair.
Muscle Cell APs Were Mostly Asynchronous in unc-9 and unc-1 Mutants
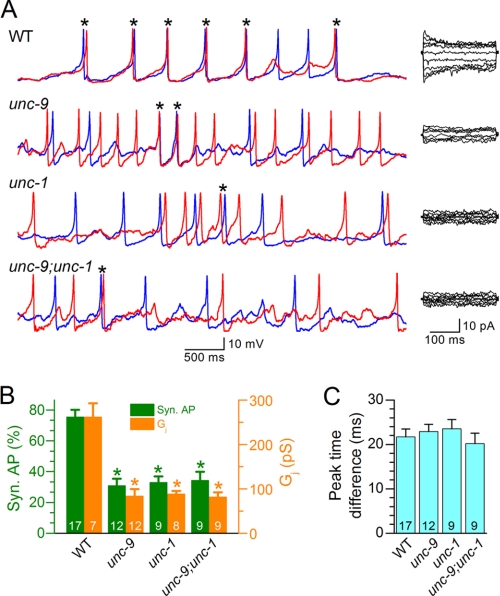
In C. elegans body wall muscle cells, electrical coupling is mainly mediated by gap junctions formed by the innexin UNC-9 (7). To further assess the role of electrical coupling in AP synchronization, we compared the percentage of synchronous APs and the level of Gj in the L1L2 and R1R2 pairs between the wild type and a putative unc-9 null mutant, unc-9(fc16) (40). The proportion of synchronous APs was 60% lower in the mutant, which was accompanied by a decrease of the mean Gj to a comparable degree (Fig. 2, A and B). In contrast, the mean peak time difference for synchronous APs remained unchanged in the mutant (Fig. 2C). These observations suggest that gap junctions formed by UNC-9 play important roles in synchronizing muscle APs.
FIGURE 2.
Action potential synchrony and junctional conductance were compromised in unc-9 and unc-1 mutants. APs and junctional currents were recorded from the L1L2 and R1R2 pairs of muscle cells of unc-9(fc16), unc-1(e719), and the double mutant unc-9(fc16);unc-1(e719). The data were compared with the same WT data shown in Fig. 1. A, representative traces of APs (left panel) and junctional currents (right panel) from the WT and mutant worms. The red and blue traces show temporal correlation between APs from the two cells in each pair. B, percentages of synchronous APs and levels of junctional conductance (Gj) in different groups. The asterisk indicates a significant difference compared with the corresponding WT data (p < 0.01, one-way ANOVA with Bonferroni post hoc test). C, the peak time difference for synchronous APs among the different groups. In both B and C, the data are shown as the means ± S.E., and the number of cell pairs analyzed is indicated inside the column.
We previously reported that the function of UNC-9-based gap junctions depends on the stomatin-like protein UNC-1 (27). To test whether UNC-1 also plays a role in synchronizing muscle APs, we analyzed APs and Ij in the putative null mutant unc-1(e719) (41) and the double mutant unc-9(fc16);unc-1(e719). We found that both the unc-1 single mutant and the unc-9;unc-1 double mutant similarly affected muscle APs and Gj, as did unc-9 mutant (Fig. 2, A and B), which further supports that UNC-9 gap junctions are important to muscle synchrony.
We also tested the effects of carbenoxolone (50 μm) and probenecid (100 μm) on Gj of the L1L2 and R1R2 pairs in wild-type worms. Carbenoxolone is a nonspecific gap junction blocker (42), whereas probenecid blocks channels formed by pannexin 1 (43), which is a homologue of invertebrate innexins. However, neither chemical showed an inhibitory effect on the Gj (supplemental Fig. S1). Therefore, they were not used for assessing the role of gap junctions in muscle synchrony.
Coupling Coefficient between Neighboring Muscle Cells Was Decreased in unc-9 and unc-1 Mutants
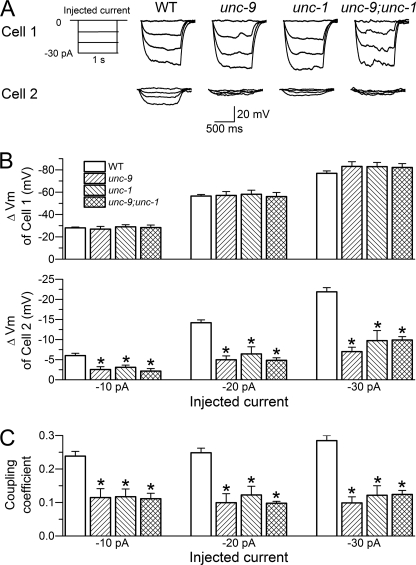
The correlation between synchronous AP and Gj in wild-type and mutant worms suggests that changes in the membrane potential of one cell may alter that of the neighboring cells through gap junctions. To confirm this prediction, we determined the coupling coefficient between two contacting cells of the L1L2 and R1R2 pairs in the wild type, unc-9(fc16), unc-1(e719), and the double mutant unc-9(fc16);unc-1(e719). Currents were injected into one cell of the pair (−10 to −30 pA at 10-pA intervals, 1-s duration), whereas membrane voltage changes were monitored in both cells. The coupling coefficient was the ratio of membrane voltage change of the noninjected cell over that of the injected cell. Positive current pulses were not used to avoid complications by APs.
In response to current injections, the injected cell (Cell 1) showed similar voltage changes in wild-type and mutant worms, whereas the uninjected cell (Cell 2) showed significantly larger voltage change in the wild type than any of the mutants, among which there was no difference (Fig. 3, A and B). The coupling coefficient was 0.25 in wild-type worms but ∼0.1 in the various mutants (Fig. 3C). Thus, membrane voltage change of one muscle cell may affect that of the neighboring cells through gap junctions; and both UNC-9 and UNC-1 are important in allowing this to occur.
FIGURE 3.
Coupling coefficient was greatly decreased in unc-9 and unc-1 mutants compared with the wild type. The mutants analyzed were unc-9(fc16), unc-1(e719), and the double mutant unc-9(fc16);unc-1(e719). Negative currents were injected into one muscle cell, whereas membrane voltage changes in response to the current injections were measured in both the injected cell (Cell 1) and a contacting neighboring cell (Cell 2) of the L1L2 or R1R2 pair. A, diagram of the current injection steps (left panel) and representative membrane voltage traces (right panel). B, membrane voltage changes (ΔVm) in response to the current injections in Cell 1 and Cell 2. C, the coupling coefficient (the ratio of ΔVm of Cell 2/ΔVm of Cell 1). In both B and C, the data are shown as the means ± S.E., and the asterisk indicates a significant difference compared with the WT (p < 0.01, one-way ANOVA with Bonferroni post hoc test). The number of cell pairs analyzed was 33 for WT, 13 for unc-9, 13 for unc-1, and 12 for the double mutant.
Inhibition of unc-9 Expression in Muscle Reduced the Synchrony of APs
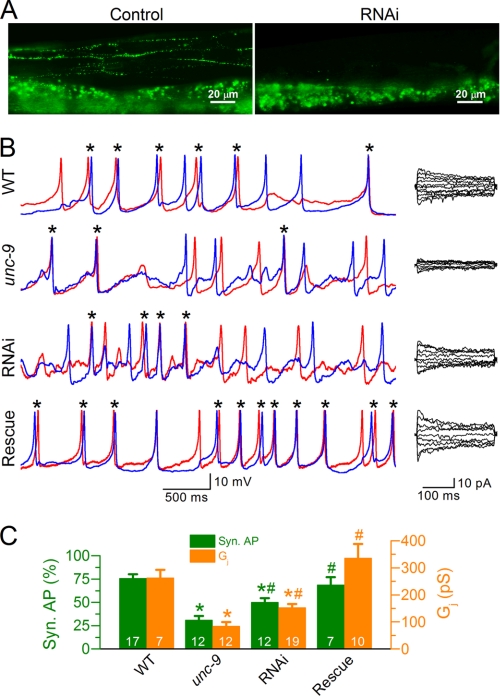
UNC-9 is expressed in muscle cells as well as many neurons, including command interneurons and ventral cord motoneurons (44). Therefore, UNC-9 deficiency in neurons might indirectly contribute to the changes of APs and Ca2+ transients observed in the unc-9 mutant. To assess the pure effect of muscle UNC-9 deficiency, we created transgenic worms in which unc-9 expression in muscle was selectively inhibited by RNAi. Furthermore, we performed muscle-specific rescue experiments by expressing wild-type UNC-9 in body wall muscle cells under the control of Pmyo-3. The RNAi was effective as indicated by the disappearance of fluorescent puncta at muscle intercellular junctions in a transgenic strain expressing an UNC-9::GFP fusion protein (Fig. 4A). Worms expressing the RNAi transgenes showed decreased Gj and AP synchrony in the L1L2 and R1R2 pairs compared with wild type, but the changes were less severe than those observed in the unc-9 mutant (Fig. 4, B and C). The Gj and AP synchrony defects of unc-9(fc16) were rescued by expressing wild-type UNC-9 specifically in muscle (Fig. 4, B and C). These observations suggest that deficiency of UNC-9 gap junctions in muscle alone was sufficient to reduce AP synchrony and that UNC-9 functioned cell-autonomously in facilitating the muscle synchrony.
FIGURE 4.
UNC-9 deficiency in muscle was responsible for reduced junctional conductance and action potential synchrony in unc-9 mutant. A, unc-9 RNAi inhibited the expression of GFP-tagged UNC-9 in body wall muscle cells (the punctate expression in the top portion of the left panel). The broad fluorescent signal at the bottom of both panels resulted from autofluorescence of the gut. B, sample traces of APs and junctional currents from the WT, unc-9(fc16), unc-9 RNAi worms, and unc-9(fc16) with muscle specific rescue. The red and blue traces show temporal correlation between APs from the two cells in each pair. C, comparison of junctional conductance (Gj) and the percentage of synchronous APs. The asterisk indicates a significant difference compared with WT (p < 0.01), whereas the pound sign indicates a significant difference compared with unc-9 (p < 0.05 for AP and p < 0.01 for Gj, one-way ANOVA with Bonferroni post hoc test). In C, the data are shown as the means ± S.E., and the number of cell pairs analyzed is indicated inside the column. The WT and unc-9 data are the same as those shown in Fig. 2.
Ca2+ Transients Were Synchronous in Wild Type but Asynchronous in unc-9 and unc-1 Mutants
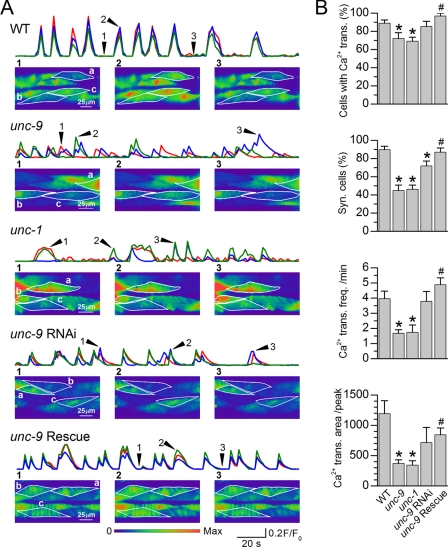
C. elegans body wall muscle generates Ca2+ transients that may be detected by imaging fluorescence changes of the Ca2+-sensitive protein GCaMP2 expressed in vivo (28). To further assess the role of gap junctions in synchronizing muscle activities, we imaged muscle Ca2+ transients in wild-type worms, unc-9(fc16), unc-1(e719), the unc-9 RNAi worms, and unc-9(fc16) with muscle-specific rescue. We found that Ca2+ transients were highly synchronous among neighboring muscle cells in the wild type but frequently asynchronous in the unc-9 and unc-1 mutants (Fig. 5A and supplemental Movies S1–S3). Ca2+ transients in unc-9 RNAi worms were only slightly less asynchronous compared with the wild type (Fig. 5B and supplemental Movie S4). Besides the reduced synchrony, Ca2+ transients were also observed in fewer cells, at lower frequency and with smaller area (F/F0 × time) in the unc-9 and unc-1 mutants compared with the wild type (Fig. 5). Expressing of wild-type UNC-9 specifically in muscle rescued essentially all of the abnormalities of Ca2+ transients (Fig. 5 and supplemental Movie S5). These observations suggest that UNC-9 gap junctions play important roles in synchronizing muscle Ca2+ transients.
FIGURE 5.
Ca2+ transient synchrony was compromised in unc-9 mutant, unc-1 mutant, and unc-9 RNAi worms. A, representative Ca2+ transients of the WT, unc-9(fc16), unc-1(e719), worms with muscle unc-9 expression inhibited by RNAi, and unc-9(fc16) rescued by expressing wild-type UNC-9 specifically in muscle. Ca2+ transients (F/F0) of three selected cells are plotted (red trace for Cell a, blue trace for Cell b, and green trace for Cell c). The arrowheads and numbers in the Ca2+ transient traces indicate the time points of the imagines shown below. Movies of these representative experiments may be found in the supplemental materials (supplemental Movies S1–S5). B, comparisons of Ca2+ transient properties. The data are shown as the means ± S.E. The asterisk indicates a significant difference compared with WT, whereas the pound sign indicates a significant difference compared with unc-9 (p < 0.01, one-way ANOVA with Bonferroni post hoc test). The number of worms analyzed was 21 WT, 17 unc-9, 15 unc-1, 13 unc-9 RNAi, and 11 unc-9 rescue. trans., transient; syn., synchronous; freq., frequency.
Blocking Neuromuscular Transmission Did Not Affect AP and Ca2+ Transient Synchrony but Reduced Ca2+ Transient Amplitudes
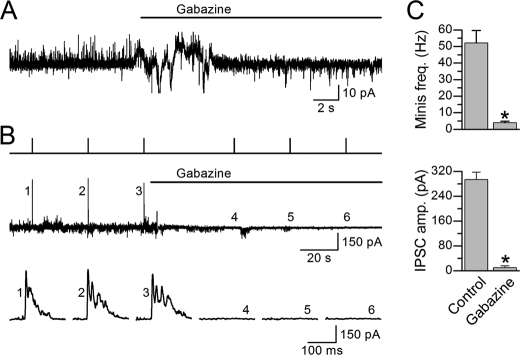
To determine whether neural inputs are important to the synchrony of muscle APs and Ca2+ transients, we decided to analyze the effects of acetylcholine and GABA receptor blockers on muscle APs and Ca2+ transients. This pharmacological approach was chosen over the use of receptor mutants to avoid complications by potential developmental defects. To block muscle ionotropic acetylcholine receptors, we used TBC at 0.5 mm because it could block cholinergic postsynaptic currents in C. elegans body wall muscle completely (34, 45). To block muscle GABAA receptors, we used the allosteric GABAA receptor inhibitor gabazine (SR-95531) (46, 47) at 0.5 mm because we found that it could abolish evoked as well as spontaneous postsynaptic currents caused by GABA release in C. elegans body wall muscle (Fig. 6).
FIGURE 6.
Gabazine blocked muscle GABAA receptors. A, a representative experiment showing the effect of gabazine (0.5 mm) on spontaneous postsynaptic currents (“minis”) mediated by GABAA receptors (upward events). B, a representative experiment showing the effect of gabazine (0.5 mm) on photo-evoked IPSCs in a worm expressing channelrhodopsin-2 in GABAergic neurons. The traces from top to bottom are light pulses, postsynaptic currents including IPSCs at a longer time scale, and the IPSCs at a shorter time scale. C, comparisons of the effects of gabazine on the frequency of “minis” and amplitude of IPSCs. The asterisk indicates a significant difference (p < 0.01, paired t test) compared with the control (before gabazine treatment). The data are shown as the means ± S.E. Minis and IPSCs were recorded from six and eight muscle cells, respectively.
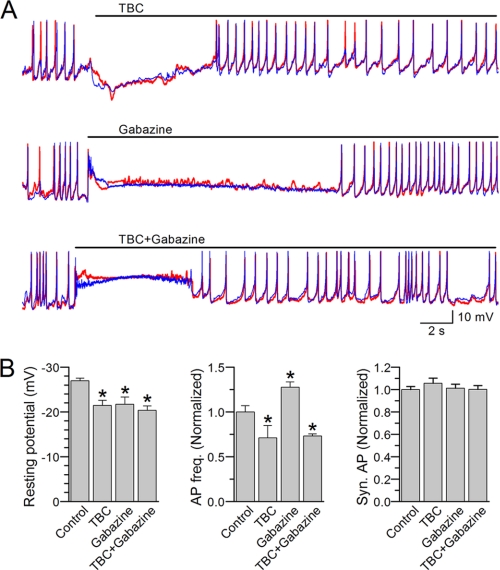
There was a short period of membrane hyperpolarization following TBC but depolarization following either gabazine alone or gabazine with TBC. Both the hyperpolarization and depolarization caused a temporary disappearance of APs. These observations suggest that cholinergic and GABAerigic motoneurons tonically regulate the resting membrane potential and AP firing. The resting membrane potential recovered gradually, and the muscle cell resumed firing APs. Although AP frequency increased following gabazine but decreased following either TBC alone or TBC with gabazine, none of these treatments compromised the synchrony of APs (Fig. 7), suggesting that the synchrony of APs does not depend on synaptic transmission.
FIGURE 7.
Action potentials remained synchronous after blocking acetylcholine and/or GABAA receptors. APs were recorded from the L1L2 and R1R2 pairs. A, representative AP traces showing the effects of (+)-tubocurarine (TBC, 0.5 mm) and/or gabazine (0.5 mm). The red and blue traces show temporal correlation between APs from the two cells in each pair. B, effects the various treatments on the resting membrane potential, AP frequency, and AP synchrony. Comparisons were made between the control period (before the treatment) and during the treatment period with the asterisk indicating a significant difference (p < 0.05, paired t test). AP frequency and synchrony percentage were subsequently normalized by values of the control period and displayed in the bar graphs. The data are shown as the means ± S.E. The numbers of cell pairs analyzed were five for TBC, six for gabazine, and five for TBC plus gabazine. The control in the graphs represents pooled data.
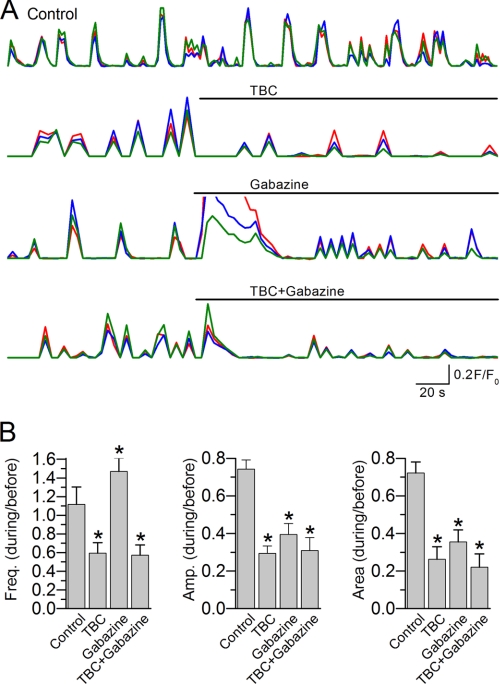
We also analyzed the effects of the receptor blockers on muscle Ca2+ transients, which were imaged continuously for 5 min with TBC (0.5 mm) and/or gabazine (0.5 mm) added at the beginning of the third minute. We measured the frequency, mean amplitude, and integrated area (F/F0 × time/min) of Ca2+ transients for the first and last 2 min of the recordings and calculated the ratios of post- over pretreatment for these parameters. The data of the third minute were excluded from the analysis to avoid complications by the transient changes of the resting membrane potential described above. Because the amplitude and area of Ca2+ transients tended to decrease over time, a control group was included and similarly analyzed to account for the time-dependent effects. We found that Ca2+ transients remained synchronous after adding TBC and/or gabazine (Fig. 8A and supplemental Movies S6–S9). Compared with the control group, the frequency of Ca2+ transients was increased following the application of gabazine but decreased following either TBC alone or TBC with gabazine. Treatment with TBC abolished Ca2+ transients in some cases (two of 12 with TBC alone and three of 12 with TBC plus gabazine), which were excluded from further analysis. Both the mean amplitude and integrated area of Ca2+ transients were reduced by all of the receptor blockers (Fig. 8B). These observations suggest that synaptic transmission is not essential to the synchrony of Ca2+ transients but may regulate their frequencies and amplitudes.
FIGURE 8.
Ca2+ transients remained synchronous after blocking acetylcholine and/or GABAA receptors. APs were recorded from the L1L2 and R1R2 pairs. A, representative traces of Ca2+ transients (F/F0) from a control worm and worms treated with TBC (0.5 mm) and/or gabazine (0.5 mm). The colored traces show temporal correlation of Ca2+ transients in three randomly selected cells within the camera imaging field. Movies matching these experiments are provided in the supplemental materials (supplemental Movies S6–S9). B, the frequency, mean amplitude, and area (F/F0 × time) of Ca2+ transients are shown as ratios of the values (during/before the treatment). The asterisk indicates a significant difference compared with the control group (p < 0.05, one-way ANOVA with Bonferroni post hoc tests). The data are shown as the means ± S.E. The sample number was 8 for Control, 10 for TBC, 12 for gabazine, and 9 for TBC plus gabazine.
DISCUSSION
Analysis of AP synchrony is a powerful approach for assessing whether neighboring cells are electrically synchronous. We found that the percentage of synchronous APs was generally related to the level of Gj among various pairs of muscle cells in wild-type worms; both Gj and synchronous APs were decreased in mutants of unc-9 and/or unc-1 and in worms with muscle unc-9 expression partially inhibited by RNAi; and Ca2+ transients were often asynchronous in unc-9 and unc-1 mutants. These observations provide compelling evidence that muscle gap junctions play a pivotal role in synchronizing muscle activities.
C. elegans body wall muscle is innervated by cholinergic and GABAergic motoneurons, which contract and relax the muscle, respectively. The frequencies of APs and Ca2+ transients increased after blocking GABAA receptors but decreased after blocking acetylcholine receptors, which is consistent with the physiological functions of the two different receptors and indicates that both cholinergic and GABAergic neuromuscular transmissions occurred under our experimental conditions. Nevertheless, APs and Ca2+ transients remained synchronous after blocking acetylcholine receptors and/or GABAA receptors, suggesting that neural inputs did not play an essential role in synchronizing muscle activities.
Our analyses of Ij and Gj showed that the coupling strength varied among different pairs of neighboring muscle cells in the wild type and was greatly decreased in unc-9 and/or unc-1 mutants, which are similar to what we reported previously (7, 27). We previously concluded that Ij is likely of physiological significance in C. elegans body wall muscle based on the observation that injection of currents comparable with the Ij into a muscle cell caused significant depolarization of the injected cell. In the present study, we analyzed the coupling coefficient and found that injection of currents into one muscle cell caused membrane voltage changes in neighboring noninjected cells and that this effect was greatly attenuated in unc-9 and/or unc-1 mutants. These observations provide more direct evidence for the physiological significance of the Ij. The desynchronization of APs and Ca2+ transients in unc-9 and/or unc-1 mutants lends further support to the physiological importance of electrical coupling. The existence of significant Gj in the unc-9 mutant suggests that there are other innexin(s) functioning in C. elegans body wall muscle. Therefore, the asynchrony of APs and Ca2+ transients is likely to be more severe in the complete absence of muscle electrical coupling.
UNC-1 is a homologue of human stomatin. Loss-of-function mutants of unc-1 and unc-9 have similar phenotypes, including locomotion defects and altered sensitivity to volatile anesthetics (41, 48–50). Our previous study (27) suggests that UNC-9 requires UNC-1 to form functional gap junctions in vivo and that UNC-1 probably modulates the gating of the gap junctions. Our observations with the unc-1 mutant in the present study reinforce the notion that UNC-9 and UNC-1 coassemble into functional gap junctions (27, 51).
In wild-type worms, Ca2+ transients appeared to be synchronous in all of the muscle cells within the camera imaging field. In contrast, AP synchrony was only observed in specific pairs of contacting neighboring cells. The apparent disparity mainly resulted from a difference in the time resolutions used to measure these two parameters. Although synchronous APs were defined as two events occurring within 50 ms, Ca2+ transients lasted for several seconds, which is similar to those of the Ca2+ transients in motoneurons of immobilized C. elegans (52).
C. elegans body wall muscle constitutes a key component in the locomotory system. However, it is unclear whether it has other functions in locomotion beyond contracting and relaxing in response to neurotransmitters. Current models regarding C. elegans locomotion mostly focus on the roles of neurons in locomotion with relatively little mention of the body wall muscle (1, 2, 13, 30–32), which was partly due to the lack of knowledge on the electrical properties of C. elegans body wall muscle. Earlier electrophysiological data and mathematical modeling led to the conclusion that C. elegans body wall muscle cells function as simple actuators and generate only graded membrane potential changes (14, 53). However, more recent studies show that C. elegans body wall muscle cells actually fire all-or-none APs (28, 29). Firing of APs occurs even in the absence of neural inputs (28), which is consistent with the persistence of some locomotory activities in worms with acetylcholine and GABA receptors genetically ablated (9, 10). Thus, C. elegans body wall muscle appears to be able to produce at least some primitive locomotion in the absence of neural inputs. The data of the present study could potentially be used in helping construct more accurate models of C. elegans locomotion.
Supplementary Material
Acknowledgments
We thank Erik Jorgensen for a Punc-47::ChR2::mCherry strain and the Caenorhabditis Genetics Center for the unc-9 and unc-1 mutants.
This work was supported, in whole or in part, by National Institutes of Health Grants 5R01GM083049 and 1R01MH085927 (to Z.-W. W.).

The on-line version of this article (available at http://www.jbc.org) contains supplemental Movies S1–S9 and Fig. S1.
- AP
- action potential
- IPSC
- inhibitory postsynaptic current
- minis
- spontaneous postsynaptic currents
- Pmyo-3
- promoter of the myosin heavy chain gene myo-3
- TBC
- (+)-tubocurarine
- ANOVA
- analysis of variance.
REFERENCES
- 1. Goodman M. B. (2006) WormBook, The C. elegans Research Community, WormBook, doi/ 10.1895/wormbook. 1.62.1, http://www.wormbook.org [DOI]
- 2. de Bono M., Maricq A. V. (2005) Annu. Rev. Neurosci. 28, 451–501 [DOI] [PubMed] [Google Scholar]
- 3. Chalfie M., White J. (1988) in The Nematode Caenorhabditis elegans (Wood W. B., and the Community of C. elegans Researchers, eds.) pp. 337–391, Cold Spring Harbor Laboratory, Cold Spring Harbor, NY [Google Scholar]
- 4. White J. G., Southgate E., Thomson J. N., Brenner S. (1976) Philos. Trans. R. Soc. Lond. B Biol. Sci. 275, 327–348 [DOI] [PubMed] [Google Scholar]
- 5. Liu Q., Chen B., Hall D. H., Wang Z. W. (2007) Dev. Neurobiol. 67, 123–128 [DOI] [PubMed] [Google Scholar]
- 6. White J. G., Southgate E., Thomson J. N., Brenner S. (1986) Philos. Trans. R. Soc. Lond. B Biol. Sci. 314, 1–340 [DOI] [PubMed] [Google Scholar]
- 7. Liu Q., Chen B., Gaier E., Joshi J., Wang Z. W. (2006) J. Biol. Chem. 281, 7881–7889 [DOI] [PubMed] [Google Scholar]
- 8. Lewis J. A., Wu C. H., Berg H., Levine J. H. (1980) Genetics 95, 905–928 [DOI] [PMC free article] [PubMed] [Google Scholar]
- 9. Francis M. M., Evans S. P., Jensen M., Madsen D. M., Mancuso J., Norman K. R., Maricq A. V. (2005) Neuron 46, 581–594 [DOI] [PubMed] [Google Scholar]
- 10. Touroutine D., Fox R. M., Von Stetina S. E., Burdina A., Miller D. M., 3rd, Richmond J. E. (2005) J. Biol. Chem. 280, 27013–27021 [DOI] [PubMed] [Google Scholar]
- 11. McIntire S. L., Jorgensen E., Horvitz H. R. (1993) Nature 364, 334–337 [DOI] [PubMed] [Google Scholar]
- 12. Bamber B. A., Beg A. A., Twyman R. E., Jorgensen E. M. (1999) J. Neurosci. 19, 5348–5359 [DOI] [PMC free article] [PubMed] [Google Scholar]
- 13. Karbowski J., Schindelman G., Cronin C. J., Seah A., Sternberg P. W. (2008) J. Comput. Neurosci. 24, 253–276 [DOI] [PubMed] [Google Scholar]
- 14. Boyle J. H., Cohen N. (2008) Biosystems 94, 170–181 [DOI] [PubMed] [Google Scholar]
- 15. Debell J. T., Delcastillo J., Sanchez V. (1963) J. Cell. Physiol. 62, 159–177 [DOI] [PubMed] [Google Scholar]
- 16. Weisblat D. A., Russell R. L. (1976) J. Comp. Physiol. 107, 293–307 [Google Scholar]
- 17. Buzsáki G., Draguhn A. (2004) Science 304, 1926–1929 [DOI] [PubMed] [Google Scholar]
- 18. Zhang Y., Perez Velazquez J. L., Tian G. F., Wu C. P., Skinner F. K., Carlen P. L., Zhang L. (1998) J. Neurosci. 18, 9256–9268 [DOI] [PMC free article] [PubMed] [Google Scholar]
- 19. Beierlein M., Gibson J. R., Connors B. W. (2000) Nat. Neurosci. 3, 904–910 [DOI] [PubMed] [Google Scholar]
- 20. Galarreta M., Hestrin S. (2001) Nat. Rev. Neurosci. 2, 425–433 [DOI] [PubMed] [Google Scholar]
- 21. Deans M. R., Gibson J. R., Sellitto C., Connors B. W., Paul D. L. (2001) Neuron 31, 477–485 [DOI] [PubMed] [Google Scholar]
- 22. Galarreta M., Hestrin S. (1999) Nature 402, 72–75 [DOI] [PubMed] [Google Scholar]
- 23. Whittington M. A., Traub R. D., Jefferys J. G. (1995) Nature 373, 612–615 [DOI] [PubMed] [Google Scholar]
- 24. Gibson J. R., Beierlein M., Connors B. W. (1999) Nature 402, 75–79 [DOI] [PubMed] [Google Scholar]
- 25. Hormuzdi S. G., Pais I., LeBeau F. E., Towers S. K., Rozov A., Buhl E. H., Whittington M. A., Monyer H. (2001) Neuron 31, 487–495 [DOI] [PubMed] [Google Scholar]
- 26. Phelan P. (2005) Biochim. Biophys. Acta 1711, 225–245 [DOI] [PubMed] [Google Scholar]
- 27. Chen B., Liu Q., Ge Q., Xie J., Wang Z. W. (2007) Curr. Biol. 17, 1334–1339 [DOI] [PMC free article] [PubMed] [Google Scholar]
- 28. Liu P., Ge Q., Chen B., Salkoff L., Kotlikoff M. I., Wang Z. W. (2011) J. Physiol. 589, 101–117 [DOI] [PMC free article] [PubMed] [Google Scholar]
- 29. Gao S., Zhen M. (2011) Proc. Natl. Acad. Sci. U.S.A. 108, 2557–2562 [DOI] [PMC free article] [PubMed] [Google Scholar]
- 30. Bryden J., Cohen N. (2008) Biol. Cybern 98, 339–351 [DOI] [PubMed] [Google Scholar]
- 31. Zhou B., Baek J. (2009) Conf Proc IEEE Eng. Med. Biol. Soc. 2009, 4937–4940 [DOI] [PubMed] [Google Scholar]
- 32. Hobert O. (2003) J. Neurobiol. 54, 203–223 [DOI] [PubMed] [Google Scholar]
- 33. Wang Z. W., Saifee O., Nonet M. L., Salkoff L. (2001) Neuron 32, 867–881 [DOI] [PubMed] [Google Scholar]
- 34. Richmond J. E., Jorgensen E. M. (1999) Nat. Neurosci. 2, 791–797 [DOI] [PMC free article] [PubMed] [Google Scholar]
- 35. Liu Q., Hollopeter G., Jorgensen E. M. (2009) Proc. Natl. Acad. Sci. U.S.A. 106, 10823–10828 [DOI] [PMC free article] [PubMed] [Google Scholar]
- 36. Chen B., Liu P., Wang S. J., Ge Q., Zhan H., Mohler W. A., Wang Z. W. (2010) EMBO J. 29, 3184–3195 [DOI] [PMC free article] [PubMed] [Google Scholar]
- 37. Esposito G., Di Schiavi E., Bergamasco C., Bazzicalupo P. (2007) Gene 395, 170–176 [DOI] [PubMed] [Google Scholar]
- 38. Okkema P. G., Harrison S. W., Plunger V., Aryana A., Fire A. (1993) Genetics 135, 385–404 [DOI] [PMC free article] [PubMed] [Google Scholar]
- 39. Evans T. (2006) Transformation and Microinjection, WormBook, The C. elegans Research Community, doi/ 10.1895/wormbook. 1.108.1, http://www.wormbook.org [DOI]
- 40. Barnes T. M., Hekimi S. (1997) J. Neurochem. 69, 2251–2260 [DOI] [PubMed] [Google Scholar]
- 41. Rajaram S., Sedensky M. M., Morgan P. G. (1998) Proc. Natl. Acad. Sci. U.S.A. 95, 8761–8766 [DOI] [PMC free article] [PubMed] [Google Scholar]
- 42. Davidson J. S., Baumgarten I. M. (1988) J. Pharmacol. Exp. Ther. 246, 1104–1107 [PubMed] [Google Scholar]
- 43. Silverman W., Locovei S., Dahl G. (2008) Am. J. Physiol. Cell Physiol. 295, C761–C767 [DOI] [PMC free article] [PubMed] [Google Scholar]
- 44. Altun Z. F., Chen B., Wang Z. W., Hall D. H. (2009) Dev. Dyn. 238, 1936–1950 [DOI] [PMC free article] [PubMed] [Google Scholar]
- 45. Liu Q., Chen B., Yankova M., Morest D. K., Maryon E., Hand A. R., Nonet M. L., Wang Z. W. (2005) J. Neurosci. 25, 6745–6754 [DOI] [PMC free article] [PubMed] [Google Scholar]
- 46. Ueno S., Bracamontes J., Zorumski C., Weiss D. S., Steinbach J. H. (1997) J. Neurosci. 17, 625–634 [DOI] [PMC free article] [PubMed] [Google Scholar]
- 47. Wermuth C. G., Bizière K. (1986) Trends Pharmacol. Sci. 7, 421–424 [Google Scholar]
- 48. Brenner S. (1974) Genetics 77, 71–94 [DOI] [PMC free article] [PubMed] [Google Scholar]
- 49. Park E. C., Horvitz H. R. (1986) Genetics 113, 821–852 [DOI] [PMC free article] [PubMed] [Google Scholar]
- 50. Sedensky M. M., Meneely P. M. (1987) Science 236, 952–954 [DOI] [PubMed] [Google Scholar]
- 51. Norman K. R., Maricq A. V. (2007) Curr. Biol. 17, R812–814 [DOI] [PubMed] [Google Scholar]
- 52. Haspel G., O'Donovan M. J., Hart A. C. (2010) J. Neurosci. 30, 11151–11156 [DOI] [PMC free article] [PubMed] [Google Scholar]
- 53. Jospin M., Jacquemond V., Mariol M. C., Ségalat L., Allard B. (2002) J. Cell Biol. 159, 337–348 [DOI] [PMC free article] [PubMed] [Google Scholar]
Associated Data
This section collects any data citations, data availability statements, or supplementary materials included in this article.


