

Abstract
The lipidic cubic phase (LCP) has repeatedly proven to serve as a successful membrane-mimetic matrix for a variety of difficult-to-crystallize membrane proteins. While monoolein has been the predominant lipid of choice, there is a growing need for the characterization and use of other LCP host lipids, allowing exploration of a range of structural parameters such as bilayer thickness and curvature for optimal insertion, stability and crystallogenesis of membrane proteins. Here, we describe the development of a high-throughput (HT) pipeline to employ small angle X-ray scattering (SAXS) – the most direct technique to identify lipid mesophases and measure their structural parameters – to interrogate rapidly a large number of lipid samples under a variety of conditions, similar to those encountered during crystallization. Leveraging the identical setup format for LCP crystallization trials, this method allows the quickly assessment of lipid matrices for their utility in membrane protein crystallization, and could inform the tailoring of lipid and precipitant conditions to overcome specific crystallization challenges. As proof of concept, we present HT LCP-SAXS analysis of lipid samples made of monoolein with and without cholesterol, and of monovaccenin, equilibrated with solutions used for crystallization trials and LCP fluorescence recovery after photobleaching (FRAP) experiments.
Keywords: lipidic cubic phase, monoolein, phase behavior, SAXS
1. Introduction
Membrane proteins are essential components of living cells. They perform a variety of functions including transport of ions and nutrients, energy transformations and transduction of signals across the cell membrane. Involvement of membrane proteins in many crucial cellular and physiological processes and their location at the cell surface makes them important pharmaceutical drug targets. Obtaining structural information at atomic resolution for membrane proteins remains a formidable task. Crystallization in lipid mesophases (in meso) [1, 2] has proven successful in obtaining high-resolution structures of difficult membrane proteins, such as microbial rhodopsins [3], outer membrane proteins [4, 5], small peptides [6], enzymes [7] and G protein-coupled receptors [8-13]. It is amenable to both alpha-helical and beta-barrel integral membrane proteins. There is no apparent limit on the size of in meso crystallized membrane protein or complexes. Molecular weight of successful proteins and peptides ranges from 3.6 kDa (gramicidin D [6]) to ∼440 kDa (RC-LH1 complex [14]). Larger membrane proteins and complexes, however, require swollen cubic or sponge phases for crystallization [14, 15].
Monoolein is by far the most common lipid used to date for in meso applications [16, 17]. Its success can be rationalized partly by its availability and relatively low cost and partly by its ability to form robust cubic phases at room temperature, compatible with the addition of a wide range of soluble and amphiphilic additives [18, 19] and providing suitable bilayer thickness, comparable with the thickness of native membranes, for insertion of various membrane proteins. Although highly useful, monoolein is not a component of native membranes, and is easily hydrolysable at high and low pH. In addition, the cubic phase made of monoolein is not stable at temperatures below 18 °C [20] and has fairly large curvature and small diameter of the water channels, exerting stress on and preventing diffusion of large membrane proteins and complexes [21]. Furthermore, different membrane proteins may require cubic phases with different structural parameters such as bilayer thickness and curvature for optimal insertion, stability and crystallogenesis. Examples of successful rational design of lipids for in meso crystallization have been reported [22-24] and the advantages of screening different host lipids for membrane protein crystallization have recently been highlighted [25]. At the Joint Center for Innovations in Membrane Protein Technologies (JCIMPT) we are interested in addressing the need for additional lipids capable of forming cubic and sponge phases.
Knowledge of the lipid phase behavior and structural parameters of lipid mesophases in a variety of conditions is essential for designing in meso crystallization trials with novel lipids, or lipid-like and soluble additives. Small angle X-ray scattering (SAXS) is the most direct technique to determine the identity of lipid mesophase and its structural parameters. However, conventional methods for preparing lipid samples for SAXS, by mixing each individual sample separately and transferring them into X-ray capillaries [18, 19], are extremely tedious, time consuming and not amenable to analyzing large numbers of samples. Here, we demonstrate the use of our existing in meso crystallization robot [26] to prepare samples at many different conditions in modified 96-well sandwich plates [26, 27] and their measurement in situ at the BioSAXS beamline BL4-2 at the Stanford Synchrotron Radiation Lightsource (SSRL). The high intensity of the synchrotron beam is essential to enable fast data collection, allowing us to assess lipid phase behavior in hundreds of samples in a high-throughput manner at conditions closely mimicking crystallization trials. This method can be applied to the study of novel lipid matrices, providing highly important information for understanding their phase and structural behavior and their compatibility with in meso crystallization trials.
In this paper, we first present our methodology for the high-throughput characterization of lipid mesophases. Further, as proof of concept, we summarize HT LCP-SAXS data collected on samples prepared with monoolein (with and without 10% w/w cholesterol) and monovaccenin, equilibrated with various screen solutions used for fluorescence recovery after photobleaching (LCP-FRAP) studies [28] and crystallization trials.
2. Materials and Methods
2.1. Materials
Monoolein (MO, 356.54 g/mol) and monovaccenin (MV, 356.54 g/mol) were obtained from Nu-Chek Prep Inc. (Elysian, MN, USA), cholesterol (Ch, 386.65 g/mol) from Anatrace (Maumee, OH, USA), cholesteryl hemisuccinate, sodium citrate and PEG 400 from Sigma-Aldrich (St. Louis, MO, USA).
2.2. Screen compositions
Each plate was made with a single 96-well screen. The screens used were:
The Hampton Crystal Screen HT (Hampton Research, Aliso Viejo, CA) at full strength and two-fold dilution.
A citrate / polyethylene glycol 400 (PEG 400) screen, consisting of sodium citrate pH 6.0 (0 – 0.55 M in incremental steps of 0.05 M, across 12 columns) and PEG 400 (0, 20, 22, 24, 26, 28, 30 and 32%, in 8 rows).
A screen designed in our laboratory for HT LCP-FRAP studies [28]. This is a 96-condition screen containing 100 mM Tris pH 7 and 30 %v/v PEG 400 common to all wells, and each well containing one of 48 different salts from the Salt Stock Options kit (Hampton Research), in which sodium fluoride was removed and succinic acid was replaced with tacsimate, at two concentrations: 0.1 M (rows A – D) and 0.4 M (rows E – H).
Two replicates of each plate were dispensed in two screen orientations: forward (A1 → H12) and reverse (H12 → A1). This was done to improve completeness of data as well as to compare the effects, if any, on dehydration of early wells during the time it takes to dispense a plate (∼10 min). Typically, several drops were discarded per plate due to poor drop quality because of non-optimal dispensing of the LCP and/or screen solution, and/or poor diffraction due to drops shifted with respect to their recorded positions in the time period between optical imaging and SAXS data collection.
2.3. Preparation of SAXS samples
For preparation of SAXS samples we used our previously published design of 96-well glass sandwich crystallization plates [26, 27]. Instead of the glass slides, which do not transmit X-rays, we used 150 μm-thick plastic sheets with good X-ray transparency and low scattering, made of Cyclic Olefin Copolymer (COC) (TOPAS Advanced Polymers Inc, Florence, KY). Wells were defined on each plastic sheet by a 140 μm thick adhesive spacer (3M 9400PC) with 5 mm diameter holes, and the surface of each well was pretreated with 2 μl of 3M Novec EGC-1700 fluorochemical electronic coating liquid to render it hydrophobic. The plastic plates were mounted on untreated glass slides (127.8 mm × 85.5 mm × 1 mm; Paul Marienfeld GmbH & Co. KG, Germany), wetted with a drop of 50% glycerol solution, to provide support and maintain flatness required for sample dispensing and imaging. On Day 0, the LCP samples were prepared by mixing molten lipid with water in an appropriate ratio using a mechanical syringe mixer [29, 30]. The samples were then dispensed with an in meso crystallization robot [26] by delivering 50 nL boluses of the LCP and overlaying them with 0.8 μL of screening solutions, in a humidified 20-22 °C atmosphere. Relative humidity in the room was ∼50 %, and an additional humidification was achieved by directing a mist from an ultrasonic humidifier (Air-O-Swiss model 7135, Plaston International Corp, Naperville, IL, USA) to the vicinity of the plate, using two plastic tubings as described in Cherezov et al. [26]. The mist flow was adjusted to avoid direct condensation of water on the plate. Setting up each 96-well plate took ∼10 min, after which the plate was immediately sealed with a COC plastic sheet, and three fiducial “crosses” were painted with a fine-tip marker on top of wells A1, A12 and H1. Loaded plates were placed in an automatic incubator/imager RockImager 1000 (Formulatrix, Waltham, MA, USA), where they were incubated for at least 12 hours at 20 °C allowing all the components to equilibrate, and imaged in brightfield and cross-polarized modes. The RockImager software along with a customized script was used to locate the lipid drops in the images and to extract the coordinates of the drops centers. In addition, the coordinates of the fiducial points were obtained manually from the images containing them using the ImageJ software [31]. On Day 1, the plates were packed in zip-lock bags containing moist tissue paper (to reduce dehydration), placed in a pre-equilibrated at 20 °C ThermoSafe Greenbox (ThermoSafe Brands, Arlington Heights, IL, USA) and transported to SSRL. Temperature was monitored from the time of packing to the end of the experiment using an EL-USB-1 temperature data logger (Lascar Electronics Inc., Erie, PA, USA) placed in the box. Care was taken to minimize vibration to prevent movement of the drops inside the plates between initial imaging and SAXS data collection.
2.4. SAXS data collection
SAXS measurements were carried out on Days 2 and 3 at the Bio-SAXS beam line BL4-2 [32] using a slit-collimated X-ray beam with a beam size of 0.2×0.2 mm (FWHM) and an X-ray energy of 11 keV (wavelength 1.1271 Å). The SAXS data were collected using a Rayonix MX225-HE CCD detector at the sample-to-detector distance of 1.7 m (covering the scattering vector range of 0.01 Å-1 to 0.6 Å-1). A special temperature-controlled XY stage for 96-well sandwich plates has been designed and manufactured at SSRL. The stage has a travel range covering the entire plate with an accuracy and reproducibility of 10 μm and maintains temperature using a circulating water bath within 0.5 °C of nominal across the plate. The control over the XY stage and the SAXS data acquisition was performed via a newly developed interface, lipSAXS tab [Ping et al., manuscript in preparation], integrated into the Blu-Ice control software [33]. An inline optics that can be moved in and out of the beam path was used to register the fiducial crosses for each plate, in order to match the RockImager coordinate system with the beamline stage coordinate system. The coordinates of the lipid drops obtained from the RockImager were imported into the control interface and the data acquisition was performed automatically for the complete 96-well plate. Each well was subjected to a 1 s exposure. Overall data collection per well including data transfer and travelling to the next well took on average ∼28 s, and the entire 96-well plate about 45 min. Immediately after data collection, each well was examined under light microscope and the quality of the lipid drop was scored based on its position with respect to the precipitant drop – inside (good), on the edge (potentially subject to dehydration) or outside (discarded as a data point) (see Supplementary Fig. 1).
2.5. Data processing and analysis
Exposure of lipid mesophase samples with X-ray beam produced small angle powder diffraction images. The images were processed with the SasTool program [34] in batch mode to radially integrate the intensity and generate averaged intensity (I) vs. scattering vector (q) plots.
An automated lipid phase identification procedure for processing radially integrated powder diffraction curves was developed in house using the Microsoft .Net Framework v4.0 and the C# programming language. The open source Fityk curve fitting application programming interface (API)[35] was used to fit spectral peaks with Gaussians. The program consumed diffraction data files (.tot format) in batch mode, delivering a graphical report containing phase classification results in html format.
For a given well in a 96-well plate, the steps involved are as follows:
Read the .tot file (space-delimited file containing q, I and error columns) and identify the peak with the highest intensity (I). This is considered the first peak of the predominant phase.
Based on the first peak, estimate positions of peaks expected for each of the possible phases: fluid isotropic (FI), lamellar liquid crystalline (Lα), inverted hexagonal (HII), cubic-Ia3d (Ia3d), cubic-Pn3m (Pn3m), cubic-Im3m (Im3m) and sponge.
Fit Gaussians for the regions +/- a user-defined standard deviation parameter (default = 0.005 Å-1 on q axis) around the estimated peak positions using the Fityk API. If the d-spacing of the Gaussian maximum is within 1.5 Å of the estimated d-spacing, it is considered to be a true peak at that position.
Based on the presence or absence of peaks with the expected d-spacing ratios, the phase is identified, according to the decision tree shown in Supplementary Fig. 2.
The lattice parameter for the predominant phase is calculated as a weighted average of the lattice parameters obtained from the positions of all identified peaks.
3. Results and Discussion
3.1. High-throughput LCP-SAXS
3.1.1. Development of the protocol
The goal of this work was to develop a protocol for efficient and high-throughput characterization of lipid mesophases and their structural properties under a large variety of conditions mimicking those encountered during membrane protein crystallization in LCP. To achieve this we modified our 96-well glass sandwich plates [26] replacing glass slides with plastic sheets with high X-ray transparency to allow collecting SAXS data on multiple lipid samples.
Typical workflow of this method is shown in Fig. 1. The first step involved preparation of 96-well COC plastic plates, mounted on a glass slide for support. Then LCP was prepared by mixing the molten lipid or lipid mixture with water using a mechanical syringe mixer [29, 30]. The syringe was mounted on the in meso robot [26], which delivered LCP boluses to each well of the COC plate, and overlaid them with the solutions from the 96-well screens tested. The plates were then incubated at 20°C overnight and imaged in the RockImager in order to determine locations of all lipid mesophase boluses. Subsequently the plates were transported to the BioSAXS beamline BL 4-2 at SSRL, where they were placed in the specially designed temperature-controlled 96-well sandwich plate holder and exposed to X-rays in an automatic mode to collect SAXS data. Immediately after data collection each plate was inspected under a microscope to assess the quality of the samples (Supplementary Fig. 1). The collected SAXS data were first automatically integrated and then analyzed in a batch mode to determine the identity and structural parameters of lipid mesophase in each sample (Fig. 2).
Fig. 1.

High-throughput LCP-SAXS pipeline.
Fig. 2.

Representative SAXS patterns and data processing for the different lipid mesophases. (A) Diffraction images; (B) 2-D plots of radially-integrated intensity vs. scattering vector; (C) Outputs from the automated mesophase classifier.
Lipid mesophases are notorious for undercooling and strong hysteresis in their phase behavior [20], therefore it was essential to maintain, as much as possible, a constant temperature around 20°C throughout the whole process from sample preparation to SAXS data collection. Since LCP samples were prepared in an air-conditioned room at 20-22°C, and temperatures in the RockImager and inside the SAXS plate holder were kept at 20 +/- 0.5°C, the most challenging was to avoid temperature fluctuations during the transport of plates between the lab at TSRI, where they were prepared, and SSRL. This was accomplished by placing the plates in a Thermosafe Greenbox. A temperature logging device that was used to monitor the temperature inside the box confirmed that the temperature remained within 20-21 °C during the time of the trip (Supplementary Fig. 3).
3.1.2. Performance
Throughout this study we performed high-throughput SAXS measurements of a total of 35 96-well plates. Each sample plate took ∼40 min to prepare, including time to assemble the plate (5 min; cutting COC sheets to size, affixing well spacer and applying hydrophobic coating), prepare the samples (15 min; making LCP, dispensing samples using robot, setting up imaging), image the plate (10 min) and capture drop coordinates from the images (10 min). At the beamline, collecting a diffraction dataset on a single plate took ∼60 min, including plate setup (10 min), diffraction measurement (45 min) and assessment of drop quality under a light microscope (5 min). Integration of the images was performed concurrently with data collection. Processing of the I vs. q plots including running the script for phase classification (5 min), and manual inspection of the data (15 min) took ∼20 min/plate. Hence, the measurement of 96 samples took an average of 2 hours of experiment time – a substantial improvement over conventional lipid SAXS measurement protocols, in which every sample was prepared manually in X-ray capillaries and measured individually or in small batches [18].
3.1.3. Automatic Mesophase Classifier
Each lipid mesophase generates its own signature SAXS pattern when exposed to X-rays (Fig. 2). To the best of our knowledge, however, there was no available software that could automatically process SAXS patterns to recognize different lipid mesophases and determine their lattice parameters. Therefore, we developed such mesophase classifier based on the algorithm described in the Methods section and Supplementary Fig. 2. Manual inspection of results produced by this automatic algorithm revealed reliable performance when a strong signal from a single mesophase was present in the SAXS pattern.
In cases of poor signals and mixed phases, we used a few empirical criteria to improve the reliability of classification. If the spectrum was flat (ratio of highest peak to background <2) then the data was designated as poor and flagged for manual inspection. Occasionally weaker peaks, such as the third and higher order peaks for cubic phases, were hard to identify if there was a contaminating phase (such as sponge phase). Hence we used the second peak as the strongest indicator.
Several samples were classified to be in an HII phase but with unusually large lattice parameters (>70 Å) (Supplementary Fig. 4). Manual inspection indeed confirmed a set of three peaks corresponding to HII phase positions. The SAXS patterns from these samples, however, contained many individual spots characteristic for cubic phases instead of powder rings common for hexagonal phases [18]. Composition of these samples and their appearance under a microscope with cross-polarizers also suggested a cubic phase. Thus we concluded that these samples represented the cubic-Pn3m phase with large domains specifically oriented along the glass slides so that certain reflections ((1,1,1), (2,0,0), (3,0,0)) were excluded from the diffraction pattern, resulting in the false classification of this phase as HII. These patterns were processed manually to obtain correct phase identity and lattice parameter.
Finally, there were cases with mixed phases, which even manual inspection of the data could not resolve; these were designated “undefined”.
3.1.4. Data Accuracy
To benchmark our process and assess it for data accuracy and consistency, we prepared three replicate plates with each well filled with LCP made of MO and overlaid with 0.4 M sodium citrate (pH 6.0), and collected HT LCP-SAXS data. All samples were in the cubic-Pn3m phase. However the lattice parameter showed a clear trend, increasing from 95 to 99 Å with increasing well number in the dispensed order (Fig. 3). This trend can be explained by a slight dehydration of drops during the plate setup, leading to a higher salt concentration in the earlier drops, which induced a larger shrinkage of the cubic-Pn3m lattice [18]. When data from the drops dispensed at the same time were compared, the average standard deviation of the lattice parameter was ∼1 Å, indicating a high reproducibility of sample preparation and a good accuracy of data processing.
Fig. 3.
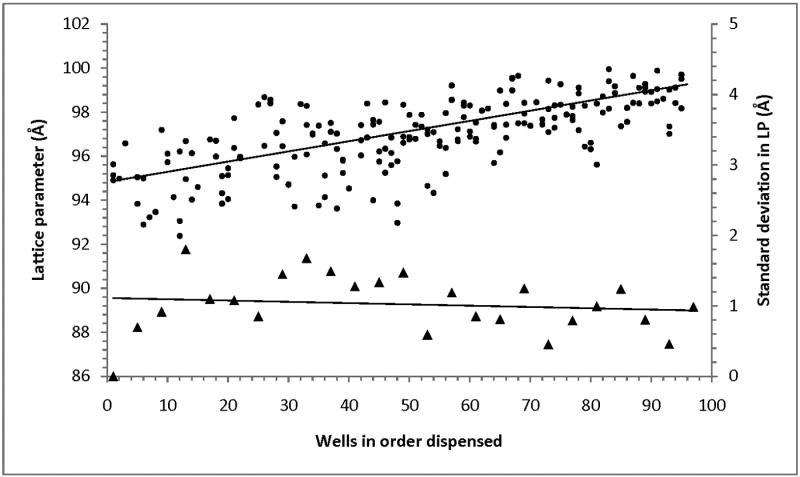
Accuracy and reproducibility of the HT LCP-FRAP approach. Lattice parameters of the cubic-Pn3m phase of MO incubated with 0.4 M sodium citrate pH 6.0 (solid circles), prepared in three 96-well plates, are plotted against the well number in the order dispensed. A clear trend of increasing the lattice parameter with increasing the well number indicates slight dehydration effects during dispensing. The standard deviations of the lattice parameter (solid triangles), calculated for groups of wells dispensed at the same time (four wells per plate; 3 plates), are shown along the secondary axis.
3.1.5. Reliability of the approach
As with any automatic process consisting of several steps, one would expect a certain percentage of failures. We found that attrition in the number of measurable samples arose from several sources: a) improper dispensing by the robot, b) movement of the buffer and/or LCP drop due to shaking/vibration or bending of the flexible plastic sandwich, c) dehydration during dispensing or improper sealing, and/or d) dissolution of the LCP by certain solvents (see results for Hampton screen below), and e) non-interpretable SAXS patterns.
Considering all the 35 sample plates measured, on average, 13 samples per plate were improperly dispensed or moved during the transport (based on visual inspection; see Supplementary Fig. 4), 17 drops/plate had poor signals (based on SAXS data) and 7 had SAXS signal but the phase was “undefined”. Overall 73 drops/plate were reliably measured and classified. We found that with our current setup, it took about four plates to achieve a complete dataset, with a redundancy of about three measurements per condition (Supplementary Table 1). Typically, for each screen, we dispensed two plates in the forward direction and two in the reverse, to compensate for possible artifacts resulting from dehydration during sample dispensing. We apply the same practice of using screens in forward and reverse directions when setting up crystallization trials with the in meso crystallization robot.
3.2. Effects of crystallization screens on lipid mesophase behavior
After establishing the HT LCP-SAXS protocol and assessing data accuracy and reproducibility, we used this approach to study effects of common precipitants on the phase behavior of samples prepared from MO, MO doped with 10% w/w Ch and MV. MO is the most common lipid used in LCP applications; MO doped with Ch was used for crystallization of G protein-coupled receptors in LCP [8, 10-13], and MV was successful for crystallization of sensory rhodopsin II in complex with its transducer [36]. The results of these experiments are shown below arranged by the precipitant screen used.
3.2.1. Hampton Crystal Screen HT
Hampton Crystal Screen was one of the first highly successful commercial sparse matrix screens designed for initial crystallization trials [37]. We used the 96-well Hampton Crystal Screen HT to evaluate the effect of the solutions therein on LCP prepared with MO (Supplementary Table 2). Apart from providing proof of principle of the HT LCP-SAXS protocol, we compared our results with those obtained earlier using a more conventional approach with Hampton Crystal Screens 1 and 2 [18], though the two methods necessitated some difference in the way the samples were prepared. The previous study [18] was performed with MO (43% w/w) mixed with a half strength Hampton Crystal Screen solution (57% w/w) using a syringe mixer [30], then transferred into an X-ray quartz capillary, flame-sealed and measured by SAXS. These samples represented a fully equilibrated state corresponding to fully hydrated LCP if the screen solution consisted only of water. This level of hydration was, however, limited in several cases of screen solutions that were capable of inducing LCP swelling. In the current work, we first prepared LCP using 60% w/w MO and 40% w/w water, and then overlaid 50 nL LCP boluses with 800 nL of half strength Hampton Crystal Screen solutions, ensuring full hydration at all conditions. This sample preparation protocol exactly followed the protocol for setting up LCP crystallization trials using in meso crystallization robot [26] and thus was more relevant for pre-characterization of lipid matrices before using them for crystallization. The results are summarized in Supplementary Table 2, in which the phase type and corresponding lattice parameters are reported. The identity, concentration, and pH of the screen components as specified by the supplier are included in the table. We also added the results reported earlier [18] for comparison.
Consistent with the previous results [18], most solutions (81 in the current and 85 in the previous study) were capable of supporting the cubic phase. Most conditions yielded phases and lattice parameters very similar to those obtained earlier; 50 with deviation within 2 Å, and an additional 16 within 5 Å. Thirteen conditions had the same phase identity but with lattice parameters that deviated more than 5 Å from the previous experiment. These contained isopropanol, dioxane, tert-butanol, ethanol, PEG MME 550 or PEG 4K. Ten conditions produced a different phase from the previous experiment; these contained MPD, isopropanol, hexanediol, Jeffamine, ethylene glycol or PEG 4K. Isopropanol, tert-butanol and ethanol are volatile organic solvents; it is conceivable that evaporation during sample preparation, or loss through the potentially permeable COC sheets (water vapor permeability of COC sheets is 0.03 g·m/m2/d at 23 °C and 85 %RH according to manufacturer) or acrylic glue could result in lower than expected concentrations (by as much as 30-70%). This could result in a different lattice parameter of the LCP, and in extreme cases, a different phase. Some conditions contained high molecular weight PEGs, which could take up to several days to equilibrate with the LCP. However, since our measurements were performed within two or three days after setup, some of these samples may not have reached full equilibrium. Six conditions had no observable signal. These contained MPD, hexanediol or Jeffamine – chemicals, which swell LCP and at high concentration completely dissolve it. We also performed the experiment using the full strength screen solutions, and obtained similar results, but with 79 conditions fully supporting the cubic phase (see Supplementary Table 2).
3.2.2. PEG 400/citrate screen
PEG/salt represents a very common screen for crystallization of soluble and membrane proteins. We tested the propensity of various lipids to form LCP in a custom PEG 400/ sodium citrate screen (Supplementary Table 3). PEG 400, in increasing concentrations, causes LCP to swell and eventually transition to sponge phase [5]. Sodium citrate has the advantage of being a buffer, being highly soluble, and as most kosmotropes do, shrinks LCP in a concentration dependent manner [18]. Sampling the properties of LCP made of various lipids with this screen would provide a broad overview of how these lipids behave in a variety of salt and PEG 400 concentrations. It would provide insight on the preferred concentration ranges for stable LCP, and the effects of salt and PEG 400 on the phase identities and lattice parameters.
At lower salt and PEG 400 concentrations, MO predominantly occurred in the cubic-Pn3m phase, but transitioned to the sponge phase at high salt and PEG 400 concentrations (Supplementary Table 3). In the absence of PEG 400, increasing concentrations of citrate shrunk the cubic-Pn3m lattice parameter, while in the presence of PEG 400, the trend was unexpectedly reversed and the lattice parameter swelled with increasing citrate concentrations (Fig. 4). At all tested salt concentrations, PEG 400 swelled the cubic phase. In conditions yielding sponge phase, increasing salt as well as PEG 400 concentrations swelled the lattice parameter. The addition of 10% w/w Ch to MO slightly increased the lattice parameter in the absence of PEG 400, in agreement with previous studies [19]. However, it restricted the LCP swelling effect induced by combinations of salt and PEG 400; the cubic-Pn3m lattice parameters were smaller than those of MO alone at corresponding PEG 400 and salt concentrations. Additionally, Ch-spiked MO remained in the cubic-Pn3m phase in the whole tested range of PEG 400 and salt concentrations, which at their upper range produced sponge phase in MO alone. We also tested the properties of another LCP-forming lipid, MV. It followed similar phase behavior and trends as MO, with one important difference being that the lattice parameters were ∼15 Å larger (Supplementary Table 3 and Fig. 4).
Fig. 4.
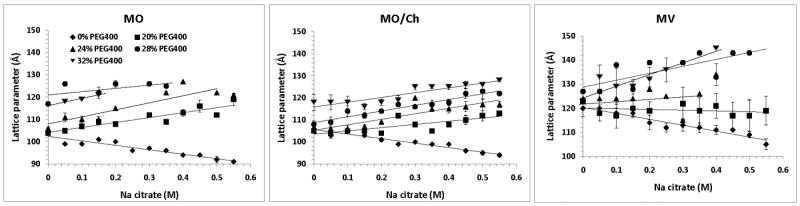
Effect of sodium citrate and PEG 400 on the lattice parameters of the cubic-Pn3m phase of MO, MO/Ch and MV.
3.2.3. HT LCP-FRAP screen
Recently we developed a pre-crystallization screening assay HT LCP-FRAP, which is based on measuring the mobility of membrane proteins embedded in LCP at various conditions by fluorescence recovery after photobleaching [28]. In the current study we tested the properties of MO, Ch-spiked MO and MV at the conditions present in a screen used for the HT LCP-FRAP analysis [28]. This 96-well screen contained 100 mM Tris pH 7 and 30% v/v PEG 400 along with 48 different salts at two concentrations: 0.1 M and 0.4 M.
Consistent with the PEG 400/ sodium citrate results, combinations of PEG 400 with different salts induced swelling for all tested lipids, and higher salt concentrations (0.4 M) typically swelled them more, except for the MO/Ch samples, which were relatively insensitive to the salt concentration (Supplementary Tables 4 and 5). On average across all salts, lattice parameter of the cubic-Pn3m phase increased from 113 Å (0.1 M salt) to 117 Å (0.4 M salt) in MO samples; from 130 Å (0.1 M salt) to 138 Å (0.4 M salt) in MV samples; and remained a constant 113 Å (0.1 M) and 112 Å (0.4 M) in MO/Ch samples (Supplementary Table 6). At 0.1 M salt concentration, most samples stayed in the cubic-Pn3m phase, while at 0.4 M salt, many conditions induced sponge phase in MO (28 conditions) and MV (32 conditions) samples. The most common anions inducing sponge phase were citrate, tartrate, acetate, thiocyanate, phosphate and sulfate. MO spiked with 10% w/w Ch resisted conversion to the sponge phase in agreement with the results of the PEG 400/ sodium citrate screen.
4. Conclusions
We have developed and described here a high-throughput method to rapidly characterize the structural parameters of lipid mesophases using SAXS, in a format that recapitulates membrane protein crystallization in LCP. The approach was validated by comparing effects of the Hampton Crystal Screen solutions on MO-based LCP with results obtained previously using samples prepared and measured one-by-one in X-ray capillaries. The method was also applied to other lipids and lipid mixtures, such as MV and MO doped with 10% Ch, providing new data on the phase behavior of these samples and their structural parameters in PEG 400/ salt concentration grid screens. Our next goal is to use this technology to characterize novel synthetic LCP-forming lipids in a variety of precipitant conditions. This will allow tailoring the lipid bilayer thickness, curvature and water channel diameter of LCP to be compatible with the crystallization of membrane proteins and complexes of different sizes, topologies and architectures.
Supplementary Material
Acknowledgments
This work was supported in part by the NIH Common Fund's Structural Biology program grant P50 GM073197. Portions of this research were carried out at the Stanford Synchrotron Radiation Lightsource, a Directorate of SLAC National Accelerator Laboratory and an Office of Science User Facility operated for the U.S. Department of Energy Office of Science by Stanford University. The SSRL Structural Molecular Biology Program is supported by the DOE Office of Biological and Environmental Research, and by the National Institutes of Health, National Center for Research Resources, Biomedical Technology Program (P41RR001209). The authors acknowledge Tsutomu Matsui for beam line support, Ping Liu for development of the lipSAXS tab in the beamline controlling software at BioSAXS beamline BL4-2 at SSRL, Cathy Klasen for proofreading the manuscript and Katya Kadyshevskaya for help with illustrations. We thank Yuan Zheng (The Ohio State University) and Martin Caffrey (Trinity College, Dublin, Ireland) for the generous loan of the in meso robot (built with support from the National Institutes of Health [GM075915], the National Science Foundation [IIS0308078], and Science Foundation Ireland [02-IN1-B266]).
Abbreviations
- Ch
cholesterol
- COC
cyclic olefin copolymer
- FRAP
fluorescence recovery after photobleaching
- HT
high-throughput
- LCP
lipid cubic phase
- MO
monoolein
- MV
monovaccenin
- PEG
polyethylene glycol
- SAXS
small angle X-ray scattering
- SSRL
Stanford Synchrotron Radiation Lightsource
Footnotes
Publisher's Disclaimer: This is a PDF file of an unedited manuscript that has been accepted for publication. As a service to our customers we are providing this early version of the manuscript. The manuscript will undergo copyediting, typesetting, and review of the resulting proof before it is published in its final citable form. Please note that during the production process errors may be discovered which could affect the content, and all legal disclaimers that apply to the journal pertain.
References
- 1.Landau EM, Rosenbusch JP. Proc Natl Acad Sci U S A. 1996;93:14532–14535. doi: 10.1073/pnas.93.25.14532. [DOI] [PMC free article] [PubMed] [Google Scholar]
- 2.Caffrey M. J Struct Biol. 2003;142:108–132. doi: 10.1016/s1047-8477(03)00043-1. [DOI] [PubMed] [Google Scholar]
- 3.Landau EM, Pebay-Peyroula E, Neutze R. FEBS Lett. 2003;555:51–56. doi: 10.1016/s0014-5793(03)01082-2. [DOI] [PubMed] [Google Scholar]
- 4.Cherezov V, Yamashita E, Liu W, Zhalnina M, Cramer WA, Caffrey M. J Mol Biol. 2006;364:716–734. doi: 10.1016/j.jmb.2006.09.022. [DOI] [PMC free article] [PubMed] [Google Scholar]
- 5.Cherezov V, Liu W, Derrick JP, Luan B, Aksimentiev A, Katritch V, Caffrey M. Proteins. 2008;71:24–34. doi: 10.1002/prot.21841. [DOI] [PubMed] [Google Scholar]
- 6.Hofer N, Aragao D, Caffrey M. Biophys J. 2010;99:L23–25. doi: 10.1016/j.bpj.2010.05.011. [DOI] [PMC free article] [PubMed] [Google Scholar]
- 7.Tiefenbrunn T, Liu W, Chen Y, Katritch V, Stout CD, Fee JA, Cherezov V. PloS One. 2011;6:e22348. doi: 10.1371/journal.pone.0022348. [DOI] [PMC free article] [PubMed] [Google Scholar]
- 8.Cherezov V, Rosenbaum DM, Hanson MA, Rasmussen SG, Thian FS, Kobilka TS, Choi HJ, Kuhn P, Weis WI, Kobilka BK, Stevens RC. Science. 2007;318:1258–1265. doi: 10.1126/science.1150577. [DOI] [PMC free article] [PubMed] [Google Scholar]
- 9.Hanson MA, Cherezov V, Griffith MT, Roth CB, Jaakola VP, Chien EY, Velasquez J, Kuhn P, Stevens RC. Structure. 2008;16:897–905. doi: 10.1016/j.str.2008.05.001. [DOI] [PMC free article] [PubMed] [Google Scholar]
- 10.Jaakola VP, Griffith MT, Hanson MA, Cherezov V, Chien EY, Lane JR, Ijzerman AP, Stevens RC. Science. 2008;322:1211–1217. doi: 10.1126/science.1164772. [DOI] [PMC free article] [PubMed] [Google Scholar]
- 11.Chien EY, Liu W, Zhao Q, Katritch V, Han GW, Hanson MA, Shi L, Newman AH, Javitch JA, Cherezov V, Stevens RC. Science. 2010;330:1091–1095. doi: 10.1126/science.1197410. [DOI] [PMC free article] [PubMed] [Google Scholar]
- 12.Wu B, Chien EY, Mol CD, Fenalti G, Liu W, Katritch V, Abagyan R, Brooun A, Wells P, Bi FC, Hamel DJ, Kuhn P, Handel TM, Cherezov V, Stevens RC. Science. 2010;330:1066–1071. doi: 10.1126/science.1194396. [DOI] [PMC free article] [PubMed] [Google Scholar]
- 13.Shimamura T, Shiroishi M, Weyand S, Tsujimoto H, Winter G, Katritch V, Abagyan R, Cherezov V, Liu W, Han GW, Kobayashi T, Stevens RC, Iwata S. Nature. 2011;475:65–70. doi: 10.1038/nature10236. [DOI] [PMC free article] [PubMed] [Google Scholar]
- 14.Wohri AB, Johansson LC, Wadsten-Hindrichsen P, Wahlgren WY, Fischer G, Horsefield R, Katona G, Nyblom M, Oberg F, Young G, Cogdell RJ, Fraser NJ, Engstrom S, Neutze R. Structure. 2008;16:1003–1009. doi: 10.1016/j.str.2008.06.003. [DOI] [PubMed] [Google Scholar]
- 15.Cherezov V, Clogston J, Papiz MZ, Caffrey M. J Mol Biol. 2006;357:1605–1618. doi: 10.1016/j.jmb.2006.01.049. [DOI] [PubMed] [Google Scholar]
- 16.Kulkarni CV, Wachter W, Iglesias-Salto G, Engelskirchen S, Ahualli S. Phys Chem Chem Phys. 2011;13:3004–3021. doi: 10.1039/c0cp01539c. [DOI] [PubMed] [Google Scholar]
- 17.Caffrey M, Lyons J, Smyth T, Hart DJ. Curr Top Membr. 2009;63:83–108. [Google Scholar]
- 18.Cherezov V, Fersi H, Caffrey M. Biophys J. 2001;81:225–242. doi: 10.1016/S0006-3495(01)75694-9. [DOI] [PMC free article] [PubMed] [Google Scholar]
- 19.Cherezov V, Clogston J, Misquitta Y, Abdel-Gawad W, Caffrey M. Biophys J. 2002;83:3393–3407. doi: 10.1016/S0006-3495(02)75339-3. [DOI] [PMC free article] [PubMed] [Google Scholar]
- 20.Qiu H, Caffrey M. Biomaterials. 2000;21:223–234. doi: 10.1016/s0142-9612(99)00126-x. [DOI] [PubMed] [Google Scholar]
- 21.Cherezov V, Liu J, Griffith M, Hanson MA, Stevens RC. Cryst Growth Des. 2008;8:4307–4315. doi: 10.1021/cg800778j. [DOI] [PMC free article] [PubMed] [Google Scholar]
- 22.Misquitta LV, Misquitta Y, Cherezov V, Slattery O, Mohan JM, Hart D, Zhalnina M, Cramer WA, Caffrey M. Structure. 2004;12:2113–2124. doi: 10.1016/j.str.2004.09.020. [DOI] [PubMed] [Google Scholar]
- 23.Misquitta Y, Cherezov V, Havas F, Patterson S, Mohan JM, Wells AJ, Hart DJ, Caffrey M. J Struct Biol. 2004;148:169–175. doi: 10.1016/j.jsb.2004.06.008. [DOI] [PubMed] [Google Scholar]
- 24.Borshchevskiy V, Moiseeva E, Kuklin A, Bueldt G, Hato M, Gordeliy V. J Cryst Growth. 2010;312:3326–3330. [Google Scholar]
- 25.Li DF, Lee J, Caffrey M. Cryst Growth Des. 2011;11:530–537. doi: 10.1021/cg101378s. [DOI] [PMC free article] [PubMed] [Google Scholar]
- 26.Cherezov V, Peddi A, Muthusubramaniam L, Zheng YF, Caffrey M. Acta Crystallogr D Biol Crystallogr. 2004;60:1795–1807. doi: 10.1107/S0907444904019109. [DOI] [PubMed] [Google Scholar]
- 27.Cherezov V, Caffrey M. J Appl Cryst. 2003;36:1372–1377. [Google Scholar]
- 28.Xu F, Liu W, Hanson MA, Stevens RC, Cherezov V. Cryst Growth Des. 2011;11:1193–1201. doi: 10.1021/cg101385e. [DOI] [PMC free article] [PubMed] [Google Scholar]
- 29.Caffrey M, Cherezov V. Nat Protoc. 2009;4:706–731. doi: 10.1038/nprot.2009.31. [DOI] [PMC free article] [PubMed] [Google Scholar]
- 30.Cheng A, Hummel B, Qiu H, Caffrey M. Chem Phys Lipids. 1998;95:11–21. doi: 10.1016/s0009-3084(98)00060-7. [DOI] [PubMed] [Google Scholar]
- 31.Rasband WS. ImageJ. U. S. National Institutes of Health; Bethesda, Maryland, USA: 1997-2011. [Google Scholar]
- 32.Smolsky IL, Liu P, Niebuhr M, Ito K, Weiss TM, Tsuruta H. J Appl Cryst. 2007;40:S453–S458. [Google Scholar]
- 33.McPhillips TM, McPhillips SE, Chiu HJ, Cohen AE, Deacon AM, Ellis PJ, Garman E, Gonzalez A, Sauter NK, Phizackerley RP, Soltis SM, Kuhn P. J Sync Rad. 2002;9:401–406. doi: 10.1107/s0909049502015170. [DOI] [PubMed] [Google Scholar]
- 34.SSRL. http://ssrl.slac.stanford.edu/∼saxs/analysis/sastool.htm
- 35.Wojdyr M. J Appl Cryst. 2010;43:1126–1128. [Google Scholar]
- 36.Gordeliy VI, Labahn J, Moukhametzianov R, Efremov R, Granzin J, Schlesinger R, Buldt G, Savopol T, Scheidig AJ, Klare JP, Engelhard M. Nature. 2002;419:484–487. doi: 10.1038/nature01109. [DOI] [PubMed] [Google Scholar]
- 37.Jancarik J, Kim SH. J Appl Cryst. 1991;24:409–411. [Google Scholar]
Associated Data
This section collects any data citations, data availability statements, or supplementary materials included in this article.