Abstract
Epistasis substantially impacts evolution, in particular the rate of adaptation. We generated combinations of beneficial mutations that arose in a lineage during rapid adaptation of a bacterium whose growth depended upon a newly-introduced metabolic pathway. The proportional selective benefit for three of the four loci consistently decreased when introduced upon more fit backgrounds. These three alleles all reduced morphological defects caused by expression of the foreign pathway. A simple theoretical model segregating the apparent contribution of individual alleles to benefits and costs effectively predicted the interactions between them. These results provide the first evidence that patterns of epistasis may differ for within- and between-gene interactions during adaptation, and that diminishing returns epistasis contributes to the consistent observation of decelerating fitness gains during adaptation.
Epistasis describes genetic interactions in terms of how phenotypic effects of a mutation depend upon other mutations in the genome. If two mutations act upon a given phenotype independently, each would be expected to exert the same proportional effect regardless of whether the other allele was present, although other models can be applied (1–3). Deviations from this null expectation have been used to uncover interacting genes via genetic screens for second mutations that suppress the effect of the first, identify the order of enzymes in biochemical pathways, and unravel systems-level interaction patterns characterized with genome-wide double knockout libraries. One general trend has been that the detrimental effect of a lesion in a pathway (or module) (4) is greater alone than when there is already another deleterious mutation in that process (i.e., antagonistic epistasis). In contrast, lesions in parallel pathways producing the same product tend to cause stronger phenotypes (synergistic epistasis) than expected; the extreme case of the latter, termed synthetic lethality, results in a non-viable genotype.
Epistasis between beneficial mutations remains largely unexplored. Previous studies examined epistasis between five amino acid (or promoter) substitutions within an allele of beta-lactamase selected for cefotaxime resistance in Escherichia coli (5). By constructing all possible mutation combinations within the beta-lactamase locus, a single-peaked fitness landscape was revealed with numerous cases where the identical mutation increased resistance on some backgrounds but decreased it on others (i.e., sign epistasis). Similar results have been found for cofactor use by isopropylmalate dehydrogenase (6) and for hormone receptors (7). In contrast, few studies have addressed interactions between beneficial mutations in different genes (8, 9).
The distribution of epistatic interactions between mutations may greatly influence evolutionary outcomes —from the maintenance of sexual reproduction to the fixation rate of beneficial alleles— and hence the speed of adaptation itself. The most consistent finding across studies of laboratory-evolved populations has been a rapid deceleration of the rate of fitness increase (10). Theoretical analysis suggests that the observed dynamics of fitness increase and accumulation of substitutions (11) are best described by a class of fitness landscapes with antagonistic interactions between beneficial mutations (12).
We took both experimental and theoretical approaches to investigate potential epistasis in populations that were initiated with an engineered strain of Methylobacterium extorquens AM1 (hereafter ‘EM’; table S1) and evolved in batch culture with methanol as the sole carbon source (3). In order to grow on methanol, Methylobacterium must oxidize formaldehyde into formate. Wildtype Methylobacterium (WT) performs this oxidation with a tetrahydromethanopterin-dependent pathway (13). In EM, this native pathway was eliminated and replaced by a non-orthologous, glutathione (GSH)- dependent pathway from Paracoccus denitrificans (fig. S1) (14). As a result, the EM strain could grow on methanol, but at a rate three-fold slower than WT (fig. S2). Adaptation in eight replicate populations dependent upon this engineered metabolic function (analogous to natural horizontal gene transfer) resulted in an average fitness increase after 600 generations of 66.8% (fig. S3), as determined by competition assays (3), and was largely carbon substrate-specific (fig. S4).
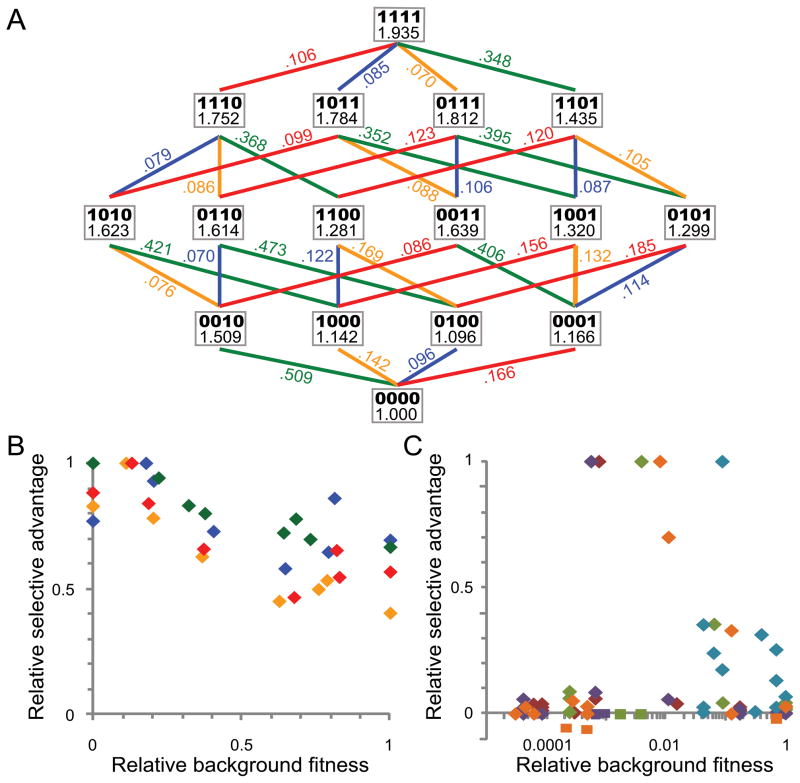
The genome of an evolved isolate from generation 600 ('EVO') (9) with the highest fitness (WEVO=1.94; table S2) was sequenced to identify the genetic basis of adaptation in that lineage (3). In total, 9 mutations were identified (fig. S5) (3). We found an 11 bp deletion between the two genes that encode the GSH-dependent pathway, flhA and fghA (i.e., fghAEVO), in a plasmid specifically introduced into EM (pCM410, fig. S6). This deletion removed the apparent ribosome binding site for fghA and decreased expression of these enzymes by 55 and 73% (3), respectively. This change, however, increased fitness by 14.2% (Fig. 1A), suggesting that production of these enzymes in the EM ancestor was higher than the optimum. In WT, where the GSH pathway is extraneous, a strain with an empty vector had 14.1% fitness advantage relative to when both genes were expressed. It therefore appeared that the primary advantage of the fghAEVO allele was to reduce the costs of protein over-expression, (e.g., energy consumption, ribosome sequestering, protein misfolding). We also identified a SNP in the promoter region of pyridine nucleotide transhydrogenase (pntABEVO), and a 2 bp deletion in the promoter of the most rate-limiting enzyme of GSH biosynthesis, γ-glutamylcysteine synthetase (gshAEVO). These gene products have clear linkages to methanol utilization in EM (3). The remaining 6 genetic changes included a large deletion (fig. S7), a synonymous SNP, the loss of a plasmid, two transposon insertions and a 6 bp insertion (3). These latter six are either difficult to genetically reconstruct, were individually neutral under our experimental conditions (15), or were deemed unlikely to greatly contribute to fitness. We thus treated them as a single collective locus, the ‘genetic background’ (GBEVO), for the purpose of examining epistasis between beneficial mutations. All identified alleles, when present individually in the ancestral background conferred fitness benefits ranging from 10 to 51% (Fig. 1A).
Figure 1.
Mutational network and distinct patterns of epistasis for mutations between and within genes. (A) Each node displays the allelic composition (fghA, pntAB, gshA, GB) of a given genotype (bold) and its fitness. Ancestral and evolved alleles are indicated by 0 and 1, respectively, leading from the ancestral EM strain (0000) to the evolved EVO isolate (1111). Each edge indicates an allelic replacement (fghA, orange; pntAB, blue; gshA, green; GB, red) and the corresponding selective coefficient. Variation in relative selective effect (normalized to max si) of each allele as a function of the fitness of the background was introduced into for: (B) between-gene epistasis in Methylobacterium (background fitness normalized from EM = 0 to max =1; colors as in A); or (C) within-gene epistasis for E. coli beta lactamase (background fitness normalized to max MIC = 1; log scale for visualization; squares indicate deleterious effects), data from (5).
In order to investigate epistasis between these beneficial mutations, strains with each allelic combination (24 = 16) were constructed (3) and their fitness values measured (Fig. 1A). The adaptive landscape of this genotypic space contained a single peak; each allele was universally beneficial across genetic backgrounds (i.e., showed no sign epistasis, but the degree of benefit conferred varied (Fig. 1B). Except for pntABEVO, the remaining three alleles exhibited a significant trend of diminishing returns: their selective benefits declined in genetic backgrounds with higher fitness. In contrast, the resistance to cefotaxime conferred by each mutation within the E. coli beta-lactamase gene (5) was idiosyncratic in regards to the resistance of the background onto which it was introduced (Fig. 1C).
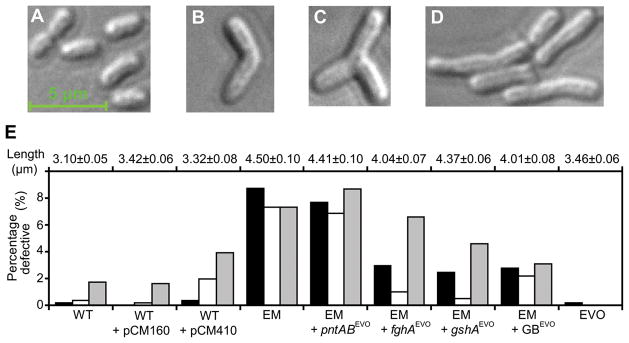
Interestingly, we found a connection between antagonistic epistasis and a physiological problem caused by protein over-expression in EM. Cells of the EM ancestor showed an increased length and aberrant morphologies relative to WT (Figs. 2, S8), similar to those commonly observed for protein over-expression (16). Reducing expression of the foreign pathway in EM via fghAEVO suppressed cellular abnormalities, while expressing it in WT (where it is redundant) induced similar defects. This confirmed that the morphological defects were caused by over-expression of the foreign pathway. Additionally, the gshAEVO and GBEVO alleles (but not pntABEVO) also individually reduced morphological defects (by ~threefold), and when all the evolved alleles are present together (e.g., the EVO strain) abnormal cells were nearly absent (a finding recapitulated across all eight populations, fig. S2D). These data suggest that part of the benefit conferred by the three alleles whose selective benefit wanes on fitter backgrounds resulted from directly or indirectly decreasing protein over-expression costs.
Figure 2.
Morphological aberrations caused by expression of the foreign pathway. Distinct cellular morphologies of (B) WT, or EM ancestor showing (C) curved, (D) branched, or (E) elongated cells. (F) Mean cell length and proportion of elongated (black), branched (white), and curved (grey) cells for various strains. Plasmid pCM410 expresses the foreign pathway while pCM160 is an empty control plasmid.
Epistasis has been often represented as the deviation from a null model in which individual mutations affect the ancestor’s fitness (W0 = 1.0) with independent multiplicative factors λi (double mutant’s fitness, Wij = λiλjW0). However, in our system, rather than being captured by a single indivisible phenotype, cell growth seems to depend upon at least one separately measurable component, i.e., the growth burden imposed by expressing the foreign pathway. As stated above, three of the four alleles identified in the EVO strain appear to increase fitness at least partly by reducing this cost. Therefore, in analogy to the contributions to fitness by a single enzyme (17), we developed a mathematical model that partitions fitness into two phenotypes: a ‘benefit’ component b0, analogous to a single conglomerate ‘enzyme activity’ that sets the rate of energy extracted from the substrate to generate biomass; and a cost c0, encompassing a fixed amount of energy diverted to deal with over-expression of the foreign pathway
(3). Thus the fitness of the ancestral strain can be written, as W0 = b0-c0 = 1. We hypothesize that a new allele i could modify the benefit and the cost of the ancestral background by certain multiplicative factors (λi and θi, respectively), giving rise to a fitness Wi = λib0-θic0. A successive allele j, on top of the background of mutant i, is similarly assumed to act multiplicatively on the benefit and cost components, yielding a fitness Wij = λiλjb0-θiθjc0.
If we could determine experimentally the values of b0, c0, and of λi and θi for each allele, then the above model should provide predictions for the fitness of any multi-allele strain, computable as (3). We estimated these parameters: cost was determined by expressing the foreign pathway in WT, where its metabolic function was fully redundant (c0=0.141) (17). Setting W0 = 1, results in b0 = 1.141. The lowered cost of expression, θi, for each allele was approximated as the decreased relative proportion of morphological defects (table S3) (3). Factors λi could then be estimated using the single-allele benefit-cost model.
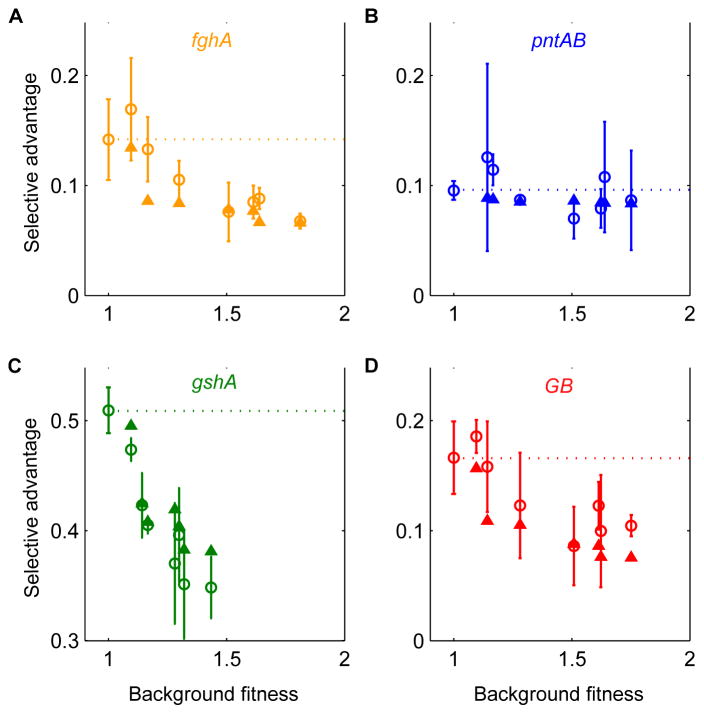
Without specifying further information, this simple model partitioning fitness into benefit and cost outperformed the standard null model in predicting fitness values of multi-allele combinations (R2 = 0.97 vs. R2 = 0.64, figs. S9, S10) (3). It also recapitulated the antagonistic trend of epistasis among the three alleles affecting cell morphology and correctly predicted the consistent magnitude of benefit from pntABEVO (Fig. 3). The agreement between our experimental data and model predictions supports our model assumptions and thus our hypothesis as to why diminishing returns epistasis was observed: proportional reductions of a cost became successively less beneficial as the cost itself was alleviated.
Figure 3.
Antagonistic trend of epistasis detected from the data captured by the benefit-cost model. (A–D) Plots of measured (open circles) and predicted (solid triangles) selective coefficients s for each of the four evolved alleles, respectively, versus the fitness of the background onto which the allele was introduced. Dashed lines indicate selective advantages for each allele on the ancestral background (i.e., expectation for no epistasis: Wij = λiλjWo).
Diminishing returns has been predicted (18) but due to very different assumptions. The nonlinearity of fitness increase in these models arises because it is assumed that a given trait is under stabilizing selection for an intermediate optimum, thus explicitly considering fitness as being displaced from a fixed adaptive peak. While the assumption of intermediate optimality holds well for many traits like body weight and length, fitness rises monotonically with increasing growth rate or decreasing protein expression burden. In this study, we considered a higher-level phenotype (growth rate) as the sum of two constituent phenotypes (metabolic rate and protein expression burden) which allowed us to generate a precise expectation for fitness of multi-allele strains without explicitly assuming stabilizing selection. The success of this approach suggests that it may be possible to generalize the idea of expressing higher-level phenotypes (such as fitness) as combinations of multiple underlying traits to provide quantitative predictions of epistasis.
An analogous study (19) of the interactions between beneficial mutations in E. coli evolved in minimal glucose medium found similar epistatic trends: four of five new alleles exhibit significant diminishing returns. The fifth such mutation, and a mutation present as a component of our GBEVO allele that is beneficial only in metal poor media (15), showed the opposite trend: an increase in selective advantage with higher background fitness. Thus, across these two distinct model systems 7 of 10 alleles consistently showed antagonism, whereas only two exhibited synergy. This tendency toward diminishing returns between beneficial mutations was predicted from trajectories of fitness increase and substitution rate (12) but had never been tested directly. Furthermore, these results are in stark contrast to the epistatic effects seen among mutations within single proteins, which are varying and unpredictable in their effect with regard to background activity (5, 7). This distinction between results from within- and between-gene epistasis suggests that the underlying causes of epistasis at different physiological scales (i.e., within-gene protein biophysics vs. between-gene physiological networks) lead to categorically distinct, but reproducible trends in genetic interactions which affect both the speed of adaptation and the degree to which possible trajectories are limited.
Supplementary Material
Acknowledgments
We thank S. Kryazhminskiy, D. Weinreich, J. Weitz, C. Wilke, R. Whitaker and members of the Marx and Segrè labs for suggestions and discussions. Supported by NIH grant R01 GM078209, and NSF grant DEB-0845893. The resulting single-end 36-bp read data have been deposited in the NCBI Short Read Archive with accession number SRA030695.1.
Footnotes
Materials and Methods
SOM
References
Please refer to the complete version of record at http://www.sciencemag.org/. The manuscript may not be reproduced or used in any manner that does not fall within the fair use provisions of the Copyright Act without the prior, written permission of AAAS.
References and Notes
- 1.Phillips PC. Nat Rev Genet. 2008 Nov;9:855. doi: 10.1038/nrg2452. [DOI] [PMC free article] [PubMed] [Google Scholar]
- 2.Cordell HJ. Human Mol Genet. 2002 Oct 1;11:2463. doi: 10.1093/hmg/11.20.2463. [DOI] [PubMed] [Google Scholar]
- 3.Materials and methods are available as supporting material on Science Online.
- 4.Segrè D, Deluna A, Church GM, Kishony R. Nat Genet. 2005 Jan;37:77. doi: 10.1038/ng1489. [DOI] [PubMed] [Google Scholar]
- 5.Weinreich DM, Delaney NF, Depristo MA, Hartl DL. Science. 2006 Apr 7;312:111. doi: 10.1126/science.1123539. [DOI] [PubMed] [Google Scholar]
- 6.Lunzer M, Miller SP, Felsheim R, Dean AM. Science. 2005 Oct 21;310:499. doi: 10.1126/science.1115649. [DOI] [PubMed] [Google Scholar]
- 7.Bridgham JT, Carroll SM, Thornton JW. Science. 2006 Apr 7;312:97. doi: 10.1681/01.asn.0000926836.46869.e5. [DOI] [PubMed] [Google Scholar]
- 8.Sanjuán R, Moya A, Elena SF. Proc Natl Acad Sci U S A. 2004 Oct 26;101:15376. doi: 10.1073/pnas.0404125101. [DOI] [PMC free article] [PubMed] [Google Scholar]
- 9.Applebee MK, Herrgard MJ, Palsson BO. J Bacteriol. 2008 Jul;190:5087. doi: 10.1128/JB.01976-07. [DOI] [PMC free article] [PubMed] [Google Scholar]
- 10.Elena SF, Lenski RE. Nat Rev Genet. 2003 Jun;4:457. doi: 10.1038/nrg1088. [DOI] [PubMed] [Google Scholar]
- 11.Barrick JE, et al. Nature. 2009 Oct 29;461:1243. doi: 10.1038/nature08480. [DOI] [PubMed] [Google Scholar]
- 12.Kryazhimskiy S, Tkacik G, Plotkin JB. Proc Natl Acad Sci U S A. 2009 Nov 3;106:18638. doi: 10.1073/pnas.0905497106. [DOI] [PMC free article] [PubMed] [Google Scholar]
- 13.Chistoserdova L, Vorholt JA, Thauer RK, Lidstrom ME. Science. 1998 Jul 3;281:99. doi: 10.1126/science.281.5373.99. [DOI] [PubMed] [Google Scholar]
- 14.Marx CJ, Chistoserdova L, Lidstrom ME. J Bacteriol. 2003 Dec;185:7160. doi: 10.1128/JB.185.23.7160-7168.2003. [DOI] [PMC free article] [PubMed] [Google Scholar]
- 15.Chou HH, Berthet J, Marx CJ. PLoS Genet. 2009 Sep;5:e1000652. doi: 10.1371/journal.pgen.1000652. [DOI] [PMC free article] [PubMed] [Google Scholar]
- 16.Kurland CG, Dong H. Mol Microbiol. 1996 Jul;21:1. doi: 10.1046/j.1365-2958.1996.5901313.x. [DOI] [PubMed] [Google Scholar]
- 17.Dekel E, Alon U. Nature. 2005 Jul 28;436:588. doi: 10.1038/nature03842. [DOI] [PubMed] [Google Scholar]
- 18.Martin G, Elena SF, Lenormand T. Nat Genet. 2007 Apr;39:555. doi: 10.1038/ng1998. [DOI] [PubMed] [Google Scholar]
- 19.Khan AI, Dinh DM, Schneider D, Lenski RE, Cooper TF. doi: 10.1126/science.1203801. (submitted) [DOI] [PubMed] [Google Scholar]
Associated Data
This section collects any data citations, data availability statements, or supplementary materials included in this article.


