

Abstract
The duration of pre-anthesis developmental phases is of interest in breeding for improved adaptation and yield potential in temperate cereals. Yet despite numerous studies on the genetic control of anthesis (flowering) time and floral initiation, little is known about the genetic control of other pre-anthesis phases. Furthermore, little is known about the effect that changes in the duration of pre-anthesis phases could have on traits related to leaf appearance and tillering, or dry matter accumulation before terminal spikelet initiation (TS). The genetic control of the leaf and spikelet initiation phase (LS; from sowing to TS), the stem elongation phase (SE; from TS to anthesis), and, within the latter, from TS to flag leaf appearance and from then to anthesis, was studied in two doubled-haploid, mapping bread wheat populations, Cranbrook×Halberd and CD87×Katepwa, in two field experiments (ACT and NSW, Australia). The lengths of phases were estimated from measurements of both TS and the onset of stem elongation. Dry weight per plant before TS, rate of leaf appearance, tillering rate, maximum number of tillers and number of leaves, and dry weight per plant at TS were also estimated in the Cranbrook×Halberd population. More genomic regions were identified for the length of the different pre-anthesis phases than for total time to anthesis. Although overall genetic correlations between LS and SE were significant and positive, independent genetic variability between LS and SE, and several quantitative trait loci (QTLs) with different effects on both phases were found in the two populations. Several of these QTLs (which did not seem to coincide with reported major genes) could be of interest for breeding purposes since they were only significant for either LS or SE. There was no relationship between LS and the rate of leaf appearance. LS was strongly and positively correlated with dry weight at TS but only slightly negatively correlated with early vigour (dry weight before TS). Despite significant genetic correlations between LS and some tillering traits, shortening LS so as to lengthen SE without modifying total time to anthesis would not necessarily reduce tillering capacity, as QTLs for tillering traits did not coincide with those QTLs significant only for LS or SE. Therefore, the study of different pre-anthesis phases is relevant for a better understanding of genetic factors regulating developmental time and may offer new tools for fine-tuning it in breeding for both adaptability and yield potential.
Keywords: Dry weight, flag leaf, flowering, leaf appearance, phenology, QTL, stem elongation, terminal spikelet, tillering, wheat
Introduction
Optimization of the timing and duration of developmental phases is the most important factor determining adaptation to particular environments (Richards, 1991; Worland, 1996; Cockram et al., 2007). The genetic control of flowering time has been extensively studied in winter cereals including wheat (Worland, 1996; Law and Worland, 1997; Laurie et al., 2004) and is an important trait in selection in all breeding programmes. The time of flowering depends on a series of multiple phenological events. Despite extensive knowledge of genetic factors leading to the time to floral initiation and to flowering, little is known about the genetic control of other pre-flowering phases and the degree of independence between them. Extending the duration of the stem elongation phase [SE; from terminal spikelet initiation (TS) to anthesis] without modifying total time to anthesis has been proposed to increase yield potential; and a pre-requisite for its selection is that the duration of the pre-anthesis phases (before and after TS) should be genetically independent (Slafer et al., 2001, 2005). The rationale for this proposition is that the length of the stem elongation phase is a major yield determinant as the number of fertile florets at anthesis, which determines the final number of grains, is set during this phase (Kirby, 1988; Slafer and Rawson, 1994; Fischer, 2007; Miralles and Slafer, 2007).
Several authors have shown that there appears to be some genetic independence between the durations of different pre-flowering phases, as the duration of these phases differed in genotypes with similar time to heading, both in wheat (Halloran and Pennell, 1982; Whitechurch et al., 2007) and in barley (Appleyard et al., 1982; Kitchen and Rasmusson, 1983; Kernich et al., 1995, 1997; Borràs et al., 2009). Other authors have also suggested that different pre-heading phases could be changed without modifying time to anthesis, as responses to vernalization, photoperiod, and temperature can each differ greatly among genotypes and between phases (Slafer and Rawson, 1994; Slafer, 1996; Miralles and Richards, 2000; González et al., 2002).
In wheat, some major genes are well characterized, and candidate genes have been identified for them: the photoperiod response genes Ppd-D1, Ppd-B1, and Ppd-A1 on chromosome group 2 (Welsh et al., 1973; Law et al., 1978; Scarth and Law, 1983; Mohler et al., 2004), identified as PRR-like genes (Beales et al., 2007; Wilhelm et al., 2009); the vernalization response genes Vrn-A1, Vrn-B1, and Vrn-D1 on chromosome group 5 (Law et al., 1976; Worland et al., 1987; Galiba et al., 1995), which are MADS-box transcription factors similar to APETALA1 in Arabidopsis (Yan et al., 2003; Trevaskis et al., 2003; Fu et al., 2005); Vrn-B3 on 7BS (Law and Worland, 1997) which has been identified as an FT-like gene (Yan et al., 2006), as have its homologues Vrn-A3 and Vrn-D3 on 7AS and 7DS, respectively (Bonnin et al., 2008); and Vrn-A2 and Vrn-B2, identified as ZCCT genes (Dubcovsky et al., 1998; Yan et al., 2004; Distelfeld et al., 2009). However, many other genetic factors, related to intrinsic earliness or with a less well known role in the response to major factors determining developmental time (photoperiod and temperature, both vernalizing and non-vernalizing), have been identified, as Eps-2B on 2BS (Scarth and Law, 1983; Shindo et al., 2003); Eps-Am on 1AL sensitive to temperature (Bullrich et al., 2002; Appendino and Slafer, 2003); Vrn-D4 close to the centromere in 5D (Yoshida et al., 2010), and other earliness per se genes on 5AL (Kato et al., 2002); as well as several other quantitative trait loci (QTLs) for heading time whose position did not seem to coincide with that of the mentioned genes and loci (e.g. Sourdille et al., 2000; Shindo et al., 2003; Kuchel et al., 2006; Griffiths et al., 2009). All these studies show that the genetic control of heading time is under strong but complex genetic control, with genetic factors found on almost all wheat chromosomes (Worland, 1996; Law and Worland, 1997).
Despite this extensive genetic knowledge, little is known regarding how the different flowering genes affect the durations of the different pre-heading phases. In some studies using chromosome substitution, near-isogenic, and/or single chromosome recombinant lines, Ppd-D1 and Ppd-B1 alleles had different effects on the duration of pre-heading phases and on their response to photoperiod, although the results were contingent on both the genetic background and environmental conditions of each experiment (see the results and the review by González et al., 2005). Lewis et al. (2008) demonstrated that alleles of a cultivar and a wild accession of Triticum monoccocum for Eps-Am had different effects on the duration of the leaf and spikelet initiation phase (due to different sensitivity to temperature), but not on stem elongation. On the other hand, studies using a whole-genome QTL approach found that the pre-flowering phases before and after the onset of stem elongation [the leaf and the spikelet initiation phase (LS) and the SE] were generally not correlated and several different QTLs were identified between both phases, in rice (Zhou et al., 2001) and barley (Borràs-Gelonch et al., 2010; G Borràs-Gelonch et al., unpublished results). Moreover, many of the QTLs responsible for the genetic control of the different pre-heading phases had little or no effect on total time to heading (Zhou et al., 2001; Borràs-Gelonch et al., 2010; G Borràs-Gelonch et al., unpublished results), and some of these differences were maintained under different conditions of photoperiod and temperature (G Borràs-Gelonch et al., unpublished results).
Given that little is known about the genetic control of the different pre-anthesis phases in wheat, the first objective of the present study was to identify genetic factors contributing to durations of LS and SE in two wheat mapping populations, Cranbrook×Halberd (Cr/Ha) and CD87×Katepwa (Cd/Ka). Cranbrook and CD87 contain the Rht-B1 (4B) dwarfing allele, insensitive to gibberellin, whereas Halberd and Katepwa contain the tall (wild-type) allele at this locus (Rebetzke et al., 2007). Cranbrook, Halberd, and CD87 are considered as spring cultivars and are broadly adapted to most Australian growing conditions, while Katepwa is also a spring cultivar but has a Canadian origin (Rebetzke et al., 2007). Although differences in heading time between Cranbrook and Halberd and between CD87 and Katepwa are commonly small, transgressive segregation contributes to large among-progeny differences in both populations. In turn, several QTLs for heading date have been previously reported (Coleman et al., 2001; Rebetzke et al., 2008).
Several authors have shown that there is a close relationship between the onset of stem elongation and apex development in both wheat and barley, and, in wheat, the onset of stem elongation (SE0, with the stem ∼5 mm long) occurs around the stamen primordium stage (central spikelets), a few days before TS (Kirby and Appleyard, 1981; Kirby et al., 1994; McMaster, 1997, and several references therein). However, it is not clear if there is variation in the timing of TS and SE0 between genotypes. Therefore, the appropriateness of the use of TS (the most direct measurement in wheat which marks the end of spikelet initiation) and SE0 (which is much easier to estimate than TS) for determining the duration of the LS and SE phases in populations containing large number of genotypes was compared.
Finally, little is known of the effect that manipulating the duration of different pre-anthesis phases might have on leaf appearance and tillering (which may be important for an early crop canopy formation), or on dry matter accumulation before TS. Given that early vigour has been shown to be a favourable trait for breeding temperate cereals under some Mediterranean conditions (Richards et al., 2002), another objective was to study the effect that the length of LS could have on several traits related to leaf and tiller appearance, and dry matter accumulation before TS.
Materials and methods
Materials and trials
Two wheat mapping populations [168 double-haploid (DH) lines from Cr/Ha and 144 DH lines from Cd/Ka] were used in this study. Details on the development of both populations can be found in Kammholz et al. (2001). In addition to both DH populations and their parents, 18 spring and winter cultivars were sown as commercial checks.
Experiments were located at Ginninderra, ACT (35º11'S 149º 05′E, 606 m) and Gundibindyal, NSW (34º27'S 147º 47'E, 305 m), Australia. DH lines from Cr/Ha and from Cd/Ka were sown in adjacent trials on 7 June 2006 and 20 June 2006 at each site, respectively, following a row and column latinized experimental design augmented with parents and checks, with two complete replicates per DH line at Ginninderra (a total of 384 and 320 plots for Cr/Ha and Cd/Ka, respectively) and one replicate per DH line at Gundibindyal (224 and 192 plots for Cr/Ha and Cd/Ka, respectively), at a sowing rate of 220 seeds m−2. Gundibindyal was rainfed and experienced 2–3 °C warmer monthly mean temperatures than the irrigated Ginninderra experiment. Each plot consisted of five rows, 6 m long and 0.17 m apart.
Traits studied
When the onset of stem elongation was detected in the first most developmentally advanced lines, five plants were sampled weekly in all plots at each trial (two or three samplings, or more times for those plots that had not yet reached TS). Plants from these samplings were dissected to determine the apex stage until TS. The SE0 (considered to be when the first internode had elongated ∼0.5 cm; Kirby and Appleyard, 1981) was also determined from these samples and additionally from plots monitored in the field. Also from these samples, the number of leaves (following the Haun scale; Haun, 1973) and tillers were counted, and dry weight was determined in the Cr/Ha population only. Zadoks stages (Zadoks et al., 1974) were recorded in each plot twice per week in Ginninderra and weekly in Gundibindyal from soon before the first flag leaves emerged in plants in the trial until the plot reached anthesis, to estimate dates on which flag leaf (Zadoks 41) and anthesis (Zadoks 65) were reached in each plot.
Based on the above measurements, durations were determined for: the entire phase from sowing to anthesis (Z65); the leaf and spikelet initiation phase (LS), from sowing to TS; the stem elongation phase (SE), from TS to anthesis; and, within SE, the two subphases from TS to flag leaf (TS–Z41) and from flag leaf to anthesis (Z41–Z65). Additionally, the SE/LS ratio was calculated to test more objectively differences in the genetic control between LS and SE in subsequent QTL analyses. The phases LS, SE, and TS–Z41 were also calculated using SE0 as a surrogate for TS. Durations of all phases were calculated in degree-days using a base temperature of 0 °C. Data on days to anthesis from previous trials for Cr/Ha (Ginninderra in 2002, 2003 and 2004; Gundibindyal in 2002 and 2004) were also included in the QTL analyses.
Several traits related to leaf and tiller appearance, and dry matter accumulation before TS were studied in the Cr/Ha population. Dry weight of five plants from the first sampling (DW1), when the great majority of plants had not reached the TS stage (and therefore plants had not started the period with the maximum rate of dry matter accumulation), was studied as a trait related to early vigour. In the subset of lines dry weight was also studied at earlier stages (3 and 2 weeks before the most advanced genotype had reached TS).
As phyllochron could not be directly calculated in each plot, a surrogate of the rate of leaf appearance (assuming no differences in emergence time) was taken by determining the number of leaves on the same date for all plots (LN14/09, second sampling, on 14 September 2006). The stage at which this trait was estimated (with plants having 6–7 leaves) was late enough to appreciate accumulated differences in Haun stage due to differences in the rate of leaf appearance. The rate of leaf appearance (or its reciprocal, phyllochron) in wheat can change, particularly with long cycles or growing seasons, but this usually happens for the latest leaves (from about the seventh leaf onwards; Slafer and Rawson, 1997; Miralles and Richards, 2000). In agreement with these authors, in the subset of lines (with six data points for rate of leaf appearance, until the 7–8th leaf) a change in the slope of rate of leaf appearance for any genotype was not observed. DW1 and LN14/09 were subsequently estimated using data from both sites.
Maximum number of tillers (Tillmax) and the Haun stage when this was reached (LNTillmax) were estimated from all samplings in each plot, as tiller mortality normally occurs in field conditions after TS (McMaster, 1997). Another trait was estimated dividing Tillmax by the mean number of main shoot leaves in the plot when Tillmax was reached (Till/leaf). This trait integrates differences in the onset and in the rate of tillering (independent of the effect of phyllochron), two attributes that could be important in early development of the crop canopy. The number of leaves and dry weight in each plot when plants reached TS (LNTS and DWTS, respectively) were also studied. These traits (Tillmax, LNTillmax, Till/leaf, LNTS, and DWTS) were estimated only at Ginninderra.
Additionally 14 DH lines from the Cr/Ha population, selected using data from previous experiments as differing widely in time to heading, and five cultivars (including Cranbrook and Halberd) with contrasting time to heading, were sampled (five plants) every week from the stage of double ridge or before until ∼1 week before the first genotypes unfolded the flag leaf (a total of eight samplings), in two replicates per genotype at Ginninderra. From these samples, the numbers of leaves and tillers were counted, and the apex stage and dry weight determined.
For the subset of lines, additional measurements were made on phyllochron and rate of tillering: phyllochron was estimated as the inverse of the slope from the regression between the number of leaves and thermal time (in that case, independently of possible differences in emergence time). The coefficient of regression was >0.95 for all genotypes. The rate of tillering was estimated from the regression of the number of tillers against both thermal time and number of leaves, with data from the first sampling (when all plants had already started tillering and, thus, independently of differences in the onset of tillering) until the maximum number of tillers was reached. The coefficient of regression (using both thermal time and number of leaves) ranged from 0.80 to 0.99 between genotypes.
Statistical analyses
Genotype and genotype×environment variance components and Best Linear Unbiased Predictors (BLUPs) were estimated for each trait and population by fitting a mixed model, in which site, replicate within site, and checks within site were considered as fixed factors, while row within site, column within site, genotype, and genotype×site were considered as random factors. Narrow-sense heritabilities were calculated on a line-mean basis as:
where is the variance component of genotypes; , the variance component of the interaction genotype×environment (or site); , the error; e, the number of sites, and r, the number of replicates per experiment. To study genetic factors (in the QTL analyses) independent of the duration of the LS phase, BLUPs for DW1, LN14/09, LNTS, DWTS, Tillmax, LNTillmax, and Till/leaf were also estimated using the same model but including LS as a covariable. All analyses were performed with Genstat versions 11 and 12 (Payne et al., 2009). Genetic correlations were broadly estimated as correlations between BLUPs (main genotypic effects). BLUPs for traits estimated only in Cr/Ha were used in a principal component analysis and biplots [performed with SC-Biplot (Smit and Tjia, 1995), which uses the technique described in Chapter 2 of Gower and Hand (1996)] to illustrate genetic correlations with LS and between them. Columns were standardized, as variables had different unities, and centred (mean equal to zero). The genetic correlation between any two variables can be approximated by the cosine of the angle formed by their two vectors, provided that the two principal components of the biplot retain most of the variation. When this was not the case and the model failed to explain correlations with those variables, the direct estimated coefficients of correlation were included in the text.
Genetic maps used in QTL mapping contained 405 and 445 markers [restriction fragment length polymorphisms (RFLPs), amplified fragment length polymorphisms (AFLPs), microsatellites, diversity arrays technology (DArT), some known genes and proteins] for Cr/Ha and Cd/Ka, respectively, and were developed by Chalmers et al. (2001), and adapted by Lehmensiek et al. (2005) and Rebetzke et al. (2008). Single nucleotide polymorphisms (SNPs) for Rht-B1 and Ppd-D1 (the causative polymorphisms) were also included. The total length of the maps was 3032 cM and 2989 cM for Cr/Ha and Cd/Ka, respectively.
The QTL analyses were performed by running interval mapping and the restricted multiple QTL mapping method in MAPQTL, and by composite interval mapping using the mixed-model QTL subroutines implemented in Genstat version 12 (Payne et al., 2009). Significance thresholds were estimated by permutation tests in MAPQTL (LOD=2.9–3.1) and by Li and Ji's adjustment for the false discovery rate approach (Li and Ji, 2005) in Genstat [–log10(P-value)=3.5 in Cr/Ha and –log10(P-value)=3.4 in Cd/Ka], using a genome-wide significance level of 0.05 in both cases.
Two-locus epistasis analyses were undertaken fitting a mixed model for each trait including as fixed factors environment, replicate within environment, all significant QTLs (closest markers to the most significant loci) ordered by their significance level for the considered trait, all two-level interactions, and the interaction of each QTL with environment. The random factors were also row within environment, column within environment, and the remaining genotype and genotype×environment terms. The main focus of these analyses was studying epistasis, since for all traits (except heading date), the number of environments was too limited for studying specifically QTL×environment.
Results
Genetic variability and distributions
The range of variability between DH lines for LS, SE, and Z65 was large in both populations (∼200, 150, and 300 °Cd, or 20, 15, and 20 d, respectively) (Fig. 1) and heritabilities estimated for all phases were high, except for Z41–Z65 (Table 1). This large genetic variability reflected transgressive segregation since differences between parents were much smaller than the range of DH lines considering the SED (average standard error of differences) and confidence attributable to it (Fig. 1). Cranbrook had slightly longer LS than Halberd (∼4 d), but both had a similar duration of SE, which resulted in Cranbrook reaching anthesis ∼2–3 d later than Halberd. CD87 and Katepwa had similar values for all pre-anthesis subphases (LS, SE, TS–Z41, and Z41–Z65). LS and SE were slightly longer for CD87 than for Katepwa, resulting in slightly later anthesis (∼3 d) of the former.
Fig. 1.

Distributions of DH line means (BLUPs) for the phases LS, SE, Z65, TS–Z41, and Z41–Z65 (estimated using TS). Values for parents are indicated with arrows (Cr, Cranbrook; H, Halberd; Cd, CD87; K, Katepwa); SED, average standard error of differences between BLUPs.
Table 1.
Variance components for genotype, genotype×environment, and residual, with their standard errors, for different traits assessed in the Cranbrook×Halberd (Cr/Ha) and CD87×Katepwa (Cd/Ka) DH populations.
| Trait | Genotype | SE | G×E | SE | Residual | SE | h2 | |
| Cr/Ha | LS (SE0) (°Cd) | 2284 | 287 | 328 | 74 | 340 | 34 | 0.89 |
| LS (TS) (°Cd) | 2312 | 284 | 243 | 64 | 351 | 34 | 0.91 | |
| SE (SE0) (°Cd) | 690 | 139 | 427 | 109 | 627 | 59 | 0.62 | |
| SE (TS) (°Cd) | 786 | 132 | 221 | 86 | 599 | 56 | 0.72 | |
| SE0–Z41 (°Cd) | 971 | 164 | 368 | 105 | 640 | 61 | 0.71 | |
| TS–Z41 (°Cd) | 973 | 161 | 366 | 102 | 598 | 57 | 0.72 | |
| Z41–Z65 (°Cd) | 93 | 50 | 190 | 67 | 483 | 45 | 0.27 | |
| Z65 (°Cd) | 5316 | 617 | 361 | 77 | 351 | 33 | 0.95 | |
| SE/LS ratio (1/10 000) | 13.1 | 3.9 | 4.9 | 4.5 | 42.2 | 3.9 | 0.44 | |
| DW1 (g) | 0.122 | 0.018 | 0.520 | 0.40 (0.35) | ||||
| LN14/09 | 0.036 | 0.001 | 0.054 | 0.66 (0.64) | ||||
| LNTSa | 0.365 | 0.047 | – | 0.104 | 0.011 | 0.88 (0.56) | ||
| DWTS (g)a | 1.225 | 0.245 | – | 1.154 | 0.149 | 0.68 (0.27) | ||
| Tillmaxa | 1.066 | 0.24 | – | 1.734 | 0.18 | 0.55 (0.25) | ||
| LNTillmaxa | 0.036 | 0.020 | – | 0.216 | 0.023 | 0.25 (0.25) | ||
| Till/leafa | 0.0264 | 0.0051 | – | 0.0313 | 0.0032 | 0.63 (0.39) | ||
| Cd/Ka | LS (SE0) (°Cd) | 1857 | 292 | 846 | 135 | 135 | 33 | 0.80 |
| LS (TS) (°Cd) | 3143 | 418 | 506 | 92 | 275 | 29 | 0.90 | |
| SE (SE0) (°Cd) | 1382 | 303 | 1366 | 234 | 648 | 69 | 0.61 | |
| SE (TS) (°Cd) | 880 | 221 | 1133 | 199 | 602 | 64 | 0.53 | |
| SE0–Z41 (°Cd) | 1619 | 320 | 1217 | 227 | 761 | 81 | 0.65 | |
| TS–Z41 (°Cd) | 993 | 236 | 1130 | 207 | 647 | 69 | 0.56 | |
| Z41–Z65 (°Cd) | 39 | 46 | 133 | 65 | 507 | 49 | 0.14 | |
| Z65 (°Cd) | 6622 | 846 | 801 | 137 | 410 | 43 | 0.92 | |
| SE/LS ratio (1/10 000) | 18.5 | 6.5 | 31.9 | 7.2 | 30.9 | 3.2 | 0.41 |
Durations of phases were estimated with the onset of stem elongation (SE0) or with terminal spikelet (TS). Narrow-sense heritabilities are also given. Values in parentheses are heritabilities when TS was included in the model as covariable. Traits are defined in the text.
Traits estimated only at Ginninderra.
Distributions of DH lines in the Cr/Ha population were slightly skewed towards smaller values for LS, TS–Z41, and Z65, and approximately normal for SE and Z41–Z65. In the Cd/Ka population, distributions were clearly skewed towards smaller values for LS, bimodal and also skewed with some overlap for Z65, slightly skewed for TS–Z41, and approximately normal for SE and Z41–Z65. Mid-parent values were not significantly different from the DH population mean for any of the studied traits.
Genetic variability and heritabilities were also quite large for the other traits studied in the Cr/Ha population, with the exception of the number of leaves when the maximum number of tillers was reached (Tables 1, 2). For these traits, differences between parents were also very small compared with differences between DH lines (differences among progeny were from 3- to 5-fold the mean SED, except for LNTS for which there was more variability, i.e. 9-fold the mean SED; Table 2). However, genotype variance components were reduced by half for Till/leaf, and at least 5-fold for LNTS, DWTS, and Tillmax when these traits were analysed with LS as covariable, and, thus, heritabilities were lower (Table 1). In contrast, for DW1, LN14/09, and LNTillmax, the heritability was little reduced when including LS as a covariable. Distributions were also skewed towards low values for LNTS, DWTS, and Tillmax, while they were approximately normal for DW1, LN14/09, LNTillmax, and Till/leaf.
Table 2.
Parental means (BLUPs), standard error of differences (SED) for comparisons between parents, and mean, minimum, and maximum of the DH population and mean SED between BLUPs for DH lines in the Cranbrook×Halberd population, for dry weight (five plants) at the first sampling before the onset of stem elongation (DW1), and the number of leaves at the second sampling (as a surrogate of the rate of leaf appearance, LN14/09), dry weight (also five plants), and number of leaves at terminal spikelet (DWTS and LNTS), maximum number of tillers (Tillmax), number of leaves when Tillmax was reached (LNTillmax), and Tillers/leaf.
| Trait | Parents |
DH progeny |
|||||
| Cranbrook | Halberd | SED | Mean | Minimum | Maximum | SED | |
| DW1 (g) | 3.08 | 3.39 | 0.23 | 3.33 | 2.87 | 4.19 | 0.38 |
| LN14/09 | 6.56 | 6.69 | 0.08 | 6.65 | 6.28 | 7.05 | 0.17 |
| LNTS | 6.81 | 6.58 | 0.15 | 6.89 | 5.80 | 8.47 | 0.31 |
| DWTS (g) | 5.14 | 4.17 | 0.47 | 4.70 | 3.46 | 8.79 | 0.96 |
| Tillmax | 6.56 | 6.72 | 0.57 | 6.54 | 5.26 | 9.37 | 0.99 |
| LNTillmax | 6.73 | 6.72 | 0.15 | 6.73 | 6.50 | 7.10 | 0.21 |
| Tillers/leaf | 0.904 | 0.903 | 0.08 | 0.905 | 0.668 | 1.406 | 0.14 |
Contrasting use of terminal spikelet with onset of stem elongation
There were no substantial differences between the results using phases estimated with TS and phases estimated using SE0. Correlations on a plot mean basis between LS estimated with TS and LS estimated with SE0 were very high (>0.90 in all trials) while genetic correlations were even higher (r=0.96, P <0.001 for both populations). The TS stage occurred among genotypes, between 25 °Cd to 60 °Cd (3–6 d) later than SE0 in Cr/Ha and, with few exceptions, between 15 °Cd and 65 °Cd (2–7 d) later than SE0 in Cd/Ka (Fig. 2). The amount of residual variance compared with the sum of genotype and genotype×site variance components [σR/(σG+σG×E)] was almost equal between both methods for LS, SE, and TS–Z41 or SE0–Z41 (Table 1), as well as the amount of genotype×site variance components compared with genotype variance components (σG/σG×E). Thus, estimated heritabilities for LS, SE, and TS–Z41 were also very similar (Table 1) and coefficients of genetic correlations between each pair of traits were almost identical (data not shown). There were only some differences in the detection of some minor QTLs (see the section ‘Differences in QTL effects between pre-anthesis phases’). Therefore, for the sake of brevity, only traits estimated with TS are present (since it is the most direct measurement of the end of the spikelet initiation phase), except in the QTL analysis section where the differences observed between the two methods will be assessed.
Fig. 2.

(A) Relationships between LS estimated with the onset of jointing (SE0) and with terminal spikelet (TS), and (B) histograms for the difference between SE0 and TS, in the wheat mapping populations Cranbrook×Halberd and CD87×Katepwa. (This figure is available in colour at JXB online.)
Genetic correlations
Genetic correlations between LS and SE were highly significant for both populations (Table 3). However, given that correlations between LS and SE only explained 37% (Cr/Ha) or 16% (Cd/Ka) of the variation, there is considerable variability in LS and SE for any given value of total time to anthesis in both populations (Fig. 3). In Cr/Ha, the trend of the relationship between LS and SE was linear, and for most durations of total time to anthesis there was a similar range of variability in LS and SE (50–80 °Cd). On the other hand, in Cd/Ka, the relationship was approximately quadratic, resulting in a reduced range of variability in LS and SE for short durations of Z65 (50 °Cd as much), and a wide range in LS and SE for long durations of Z65 (∼125–175 °Cd) (Fig. 3). Total time to anthesis was slightly more by LS than by SE in both populations (Table 3), and variation in SE was explained mainly by TS–Z41, while no significant correlation was found between SE and Z41–Z65. Z41–Z65 was negatively correlated, although not strongly, with the duration of the previous phases.
Table 3.
Genetic correlations between the phases LS, SE, TS–Z41, Z65, and the SE/LS ratio in the Cranbrook×Halberd (below the diagonal) and CD87×Katepwa (above the diagonal) populations.
| LS | SE | TS–Z41 | Z41–Z65 | Z65 | |
| LS | – | 0.41 | 0.47 | –0.19 | 0.90 |
| (0.001) | (<0.001) | (0.025) | (<0.001) | ||
| SE | 0.61 | – | 0.91 | 0.14 | 0.77 |
| (<0.001) | (<0.001) | (0.099) | (<0.001) | ||
| TS–Z41 | 0.64 | 0.85 | – | –0.27 | 0.76 |
| (<0.001) | (<0.001) | 0.001 | <0.001 | ||
| Z41–Z65 | –0.21 | 0.06 | –0.46 | – | –0.06 |
| (0.005) | (0.415) | (<0.001) | 0.476 | ||
| Z65 | 0.93 | 0.85 | 0.81 | –0.11 | – |
| (<0.001) | (<0.001) | (<0.001) | (0.137) |
Upper values in each cell represent the coefficients of correlation, and values in parentheses are P-values under the null hypothesis that the correlation is statistically different from zero.
Fig. 3.

Variability in SE versus LS (A) for the Cranbrook×Halberd population and (B) for CD87×Katepwa. Filled circles indicate values for parents. Diagonal lines join values with the same total time to anthesis.
Genetic correlations between LS and traits related to leaf and tiller appearance and dry matter accumulation before TS in the Cr/Ha population are illustrated in Fig. 4 for those traits in which most variability is explained by the biplot. This is the case for all traits except DW1, which was only slightly correlated with LS (r= –0.27) but not with the remainder of the traits (not included in the biplot). The abscissa axis seemed related to the duration of LS and characters that had highly significant (P <0.001) correlations with that phase: LNTS (r=0.85), DWTS (r=0.69), Tillmax (r=0.58), and Till/leaf (r=0.58). On the other hand, LN14/09 and LNTillmax had little relationship to the duration of LS (r= –0.25 and –0.01, respectively; only the former was significant) and the other traits, while both were correlated between each other (r=0.49).
Fig. 4.

Biplot illustrating genetic correlations between LS, DW1, LN14/09, LNTS, Tillmax, LNTillmax, and Till/leaf for parents and progeny of Cranbrook×Halberd. Values in parentheses indicate variability explained by each axis. Open circles, BLUPs for DH lines; filled circles, BLUPs for parents: C, Cranbrook; H, Halberd.
These relationships between LS and traits related to leaf and tiller appearance and dry weight before TS were also observed in the subset of DH lines, which were studied in more detail, with coefficients of correlation similar to those estimated for the whole population (Fig. 5). The range of variability in LS for this subset of lines (selected from previous studies for being the most early or late in heading time) was 180 °Cd (∼2 weeks). The dry weight of five plants in the first two samplings (in that case 3 and 2 weeks, respectively, before the most advanced genotype reached TS) was also little correlated with LS (negatively in any case). Phyllochron and LNTillmax were not correlated with LS, whereas Tillmax, LNTS, and DWTS were highly and positively correlated with LS (r=0.8, 0.9, and 0.9, respectively). Tillmax in this subset of lines was mainly explained by the rate of tillering (estimated with both Tillmax versus thermal time and Tillmax versus number of appeared leaves, r=0.94 and r=0.84, respectively), whereas it was not correlated with the timing of tiller cessation (neither in thermal time nor with LNTillmax).
Fig. 5.

Relationships between LS and several traits related to leaf and tiller appearance and dry matter accumulation (five plants) before terminal spikelet, for a subset of DH lines from the cross Cranbrook×Halberd (filled circles) and five cultivars, including both Cranbrook and Halberd (open triangles).
Differences in QTL effects between pre-anthesis phases
The QTLs with the strongest effects on Z65 were located on chromosome groups 2 and 7 in both Cr/Ha and Cd/Ka, and these major QTLs [–log10(P-value) >10] were significant for both LS and SE (Table 4 and Fig. 6). Both populations segregated for Ppd-D1, which had the strongest effects on most phases and other traits. However, several different QTL effects were found between LS and SE, most of them from numerous relatively minor QTLs [–log10(P-value) <5–6] that had an effect only on LS or SE. In Table 4, QTLs are grouped by chromosomal regions if their confidence interval overlapped (designated with the chromosome name and a subscript; see also Supplementary Fig. S1 available at JXB online). The QTLs could be separated into four groups by considering differences in their effects between LS and SE.
Table 4.
Position, nearest molecular marker, –log10 (P-value), and additive genetic effect of significant QTLs identified for duration of phases and other traits by composite interval mapping.
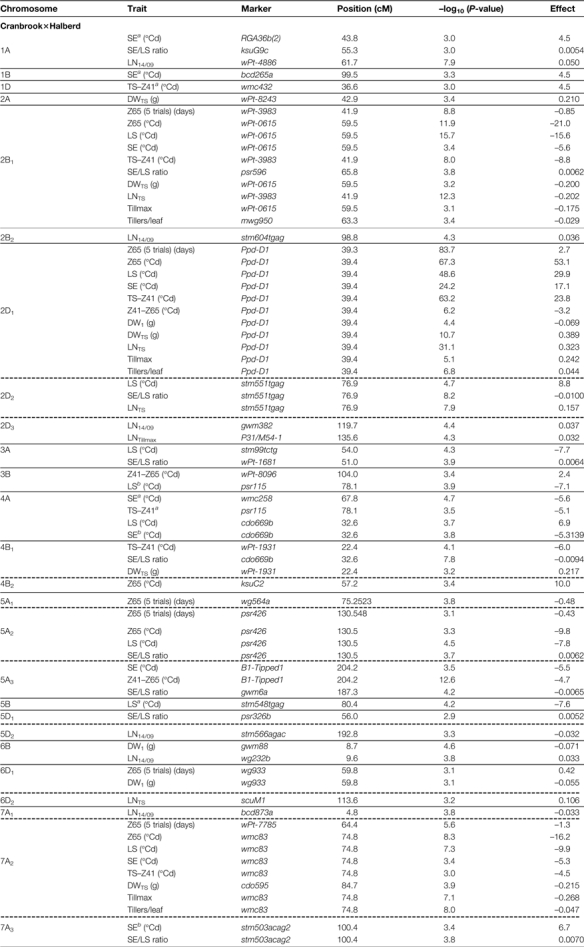 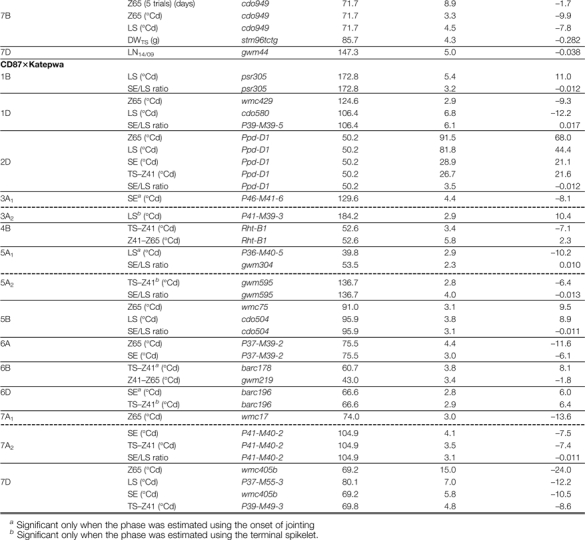
|
Negative values indicate an increase in the value of the trait from Cranbrook or CD87 alleles, whereas positive values indicate an increase in the value of the trai from Halberd or Katepwa.
Dashed lines indicate separate groups of QTLs whose confidence interval did not overlap.
Fig. 6.

Minuslog profiles for total time to anthesis and LS, SE, and the ratio SE/LS, in the (A) Cranbrook×Halberd and (B) CD87×Katepwa populations. Negative –log10(P-value) values indicate that the additive effect comes from Cranbrook or CD87, and positive –log10(P-value) values, from Halberd or Katepwa. The QTL for Ppd-D1 on 2D is truncated and indicated for each trait with arrows, to better visualize the remaining QTLs. (This figure is available in colour at JXB online.)
(i) The first group comprised those that were significant for both phases, with similar significance and effects, and therefore were significant for Z65 but not for the SE/LS ratio. This is the case for Ppd-D1 in Cr/Ha (although effects and significance were greater on LS than on SE; for TS–Z41 its effects were comparable with LS) and the QTLs on 4A and 7A2 in Cr/Ha (the latter with an effect on LS also greater than on SE), and on 7D in Cd/Ka.
(ii) Two major QTLs were significant for both LS and SE, but with much greater effects on LS than on SE, so they were also significant for the SE/LS ratio: a QTL on 2B1 in Cr/Ha and Ppd-D1 for Cd/K. The significance and effects of these QTLs for LS were about twice or more than for SE (Table 4). There was even a minor QTL on 4B1 in Cr/Ha (or two linked QTLs) which was significant and with similar effects on both phases but with opposite effects between them.
(iii) Another set of QTLs were significant for LS but not for SE [and even no –log10(P-value) peak was detected for SE]: QTLs on 2D2, 3A, 5A2,5B, and 7B in Cr/Ha; and QTLs on 1B, 1D, 3A2, 5A1, and 5B in Cd/Ka (Table 4). Most of these QTLs were also significant for the SE/LS ratio, although most of them had smaller additive effects on LS than the QTLs in the previous groups (Table 4).
(iv) Finally several minor QTLs were significant for SE but not for LS: QTLs on 1A, 1B, 5A3, and 7A3 in Cr/Ha; and QTLs on 3A1, 6A, 6D, and 7A2 in Cd/Ka.
There were also differences in the genetic control between the two subphases within SE (TS–Z41 and Z41–Z65) (Table 4; Supplementary Fig. S2 at JXB onlimne). As expected, given the lower heritability for Z41–Z65 relative to the other phases, fewer QTLs for that phase were detected, although some were highly significant. Some of them coincided with the position of QTLs for previous phases but with opposite effects: Ppd-D1 in Cr/Ha; on 4B (on the Rht-B1 position) and on 6B in Cd/Ka (both significant only for TS–Z41 and Z41–Z65). The other two QTLs for Z41–Z65 in Cr/Ha had no effect on previous phases: on 3B and on 5A3 (Table 4).
Some significant epistatic interactions were detected in both populations (Table 5). Several of the QTLs for duration of phases were located in homologous regions between both populations and between chromosome groups A, B, and D; those that are grouped in Table 6 (see also Supplementary Fig. S1 at JXB online). On the other hand, few QTL×environment interactions were detected (three in Cr/Ha and two in Cd/Ka). All of them were quantitative (i.e. the direction of allele effects was the same in each environment) and significant at a very low level (0.05 <P <0.01; data not shown).
Table 5.
Significant epistasis (P-value <0.01) for the two sampled DH populations.
| Epistasis | Trait | P-value | Effect | SE |
| Cranbrook×Halberd | ||||
| Ppd-D1×2B (63) | Z65 (five trials) | <0.001 | –1.65 | 0.38 |
| Z65 | <0.001 | –25.9 | 6.3 | |
| LS | <0.001 | –16.7 | 5.5 | |
| SE | 0.002 | –13.5 | 4.1 | |
| TS–Z41 | <0.001 | -14.1 | 3.6 | |
| 2B (63)×1B (99) | SE | 0.005 | –20.1 | 8.4 |
| CD87×Katepwa | ||||
| Ppd-D1×5A (136) | TS–Z41 | 0.001 | –13.7 | 4.4 |
| SE/LS ratio | 0.008 | –0.0213 | 0.0106 | |
| 6A (75)×6D (66) | SE | 0.001 | –15.9 | 4.9 |
| 7D (80)×5B (95) | LS | 0.010 | 15.0 | 5.15 |
Effects and their standard errors (SE) are expressed as deviations by the interaction of one allele at each locus (for each DH line it should be multiplied by 2, as QTL effects). All phases are expressed in °Cd except for anthesis date from previous trials (Z65 in five trials, expressed in days). QTLs are designated by their chromosome and position in cM (in parentheses).
Table 6.
Genes or QTLs related to developmental time in the literature which map close (about <10 cM) to QTLs identified for the duration of pre-anthesis phases in the present study (in the composite consensus map of wheat or others in GrainGenes) For genes, the reference that was used to compare positions is given in the table. For QTLs, the study in which it was reported is indicated by numbers.
 |
1Sourdille et al. (2000); 2Börner et al. (2002); 3Hanocq et al. (2004); 4Kuchel et al. (2006); 5Lin et al. (2008); 6Wang et al. (2009); 7Narasimhamoorthy et al. (2006); 8Chen et al. (2008); 9Shindo et al. (2003); 10Griffiths et al. (2009); 11Chu et al. (2008); 12Kato et al. (1999); 13Ahmed et al. (2000); 14Baga et al. (2009); 15Kulwal et al. (2003); 16Kumar et al. (2006); 17Bonnin et al. (2008).
As mentioned above, there were some differences in the detection of minor QTLs between phases estimated with TS and SE0. There were nine and seven minor QTLs in Cr/Ha and Cd/Ka, respectively, for LS, SE, or TS–Z41, significant only with one method or the other (Table 4). For most of these QTLs significant with only TS or the SE0, –log10(P-value) peaks close to ≥2 were found on the same regions as for the QTLs significant with the other method.
QTL analysis for other traits in the Cranbrook×Halberd population
As expected from genetic correlations, the largest and most significant QTLs for LNTS coincided with the most significant for LS (on 2B1, Ppd-D1, and 2D2; Table 4). In spite of this, there was a QTL for LNTS on 6D which was not significant for LS. For Tillmax and Till/leaf the most important QTL was on 7A2, followed by Ppd-D1 and the QTL on 2B1 (all significant for LS). All the QTLs for DWTS also coincided with QTLs significant for LS, except the QTL on 2A. In contrast, no QTL for DW1 and LN14/09 coincided with QTLs for LS, except Ppd-D1 for DW1, although its effect on DW1 was much smaller compared with the effect on other traits and in the opposite direction (the allele from Cranbrook reduced durations of all phases except Z41–Z65, while it increased DW1).
When the QTL analyses were performed on BLUPs estimated using LS as a covariable, only a new QTL was found to be significant, for LNTS, distal on 2BS, and two peaks about the –log10(P-value) threshold, on 4B and 3A for Till/leaf (data not shown). Only the QTL on 2D2 for LNTS was still significant, while no other QTLs were found for LNTS, DWTS, Tillmax, and Till/leaf. On the other hand, most QTLs for LN14/09 were maintained with almost identical effects (except those on 2D3 and 6D), and the QTL for DW1 on 6B (the other two, Ppd-D1 and that on 6D, were not significant using LS as covariable).
Discussion
Differences in the genetic control of pre-anthesis phases
A wide range of genetic variability and high narrow-sense heritabilites were observed in both Cr/Ha and Cd/Ka not only for total time to anthesis, as previously identified by Coleman et al. (2001) and Rebetzke et al. (2008), but also for pre-anthesis phases, with the exception of Z41–Z65. These reflected transgressive segregation, suggesting multiple, independent alleles at different loci between the different parents used in generating the populations (Fig. 1 and Table 1). Despite significant genetic correlations between LS and SE in both Cr/Ha and Cd/Ka (Table 3), there was a considerable amount of unexplained variance in the duration of the two phases, for both populations, which would show a partially independent genetic control between LS and SE (Fig. 3). This was consistent with previous studies demonstrating independent variability between pre-heading phases (i.e. differences in pre-anthesis phases between cultivars with a similar total time to anthesis or heading) in wheat (Halloran and Pennell, 1982; Whitechurch et al., 2007) and in barley (Appleyard et al., 1982; Kitchen and Rasmusson, 1983; Kernich et al., 1995, 1997; Borràs et al., 2009).
QTL analysis for anthesis in the experiments in 2006 was consistent with the results using data from previous experiments (five environments) in Cr/Ha, with the exception of three minor QTLs (Table 4), and with some previously reported QTLs for anthesis in both Cr/Ha and Cd/Ka (Coleman et al., 2001; Rebetzke et al., 2008). QTLs with the highest effects on Z65 were also the most significant for both LS and SE in both populations. However, numerous QTLs with different effects on LS and SE were identified in both wheat populations, confirming that LS and SE are partially under different genetic control (Table 4 and Fig. 6). Other studies have also identified differences in the genetic control between stem elongation and the previous phase in rice (Zhou et al., 2001) and barley (Borràs-Gelonch et al., 2010; G Borràs-Gelonch et al., unpublished results). The temperature-sensitive Eps-Am gene (Bullrich et al., 2002; Appendino and Slafer, 2003) was also found to have an effect on the duration of leaf and spikelet inititation phases, but not on SE in wheat (Lewis et al., 2008). Therefore, the duration of pre-anthesis phases could be changed genetically without modifying the total time to anthesis in wheat, as suggested by Halloran and Pennell (1982) and Whitechurch et al. (2007), and in studies identifying differences between pre-anthesis phases in the sensitivity to environmental factors (photoperiod and both vernalizing and non-vernalizing temperatures; Slafer and Rawson, 1994, 1995; Slafer, 1996; Miralles and Richards, 2000; González et al., 2002). For breeding purposes, the groups of QTLs 3 and 4 (groups defined in the ‘Results’ section) appear of real interest since they were significant only for LS or SE, despite their effects being smaller than those for groups of QTLs 1 and 2. As reported in Zhou et al. (2001) and Borràs-Gelonch et al. (2010), more QTLs for the duration of phenological phases can be found when partitioning the total time to anthesis to different phases, which may in turn allow more genetic factors in breeding for fine-tuning crop development. Although the number of environments is too limited in the present work for studying genotype×environment interactions, these are expected to be low for durations of phases if photoperiod and temperature conditions are similar across environments (e.g. similar latitude, sowing period). Actually the overall genotype×environment in the present study was very small compared with the main genotypic effects. Moreover, genetic factors responsible for differences in the SE/LS ratio could be well maintained under different conditions of photoperiod and temperature (within the range for most areas in which wheat is grown), as observed in barley (G Borràs-Gelonch et al., unpublished results), which would be more interesting for breeding purposes.
There was even a different genetic control between the subphases within SE (Table 4, and Supplementary Fig. S2 at JXB online), a result also found in barley by G Borràs-Gelonch et al. (unpublished results). Three of the QTLs significant for Z41–Z65 were also significant for the previous phase (TS–Z41) but with opposite sign, which could explain the negative correlations between the two phases within SE. Negative correlations and QTLs with opposite effects between these two phases within SE were also observed in barley (G Borràs-Gelonch et al., unpublished results). These results could reflect that longer durations of the previous phases might delay Z41–Z65 to more inductive conditions of longer photoperiod and warmer air temperatures. This could be the case for Ppd-D1, with strong effects on all previous phases, but it seems less clear for the other two QTLs found in Cd/Ka (on 4B on the Rht-B1 position, and on 6B), as they were significant for TS–Z41, not for previous phases, and with smaller effects. Nevertheless, a highly significant QTL on chromosome 5A and another on 3B in Cr/Ha were found for Z41–Z65, with their effect independent of other phases.
Use of terminal spikelet versus the onset of stem elongation
In the present study, SE0 coincided in most plants between the lemma and the floret primordium stage, in agreement with Kirby and Appleyard (1981), Kirby et al. (1994), and McMaster (1997, and several references cited therein). However, a range of differences, although not large, was still observed among genotypes (∼35 °Cd and 60 °Cd, or 3 d and 6 d, for Cr/Ha and Cd/Ka, respectively; Fig. 2). This range of differences between SE0 and TS was not explained well by genetic factors (heritabilities for this difference were very small, 0.30 and 0.08 for Cr/Ha and Cd/Ka, respectively; data not shown), and therefore could reflect error associated with both methods since no method proved to be more effective than the other (similar size of the residual and the genotype×site interaction relative to genotypic effects, Table 1). Nevertheless high genetic correlations were found between LS estimated with the SE0 and with TS, and the results were very similar between both methods (genotypic ranges, heritabilities, and genetic correlations), with only differences in the detection of minor QTLs (Table 4). This is in agreement with the literature and the close relationship between the apex stage and the elongation of the first internode (Kirby and Appleyard, 1981; Kirby et al., 1994; McMaster, 1997). Moreover, this close relationship is maintained under both short and long photoperiods and between gibberellin-sensitive and -insensitive genotypes (Rashid and Halloran, 1984).
If the objective were focused on detecting minor QTLs, more frequent samplings would be required (i.e. twice rather than once per week), although this may be difficult for the determination of TS for a large set of genotypes as in the present study, since it requires dissection of many plants. Given the high heritabilities and the strong genetic correlations between the same phases estimated with TS and SE0, both methods would be appropriate if combining both phenotypic and marker-assisted selection in a breeding programme.
Location of QTLs for pre-anthesis phases
Some of the QTLs for duration of pre-anthesis phases were located in homologous regions between chromosome groups (Table 6, Supplementary Fig. S1 at JXB online). Table 6 summarizes genes and QTLs related to development identified in the literature and for duration of pre-anthesis phases in the present study. Some of the QTLs (e.g. on groups 2, 5, and 7) were located close to regions where several authors identified effects on heading or other traits related to development, while other QTLs (e.g. those on groups 1, 3, 4, and 6, significant for only LS or SE) were located in regions where few QTLs related to development have been previously reported.
Ppd-D1 had the strongest effect on all phases (except Z41–Z65) in both populations, and accounts for the bimodal shape in the distribution of DH lines from Cd/Ka. Its greater effect on LS than on SE was more evident in Cd/Ka (for this population it was also significant for the SE/LS ratio). The QTL on 2B1 in Cr/Ha was also located very close to the position of Ppd-B1 (Scarth and Law, 1983; Worland, 1996; Sourdille et al., 2000; Mohler et al., 2004). The homologous group of genes PpD-A1, Ppd-B1, and Ppd-D1 are known to produce strong differences in heading time under short photoperiod conditions, whereas they have no, or only minor, effects under long photoperiod conditions (Worland, 1996, and references therein, and references in Table 6). Thus, the longer photoperiod experienced during SE could explain, at least in part, the smaller effect on this phase, consistent with Foulkes et al. (2004). Other studies on Ppd-B1 and Ppd-D1 alleles, using chromosome substitution lines, reported differences in duration and in sensitivity to photoperiod between pre-anthesis phases (under both constant and increasing photoperiod conditions), although the results differed depending on genetic background and environmental conditions of each study, so these differences could not be attributed to particular Ppd alleles (see also the results and the review by González et al., 2005). The different epistatic effects involving Ppd-D1 found in both populations in the present study may reflect differences in Ppd-D1 effects due to different genetic backgrounds, as suggested in those studies (Table 5). Another QTL on 2D in Cr/Ha, significant for LS but not for SE (Table 4 and Fig. 6), is located close to the centromere near the location of the Eps-2D gene (Worland, 1996).
QTLs on chromosomes 5A1 and 5B in Cr/Ha, and on 5B in Cd/Ka, significant for only LS, map in the vicinity of Vrn-A1 and Vrn-B1 (Galiba et al., 1995; Sarma et al., 2000; Tóth et al., 2003). Temperatures during LS in the experimental conditions of the present study appeared sufficient to satisfy any vernalization response, so these QTLs could be other genes, such as the earliness per se gene (and a hypothetical homologue on chromosome 5B) found on 5A by Kato et al. (2002), which also maps close to Vrn-A1 and the Q gene. The other QTL more distal on chromosome 5AL in Cr/Ha mapped close to Vrn-A2 (Dubcovsky et al., 1996; Distelfeld et al., 2009), but it seems unlikely that the QTL on 5A2 was Vrn-A2 since it was only significant for SE and Z41–Z65. Another QTL was also found on 5A (only for LS) in Cd/Ka in a different region, close to the centromere and the location of Fr-A2 (see references in Table 6). QTLs on chromosome group 7 are located in homologous regions, although it seems that there could be more than one QTL, at least on 7A in Cr/Ha, since another QTL for SE was detected with an opposite genetic effect on the same chromosome. QTLs on 7A and 7D are located close to the TaFTA and TaFTD positions, respectively, whereas QTLs on 7B map quite distantly from TaFTB (Vrn-B3) (Bonnin et al., 2008).
On chromosome groups 1, 3, 4, and 6, few studies in the literature were found reporting QTLs that mapped close to the QTLs identified in the present study (Table 6). QTLs on 1A and 1D in Cr/Ha seem to be in homologous regions, on the short arms (Supplementary Fig. S1 at JXB online), while QTLs on long arms for LS (1B) and Z65 (1D) in Cd/Ka were found in regions where possible homologues to Eps-Am and Ppd-H2, respectively, could be located (Bullrich et al., 2002; Griffiths et al., 2009). On 4B, the QTLs in Cd/Ka mapped to the Rht-B1 position (for TS–Z41 and Z41–Z65, with opposite effects between both), and close to it in Cr/Ha but with opposite effects between LS and SE. In studies comparing near-isogenic lines differing for Rht dwarfing alleles (gibberellin-sensitive/insensitive), the timing of phenological stages was not modified (Youssefian et al., 1992; Miralles and Slafer, 1997). They could correspond to another linked gene, as Shindo et al. (2003) also found a QTL for photoperiod sensitivity in a position close to Rht-B1.
Traits related to leaf and tiller appearance, and dry weight before the terminal spikelet stage
There was considerable genetic variability and heritability for LN14/09, which could be considered as a surrogate of rate of leaf appearance (Tables 1, 2). Variability between wheat genotypes has been documented in several studies in the rate of leaf appearance or phyllochron (in both spring and winter wheats, e.g. Kirby et al., 1985; Frank and Bauer, 1995), and similar heritabilities (or even higher) for phyllochron in DH populations have been reported both in barley (Dofing, 1999; Borràs et al., 2009) and in rice (Miyamoto et al., 2004). Phyllochron is known to be affected by temperature and photoperiod, and to a much lesser extent by nutrient and water availability (e.g. Slafer and Rawson, 1997; McMaster, 1997, and several references therein). In the present study there was little relationship between LN14/09 and the duration of LS (confirmed in the subset of lines for which phyllochron was estimated more accurately; Figs 4, 5), and no QTL coincided between both traits (Table 4; Supplementary Fig. S1 at JXB online). Lack of a relationship between phyllochron and duration of LS between genotypes has been also observed in barley (Kernich et al., 1997; Borràs et al., 2009; Borràs-Gelonch et al., 2010) and wheat (Regan et al., 1992). Moreover, in a DH barley population, QTLs responsible for a different partitioning of total time to heading in LS and SE did not coincide with QTLs for phyllochron (Borràs-Gelonch et al., 2010), as in the present study. Therefore, it seems that genetic modification of durations of different pre-anthesis phases through breeding might have little or no direct impact on the rate of leaf appearance.
Although tillering traits are far more influenced than leaf appearance by environmental factors such as nutrient and water availability (McMaster, 1997, and several references therein), there were large genotypic differences in Tillmax and Till/leaf between DH lines in the Cr/Ha population (Tables 1, 2). This is consistent with studies reporting large differences in tillering attributes among wheat genotypes (e.g. Kirby et al., 1985; McMaster, 1997, and several references therein). Despite this, the range of variability (relative to mean SED) and heritability for the Haun stage at cessation of tillering (LNTillmax) was much smaller than for Tillmax and Till/leaf, consistent with what was reported for a barley DH population (Borràs et al., 2009). The maximum number of tillers in the Cr/Ha population was largely related to variation in the rate of tiller appearance (Till/leaf for the whole population, or directly the rate of tillering in the subset of lines calculated using both thermal time and number of leaves), but not with the rate of leaf appearance and timing of tillering cessation (Fig. 4). These results are also in agreement with the study of Borràs et al. (2009), in which the maximum number of tillers was not genetically correlated with phyllochron.
Despite the fact that genetic correlations between LS and both Tillmax and Till/leaf were not so strong as with LNTS and DWTS (Figs 4, 5) (LS explained only 35% of the variability in Tillmax and Till/leaf for the whole population), little evidence was found of genetic factors controlling Tillmax and Till/leaf independently of the duration of LS in the Cr/Ha population, since all QTLs for Tillmax and Till/leaf coincided with QTLs for LS (although with differences in the significance between traits; Table 4; Supplementary Fig. S1 at JXB online). Further, when analysed with LS as a covariable, heritability was considerably reduced and no significant QTLs were identified for Tillmax and Till/leaf (Tables 1, 4). Interestingly, QTLs highlighted before as those potentially most useful for manipulating the duration of specific phases, since they were significant only for either LS or SE, were not significant for Tillmax and Till/leaf. Thus, there would be still scope for manipulating the duration of pre-anthesis phases without modifying the tillering capacity.
On the other hand, LNTillmax was controlled by QTLs different from those controlling LS (Table 4). Although tillering ceases around the terminal spikelet stage (Kirby et al., 1985), in the present study no significant genetic correlations between LNTillmax and LS or LNTS were found (Fig. 4). Nevertheless the genetic variability in the Cr/Ha population for this trait was rather restricted and heritability was quite low (0.25). Similar results on the Haun stage at tillering cessation have also been found in barley (Borràs et al., 2009; Borràs-Gelonch et al. 2010).
The two traits that presented the highest genetic correlations with LS were LNTS and DWTS, as expected given the wide variability for LS (much higher than for LN14/09). However, it has been shown that extending the duration of SE increases the dry weight of spikes and, thus, the number of fertile florets at anthesis, to increase final grain number (Miralles et al., 2000; González et al., 2003). In turn, the highest rate of dry matter accumulation during SE and the longer duration of SE could compensate for any difference in dry matter at TS (when comparing lines with a similar time to anthesis).
Dry weight per plant (from the first sampling, DW1) reflected differences in early vigour and was slightly but negatively correlated with duration of LS. The lack of a genetic relationship between DW1 and LS was confirmed with the analysis using LS as a covariable. Some authors have shown that early vigour (dry weight and leaf area) is closely related to traits such as leaf size and coleoptile tiller appearance and size (Rebetzke and Richards, 1999; Rebetzke et al., 2001), but the association with developmental time seems less clear. Regan et al. (1992) did not find an association between dry weight of the most vigorous cultivars and thermal time to double ridge or to terminal spikelet. However, other authors have reported that an earlier commencement of reproductive development was associated with greater early growth when comparing different temperate grass species (Kemp, 1988; López-Castañeda and Richards, 1994), and when comparing cultivars within the same species (in wheat, Davidson et al., 1990; and in barley, van Oosterom and Acevedo, 1992; both studies including spring and winter cultivars).
Conclusions
In relation to duration of developmental phases: (i) genotypic differences in flowering across two wheat populations assessed in multiple environments reflected some known major flowering genes, and other minor QTLs located in genomic regions where QTLs for heading date were previously reported in other populations; (ii) results for the different pre-anthesis phases were very similar using both terminal spikelet and the onset of jointing, although some minor QTLs were significant only with one of the two methods; (iii) LS and SE were partially under different genetic control and, interestingly for breeding purposes, most of these differences were due to several minor QTLs that were significant for only LS or SE; (iv) importantly, more QTLs could be detected when analysing different pre-anthesis phases than total time to anthesis, which may be useful to improve understanding and manipulation of genetic factors regulating developmental time; (v) there was also an apparent partially different genetic control for the two subphases within SE, although heritabilities for the duration of flag leaf appearance to anthesis were much smaller than for the remaining phases; and (vi) most of the QTLs significant for only LS or SE did not seem to coincide with major genes reported in the literature. In relation to growth: (i) the rate of leaf appearance was not genetically correlated with LS; (ii) some tillering traits including maximum tiller number and tillers/leaf were positively genetically correlated with LS, although changing durations in LS and SE without modifying the total time to heading (by those QTLs only significant for LS or SE) would not necessarily imply a reduction in the tillering capacity in the studied populations; and, finally, (iii) dry weight per plant at early stages was slightly but negatively related to the duration of LS, so reducing LS would not produce a reduction in early vigour. These conclusions are relevant for a better understanding of genetic factors regulating development in wheat, and may offer more tools for genetically fine-tuning it to improve both adaptability and yield potential. Therefore, assessing the durations of different pre-anthesis phases may be worthwhile in future research if the objective is focused on developmental time.
Supplementary data
Supplementary data are available at JXB online.
Figure S2. Minuslog profiles for TS–Z41 and Z41–Z65 in the (A) Cranbrook×Halberd and (B) CD87×Katepwa populations.
Figure S1. Linkage maps for Cranbrook×Halberd (Cr/Ha) and CD87×Katepwa (Cd/Ka) indicating the 2– –log10(P-value) interval from CIM for key development phases measured in two environments.
Acknowledgments
We are grateful to Bernie Mickelson and Michael Weiss at CSIRO Plant Industry for their technical assistance. GB-G held a pre-doctoral FPU scholarship and a grant for her stay in Australia from the Spanish Ministry of Science and Innovation. This study was also partially funded by CSIRO Plant Industry and by the Spanish Ministry of Science and Innovation project AGL2008-26 05541/C02.
Glossary
Abbreviations
- DW1
dry weight taken for all genotypes on the same date before TS (early vigour)
- DWTS
dry weight at TS
- LN14/09
leaf number taken for all genotypes on 14 September 2006 (surrogate of rate of leaf appearance)
- LNTillmax
number of leaves when the maximum number of tillers was reached
- LNTS
leaf number at TS
- LS
leaf and spikelet initiation phase (from sowing to either TS or SE0)
- SE
stem elongation phase (from either TS or SE0 to Z65)
- SE0
onset of stem elongation
- Till/leaf
Tillmax divided by LNTillmax
- Tillmax
maximum number of tillers
- TS
terminal spikelet initiation
- TS–Z41
phase from TS to flag leaf
- Z41
flag leaf (Zadoks stage 41)
- Z65
phase from sowing to anthesis (Zadoks stage 65)
- Z41–Z65
phase from flag leaf to anthesis
References
- Ahmed TA, Tsujimoto H, Sasakuma T. Identification of RFLP markers linked with heading date and its heterosis in hexaploid wheat. Euphytica. 2000;116:111–119. [Google Scholar]
- Appendino ML, Slafer GA. Earliness per se and its dependence upon temperature in diploid wheat lines differing in the major gene Eps-Am1 alleles. Journal of Agricultural Science. 2003;141:149–154. [Google Scholar]
- Appleyard M, Kirby EJM, Fellowes G. Relationships between the duration of phases in the pre-anthesis life cycle of spring barley. Australian Journal of Agricultural Research. 1982;33:917–925. [Google Scholar]
- Baga M, Fowler DB, Chibbar R. Identification of genomics regions determining the phenological development leading to floral transition in wheat (Triticum aestivum L.) Journal of Experimental Botany. 2009;60:3575–3585. doi: 10.1093/jxb/erp199. [DOI] [PMC free article] [PubMed] [Google Scholar]
- Beales J, Turner A, Griffiths S, Snape JW, Laurie DA. A Pseudo-Response Regulator is misexpressed in the photoperiod insensitive Ppd-D1a mutant of wheat (Triticum aestivum L.) Theoretical and Applied Genetics. 2007;115:721–733. doi: 10.1007/s00122-007-0603-4. [DOI] [PubMed] [Google Scholar]
- Bonnin I, Rousset M, Madur D, Sourdille P, Dupuits C, Brunel D, Goldringer I. FT genome A and D polymorphisms are associated with the variation of earliness components in hexaploid wheat. Theoretical and Applied Genetics. 2008;116:383–394. doi: 10.1007/s00122-007-0676-0. [DOI] [PubMed] [Google Scholar]
- Borràs G, Romagosa I, van Eeuwijk F, Slafer GA. Genetic variability in the duration of pre-heading phases and relationships with leaf appearance and tillering dynamics in a barley population. Field Crops Research. 2009;113:95–104. [Google Scholar]
- Borràs-Gelonch G, Slafer GA, Casas A, van Eeuwijk F, Romagosa I. Genetic control of pre-heading phases and other traits related to development in a double haploid barley population (Hordeum vulgare L.) Field Crops Research. 2010;119:36–47. [Google Scholar]
- Bullrich L, Appendino ML, Tranquilli G, Lewis S, Dubcovsky J. Mapping of a thermo-sensitive earliness per se gene on Triticum monococcum chromosome 1Am. Theoretical and Applied Genetics. 2002;105:585–593. doi: 10.1007/s00122-002-0982-5. [DOI] [PubMed] [Google Scholar]
- Chalmers KJ, Campbell AW, Kretschmer J, et al. Construction of three linkage maps in bread wheat. Triticum aestivum. Australian Journal of Agricultural Research. 2001;52:1089–1119. [Google Scholar]
- Chen Y, Carver BF, Wang S, Cao S, Yan L. Genetic regulation of developmental phases in winter wheat. Molecular Breeding. 2010;26:573–582. [Google Scholar]
- Chu CG, Xu SS, Friesen TL, Faris JD. Whole genome mapping in a wheat doubled haploid population using SSRs and TRAPs and the identification of QTL for agronomic traits. Molecular Breeding. 2008;22:251–266. [Google Scholar]
- Cockram J, Jones H, Leigh FJ, O'Sullivan D, Powell W, Laurie DA, Greenland A. Control of flowering time in temperate cereals, genes, domestication, and sustainable productivity. Journal of Experimental Botany. 2007;58:1231–1244. doi: 10.1093/jxb/erm042. [DOI] [PubMed] [Google Scholar]
- Coleman RK, Gill GS, Rebetzke GJ. Identification of quantitative trait loci for traits conferring weed competitiveness in wheat (Triticum aestivum L.) Australian Journal of Agricultural Research. 2001;52:1235–1246. [Google Scholar]
- Davidson JL, Jones DB, Christian KR. Winter feed production and grain yield in mixtures of spring and winter wheats. Australian Journal of Agricultural Research. 1990;41:1–18. [Google Scholar]
- Distelfeld A, Tranquilli G, Chengxia L, Yan L, Dubcovsky J. Genetic and molecular characterization of the Vrn2 loci in tetraploid wheat. Plant Physiology. 2009;149:245–257. doi: 10.1104/pp.108.129353. [DOI] [PMC free article] [PubMed] [Google Scholar]
- Dofing SM. Inheritance of phyllochron in barley. Crop Science. 1999;39:334–337. [Google Scholar]
- Dubcovsky J, Lijavetzky D, Appendino L, Tranquilli G. Comparative RFLP mapping of Triticum monococcum genes controlling vernalization requirement. Theoretical and Applied Genetics. 1998;97:968–975. [Google Scholar]
- Fischer RA. Understanding the physiological basis of yield potential in wheat. Journal of Agricultural Science. 2007;145:99–113. [Google Scholar]
- Foulkes MJ, Sylvester-Bradley R, Worland AJ, Snape JW. Effects of a photoperiod-response gene Ppd-D1 on yield potential and drought resistance in UK winter wheat. Euphytica. 2004;135:63–73. [Google Scholar]
- Frank AB, Bauer A. Phyllochron differences in wheat, barley, and forage grasses. Crop Science. 1995;35:19–23. [Google Scholar]
- Fu D, Szűcs P, Liuling Y, Helguera M, Skinner JS, Zitzewitz J, Hayes PM, Dubcovsky J. Large deletions within the first intron in Vrn-1 are associated with spring growth habit in barley and wheat. Molecular Genetics and Genomics. 2005;273:54–65. doi: 10.1007/s00438-004-1095-4. [DOI] [PubMed] [Google Scholar]
- Galiba G, Quarrie SA, Sutka J, Morgunov A, Snape JW. RFLP mapping of the vernalization (Vrn1) and frost resistance (Fr1) genes on chromosome 5a of wheat. Theoretical and Applied Genetics. 1995;90:1174–1179. doi: 10.1007/BF00222940. [DOI] [PubMed] [Google Scholar]
- González FG, Slafer GA, Miralles DJ. Vernalization and photoperiod responses in wheat pre-flowering reproductive phases. Field Crops Research. 2002;74:183–195. [Google Scholar]
- González FG, Slafer GA, Miralles DJ. Grain and floret number in response to photoperiod during stem elongation in fully and slightly vernalized wheats. Field Crops Research. 2003;81:17–27. [Google Scholar]
- González FG, Slafer GA, Miralles DJ. Pre-anthesis development and number of fertile florets in wheat as affected by photoperiod sensitivity genes Ppd-D1 and. Ppd-B1. Euphytica. 2005;146:253–269. [Google Scholar]
- Gower JC, Hand DJ. Biplots. London: Chapman & Hall; 1996. [Google Scholar]
- Griffiths S, Simmonds J, Leverington M, et al. Meta-QTL analysis of the genetic control of ear emergence in elite European winter wheat germplasm. Theoretical and Applied Genetics. 2009;119:383–395. doi: 10.1007/s00122-009-1046-x. [DOI] [PubMed] [Google Scholar]
- Halloran GM, Pennell AL. Duration and rate of development phases in wheat in two environments. Annals of Botany. 1982;49:115–121. [Google Scholar]
- Hanocq E, Niarquin M, Heumez E, Rousset M, Le Gouis J. Detection and mapping of QTL for earliness components in a bread wheat recombinant inbred lines population. Theoretical and Applied Genetics. 2004;110:106–115. doi: 10.1007/s00122-004-1799-1. [DOI] [PubMed] [Google Scholar]
- Haun JR. Visual quantification of wheat development. Agronomy Journal. 1973;65:116–119. [Google Scholar]
- Kammholz SJ, Campbell AW, Sutherland MW, Hollamby GJ, Martin PJ, Eastwood RF, Barclay I, Wilson RE, Brennan PS, Sheppard JA. Establishment and characterisation of wheat genetic mapping populations. Australian Journal of Agricultural Research. 2001;52:1079–1088. [Google Scholar]
- Kato K, Miura H, Sawada S. Characterization of QEet.ocs-5A.1, a quantitative trait locus for ear emergence time on wheat chromosome 5AL. Plant Breeding. 2002;121:389–393. [Google Scholar]
- Kemp DR. The effect of flowering and leaf area on sward growth in winter of temperate pasture grasses. Australian Journal of Agricultural Research. 1988;39:597–604. [Google Scholar]
- Kernich GC, Halloran GM, Flood RG. Variation in development patterns of wild barley (Hordeum spontaneum L) and cultivated barley (H vulgare L) Euphytica. 1995;82:105–115. [Google Scholar]
- Kernich GC, Halloran GM, Flood RG. Variation in duration of pre-anthesis phases of development in barley (Hordeum vulgare) Australian Journal of Agricultural Research. 1997;48:59–66. [Google Scholar]
- Kirby EJM. Analysis of leaf, stem and ear growth in wheat from terminal spikelet stage to anthesis. Field Crops Research. 1988;18:127–140. [Google Scholar]
- Kirby EJM, Appleyard M. Cereal development guide. Stoneleigh, UK: National Agricultural Centre Cereal Unit; 1981. [Google Scholar]
- Kirby EJM, Appleyard M, Fellowes G. Leaf emergence and tillering in barley and wheat. Agronomie. 1985;3:193–200. [Google Scholar]
- Kirby EJM, Appleyard M, Simpson NA. Co-ordination of stem elongation and Zadoks growth stages with leaf emergence in wheat and barley. Journal of Agricultural Science. 1994;122:21–29. [Google Scholar]
- Kitchen BM, Rasmusson DC. Duration and inheritance of leaf initiation, spike initiation and spike growth in barley. Crop Science. 1983;23:939–943. [Google Scholar]
- Kuchel H, Hollamby G, Langridge P, Williams K, Jefferies SP. Identification of genetic loci associated with ear-emeregnce in bread wheat. Theoretical and Applied Genetics. 2006;113:1103–1112. doi: 10.1007/s00122-006-0370-7. [DOI] [PubMed] [Google Scholar]
- Kulwal PL, Roy JK, Balyan HS, Gupta PK. QTL mapping for growth and leaf characters in bread wheat. Plant Science. 2003;164:267–277. [Google Scholar]
- Kumar N, Kulwal PL, Gaur A, Tyagi AK, Khurana JP, Khurana P, Balyan HS, Gupta PK. QTL analyses for grain weight in common wheat. Euphytica. 2006;151:135–144. [Google Scholar]
- Laurie DA, Griffiths S, Dunford RP, Christodoulou V, Taylor SA, Cockram J, Beales J, Turner A. Comparative genetic approaches to the identification of flowering genes in temperate cereals. Field Crops Research. 2004;90:87–99. [Google Scholar]
- Law CN, Worland AJ, Giorgi B. The genetic control of ear-emergence time by chromosomes 5A and 5D of wheat. Heredity. 1976;36:49–58. [Google Scholar]
- Law CN, Sutka J, Worland AJ. A genetic study of day-length response in wheat. Heredity. 1978;41:575–585. [Google Scholar]
- Law CN, Worland AJ. Genetic analysis of some flowering time and adaptative traits in wheat. New Phytologist. 1997;137:19–28. [Google Scholar]
- Lehmensiek A, Eckerman PJ, Verbyla AP, Appels R, Sutherland MW, Daggard GE. Curation of wheat maps to improve map accuracy and QTL detection. Australian Journal of Agricultural Research. 2005;56:1347–1354. [Google Scholar]
- Lewis S, Faricelli ME, Appendino ML, Valárik M, Dubcovsky J. The chromosome region including the earliness per se locus Eps-Am1 affects the duration of early developmental phases and spikelet number in diploid wheat. Journal of Experimental Botany. 2008;59:3595–3607. doi: 10.1093/jxb/ern209. [DOI] [PMC free article] [PubMed] [Google Scholar]
- Li J, Ji L. Adjusting multiple testing in multilocus analyses using the eigenvalues of a correlation matrix. Heredity. 2005;95:221–227. doi: 10.1038/sj.hdy.6800717. [DOI] [PubMed] [Google Scholar]
- Lin F, Xue SL, Tian DG, Li CJ, Cao Y, Zhang ZZ, Zhang CQ, Ma ZQ. Mapping chromosomal regions affecting flowering time in a spring wheat RIL population. Euphytica. 2008;164:769–777. [Google Scholar]
- López-Castañeda C, Richards RA. Variation in temperate cereals in rainfed environments II. Phasic development and growth. Field Crops Research. 1994;37:63–75. [Google Scholar]
- McMaster G. Penology, development, and growth of the wheat (Triticum aestivum L.) shoot apex, a review. Advances in Agronomy. 1997;59:63–118. [Google Scholar]
- Miralles DJ, Richards RA. Responses of leaf and tiller emergence and primordium initiation in wheat and barley to interchanged photoperiod. Annals of Botany. 2000;85:655–663. [Google Scholar]
- Miralles DJ, Richards RA, Slafer GA. Duration of the stem elongation period influences the number of fertile florets in wheat and barley. Australian Journal of Plant Physiology. 2000;27:931–940. [Google Scholar]
- Miralles DJ, Slafer GA. Radiation interception and radiaton use efficiency of near-isogenic wheat lines with different height. Euphytica. 1997;97:201–208. [Google Scholar]
- Miralles DJ, Slafer GA. Sink limitations to yield in wheat, how could it be reduced? Journal of Agricultural Science. 2007;145:139–149. [Google Scholar]
- Miyamoto N, Goto Y, Matsui M, Ukai Y, Morita N, Nemoto K. Quantitative trait loci for phyllochron and tillering in rice. Theoretical and Applied Genetics. 2004;109:700–706. doi: 10.1007/s00122-004-1690-0. [DOI] [PubMed] [Google Scholar]
- Mohler V, Lukman R, Ortiz-Islas S, William M, Worland AJ, van Beem J, Wenzel G. Genetic and physical mapping of photoperiod insensitive gene Ppd-B1 in common wheat. Euphytica. 2004;138:33–40. [Google Scholar]
- Narasimhamoorthy B, Gill BG, Fritz AK, Nelson JC, Brown-Guedira GL. Advanced backcross QTL analyses of a hard winter wheat×synthetic wheat population. Theoretical and Applied Genetics. 2006;112:787–796. doi: 10.1007/s00122-005-0159-0. [DOI] [PubMed] [Google Scholar]
- Payne RW, Murray DA, Harding SA, Baird DB, Soutar DM. GenStat for Windows (12th Edition) Introduction. 2009. Hemel Hempstead, UK: VSN International. [Google Scholar]
- Rashid AH, Halloran GM. Influence of photoperiod on culm elongation and apical development in semi-dwarf and standard height wheats. Annals of Botany. 1984;54:375–382. [Google Scholar]
- Rebetzke GJ, Appels R, Morrison AD, Richards RA, McDonald G, Ellis MH, Spielmeyer W, Nonnett DG. Quantitative trait loci on chromosome 4B for coleoptile length and early vigour in wheat (Triticum aestivum L.) Australian Journal of Agricultural Research. 2001;52:1221–1234. [Google Scholar]
- Rebetzke GJ, Condon AG, Farquhar GD, Appels R, Richards RA. Quantitative trait loci for carbon isotope discrimination are repeatable across environments and wheat mapping populations. Theoretical and Applied Genetics. 2008;118:123–137. doi: 10.1007/s00122-008-0882-4. [DOI] [PubMed] [Google Scholar]
- Rebetzke GJ, Ellis MH, Bonnett DG, Richards RA. Molecular mapping of genes for coleoptile growth in bread wheat (Triticum aestivum L.) Theoretical and Applied Genetics. 2007;114:1173–1183. doi: 10.1007/s00122-007-0509-1. [DOI] [PubMed] [Google Scholar]
- Rebetzke GJ, Richards RA. Genetic improvement of early vigour in wheat. Australian Journal of Agricultural Research. 1999;50:291–301. [Google Scholar]
- Regan KL, Siddique KHM, Turner NC, Whan BR. Potential for increasing early vigour and total biomass in spring wheat. II. Characteristics associated with early vigour. Australian Journal of Agricultural Research. 1992;43:541–553. [Google Scholar]
- Richards RA. Crop improvement for temperate Australia. Future opportunities. Field Crops Research. 1991;26:141–169. [Google Scholar]
- Richards RA, Rebetzke GJ, Condon AG, Herwaarden AF. Breeding opportunities for increasing the efficiency of water use and crop yield in temperate cereals. Crop Science. 2002;42:111–121. doi: 10.2135/cropsci2002.1110. [DOI] [PubMed] [Google Scholar]
- Sarma RN, Fish L, Gill BS, Snape JW. Physical characterisation of the homologous group-5 chromosomes in wheat in terms of rice linkage blocks, and physical mapping of some important genes. Genome. 2000;43:191–198. [PubMed] [Google Scholar]
- Scarth R, Law CN. The location of the photoperiodic gene, Ppd2, and an additional factor for ear-emergence time on chromosome 2B of wheat. Heredity. 1983;51:607–619. [Google Scholar]
- Shindo C, Tsujimoto H, Sasakuma T. Segregation analysis of heading traits in hexaploid wheat utilizing recombinant inbred lines. Heredity. 2003;90:56–63. doi: 10.1038/sj.hdy.6800178. [DOI] [PubMed] [Google Scholar]
- Slafer GA. Differences in phasic development rate amongst wheat cultivars independent of responses to photoperiod and vernalization. A viewpoint of the intrinsic earliness hypothesis. Journal of Agricultural Science. 1996;126:403–419. [Google Scholar]
- Slafer GA, Abeledo LG, Miralles DJ, González FG, Whitechurch EM. Photoperiod sensitivity during stem elongation as an avenue to raise potential yield in wheat. Euphytica. 2001;119:191–197. [Google Scholar]
- Slafer GA, Araus JL, Royo C, García del Moral LF. Promising eco-physiological traits for genetic improvement of cereal yields in Mediterranean environments. Annals of Applied Biology. 2005;146:61–70. [Google Scholar]
- Slafer GA, Rawson HM. Sensitivity of wheat phasic development to major environmental factors, A re-examination of some assumptions made by physiologists and modellers. Australian Journal of Plant Physiology. 1994;21:393–426. [Google Scholar]
- Slafer GA, Rawson HM. Base and optimum temperatures vary with genotype and stage of development in wheat. Plant, Cell and Environment. 1995;18:671–679. [Google Scholar]
- Slafer GA, Rawson HM. Phyllochron in wheat as affected by photoperiod under two temperature regimes. Australian Journal of Plant Physiology. 1997;24:151–158. [Google Scholar]
- Smit J, Tjia K. SC-Biplot. Drunen: Smit Consult's; 1995. [Google Scholar]
- Snape JW, Butterworth K, Whitechurch E, Worland AJ. Waiting for fine times: genetics of flowering time in wheat. Euphytica. 2001;119:185–190. [Google Scholar]
- Sourdille P, Snape JW, Charmet G, Nakata N, Bernard S, Bernard M. Detection of QTLs for heading time and photoperiod response in wheat using a doubled-haploid population. Genome. 2000;43:487–494. [PubMed] [Google Scholar]
- Tóth B, Galiba G, Fehér W, Sutka J, Snape JW. Mapping genes affecting flowering time and frost resistance on chromosome 5B on wheat. Theoretical and Applied Genetics. 2003;107:509–514. doi: 10.1007/s00122-003-1275-3. [DOI] [PubMed] [Google Scholar]
- Trevaskis B, Bagnall DJ, Ellis MH, Peacock WJ, Dennis ES. MADS box genes control vernalization-induced flowering in cereals. Proceedings of the National Academy of Sciences, USA. 2003;22:13099–13104. doi: 10.1073/pnas.1635053100. [DOI] [PMC free article] [PubMed] [Google Scholar]
- van Oosterom EJ, Acevedo E. Adaptation of barley (Hordeum vulgare L.) to harsh Mediterranean environments. II Apical development, leaf, and tillers appearance. Euphytica. 1992;62:15–27. [Google Scholar]
- Wang S, Carver B, Yan L. Genetic loci in the photoperiod pathway interactively modulate reproductive development of winter wheat. Theoretical and Applied Genetics. 2009;118:1339–1349. doi: 10.1007/s00122-009-0984-7. [DOI] [PubMed] [Google Scholar]
- Welsh JR, Keim DL, Piratesh B, Richards RD. Proceedings of the 4th International Wheat Genetics Symposium. University of Missouri: Columbia, USA; 1973. Genetic control of photoperiod response in wheat. 879–884. [Google Scholar]
- Whitechurch EM, Slafer GA, Miralles DJ. Variability in the duration of stem elongation in wheat and barley genotypes. Journal of Agronomy and Crop Science. 2007;193:138–145. [Google Scholar]
- Wilhelm EP, Turner AS, Laurie DA. Photoperiod insensitive Ppd-A1a mutations in tetraploid wheat (Triticum durum Desf.) Theoretical and Applied Genetics. 2009;118:285–294. doi: 10.1007/s00122-008-0898-9. [DOI] [PubMed] [Google Scholar]
- Worland AJ. The influence of flowering time genes on environmental adaptability in European wheats. Euphytica. 1996;89:49–57. [Google Scholar]
- Worland AJ, Gale MD, Law CN. Wheat genetics. In: Lupton FGH, editor. Wheat breeding. New York: Chapman & Hall; 1987. pp. 129–171. [Google Scholar]
- Yan L, Fu D, Li C, Blechl A, Tranquilli G, Bonafede M, Sanchez A, Valarik M, Yasuda S, Dubcovsky J. The wheat and barley vernalization gene Vrn3 is an orthologue of. FT. Proceedings of the National Academy of Sciences, USA. 2006;103:19581–19586. doi: 10.1073/pnas.0607142103. [DOI] [PMC free article] [PubMed] [Google Scholar]
- Yan L, Loukoianov A, Blechl A, Tranquilli G, Ramakrishna W, San Miguel P, Bennetzen JL, Echenique V, Dubcovsky J. The wheat Vrn2 gene, a flowering repressor down-regulated by vernalization. Science. 2004;303:1640–1644. doi: 10.1126/science.1094305. [DOI] [PMC free article] [PubMed] [Google Scholar]
- Yan L, Loukoianov A, Tranquilli G, Helguera M, Fahima T, Dubcovsky J. Positional cloning of the wheat vernalization gene. Vrn1. Proceedings of the National Academy of Sciences, USA. 2003;100:6263–6268. doi: 10.1073/pnas.0937399100. [DOI] [PMC free article] [PubMed] [Google Scholar]
- Yoshida T, Nishida H, Zhu J, Nitcher R, Distelfed A, Akashi Y, Kato K, Dubcovsky J. Vrn-D4 is a vernalization gene located on the centromeric region of chromosome 5D in hexaploid wheat. Theoretical and Applied Genetics. 2010;120:543–552. doi: 10.1007/s00122-009-1174-3. [DOI] [PubMed] [Google Scholar]
- Youssefian S, Kirby EJM, Gale MD. Pleiotropic effects of the GA-insensitive Rht dwarfing genes in wheat. I. Effects on development of the ear, stem and leaves. Field Crops Research. 1992;28:179–190. [Google Scholar]
- Zadoks JC, Chang TT, Konzak CF. Decimal code for the growth stage of cereals. Weed Research. 1974;14:415–421. [Google Scholar]
- Zhou Y, Li W, Wu W, Chen Q, Mao D, Worland AJ. Genetic dissection of heading time and its components in rice. Theoretical and Applied Genetics. 2001;102:1236–1242. [Google Scholar]
Associated Data
This section collects any data citations, data availability statements, or supplementary materials included in this article.