


Abstract
Analysis of important human pathogen populations is currently under transition toward whole-genome sequencing of growing numbers of samples collected on a global scale. Since recombination in bacteria is often an important factor shaping their evolution by enabling resistance elements and virulence traits to rapidly transfer from one evolutionary lineage to another, it is highly beneficial to have access to tools that can detect recombination events. Multiple advanced statistical methods exist for such purposes; however, they are typically limited either to only a few samples or to data from relatively short regions of a total genome. By harnessing the power of recent advances in Bayesian modeling techniques, we introduce here a method for detecting homologous recombination events from whole-genome sequence data for bacterial population samples on a large scale. Our statistical approach can efficiently handle hundreds of whole genome sequenced population samples and identify separate origins of the recombinant sequence, offering an enhanced insight into the diversification of bacterial clones at the level of the whole genome. A data set of 241 whole genome sequences from an important pandemic lineage of Streptococcus pneumoniae is used together with multiple simulated data sets to demonstrate the potential of our approach.
INTRODUCTION
Recombination is recognized in bacteria as an important evolutionary force by which segments of DNA in the recipient organism are replaced by foreign segments from a donor cell. Recombination most commonly takes place between closely related bacterial strains and its frequency decreases with decreasing sequence similarity between the donor and recipient (1,2). Since the ability to recombine does not entirely vanish even between highly distinct bacteria, horizontal gene transfer is occasionally observed between distinct species (3). Consequently, the DNA sequence of a bacterium may be a mosaic of DNA from different ancestors, complicating the definition of the species concept in bacteria (4–6). Our focus here is on detecting imported homologous recombinant segments among a group of relatively closely related bacteria. Recombination has the potential to rapidly alter phenotypes of bacteria, for instance as a response to selective pressure from antibiotics. Hence, there is interest in the potential of recombination to disseminate antibiotic resistance and virulence determinants (7,8), as a result of the consequences for public health. Tools to detect and analyze recombination in whole genomes are therefore urgently required.
Statistical tests for detecting recombination in DNA started to appear more than two decades ago e.g. (9–11). Combination of recombination modeling with phylogenetic methods appeared in (12), who described a set of DNA sequences of length l in terms of a state sequence (S1,…, Sl), where each state Sj represents a particular tree topology. In this approach the optimal sequence of states is estimated using maximum parsimony. Early likelihood-based phylogenetic approaches (13,14) were based on estimating a phylogeny within a sliding window, which was moved across the genome. The purpose of this was to identify locations where the underlying phylogeny changes abruptly.
Within the last decade, Bayesian approaches have become popular within the phylogenetic framework for modeling recombination. In these approaches, the genome is divided into non-overlapping segments, each with a specific phylogeny describing the ancestral structure of that part of the genome (15,16), possibly coupled with another change-point process to account for heterogeneity in evolutionary parameters such as variations in the substitution rate (17–19). The computational burden caused by the super-exponential growth in the number of possible phylogenies as a function of the number of strains limits the use of the phylogenetic approaches to relatively small data sets. Even with the algorithmic refinements, the largest data sets analyzed in (19) consist of 15 strains only, which is an extremely limited number compared to data sets generally available today, see e.g. (7). Imposing further restrictions on the space of possible tree topologies facilitates the use of phylogenetic approaches to larger data sets, as discussed e.g. in (20). For example, one may use a fixed topology for all but a single strain, which may be added as a leaf node in different branches.
Besides the mentioned phylogenetic approaches, a few alternatives for modeling recombination have appeared in the recent years. A Bayesian approach in which a single phylogeny is estimated for the whole genome sequence as opposed to estimating several separate phylogenies for different genomic areas is presented in (21). The recombination as well as mutation events are then assumed to take place along the branches of the inferred phylogeny. The origins of the recombination events are not modeled, but it is assumed that recombination introduces novel substitutions at an unknown uniform rate. This approach was extended in (22) by considering locations in the estimated phylogeny as potential origins for the recombination events. However, these investigations were still limited to very few sequenced genomes due to the computational complexity of the adopted Monte Carlo approach.
Another line of Bayesian modeling for recombination uses a non-parametric clustering model (23). In this approach, the genome is divided into segments and clusterings of the strains within the segments are inferred, where a clustering corresponds to an assignment of strains into different ancestral chromosomes. Recently we introduced a method (24) (BRAT) which can efficiently handle several thousand samples containing multiple gene sequences. The core idea in BRAT is to use Bayesian clustering to detect genetically distinct clusters representing separate evolutionary lineages. These are then used as putative ancestral origins when probabilities of recombination events are estimated for each sample in the data set.
Some non-Bayesian methods for detecting recombination have been introduced in the recent years as well, and (25) carries out a simulation study for comparing the Bayesian phylogenetic-based approaches with some alternatives (see the article for a complete list of references). They conclude that the Bayesian approaches yield highly accurate results, however, at the expense of relatively heavy computational burden. Due to this, their simulation study is restricted to data sets consisting of four sequences only.
Given the large sizes of many bacterial data sets currently available, some applications have inferred recombination indirectly. For example, an association between recombination tendency and antibiotic resistance was recently demonstrated in (7), where the amount of recombination within a certain group of bacteria was estimated using population genetic, so-called admixture models (26,27). A typical outcome from such an analysis consists of the relative contributions of different inferred ancestral groups to the genetic composition of every sample, but without pinpointing the exact genomic locations of the segments assigned to the different origins.
To handle computational issues arising from the size and complexity of emerging population genomic data sets, we introduce here a next generation version of BRAT (BratNextGen). Our method is based on a Bayesian change-point clustering model such that the clusters can change over the genome. One of the clusters is given a special interpretation as comprising the non-recombining sequences, whereas sequences assigned to some other cluster within some genomic segment are considered as recombinant. This model formulation allows us to identify separate recombination origins at any given genome region facilitating the detection of evolutionarily related segments acquired independently in different lineages. A detailed analysis of the cps locus of Streptococcus pneumoniae illustrates how our method can further the understanding of the evolution of highly recombinogenic bacteria (28).
We initialize our algorithm by dividing the total genome into 5-kb regions and performing a clustering analysis separately in each of these segments. For summarizing the results from the clustering analyses we propose using a novel tree representation. This tree, termed a ‘proportion of shared ancestry’ (PSA) tree, is based on estimated values of the proportion of the genome where two sequences are clustered together by the clustering model, thus highligting groups of sequences having many recombinations in common.
Some comparisons between our method and the mentioned alternative approaches can be made. Our model is formulated for detecting imports from origins that are external to the current population of samples, being similar in this respect to the method presented in (21). However, unlike in (21), our method does not assume a single recombination origin differing from the observed samples at constant rate over the genome. On the other hand, our approach is different from methods presented in (22) and (24) in that it does not model recombination events between the observed samples.
Our approach may readily be applied to the challenge of the data sets produced by next-generation sequencing technologies, which are already being utilized to produce hundreds, and even thousands, of whole genomes from samples of bacterial communities. We provide the methods embedded in a user-friendly software package BratNextGen, which can be downloaded from http://www.helsinki.fi/bsg/software/BRAT-NextGen/ and used freely for academic purposes. The methods are implemented to facilitate straightforward parallel computation enabling a user to carry out recombination analyses of large whole genome bacterial data sets within a few hours.
MATERIALS AND METHODS
In this section, we formulate the Bayesian model for detecting recombinations and outline the algorithm that is utilized for optimizing the model. Supplementary Text contains the following additional three sections: ‘Details of model learning’ gives further details of our algorithm, ‘Blockwise clustering for initialization’ describes how the the search algorithm is initialized and the PSA tree estimated, and illustrates the PSA tree with simulated data (including illustrative Supplementary Figures S1–S4), and ‘Simulated test data sets’ provides details about how the simulated data sets were generated.
Bayesian model for locating recombination events
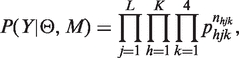
Let Y = {Yij}i=1, … , N, j=1, … , L denote the matrix of observed values at polymorphic sites in the aligned genome sequences available for a set of N sampled taxa, and  the distances between the polymorphic sites. D will be treated as fixed, and all distributions are interpreted to be conditional on D. For clarity, D is suppressed in the subsequent notation. In order to specify recombinations within sequences, we formulate our model in terms of the structural configuration M = {Mij}i=1, … , N, j=1, … , L, where the elements Mij specify the origins of the observations in Y. For example, if M15,3 = 2, the observed nucleotide at the third SNP in the sequence of the 15th taxon is assigned to an origin (or cluster) labeled by the integer 2. At each SNP j, M determines a clustering Sj = {sjh}h=1, … , K, where clusters are representing taxa having the same origin at SNP j. Here, sjh are disjoint sets whose union equals the set of all considered taxa. The integer-valued parameter K defines an upper bound for the number of distinct origins. In particular, we do not require all K clusters to be non-empty at an arbitrary site. Furthermore, the first cluster is always assigned a specific interpretation, representing taxa that are non-recombining at site j. Conversely, the taxa assigned to any other cluster are considered to be recombined at site j. The probability of the data Y given M and model parameters Θ is specified as:
 |
(1) |
where phjk is the relative frequency parameter for nucleotide k at the j-th SNP in cluster sjh, and nhjk is the corresponding observed count of the nucleotide in this cluster. The likelihood is derived by assuming that each observation Yij at SNP j assigned to cluster sjh follows a Multinomial(phj1,…, phj4)-distribution. In the likelihood (1) Θ represents jointly all the probability parameters phjk, which are assigned the prior
| (2) |
where α is a hyperparameter. Specification of this hyperparameter is discussed in detail below. To prune unnecessary parameters from the model, we use an empirical approach where the number of distinct alleles present in the whole set of taxa for any particular SNP is first determined, such that when less than four alleles are observed, cardinality of the parameter vector in the likelihood and prior expressions is reduced accordingly.
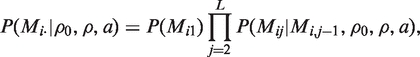
Let Mi· = (Mi1, Mi2,…, MiL) denote the sequence of origins of nucleotides observed at the L SNPs for the i-th taxon. We specify the prior distribution for M by modeling each Mi· independently as a Markov chain, with the following three parameters defining its transition matrix: ρ0, ρ, a. In detail, we set the joint probability of Mi· equal to
 |
where for simplicity we use p(Mi1) = 1/K. Assuming that the physical distance between the two SNPs indexed by j − 1 and j is given by dj−1,j, the transition matrix that determines the conditional distribution p(Mij|Mi, j−1, ρ0, ρ, a) is defined as
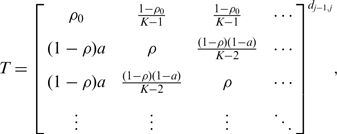 |
(3) |
which is obtained by raising the transition matrix between two consecutive sites to the power dj−1,j. Figure 1 presents a graphical illustration of the transition probabilities. The parameters of this transition matrix can be interpreted as follows: ρ0 denotes the conditional probability that the allele observed at a particular site corresponds to a non-recombining state, i.e. it is assigned to the non-recombining group (indexed by 1), if also the allele observed at the previous site had this state. The remaining probability mass (1 − ρ0) is evenly divided between all the other putative origins (clusters), which correspond to recombinogenic states. Parameter ρ denotes the probability analogous to ρ0 for the other putative origins of an allele transferred horizontally through recombination. In the chain of states determining the origins of alleles within a genome, the probability of transition from a recombinant state back to the non-recombining state equals (1 − ρ)a, where a is a probability that should be close to unity. The remaining probability mass (1 − ρ)(1 − a) is then evenly divided among the remaining K − 2 origins.
Figure 1.

Illustration of HMM transition probabilities. The figure presents an example of the transition distributions of the hidden Markov model underlying our modeling approach. In this example, the number of possible states (or clusters), K, is equal to 4, and sj−1 and sj represent states of the chain at two consecutive bases. The topmost state denoted by a square represents the non-recombinant state. The other three states denoted by filled circles represent possible recombinant states. The panel on the left shows possible transitions from the non-recombinant state. The panel on the right shows corresponding transitions from a single recombinant state. These transition probabilities are similar for all recombinant states. The meanings of the parameters are explained in detail in the text.
We assign prior distributions for the parameters ρ0, ρ and a governing the transition matrix as follows. First, parameter a is assigned a distribution favoring values close to unity:
| (4) |
where αa = 10 and βa = 1. The prior for ρ is chosen by considering the expected lengths of recombinant segments. Conditionally on ρ, the length l of a recombinant segment has a geometric distribution with mean μl = 1/(1 − ρ). A prior is implied for ρ by defining a uniform distribution for the mean over a sensible interval
| (5) |
In practice, we have used the boundaries aμ = 10 and bμ = 20 000 in all our analyses. The prior for ρ0 is selected by considering the probability that not a single recombination event exists in the whole sequence observed for any particular taxon. Let ϕ denote the probability that after starting the Markov chain from state labeled 1, the state does not change at all during all L* bases in the complete genomes. We then get
| (6) |
We now impose a prior on ρ0 by setting the distribution of ϕ according to
| (7) |
As opposed to (19) and other earlier approaches utilizing Markov chains for modeling recombination events, we prefer to parameterize the transition distribution in terms of ϕ as opposed to setting a distribution directly on ρ0, since a more intuitive interpretation can be assigned to ϕ and the resulting prior is more conservative in terms of false positive rate.
Finally, we describe the strategy for specifying the hyperparameter α, which is used in the prior (2) for the nucleotide frequency parameters. The information represented by this prior can be interpreted to correspond to α a priori observations that are evenly distributed among alternative nucleotides. Typical non-informative choices used in clustering include e.g. α = 1 (29) or α = 4 (27). Parameter α represents the amount of variation that we expect to observe within a particular cluster. For example, α = 4 leads to a uniform distribution for the nucleotide frequencies, whereas the choice α = 1 favors clusters in which the frequencies are concentrated closer to the extremes (0 or 1). Consequently, the parameter α influences the number of clusters that will be learned by a clustering procedure. By setting α very close to zero, all taxa will be separated by the clustering unless they have identical data. Conversely, by setting α to a very large value, all taxa will be clustered to a single cluster. In the current method, we consider the sampled taxa in general to be representable by a single cluster corresponding to a set of closely related bacteria, such that some segments in the observed sequences are imported from a source outside the clonally related group. For such data, it is appropriate to use a relatively large value of α favoring a priori a single cluster at an arbitrary position in the genome. To derive a suitable value of α for any given data set, we developed the following empirical strategy which was found to produce reasonable results for a wide range of different data sets: (1) under the condition that all taxa are assigned to a single cluster, calculate the maximum a posteriori (MAP) estimate of the parameter αj separately at each variable site j (MAP values can be obtained in a straightforward manner using routine numerical optimization under a non-informative uniform prior for αj), (2) take the 90th percentile of the MAP estimates and use this value as the hyperparameter α.
In the current context of detecting recombination events, the parameter α can be interpreted from two different perspectives. First, it can be interpreted from an operational point of view merely as a parameter controlling the trade off between sensitivity and false positive rate. A lower value means that some genomic segment is more often considered as not belonging to the non-recombining origin, leading to higher sensitivity, but also to an increased false positive rate. The alternative interpretation of α is to consider its relation to the mutation rate. A higher value of α favors fewer clusters at any particular site, and consequently, because in our method the non-recombining cluster corresponds to a set of clonally related sequences, a larger fraction of the molecular variation among the sequences is to be explained by mutation. Despite this apparent relation between α and a mutation rate parameter, an exact mapping between these two parameters does not seem to be accessible within our method.
Model learning
The major prerequisites we set up when developing our learning algorithm are scalability to large data sets and low false positive rate. These goals are achieved by using an approach outlined as follows (the exact details of these steps are explained in section ‘Details of model learning’ in the Supplementary Data):
Use fast heuristics for learning an initial model M.
- Use MCMC-like iterative approach for refining the initial model M, where the learning procedure alternates between the two operators:
- Update each Mi·, i = 1, … , N, using p(Mi· |M−i, ρ0, ρ, a, Y), where M−i denotes the model with Mi· excluded. The conditional distribution is obtained by using the standard forward–backward algorithm for hidden Markov models.
- Update ρ0, ρ, a by analytically maximizing p(ρ0, ρ, a|M, Y).
When convergence is reached in Step 2, inferences are summarized by reporting all genome segments for which p(Mij = 1|M−i, ρ0, ρ, a, Y) < 0.01 as recombinant. This condition implies that the conditional probability of the non-recombining state is <0.01 over all such intervals.
(Optional) For a given number of permutation cycles, permute the columns of Y and repeat the analysis (Steps 1–3) for the permuted data. Compare the results from these permutation-based analyses with the results for the original data, which enables empirical calculation of the statistical significance of detected recombinant segments.
The Step 4 of our algorithm can be considered as optional, however, it is highly recommended. The rationale behind permutation of the columns in the data matrix is that if the observed difference between a pair of taxa is caused by recombination, then the divergent SNPs are expected to be densely clustered within the genomic area affected by a recombination event. In contrast, if the difference is due to variation caused by mutations, the diverging SNPs are expected to be relatively randomly distributed across the genome. Thus, by permuting the columns of the data matrix, one obtains the null distribution of the differences under a mutation-driven process of taxon evolution. The additional step is particularly important when only very limited or no recombination has taken place among the taxa. Under such circumstances differences caused by population structure may otherwise be falsely identified as recombinations, as pointed out in the ‘Discussion’ section.
RESULTS
Analysis of simulated data sets
Given the wide spectrum of recombination rates occurring in natural bacterial populations, we confirmed the accuracy of BratNextGen inferences using a range of different recombination scenarios. To investigate the statistical power and false positive rate for recombination detection, we analyzed simulated data sets generated by varying the following factors: the lengths of the recombinant segments, the level of phylogenetic variation in data (i.e. the distance from the root of the tree to any one of the tips), the number of recombination events and their origins. For exact details of the synthetic data generation, see the ‘Simulated test data sets’ section in the Supplementary Data.
The tree shown in Figure 2 was used to generate a population of sequences of length 1 Mb. Distances between sequences belonging to different colored clusters in Figure 2 are shown in Table 1. Only the cyan-colored taxa were included in the analysis as samples from which sequences were observed, such that recombination events from other unobserved branches in the tree had been inserted to the observed sequences. Depending on the distance of the donor branch from the branch of cyan-colored taxa in the tree, the origin of the recombination was considered either as ‘close’ (red), ‘distant’ (green) or ‘medium distant’ (blue) from the sampled taxa. A recombination event was flagged as detected if the true segment overlapped some segment deemed significantly recombinant by our method. Correspondingly, all segments claimed significantly recombinant were flagged as false positives when they did not overlap any true recombinant segments.
Figure 2.

Simulated phylogenetic tree. The figure shows the phylogenetic tree used for generating the simulated sequences. Depending on the simulation setup, the height of the tree, d, was selected to be either 0.01 or 0.03 in units of substitutions per site (see Table 2). The cyan-colored taxa correspond to the sampled data and they are assigned some number of recombination events from sequences of taxa present in other branches. The smaller panel zooms in to the structure of the cyan-colored branch.
Table 1.
Distances in the simulated data
| Cyan | Red | Blue | Green | |
|---|---|---|---|---|
| Cyan | 0.26 | 1.1 | 5.2 | 20 |
| Red | 0.27 | 5.3 | 20 | |
| Blue | 0.91 | 20 | ||
| Green | 0.98 |
The table presents average numbers of differences per 1 kb between sequences belonging to different clusters in the simulated data set before recombination events were introduced and when the height of the tree d was equal to 0.01. The distances corresponding to d = 0.03 can be obtained approximately by multiplying the entries in the table by a factor of three. The average distances between members of different clusters are shown on the diagonal.
The results of our simulation study are summarized in Table 2. In addition, Figure 3 provides graphical illustration of the true and detected significant recombinations for one of the data sets corresponding to row 3 in Table 2. The following general conclusions can be drawn from the simulation results: (1) the false positive rate remains low under all simulation settings. In Figure 3 the data set with the highest rate of false positives is shown. Even here the rate is low (<10%) relative to the true positives; (2) sensitivity to detect recombination events from a distant origin was high in all data sets (70-100%). Conversely, sensitivity to detect recombination events from a close origin was near zero in all data sets. For example, in Figure 3(a) recombination events from the red (closely related) origin are evident while they are normally not seen in Figure 3(b). Sensitivity to detect recombinations from a medium distant branch was between these two extremes. This is entirely reasonable, as there is no statistical basis to identify a recombination event when the (unobserved) donor sequence is highly similar to the recipient sequence, whereas the power increases with increasing evolutionary distance; (3) sensitivity appears highest when only a limited number of recombination events is present in data, which can be explained by differences in the level of variation over genomes. In a nutshell, a particular genome segment can be detected as significantly recombinant if it is more distinct from the comparable non-recombining sequences than on average over the genome. If a genome sequence contains traces of a very large number of recombination events, then the average over-genome distance to non-recombining sequences is elevated, leading to a decreased sensitivity; (4) increasing height of the generating tree seems to lead to a minor decrease both in the sensitivity and the false positive rate, which may be due to the fact that for tall trees the level of variation within the sampled taxa will be higher, thus making it generally harder to detect significantly recombinant segments. The effect of this does not seem to be fully compensated by the increasing molecular distance between the putative origins of a recombinant genome segment.
Table 2.
Results, simulated data
| Parameters | Results | ||||||||
|---|---|---|---|---|---|---|---|---|---|
| d | Rec | Mean | Mut | Tot | Mut/tot | Close | Middle | Far | Falsep |
| 0.01 | 10 | 6000 | 1245 | 2239 | 0.56 | 0/5 | 8/9 | 16/ 16 | 4 |
| 0.01 | 100 | 6000 | 1245 | 6926 | 0.18 | 11/94 | 57/137 | 117/ 122 | 0 |
| 0.01 | 250 | 2000 | 1245 | 5844 | 0.21 | 14/151 | 202/382 | 282/ 321 | 54 |
| 0.03 | 10 | 6000 | 3864 | 5273 | 0.73 | 0/4 | 14/14 | 7/ 7 | 0 |
| 0.03 | 100 | 6000 | 3864 | 21589 | 0.18 | 4/77 | 12/111 | 115/ 165 | 0 |
| 0.03 | 250 | 2000 | 3864 | 18834 | 0.21 | 30/175 | 171/344 | 279/ 313 | 2 |
| * | 615 | 6300 | 6521 | 57433 | 0.11 |
The table summarizes the results from simulated data sets. The columns refer to: d, the height of the generating phylogenetic tree; rec, number of recombination events; mean, the mean recombinant segment length; mut, the number of SNPs before recombination; tot, the number of SNPs after recombination is included; mut/tot, ratio of the previous two; close, x/y; where y is the number of recombination imports from the closest branch (a recombination event affecting a branch with, say, 4 samples, was counted as 4 imported segments), and x is the number of these imports that are significantly detected, middle, the same as ‘close’ except that imports from the branch that is medium distant from the sampled taxa is considered; far, the same as ‘close’, except that imports from the furthest branch are considered; falsep, the number of falsely detected recombination events. The last row marked with an asterisk shows for comparison characteristics of the S. pneumoniae data as estimatedin (28). When comparing these values, note that the length of the S. pneumoniae sequences is 2.2 Mb, while the length of the simulated sequences is 1 Mb.
Figure 3.

Simulated data, 250 recombinations. The figure shows the results of the analysis of a simulated data set with 250 recombination events corresponding to row 3 in Table 2. The y-axis represents our simulated sampled taxa, and the x-axis the position along the genome. The taxa are ordered such that the first (lowest) taxon is the first one from left in Figure 2. The panel on top shows the true recombination events in the simulated sequences. The panel at the bottom shows significantly detected recombinations. For illustration purposes, the detected segments are colored using the color of the true origin within the segment. If a detected segment overlaps more than one true segment, the color is arbitrarily selected between the alternative colors. If a detected segment is false positive (i.e. does not overlap with any true recombined segment), it is colored black.
Streptococcus pneumoniae
To test the potential of BratNextGen with a large set of taxa for which whole genome data are available, we analyzed a recently published set of 241 complete genomes of S. pneumoniae isolates from the PMEN1 lineage (28). For these data a total of 39 107 polymorphic sites were identified in the 2 221 315 bp alignment. Due to a highly non-uniform distribution of the polymorphic sites over the genome (28), a standard phylogenetic tree is expected to be mostly determined by the relatively short genomic segments harboring the majority of the variable sites. The pneumococcus is known to be relatively recombinogenic, and this data set has already been analyzed in an attempt to detect genetic material imported from other lineages (28). It is hence particularly useful both for testing our new method and for a comparison with the results from earlier analyses. A single run of BratNextGen with the S. pneumoniae data took less than 2 h on a single processor of a standard desktop PC. An additional assessment of statistical significance based on permutation re-sampling of the polymorphic sites (see ‘Materials and Methods’ section) was performed by executing our algorithm 100 times on a cluster computer. Since all these runs were done in parallel, the total running time of the analysis was approximately the same as that of a single run. This can be compared with the analysis of 4 whole genomes of Salmonella enterica using the method presented in (21) taking 72 h.
The detected recombination events are displayed graphically in Figure 4 and the exact positions of these segments are written in Supplementary Tables S1 and S2. For comparison, Supplementary Figure S5 shows the recombination events detected in (28) for these same data using a different method. It is immediately evident that the pattern of recombinations detected in the two separate analyses is highly similar. The tree representing the proportion of shared ancestry and the clusters inferred from it are also shown in Figure 4. Table 3 breaks down these clusters with respect to countries of origin for the isolates, and Supplementary Table S3 contains more detailed information about the taxa cluster-wise.
Figure 4.

Results of recombination analysis for S. pneumoniae data. The figure shows the results of our analysis of 241 S. pneumoniae isolates. On the left, the PSA tree is shown. The tree is cut at threshold level 0.25 to produce 6 clusters, colored as blue, green, red, cyan, magenta and yellow, respectively. Summary information about the cluster contents is given in Table 3, while more detailed information about the samples is provided in the Supplementary Table S3. On the right, a horizontal colored bar showing the indicated recombination events is displayed for each sample. The colors of the detected segments indicate the cluster in which the segment is most prevalent. Gray color is used to show missing SNPs.
Table 3.
Contents of clusters for S. pneumoniae
| 1-blue | 2-green | 3-red | 4-cyan | 5-magenta | 6-yellow | |
|---|---|---|---|---|---|---|
| Argentina | 0 | 1 | 0 | 0 | 0 | 0 |
| Canada | 4 | 2 | 0 | 0 | 0 | 0 |
| China | 10 | 0 | 0 | 0 | 0 | 0 |
| Colombia | 0 | 0 | 0 | 0 | 1 | 0 |
| Croatia | 0 | 2 | 0 | 0 | 0 | 0 |
| Denmark | 1 | 5 | 0 | 0 | 2 | 0 |
| France | 0 | 7 | 0 | 0 | 2 | 0 |
| Germany | 1 | 19 | 0 | 0 | 3 | 0 |
| Korea | 12 | 0 | 0 | 5 | 0 | 0 |
| Malaysia | 3 | 0 | 0 | 0 | 0 | 0 |
| Mexico | 0 | 12 | 0 | 0 | 0 | 0 |
| Portugal | 0 | 1 | 0 | 0 | 0 | 0 |
| Russia | 8 | 0 | 0 | 0 | 0 | 0 |
| Singapore | 4 | 0 | 0 | 0 | 0 | 0 |
| South Africa | 3 | 1 | 31 | 0 | 2 | 0 |
| Spain | 0 | 18 | 0 | 0 | 2 | 0 |
| Thailand | 3 | 0 | 0 | 0 | 1 | 0 |
| Turkey | 0 | 5 | 0 | 4 | 2 | 0 |
| UK | 2 | 11 | 1 | 0 | 5 | 0 |
| Uruguay | 0 | 3 | 0 | 0 | 0 | 0 |
| USA | 18 | 2 | 0 | 0 | 0 | 11 |
| Vietnam | 0 | 0 | 0 | 0 | 11 | 0 |
The table summarizes the S. pneumoniae clusters on the basis of the geographic sampling locations of the isolates.
Maximum likelihood trees for the S. pneumoniae data set computed before and after recombination was removed from the data set, are presented in (28). These trees are shown in Figure 5(a) and (b), respectively. Comparison of clusters obtained from BratNextGen output with these trees shows the results are entirely congruent with those outlined in (28) also in this respect. Clusters evident from both phylogenies, such as a clade associated with transmission to Vietnam (magenta), a group of serotype 6A strains (cyan) and serotype 19A vaccine-escape isolates from the USA (yellow), were identified by BratNextGen. The algorithm was also able to distinguish the internationally distributed subpopulation (dark blue) from the ancestral European population (green), despite little distinction being found between these groups in the tree shown in in Figure 5(a). Furthermore, the cluster into which most of the South African isolates fall (red) corresponds exactly with that found in the tree in Figure 5(b), despite one of these strains being distant from the other taxa in the tree in Figure 5(a). Hence BratNextGen is capable of accurately detecting relationships among even highly recombinogenic bacteria.
Figure 5.

Maximum likelihood phylogenetic trees for S. pneumoniae data. (a) and (b) show the maximum likelihood phylogenetic trees for S. pneumoniae data, constructed using either all data or polymorphisms outside any inferred recombination events, respectively (28). Both trees are drawn as unrooted. The clustering obtained from our analysis using the PSA tree in Figure 4 is indicated in the trees by coloring the leaf nodes using the same cluster specific colors as in Figure 4.
The pneumococcal capsule, crucial for the bacteriums virulence, has over 90 different forms (serotypes). Almost all of these are encoded by alternative gene cassettes at the cps locus, which vary between ~10 kb and ~30 kb in length (30). Streptococcus pneumoniae is able to switch serotype by replacing this region of the chromosome via horizontal acquisition of a different gene cassette. Unlike the previous analysis (28), BratNextGen allows the identification of separate imports from the same ancestral origin. A detailed view of the BratNextGen analysis at the cps locus presented in Figure 6 indicates the isolates that have undergone serotype switching as having high levels of admixture in this region; furthermore, isolates that have independently switched to the same serotype show similar patterns of admixture, allowing convergent evolution to be easily identified. This indicates that the separately acquired cps loci of the same serotype are very similar.
Figure 6.

Detailed results for the cps locus. The panel on top shows results from our analysis of the S. pneumoniae data set zoomed in to sequence positions 0.29–0.33 Mb comprising the cps locus. The isolates which have undergone serotype switching have been marked on the right of the panel. The clustering of the samples at two specific SNP positions indicated by vertical dotted lines in the plot is given in Supplementary Table S3. The wchA gene discussed in the text is located below the rightmost dotted line. The panel at the bottom shows a maximum likelihood phylogeny for the region containing the wchA gene (see text for details).
However, there is also evidence for cps locus diversity between isolates of the same serotype. Strain UR428, while remaining serotype 23F, appears to have horizontally acquired sequence within the wchA gene that, according to BratNextGen, shows similarity with wchA from PMEN1 strains that have acquired a 6A type capsule. To study the provenance of this sequence in more detail, all the PMEN1 sequences with >50% coverage of this region were aligned to wchA reference sequences for all available serotypes, plus wchA genes from a collection of serogroup 6 sequences (30,31). A maximum likelihood phylogeny in Figure 6 shows that the serogroup 6 sequences (marked in blue) lie in a handful of clusters, interspersed among those of the other serotypes. In agreement with the BratNextGen analysis, wchA from UR428 is more closely related to the alleles in the PMEN1 serotype 6A switched isolates, themselves identical to a version of the gene in an unrelated Korean 6A ST2756 strain (31), than the alleles in the ancestral serotype 23F cps locus.
Despite this instance of mosaicism within the locus, there is evidence for a surprising level of homogeneity within serotypes, given the length of time these cps loci have spent in the highly recombinogenic pneumococcal chromosome. The wchA sequences from both the PMEN1 lineage and the unrelated strain BM4200 are very similar to the reference version, and the three independent acquisitions of the 19A locus within the PMEN1 lineage all cluster with the 19A reference wchA. This suggests either the high levels of divergence distinguishing the different gene clusters is enough to prevent mosaicism arising, hence the observed recombination arising in this data set is rare, or that selection maintains a conserved set of efficiently co-operating genes. Only further sequencing will distinguish these two possibilities.
DISCUSSION
We have introduced a novel approach that enables rapid exploratory analysis of recombination events in large-scale whole genome bacterial data sets. Two particularly important goals from the application perspective are scalability to large collections of taxa and low false positive rate, which are both met by our method. Furthermore, our method is able to identify overlapping independent imports from the same ancestral origin, facilitating a more detailed understanding of bacterial evolution as illustrated by our analysis of the S. pneumoniae data set.
Our approach can be summarized as follows. First, the core of our method is a Bayesian change-point clustering model, which is used to detect taxa that are, within some genomic areas, more distinct from other taxa than would be expected by mutation-driven evolutionary processes alone. Second, initialization of our recombination model configuration is done by using separate clusterings of taxa over fixed-width genomic intervals and then combining these results in a parsimonious manner such that the cluster label of a taxon changes as seldom as possible over the whole genome. The clustering analyses are summarized by the proportion of shared ancestry tree, which reflects the proportion of genome where any two particular taxa are clustered together. Using this tree a set of clusters can be specified simultaneously for all taxa. Analyses with simulated data (see Supplementary Text) and S. pneumoniae data set demonstrate that such a tree is able to highlight sequences which share many recombinations and, consequently, are likely to belong to the same branch in the underlying phylogenetic tree. Finally, an evaluation of the statistical significance of the detected recombinant segments in frequentist terms can be obtained by replicating the analysis with data obtained through random permutation of the columns of the original data matrix. This permutation re-sampling procedure yields empirical P-values for the identified recombinant segments, see e.g. (32).
A distinctive feature of our approach is the permutation re-sampling procedure that is utilized on top of the Bayesian model learning machinery. While such strategies are commonly used to obtain reasonable multiple-testing corrections in association studies (33), one might still argue that if all information about the problem is included in a Bayesian model, the permutation procedure would be inconsequential. However, to see beyond this simple theoretical argument, one needs to consider the general limitations related to statistical modeling and detection of recombinations in large-scale data. It is known from both experimental observations (1) and more recent whole genome analyses (22) that homologous recombination is more frequent between more closely related strains, and specifically sequences. This gives rise however, to concerns over the identifiability of recombination events between very close relatives. In the most extreme case the sequences are identical, and, consequently, within the Bayesian inferential paradigm detection of recombination events is then mainly determined by the prior distributions, which results in considerable statistical uncertainty as mentioned also in (22). In our approach this problem becomes relevant when analysing data sets harboring only very limited traces of recombination events. Under such circumstances, depending on the choice of model hyperparameters, the model may falsely consider mutation-based differences caused by population structure as evidence for recombination. A particularly advantageous feature of the permutation re-sampling procedure is that it allows us to detect and discard such false positives.
The second statistical non-identifiability issue concerns statements about which sequence is recombining and which represents the original clonal ancestry. For example, suppose that a group of related taxa can be divided into two subgroups s1 and s2, that are highly distinct at some locus A, but highly similar elsewhere. Then, either s1 or s2 can be recombinant at locus A but, based on data, it may be impossible to decide which of the two hypotheses is correct. If one of the sub-groups is very small compared to the other, then it may be reasonable to consider the smaller group as recombining. On the other hand, if the groups are approximately of the same size, then the issue would remain unresolved. An alternative way of considering this problem is to examine a phylogeny with two branches, such that leaf nodes in the two branches correspond to the taxa in s1 and s2, respectively. Only when the tree is rooted and the root is assumed non-recombinant, it becomes possible to determine which of the two branches is recombining. It should be noticed that the biological conclusions drawn under the two alternative hypotheses may be considerably different. In this respect, our model follows the principle favoring the simplest explanation, meaning that the cluster containing the majority of taxa is considered as non-recombining. For this reason, in our simulation study, if a recombination event affected a branch containing the majority of taxa, the sequences representing the complement of this group were considered as recombinant while evaluating the results.
The model above is developed for the detection of recombinant material introduced into a closely related set of bacteria over the process of their diversification. The design is motivated by data sets of individual virulent or drug resistant lineages, and it should be noted that the above model is likely to be sub-optimal for the analysis of data from highly structured populations (as observed in our simulations where both false and true positive rates decreased when overall genetic diversity increased). We are currently developing the proposed model and the inference algorithm to handle such issues and generalize the method to alternative data sets.
SUPPLEMENTARY DATA
Supplementary Data are available at NAR Online: Supplementary Tables 1–3, Supplementary Text, Supplementary Figures 1–5 and Supplementary References [34–41].
FUNDING
Academy of Finland to the Pubgensens project (to P.M.); ERC (239784, to J.C.); Sigrid Juselius Foundation (to J.C.); National Institute of General Medical Sciences (U54GM088558, to W.P.H.). Funding for open access charge: Academy of Finland to the Pubgensens project.
Conflict of interest statement. None declared.
Supplementary Material
ACKNOWLEDGEMENTS
The content is solely the responsibility of the authors and does not necessarily represent the official views of the National Institute Of General Medical Sciences or the National Institutes of Health.
REFERENCES
- 1.Majewski J. Sexual isolation in bacteria. FEMS Microbiol. Lett. 2001;199:161–169. doi: 10.1111/j.1574-6968.2001.tb10668.x. [DOI] [PubMed] [Google Scholar]
- 2.Fraser C, Hanage W, Spratt B. Recombination and the nature of bacterial speciation. Science. 2007;315:476–480. doi: 10.1126/science.1127573. [DOI] [PMC free article] [PubMed] [Google Scholar]
- 3.Jain R, Rivera M, Moore J, Lake J. Horizontal gene transfer in microbial genome evolution. Theor. Popul. Biol. 2002;61:489–495. doi: 10.1006/tpbi.2002.1596. [DOI] [PubMed] [Google Scholar]
- 4.Lawrence J. Gene transfer in bacteria: speciation without species? Theor. Popul. Biol. 2002;61:449–460. doi: 10.1006/tpbi.2002.1587. [DOI] [PubMed] [Google Scholar]
- 5.Hanage W, Fraser C, Spratt B. Fuzzy species among recombinogenic bacteria. BMC Biol. 2005;3:6. doi: 10.1186/1741-7007-3-6. [DOI] [PMC free article] [PubMed] [Google Scholar]
- 6.Cohan F, Perry E. A systematics for discovering the fundamental units of bacterial diversity. Curr. Biol. 2007;17:373–386. doi: 10.1016/j.cub.2007.03.032. [DOI] [PubMed] [Google Scholar]
- 7.Hanage W, Fraser C, Tang J, Connor T, Corander J. Hyper-recombination, diversity, and antibiotic resistance in pneumococcus. Science. 2009;324:1454–1457. doi: 10.1126/science.1171908. [DOI] [PubMed] [Google Scholar]
- 8.Wiersinga W, Van der Poll T, White N, Day N, Peacock S. Melioidosis: insights into the pathogenicity of Burkholderia pseudomallei. Nat. Rev. Microbiol. 2006;4:272–282. doi: 10.1038/nrmicro1385. [DOI] [PubMed] [Google Scholar]
- 9.Sawyer S. Statistical tests for detecting gene conversion. Mol. Biol. Evol. 1989;6:526–538. doi: 10.1093/oxfordjournals.molbev.a040567. [DOI] [PubMed] [Google Scholar]
- 10.Maynard Smith J. Analyzing the mosaic structure of genes. J. Mol. Evol. 1992;34:126–129. doi: 10.1007/BF00182389. [DOI] [PubMed] [Google Scholar]
- 11.Maynard Smith J, Smith N. Detecting recombination from gene trees. Mol. Biol. Evol. 1998;15:590–599. doi: 10.1093/oxfordjournals.molbev.a025960. [DOI] [PubMed] [Google Scholar]
- 12.Hein J. A heuristic method to reconstruct the history of sequences subject to recombination. J. Mol. Evol. 1993;36:396–405. [Google Scholar]
- 13.Grassly N, Holmes E. A likelihood method for the detection of selection and recombination using nucleotide sequences. Mol. Biol. Evol. 1997;14:239–247. doi: 10.1093/oxfordjournals.molbev.a025760. [DOI] [PubMed] [Google Scholar]
- 14.McGuire G, Wright F. TOPAL 2.0: improved detection of mosaic sequences within multiple alignments. Bioinformatics. 2000;16:130–134. doi: 10.1093/bioinformatics/16.2.130. [DOI] [PubMed] [Google Scholar]
- 15.Suchard M, Weiss R, Dorman K, Sinsheimer J. Inferring spatial phylogenetic variation along nucleotide sequences. J. Am. Stat. Assoc. 2003;98:427–437. [Google Scholar]
- 16.Husmeier D, McGuire G. Detecting recombination in 4-taxa DNA sequence alignments with Bayesian hidden Markov models and Markov chain Monte Carlo. Mol. Biol. Evol. 2003;20:315–337. doi: 10.1093/molbev/msg039. [DOI] [PubMed] [Google Scholar]
- 17.Minin V, Dorman K, Fang F, Suchard M. Dual multiple change-point model leads to more accurate recombination detection. Bioinformatics. 2005;21:3034–3042. doi: 10.1093/bioinformatics/bti459. [DOI] [PubMed] [Google Scholar]
- 18.Husmeier D. Discriminating between rate heterogeneity and interspecific recombination in DNA sequence alignments with phylogenetic factorial hidden Markov models. Bioinformatics. 2005;21(Suppl. 2):ii166–ii172. doi: 10.1093/bioinformatics/bti1127. [DOI] [PubMed] [Google Scholar]
- 19.Webb A, Hancock J, Holmes C. Phylogenetic inference under recombination using Bayesian stochastic topology selection. Bioinformatics. 2009;25:197–203. doi: 10.1093/bioinformatics/btn607. [DOI] [PMC free article] [PubMed] [Google Scholar]
- 20.Husmeier D, Mantzaris A. Addressing the shortcomings of three recent Bayesian methods for detecting interspecific recombination in DNA sequence alignments. Stat. Appl. Genet. Mol. Biol. 2008;7:34. doi: 10.2202/1544-6115.1399. [DOI] [PubMed] [Google Scholar]
- 21.Didelot X, Falush D. Inference of bacterial microevolution using multilocus sequence data. Genetics. 2007;175:1251–1266. doi: 10.1534/genetics.106.063305. [DOI] [PMC free article] [PubMed] [Google Scholar]
- 22.Didelot X, Lawson D, Darling A, Falush D. Inference of homologous recombination in bacteria using whole-genome sequences. Genetics. 2010;186:1435–1449. doi: 10.1534/genetics.110.120121. [DOI] [PMC free article] [PubMed] [Google Scholar]
- 23.Xing E, Sohn K. Hidden Markov Dirichlet process: modeling genetic inference in open ancestral space. Bayesian Analysis. 2007;2:501–528. [Google Scholar]
- 24.Marttinen P, Baldwin A, Hanage W, Dowson C, Mahenthiralingam E, Corander J. Bayesian modeling of recombination events in bacterial populations. BMC Bioinf. 2008;9:421. doi: 10.1186/1471-2105-9-421. [DOI] [PMC free article] [PubMed] [Google Scholar]
- 25.Chan C, Beiko R, Ragan M. Detecting recombination in evolving nucleotide sequences. BMC Bioinf. 2006;7:412. doi: 10.1186/1471-2105-7-412. [DOI] [PMC free article] [PubMed] [Google Scholar]
- 26.Corander J, Marttinen P. Bayesian identification of admixture events using multilocus molecular markers. Mol. Ecol. 2006;15:2833–2843. doi: 10.1111/j.1365-294X.2006.02994.x. [DOI] [PubMed] [Google Scholar]
- 27.Pritchard J, Stephens M, Donnelly P. Inference of population structure using multilocus genotype data. Genetics. 2000;155:945–959. doi: 10.1093/genetics/155.2.945. [DOI] [PMC free article] [PubMed] [Google Scholar]
- 28.Croucher N, Harris S, Fraser C, Quail M, Burton J, van der Linden M, McGee L, von Gottberg A, Song J, Ko K, et al. Rapid pneumococcal evolution in response to clinical interventions. Science. 2011;331:430–434. doi: 10.1126/science.1198545. [DOI] [PMC free article] [PubMed] [Google Scholar]
- 29.Corander J, Marttinen P, Sirén J, Tang J. Enhanced Bayesian modelling in BAPS software for learning genetic structures of populations. BMC Bioinf. 2008;9:539. doi: 10.1186/1471-2105-9-539. [DOI] [PMC free article] [PubMed] [Google Scholar]
- 30.Bentley S, Aanensen D, Mavroidi A, Saunders D, Rabbinowitsch E, Collins M, Donohoe K, Harris D, Murphy L, Quail M, et al. Genetic analysis of the capsular biosynthetic locus from all 90 pneumococcal serotypes. PLoS Genet. 2006;2:e31. doi: 10.1371/journal.pgen.0020031. [DOI] [PMC free article] [PubMed] [Google Scholar]
- 31.Song J, Baek J, Ko K. Comparison of capsular genes of streptococcus pneumoniae serotype 6a, 6b, 6c, and 6d isolates. J. Clin. Microbiol. 2011;49:1758–1764. doi: 10.1128/JCM.02628-10. [DOI] [PMC free article] [PubMed] [Google Scholar]
- 32.Good P. Permutation, Parametric and Bootstrap Tests of Hypotheses. New York: Springer; 2005. [Google Scholar]
- 33.Balding D. A tutorial on statistical methods for population association studies. Nat. Rev. Genet. 2006;7:781–791. doi: 10.1038/nrg1916. [DOI] [PubMed] [Google Scholar]
- 34.Bishop C. Pattern Recognition and Machine Learning. Vol. 4. New York: Springer; 2006. [Google Scholar]
- 35.Neapolitan R. Learning Bayesian Networks. Upper Saddle River, NJ: Pearson Prentice Hall; 2004. [Google Scholar]
- 36.Kass R, Raftery AE. Bayes factors. J. Am. Stat. Assoc. 1995;90:773–795. [Google Scholar]
- 37.Tang J, Hanage W, Fraser C, Corander J. Identifying currents in the gene pool for bacterial populations using an integrative approach. PLoS Comput. Biol. 2009;5:e1000455. doi: 10.1371/journal.pcbi.1000455. [DOI] [PMC free article] [PubMed] [Google Scholar]
- 38.Mardia K, Kent J, Bibby J. Multivariate analysis. San Diego: Academic press; 1980. [Google Scholar]
- 39.Arenas M, Posada D. Recodon: coalescent simulation of coding DNA sequences with recombination, migration and demography. BMC Bioinf. 2007;8:458. doi: 10.1186/1471-2105-8-458. [DOI] [PMC free article] [PubMed] [Google Scholar]
- 40.Rambaut A, Grass N. Seq-Gen: an application for the Monte Carlo simulation of DNA sequence evolution along phylogenetic trees. CABIOS, Comput. Appl. Biosci. 1997;13:235–238. doi: 10.1093/bioinformatics/13.3.235. [DOI] [PubMed] [Google Scholar]
- 41.Hasegawa M, Kishino H, Yano T. Dating of the human-ape splitting by a molecular clock of mitochondrial DNA. J. Mol. Evol. 1985;22:160–174. doi: 10.1007/BF02101694. [DOI] [PubMed] [Google Scholar]
Associated Data
This section collects any data citations, data availability statements, or supplementary materials included in this article.