

Abstract
Aims/hypothesis
Insulin has anti-inflammatory effects in short-term experiments. However, the effects of chronic insulin administration on inflammation are unknown. We hypothesised that chronic insulin administration would beneficially alter adipose tissue inflammation and several circulating inflammatory markers.
Methods
We administered two forms of long-acting insulin, insulin glargine (A21Gly,B31Arg,B32Arg human insulin) and insulin detemir (B29Lys[ε-tetradecanoyl],desB30 human insulin), to LDL-receptor-deficient mice. After 8 weeks on a diet that causes obesity, hyperglycaemia, adipose tissue macrophage accumulation and atherosclerosis, the mice received subcutaneous glargine, detemir or NaCl (control) for 12 weeks. Serum amyloid A (SAA) and serum amyloid P (SAP), metabolic variables, adipose tissue macrophages and aortic atherosclerosis were evaluated.
Results
Weight gain was equivalent in all groups. The glycated haemoglobin level fell equivalently in both insulin-treated groups. Plasma cholesterol and triacylglycerol levels, and hepatic triacylglycerol level significantly improved in the glargine compared with the detemir or control groups. Levels of mRNA expression for monocyte chemotactic protein-1 and F4/80, a macrophage marker, in adipose tissue were decreased only in the glargine group (p<0.05). Visceral adipose tissue macrophage content decreased in both insulin groups (p<0.05), whereas atherosclerosis decreased only in the glargine group. Circulating SAA and SAP did not decrease in either insulin-treated group, but IL-6 levels fell in the glargine-treated mice.
Conclusions/interpretation
While chronic insulin administration did not decrease SAA and SAP, administration of glargine but not detemir insulin improved dyslipidaemia, IL-6 levels and atherosclerosis, and both insulins reduced macrophage accumulation in visceral adipose tissue. Thus, chronic insulin therapy has beneficial tissue effects independent of circulating inflammatory markers in this murine model of diet-induced obesity and diabetes.
Keywords: Adipose tissue, Atherosclerosis, Hyperglycaemia, Inflammation, Insulin, Macrophage, Mouse, Obesity
Introduction
Visceral obesity is associated with the accumulation of macrophages in adipose tissue [1-3]. Adipose tissue inflammation is, in turn, associated with insulin resistance, a tendency to develop diabetes, systemic inflammation and a predisposition to atherosclerosis [2]. It has been suggested that cytokines generated by macrophages accumulating in visceral adipose tissue lead to insulin resistance [1, 4-7] and an increase in circulating inflammatory markers such as C-reactive protein (CRP) and serum amyloid A (SAA) [2, 8-10]. Both insulin resistance and systemic inflammation are associated with an increased risk of atherosclerotic cardiovascular disease [11-14].
Insulin has been shown to have anti-inflammatory properties, which have recently been reviewed [15]. Several studies show that the anti-inflammatory effects of insulin occur after short-term administration of the hormone [16-18]. These changes are associated with inhibition of proinflammatory cytokines. However, chronic insulin treatment can lead to weight gain in both type 1 and type 2 diabetes [19-21]. Obesity is associated with an increase in inflammatory markers such as CRP and SAA [22-24]. In the intensively treated arm of the DCCT, participants who gained the most weight had increased circulating levels of CRP, a marker of systemic inflammation [25]. This effect could be potentially deleterious, because CRP is a powerful predictor of cardiovascular disease [26]. Interestingly, CRP levels decreased in intensively treated diabetic individuals who gained the least weight or actually lost weight in this trial [25]. Thus, potentially beneficial anti-inflammatory effects of insulin could be outweighed by potentially adverse effects of insulin on adiposity. Moreover, it is unclear whether there is a difference between acute and chronic administration of insulin on inflammation.
LDL-receptor-deficient (Ldlr−/−) mice fed a diabetogenic diet plus 0.15% (wt/wt) cholesterol have adipose tissue inflammation with macrophage accumulation, systemic inflammation—measured as an increase in circulating levels of the inflammatory marker SAA—and accelerated atherosclerosis, similar to what is seen in humans with type 2 diabetes and the metabolic syndrome [2]. Thus, this is a good model to study the long-term effects of insulin on chronic inflammation.
Insulin glargine (A21Gly,B31Arg,B32Arg human insulin) and insulin detemir (B29Lys[ε-tetradecanoyl], desB30 human insulin) are two currently available long-acting insulin analogues widely used to provide basal insulin coverage in patients with diabetes. In this study we administered these two forms of long-acting insulin to Ldlr−/− mice in an attempt to dissect out the effects of chronic insulin administration on weight gain, adipose tissue and systemic inflammation, and metabolism. Our studies confirm that, in this animal model, weight gain is associated with chronic inflammation, and that, while the chronic administration of insulin does not reduce systemic inflammation, it may be associated with reductions in both adipose tissue inflammation and aortic atherosclerosis.
Methods
Animals and diet
Male 8 week old Ldlr−/− mice on a C57BL/6 background obtained from Jackson Laboratories (Bar Harbor, ME, USA) were housed three per cage under specific-pathogen-free conditions and maintained on a 12 h light/dark cycle with ad libitum access to water and food. Animals were fed a diabetogenic diet providing 35.5% energy intake as fat (see Electronic supplementary material [ESM] Table 1 for fatty acid composition of the diet) and 36.6% as carbohydrate with 0.15% (wt/wt) total cholesterol (BioServ number F4997, Frenchtown, NJ, USA) until they were sacrificed, and were weighed every week. After 8 weeks on the diet to induce insulin resistance, mice were randomly divided into three groups given once-daily subcutaneous injection of insulin glargine (~0.6 U/day), detemir (~0.8 U/day) or NaCl (154 mmol/l) as a control, respectively, and continued on the diabetogenic diet. As dilution in buffers could affect the potency of the insulins, both preparations were administered undiluted via pen devices (Lantus Solostar pen, sanofi-aventis, Bridgewater, NJ, USA, and Levemir FlexPen, Novo Nordisk, Princeton, NJ, USA) by rapidly withdrawing the pen needle after injection. Thus, dosing was approximate. The final dose of insulin used was determined in dose-finding experiments in which the insulin preparations did not result in significant hypoglycaemia over the 24 h post-injection period. At the end of the study, the harvested tissues were snap-frozen in liquid nitrogen and stored at −70°C until processed. The heart and entire aorta above the bifurcation were removed and fixed with 10% (vol./vol.) neutral-buffered formalin. This study was approved from the Institutional Animal Care and Use Committee of the University of Washington.
Analytical methods
Blood was obtained after a 4 h fast via the retro-orbital sinus. The blood samples were collected into tubes containing 1% (wt/vol.) sodium EDTA and kept on ice, and then centrifuged to obtain plasma. Blood glucose was measured using a glucose meter (One Touch Ultra, Lifescan, Milpitas, CA, USA). Glycated haemoglobin was measured using a commercially available kit (Pointe Scientific, Canton, MI, USA). Total cholesterol (Genzyme, Cambridge, MA, USA) and triacylglycerols (Roche, Indianapolis, IN, USA) in plasma were assayed with colorimetric kits. Circulating SAA levels were measured by ELISA in plasma, as described previously by Subramanian et al. and Lewis et al. [2, 27]. The antibody used cross-reacts with the inducible hepatic isoforms of SAA, SAA 1.1 and 2.1, and with SAA4, a constitutive form of SAA that is present in low concentrations in plasma. Although the antibody also cross-reacts with the inducible extrahepatic SAA3 isoform, we have previously shown that this isoform is not detectable in plasma [28]. Serum amyloid P (SAP) was measured using an ELISA kit (ICL, Newberg, OR, USA). Plasma levels of cytokines were measured using a Lincoplex kit (Millipore, MA, USA) on a Luminex 100 reader (Luminex Corp, Austin, TX, USA). Lipoprotein distribution was analysed by fast protein liquid chromatography (FPLC), as described previously by Lewis et al. [27]. Hepatic triacylglycerol content was determined following lipid extraction using the Folch method [29].
Body composition analysis
Body composition was performed on conscious immobilised mice using quantitative magnetic resonance (EchoMRI whole body composition analyser [Echo Medical Systems, Houston, TX, USA]).
Single-label immunohistochemistry
Macrophages were detected using a rat monoclonal antibody, against MAC2 (titre 1:2500, Cedarlane Laboratories, Burlington, NC, USA), in sections of epididymal adipose tissues, as described previously by Subramanian et al. and Han et al. [2, 30]. Area quantifications for MAC2 staining and crown-like structures were performed on digital images of immunostained tissues using image analysis software (Image Pro, Media Cybernetics, Bethesda, MD, USA). Adipocyte cross-sectional area was measured as previously described by Subramanian et al. [2].
Real-time quantitative PCR
Total RNA was extracted from 100 mg of whole epididymal adipose tissue and liver (n=11–14 per group) using the RNeasy Lipid Tissue Kit (QIAGEN, Valencia, CA, USA) and the Agilent Total RNA Isolation Kit (Agilent, Santa Clara, CA, USA), respectively, according to the manufacturers’ protocols. After spectroscopic quantification, 2 μg of RNA was reverse-transcribed to cDNA and used for quantification of genes. Real-time quantitative PCR was performed with the TaqMan Master Kit (Applied Biosystems, Carlsbad, CA, USA) using the Applied Biosystems 7900HT instrument. Primer and probe sequences for GAPDH forward primer, 5′-AGCCTCGTCCCGTAGACAAA-3′; reverse primer, 5′-ACCAGGCGCCCAATACG-3′; probe, Hex-5′-AAATCCGTTCACACCGACCTTCACCA-3′-BHQ1; primers for Saa1.1/2.1 (hepatic isoform), Saa3 (extra-hepatic isoform), Emr1 (encoding F4/80), Ccl2 (encoding monocyte chemoattractant protein-1 [MCP-1]), and Tnf along with 6-carboxyfluorescein (FAM) probes for each were purchased from Applied Biosystems (Assay-on-Demand). Assays were performed in triplicate and results are expressed as relative gene expression normalised to Gapdh as the reference gene. For copy number determination, calibration curves were obtained with serial dilutions of linearised copies of cDNA (range of 1×10³ to 1×10⁶) containing Saa1.1/2.1, Saa3, Ccl2, Tnf, Emr1 or Gapdh target sequences.
Quantification of atherosclerosis
The extent of aortic atherosclerosis was measured by en face analysis of the aorta as well as by analysis of serial aortic sinus sections, as previously described by Subramanian et al. [2]. Total surface area and lesion areas in the studied sections of aortas were quantified using Image J software (NIH, Bethesda, MD, USA). Aortic root analysis for atherosclerotic lesion size was performed on paraffin-embedded sections of the heart. Every third section (4 μm thick) through the aortic sinus (200 μm) was used for lesion analysis after staining with Movat’s Pentachrome and total lesion area was measured using Image Pro image analysis software, as previously described by Lewis et al. [27].
Statistical analysis
Data are expressed as means ± SEM. Mean values were compared using ANOVA with Tukey’s post hoc analysis, and p value <0.05 was considered statistically significant. Statistical analyses were performed using the GraphPad Prism program (version 5, GraphPad Software, San Diego, CA, USA).
Results
Chronic insulin administration does not worsen weight gain and improves metabolic abnormalities associated with obesity in Ldlr−/− mice Ldlr−/− mice were placed on a diabetogenic diet for 8 weeks to induce hyperglycaemia. In order to study the effects of chronic insulin administration on inflammation, mice were randomly divided into three groups to receive either one of two forms of long-acting insulin, glargine (~0.6 U/day) or detemir (~0.8 U/day), or NaCl (control group). Blood glucose levels were similar at baseline (control 10±1.9 mmol/l, glargine 9.7±1.3 mmol/l and detemir 9.5±1.4 mmol/l). All three groups of mice developed similar levels of hyperglycaemia after 8 weeks on the diet (control 13.1±2.9 mmol/l, glargine 13±2.8 mmol/l and detemir 15.8±3.8 mmol/l; p=NS) and prior to administration of insulin. Both long-acting forms of insulin were administered via pen devices in the undiluted form, because dilution alters the pH of the formulation and can lead to altered absorption. Animals were continued on the diabetogenic diet for a total of 20 weeks. Animals in the insulin-treated (glargine and detemir) groups as well as those in the control group showed equivalent weight gain (control 48.6±3.6 g, glargine 49.1±4.2 g and detemir 49±2.2 g; p=NS; Fig. 1a). Body composition analysis also did not show differences in lean or fat mass among groups (Fig. 1b, c). Glycated haemoglobin levels were reduced to the same extent in both glargine and detemir groups (glargine 4.9% and detemir 5.5%; p=NS), but were significantly lower than in the control group (7.6%, p<0.001 and p<0.01 vs glargine and detemir groups, respectively; Fig. 2). Hyperlipidaemia developed in all three groups of animals but was significantly reduced only in the glargine group (Table 1). Although insulin therapy can suppress NEFA release from adipose tissue, we did not detect any differences in plasma NEFA levels among the three groups (Table 1). Lipoprotein profiles of animals on insulin therapy showed improvement in lipoprotein cholesterol and triacylglycerol in the glargine group only (Fig. 3a, b). Although plasma alanine aminotransferase (ALT) levels were not significantly reduced in the insulin-treated mice, hepatic triacylglycerol content was reduced in the glargine group (Table 1). These findings suggest that insulin administration, at least with glargine, resulted in improvement of metabolic abnormalities seen in diabetes. Of interest is the observation that neither insulin-treated group increased weight or adiposity more than the control Ldlr−/− mice, despite clearly having improved metabolic control.
Fig. 1.

Weight gain was equivalent in insulin-treated and untreated Ldlr−/− mice. a Equivalent weight gain in animals receiving NaCl (control; n=15, squares), glargine (n=15, circles) and detemir (n=15, diamonds). (b) Percentage fat mass and (c) percentage lean mass in control, glargine and detemir groups. Values represent means ± SEM
Fig. 2.
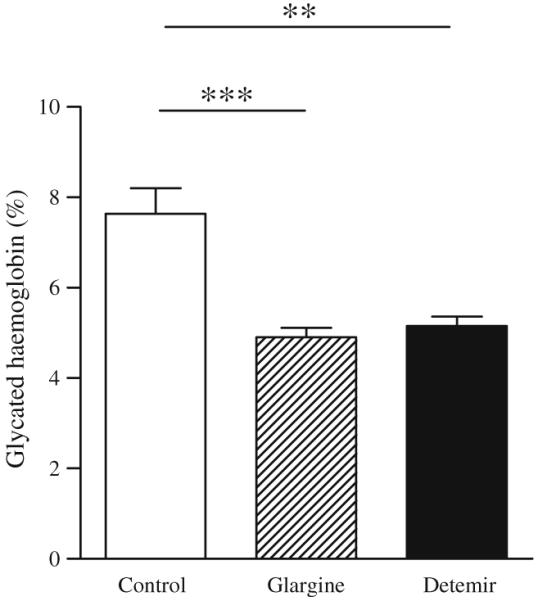
Both forms of long-acting insulin resulted in equivalent glycaemic control. Glycaemic control measured by glycated haemoglobin levels in mice treated with NaCl (control; white bar), glargine (hatched bar) and detemir (black bar); n=11–15 per group. Values represent means ± SEM; **p<0.01 vs control, ***p<0.001 vs control
Table 1.
Metabolic variables in Ldlr−/− mice on a diabetogenic diet treated with glargine or detemir insulin compared with control animals
| Plasma variable | Control n=15 | Glargine n=15 | Detemir n=11 |
|---|---|---|---|
| Triacylglycerol (mmol/l) | 3.5±1.2 | 2.1±0.4*,† | 4.2±1.5 |
| Cholesterol (mmol/l) | 21.4±1.4 | 17.3±1.8‡ | 22.8±1.4 |
| NEFA (mmol/l) | 0.68±0.2 | 0.66±0.1 | 0.94±0.4 |
| ALT (U/l) | 106±61 | 82±31 | 99±53 |
| Hepatic triacylglycerol (mmol/g liver) | 2.4±2 | 1.1±0.8* | 2.1±1 |
| IL-6 (pg/ml) | 17.7±9.8 | 8.9±4.6* | 12±8.2 |
| SAA (μg/ml) | 14±5 | 14.4±7 | 14.2±3 |
| SAP (μg/ml) | 30±22 | 18±13 | 28±14 |
Values represent means ± SD; n=11–15 per group
p<0.05 vs control group
p< 0.01 vs detemir
p<0.001 vs control and detemir
Fig. 3.

Glargine insulin is associated with reduced lipoprotein levels. Lipoprotein distribution by FPLC of cholesterol (a) and triacylglyerol (b) in Ldlr−/− mice treated with long-acting insulins compared with controls. Control group, squares; glargine group, circles; detemir group, diamonds
Macrophage accumulation in adipose tissue is improved with chronic insulin therapy
To assess the changes in adipose tissue morphology and gene expression that occur with insulin therapy, we studied epididymal adipose tissue, as this fat pad is situated intra-abdominally with portal drainage and develops significant alterations in obesity [31]. We focused on the epididymal fat depot, as we and others [32, 33] have shown that macrophages accumulate to a far greater extent in this fat depot in mice. Macrophages accumulate in adipose tissue in obesity and are critical players in the pathogenesis of obesity-induced insulin resistance [1, 3]. Gene expression analysis demonstrated that expression of mRNA for the macrophage marker Emr1 was significantly reduced in the glargine-treated group (Fig. 4a). Expression of mRNA for the monocyte chemoattractant factor, Ccl2, was reduced in a similar fashion (Fig. 4b). However, no differences were detected among the three groups in expression of either Tnf or Saa3 mRNA (Fig. 4c, d). We also used immunohistochemical techniques to identify the presence of macrophages within adipose tissue. Immunostaining for the macrophage marker MAC2 showed that chronic insulin therapy with glargine and detemir induced a significant decrease in macrophage content in epididymal adipose tissue (p<0.01 and p<0.05 vs control, respectively; Fig. 4e, f). Adipocyte hypertrophy was seen in the epididymal fat pad, but did not differ between the three groups (ESM Fig. 1a). Crown-like structure density was lowest in the glargine group (p<0.01 vs control; ESM Fig. 1b) and correlated with adipose tissue MAC2 staining (r=0.71, p<0.0001).
Fig. 4.

Chronic insulin therapy decreases macrophage content and gene expression in adipose tissue of obese mice. Epididymal adipose tissue Emr1 (a), Ccl2 (b), Tnf (c) and Saa3 (d) mRNA levels with insulin therapy in Ldlr−/− mice. White bars, control mice; hatched bars, glargine-treated mice; and dark bars, detemir-treated mice. e Epididymal adipose tissue stained for MAC2. f Quantification of MAC2 staining in the three groups of mice; n=11–15 per group. Values represent means ± SEM; *p<0.05 vs control, **p<0.01 vs control. CL, control; DT, detemir; GL, glargine
SAA and SAP levels did not improve with insulin therapy
The fact that body weights were equal in all groups at the end of the study allowed us to assess the effect of chronic insulin administration on SAA and SAP independent of its effects on body weight and adiposity. In mice, SAA and SAP function as inducible markers of inflammation. SAA1.1 and 2.1 are highly homologous liver-derived isoforms of SAA that are readily detected in the circulation, while SAA3, the extra-hepatic isoform derived primarily from macrophages and adipocytes, is not detected in plasma [28]. We measured circulating levels of SAA (mainly isoforms 1.1 and 2.1) and SAP, both acute-phase proteins that are modestly elevated in the setting of chronic inflammation. SAA and SAP levels were not different among the three groups of animals (Table 1). Hepatic mRNA levels of Saa were increased in the glargine-insulin-treated animals (p<0.01 vs control and detemir groups, data not shown), despite their having the best improvement in metabolic profile and greatest reduction in hepatic triacylglycerol levels. As induction of hepatic SAA is believed to occur through effects of cytokine signalling pathways, we measured levels of TNF-α, MCP-1 and IL-6. Only IL-6 was detectable in the plasma and levels were decreased in the glargine group alone (Table 1). However, this decrease in plasma levels did not appear to decrease hepatic Saa1.1/2.1 mRNA or plasma levels in this group of mice.
Atherosclerosis is reduced in obese diabetic Ldlr−/− mice receiving chronic insulin therapy
Aortic atherosclerosis was assessed by en face analysis. Lesion area was reduced in the glargine-treated group (Fig. 5a). While lesion area also was reduced in the detemir group, the difference vs control did not reach statistical significance. Similarly, aortic root analysis showed a reduction in cross-sectional area of lesions in the glargine group only (Fig. 5b, c). Atherosclerosis did not correlate with triacylglycerol levels or with circulating SAA or SAP levels.
Fig. 5.

Atherosclerosis is decreased with chronic insulin therapy in obese Ldlr−/− mice. (a) Aortic intimal lesion area and (b) aortic sinus lesion area in insulin-treated mice control (squares), glargine (circles) and detemir (diamonds); n=10–15 per group; *p<0.05 vs controls. c Representative photomicrographs (magnification×10) of aortic root lesions stained using Movat’s Pentachrome. Collagen stains yellow, elastin stains black, proteoglycans stain blue, fibrin stains bright red, and cells stain light red
Discussion
In this study we confirmed that consumption of a diet high in saturated fat and sucrose and containing added cholesterol led to considerable weight gain, increased glucose and insulin levels, dyslipidaemia, macrophage accumulation in intra-abdominal fat, systemic inflammation and atherosclerosis in male Ldlr−/− mice. Moreover, chronic administration of basal long-acting insulin decreased the accumulation of macrophages in adipose tissue, but did not reduce the circulating inflammatory markers SAA and SAP.
We used basal insulin therapy without prandial insulin because of technical challenges associated with administering short-acting insulin to rodents, which are nocturnal by nature, and because we were able to achieve good glycaemic control using only basal insulin therapy. Surprisingly, the administration of both forms of long-acting insulin did not result in a further increase in body weight, despite leading to an equivalent improvement in glycated haemoglobin levels. The fact that the body weights of the control group and of both insulin-treated groups were the same at the conclusion of the study allowed us to assess the effect of chronic administration of long-acting insulin on inflammation, independent of the potentially confounding variable of differences in weight. SAA (isoforms 1.1 and 2.1) and SAP are circulating inflammatory markers in mice, in which CRP levels do not increase in response to inflammation [34]. Interestingly, SAA and SAP levels did not decrease in either insulin-treated group. Thus, chronic administration of insulin to mice was not associated with evidence of reduced levels of the circulating inflammatory markers SAA and SAP. Our observation that long-term administration of long-acting insulin did not have a major effect on these circulating inflammatory markers is in contrast to several studies in which acute insulin administration has been reported to reduce circulating markers of inflammation in humans [16-19]. Therefore, it appears that insulin may have different effects in the acute and chronic settings. Moreover, our findings are consistent with several recent studies in humans demonstrating that chronic therapy with glargine or NPH insulins or with metformin does not improve CRP levels [35-38]. Even if chronic insulin administration reduced circulating inflammatory markers in humans, this might be offset by the weight gain that frequently accompanies insulin administration [19-21], although this may in part be genetically determined [39]. Type 1 diabetic patients in the DCCT who gained the least weight with intensive insulin therapy actually had reduced CRP levels, while CRP increased in those who gained the most weight [25].
In the present study, we used the epididymal fat pad as a representative sample of visceral fat, as it is the most commonly studied fat depot in the mouse, is easily accessible on dissection and drains directly into the portal circulation. However, it should be noted that site-specific physiological differences exist among adipose tissue depots in humans and rodents [40-42]; thus, findings in epididymal adipose tissue are not generalisable to changes occurring in other sites such as, for example, subcutaneous adipose tissue, which is believed to be less inflammatory [2, 31]. Macrophages that accumulate in visceral adipose tissue during the development of obesity [1, 3] generate cytokines, which are believed to play an important role in the pathogenesis of insulin resistance [5]. Exposure of the liver to macrophage-derived cytokines also leads to systemic inflammation [8, 9], as manifested by the induction of CRP and SAA in humans and SAA and SAP in mice [9, 10]. Therefore, it is somewhat surprising that the reduction of adipose tissue macrophage content and plasma IL-6 levels that occurred with chronic insulin administration in our study did not lead to a fall in circulating SAA and SAP levels. These observations suggest that the induction of these molecules in the liver may not be a direct consequence of cytokines produced by adipose tissue macrophages.
Some differences between glargine and detemir insulin were observed in these mice. In humans, insulin detemir administration has been associated with less weight gain than with glargine [43-45]. The lesser degree of weight gain that has been seen in humans treated with insulin detemir might lead to less inflammation than in patients treated with insulin glargine. However, in this study, we failed to detect weight differences between the two insulin-treated groups and circulating SAA and SAP levels were not improved in either insulin-treated group. Nonetheless, both glargine and detemir insulin administration led to less macrophage accumulation in adipose tissue than in control mice that did not receive insulin. The detemir-treated group showed no reduction in atherosclerosis, despite improved glycaemic control. Only glargine insulin led to an improved lipid and lipoprotein profiles and less atherosclerosis. The improved lipid profile in the glargine-treated mice might be responsible for the reduced extent of atherosclerosis in these animals, even though we were unable to demonstrate a direct relationship between lipid levels and extent of atherosclerosis. Studies reporting correlations between circulating levels of SAA, but not plasma lipid and lipoprotein, and vascular lesions in mice [2, 27] or rabbits [46] suggest that inflammatory molecules such as SAA might play a direct role in atherogenesis. However, we were unable to show any relationship between SAA levels and atherosclerosis in the current study, suggesting that favourable effects on lipids may have overshadowed any effect of these inflammatory markers on atherosclerosis. Differences between the glargine and detemir groups could be due to the pharmacodynamic properties of the two insulins. Some in vitro studies have demonstrated that detemir induces less potent post-insulin-receptor signalling effects in tissues [47]. Our study was not powered to evaluate the differences between the two forms of insulin.
In summary, the lack of difference in weight gain among groups during chronic insulin administration in mice allowed us to eliminate the confounding effect of weight gain. We found that, while chronic insulin therapy with the two long-acting insulins had no effect on circulating levels of SAA and SAP, it was associated with an improvement in adipose tissue macrophage accumulation. These findings highlight the complex mechanisms that underlie chronic inflammation in insulin resistance and its complications, such as atherosclerosis.
Supplementary Material
Acknowledgements
This work was supported by an investigator-initiated grant from Novo-Nordisk (to A. Chait) and by NIH grants HL092969 (A. Chait), HL094352 (A. Chait), and the Seattle Mouse Metabolic Phenotyping Core U24 DK076126.
Abbreviations
- ALT
Alanine aminotransferase
- CRP
C-reactive protein
- FPLC
Fast protein liquid chromatography
- Ldlr−/−
LDL-receptor-deficient mice
- MCP-1
Monocyte chemoattractant protein-1
- SAA
Serum amyloid A
- SAP
Serum amyloid P
Footnotes
Duality of interest A. Chait received an investigator-initiated grant from Novo-Nordisk. The other authors declare that there is no duality of interest associated with this manuscript.
J. Yoon and S. Subramanian contributed equally to this study.
Present Address: J. Yoon, Yeungnam University College of Medicine, Daegu, South Korea
Electronic supplementary material The online version of this article (doi:10.1007/s00125-011-2055-2) contains supplementary material, which is available to authorised users.
Contributor Information
J. Yoon, Diabetes Obesity Center for Excellence, Division of Metabolism, Endocrinology and Nutrition, University of Washington, 815 Mercer Street, Box 358055, Seattle, WA 98109, USA
S. Subramanian, Diabetes Obesity Center for Excellence, Division of Metabolism, Endocrinology and Nutrition, University of Washington, 815 Mercer Street, Box 358055, Seattle, WA 98109, USA
Y. Ding, Diabetes Obesity Center for Excellence, Division of Metabolism, Endocrinology and Nutrition, University of Washington, 815 Mercer Street, Box 358055, Seattle, WA 98109, USA
S. Wang, Diabetes Obesity Center for Excellence, Division of Metabolism, Endocrinology and Nutrition, University of Washington, 815 Mercer Street, Box 358055, Seattle, WA 98109, USA
L. Goodspeed, Diabetes Obesity Center for Excellence, Division of Metabolism, Endocrinology and Nutrition, University of Washington, 815 Mercer Street, Box 358055, Seattle, WA 98109, USA
B. Sullivan, Division of Cardiology, University of Washington, Seattle, WA, USA
J. Kim, Division of Cardiology, University of Washington, Seattle, WA, USA
K. D. O’Brien, Division of Cardiology, University of Washington, Seattle, WA, USA
A. Chait, Diabetes Obesity Center for Excellence, Division of Metabolism, Endocrinology and Nutrition, University of Washington, 815 Mercer Street, Box 358055, Seattle, WA 98109, USA
References
- 1.Weisberg SP, McCann D, Desai M, Rosenbaum M, Leibel RL, Ferrante AW., Jr Obesity is associated with macrophage accumulation in adipose tissue. J Clin Invest. 2003;112:1796–1808. doi: 10.1172/JCI19246. [DOI] [PMC free article] [PubMed] [Google Scholar]
- 2.Subramanian S, Han CY, Chiba T, et al. Dietary cholesterol worsens adipose tissue macrophage accumulation and atherosclerosis in obese LDL receptor-deficient mice. Arterioscler Thromb Vasc Biol. 2008;28:685–691. doi: 10.1161/ATVBAHA.107.157685. [DOI] [PMC free article] [PubMed] [Google Scholar]
- 3.Xu H, Barnes GT, Yang Q, et al. Chronic inflammation in fat plays a crucial role in the development of obesity-related insulin resistance. J Clin Invest. 2003;112:1821–1830. doi: 10.1172/JCI19451. [DOI] [PMC free article] [PubMed] [Google Scholar]
- 4.Arkan MC, Hevener AL, Greten FR, et al. IKK-beta links inflammation to obesity-induced insulin resistance. Nat Med. 2005;11:191–198. doi: 10.1038/nm1185. [DOI] [PubMed] [Google Scholar]
- 5.Hotamisligil GS, Shargill NS, Spiegelman BM. Adipose expression of tumor necrosis factor-alpha: direct role in obesity-linked insulin resistance. Science. 1993;259:87–91. doi: 10.1126/science.7678183. [DOI] [PubMed] [Google Scholar]
- 6.Hotamisligil GS, Murray DL, Choy LN, Spiegelman BM. Tumor necrosis factor alpha inhibits signaling from the insulin receptor. Proc Natl Acad Sci USA. 1994;91:4854–4858. doi: 10.1073/pnas.91.11.4854. [DOI] [PMC free article] [PubMed] [Google Scholar]
- 7.Hotamisligil GS. Inflammation and metabolic disorders. Nature. 2006;444:860–867. doi: 10.1038/nature05485. [DOI] [PubMed] [Google Scholar]
- 8.Eklund CM. Proinflammatory cytokines in CRP baseline regulation. Adv Clin Chem. 2009;48:111–136. doi: 10.1016/s0065-2423(09)48005-3. [DOI] [PubMed] [Google Scholar]
- 9.Uhlar CM, Whitehead AS. Serum amyloid A, the major vertebrate acute-phase reactant. Eur J Biochem. 1999;265:501–523. doi: 10.1046/j.1432-1327.1999.00657.x. [DOI] [PubMed] [Google Scholar]
- 10.Manfredi AA, Rovere-Querini P, Bottazzi B, Garlanda C, Mantovani A. Pentraxins, humoral innate immunity and tissue injury. Curr Opin Immunol. 2008;20:538–544. doi: 10.1016/j.coi.2008.05.004. [DOI] [PubMed] [Google Scholar]
- 11.Cefalu WT, Werbel S, Bell-Farrow AD, et al. Insulin resistance and fat patterning with aging: relationship to metabolic risk factors for cardiovascular disease. Metabolism. 1998;47:401–408. doi: 10.1016/s0026-0495(98)90050-6. [DOI] [PubMed] [Google Scholar]
- 12.Johnson BD, Kip KE, Marroquin OC, et al. Serum amyloid A as a predictor of coronary artery disease and cardiovascular outcome in women: the National Heart, Lung, and Blood Institute-Sponsored Women’s Ischemia Syndrome Evaluation (WISE) Circulation. 2004;109:726–732. doi: 10.1161/01.CIR.0000115516.54550.B1. [DOI] [PubMed] [Google Scholar]
- 13.Libby P, Ridker PM. Inflammation and atherosclerosis: role of C-reactive protein in risk assessment. Am J Med. 2004;116(Suppl 6A):9S–16S. doi: 10.1016/j.amjmed.2004.02.006. [DOI] [PubMed] [Google Scholar]
- 14.Ridker PM, Hennekens CH, Buring JE, Rifai N. C-reactive protein and other markers of inflammation in the prediction of cardiovascular disease in women. N Engl J Med. 2000;342:836–843. doi: 10.1056/NEJM200003233421202. [DOI] [PubMed] [Google Scholar]
- 15.Dandona P, Chaudhuri A, Mohanty P, Ghanim H. Anti-inflammatory effects of insulin. Curr Opin Clin Nutr Metab Care. 2007;10:511–517. doi: 10.1097/MCO.0b013e3281e38774. [DOI] [PubMed] [Google Scholar]
- 16.Ghanim H, Korzeniewski K, Sia CL, et al. Suppressive effect of insulin infusion on chemokines and chemokine receptors. Diabetes Care. 2010;33:1103–1108. doi: 10.2337/dc09-2193. [DOI] [PMC free article] [PubMed] [Google Scholar]
- 17.Dandona P, Aljada A, Mohanty P, Ghanim H, Bandyopadhyay A, Chaudhuri A. Insulin suppresses plasma concentration of vascular endothelial growth factor and matrix metalloproteinase-9. Diabetes Care. 2003;26:3310–3314. doi: 10.2337/diacare.26.12.3310. [DOI] [PubMed] [Google Scholar]
- 18.Albacker T, Carvalho G, Schricker T, Lachapelle K. High-dose insulin therapy attenuates systemic inflammatory response in coronary artery bypass grafting patients. Ann Thorac Surg. 2008;86:20–27. doi: 10.1016/j.athoracsur.2008.03.046. [DOI] [PubMed] [Google Scholar]
- 19.Carlson MG, Campbell PJ. Intensive insulin therapy and weight gain in IDDM. Diabetes. 1993;42:1700–1707. doi: 10.2337/diab.42.12.1700. [DOI] [PubMed] [Google Scholar]
- 20.McFarlane SI. Insulin therapy and type 2 diabetes: management of weight gain. J Clin Hypertens (Greenwich) 2009;11:601–607. doi: 10.1111/j.1751-7176.2009.00063.x. [DOI] [PMC free article] [PubMed] [Google Scholar]
- 21.Russell-Jones D, Khan R. Insulin-associated weight gain in diabetes—causes, effects and coping strategies. Diabetes Obes Metab. 2007;9:799–812. doi: 10.1111/j.1463-1326.2006.00686.x. [DOI] [PubMed] [Google Scholar]
- 22.Leinonen E, Hurt-Camejo E, Wiklund O, Hulten LM, Hiukka A, Taskinen MR. Insulin resistance and adiposity correlate with acute-phase reaction and soluble cell adhesion molecules in type 2 diabetes. Atherosclerosis. 2003;166:387–394. doi: 10.1016/s0021-9150(02)00371-4. [DOI] [PubMed] [Google Scholar]
- 23.Yang RZ, Lee MJ, Hu H, et al. Acute-phase serum amyloid A: an inflammatory adipokine and potential link between obesity and its metabolic complications. PLoS Med. 2006;3:e287. doi: 10.1371/journal.pmed.0030287. [DOI] [PMC free article] [PubMed] [Google Scholar]
- 24.Tannock LR, O’Brien KD, Knopp RH, et al. Cholesterol feeding increases C-reactive protein and serum amyloid A levels in lean insulin-sensitive subjects. Circulation. 2005;111:3058–3062. doi: 10.1161/CIRCULATIONAHA.104.506188. [DOI] [PubMed] [Google Scholar]
- 25.Schaumberg DA, Glynn RJ, Jenkins AJ, et al. Effect of intensive glycemic control on levels of markers of inflammation in type 1 diabetes mellitus in the diabetes control and complications trial. Circulation. 2005;111:2446–2453. doi: 10.1161/01.CIR.0000165064.31505.3B. [DOI] [PubMed] [Google Scholar]
- 26.Ridker PM, Buring JE, Cook NR, Rifai N. C-reactive protein, the metabolic syndrome, and risk of incident cardiovascular events: an 8-year follow-up of 14719 initially healthy American women. Circulation. 2003;107:391–397. doi: 10.1161/01.cir.0000055014.62083.05. [DOI] [PubMed] [Google Scholar]
- 27.Lewis KE, Kirk EA, McDonald TO, et al. Increase in serum amyloid a evoked by dietary cholesterol is associated with increased atherosclerosis in mice. Circulation. 2004;110:540–545. doi: 10.1161/01.CIR.0000136819.93989.E1. [DOI] [PubMed] [Google Scholar]
- 28.Chiba T, Han CY, Vaisar T, et al. Serum amyloid A3 does not contribute to circulating SAA levels. J Lipid Res. 2009;50:1353–1362. doi: 10.1194/jlr.M900089-JLR200. [DOI] [PMC free article] [PubMed] [Google Scholar]
- 29.Folch J, Lees M, Sloane-Stanley GH. A simple method for the isolationand purification of total lipids from animal tissues. J Biol Chem. 1957;226:497–509. [PubMed] [Google Scholar]
- 30.Han CY, Subramanian S, Chan CK, et al. Adipocyte-derived serum amyloid A3 and hyaluronan play a role in monocyte recruitment and adhesion. Diabetes. 2007;56:2260–2273. doi: 10.2337/db07-0218. [DOI] [PubMed] [Google Scholar]
- 31.Murano I, Barbatelli G, Parisani V, et al. Dead adipocytes, detected as crown-like structures, are prevalent in visceral fat depots of genetically obese mice. J Lipid Res. 2008;49:1562–1568. doi: 10.1194/jlr.M800019-JLR200. [DOI] [PubMed] [Google Scholar]
- 32.Samaras K, Botelho NK, Chisholm DJ, Lord RV. Subcutaneous and visceral adipose tissue gene expression of serum adipokines that predict type 2 diabetes. Obesity (Silver Spring) 2010;18:884–889. doi: 10.1038/oby.2009.443. [DOI] [PubMed] [Google Scholar]
- 33.Ohman MK, Shen Y, Obimba CI, et al. Visceral adipose tissue inflammation accelerates atherosclerosis in apolipoprotein E-deficient mice. Circulation. 2008;117:798–805. doi: 10.1161/CIRCULATIONAHA.107.717595. [DOI] [PMC free article] [PubMed] [Google Scholar]
- 34.Szalai AJ, McCrory MA. Varied biologic functions of C-reactive protein: lessons learned from transgenic mice. Immunol Res. 2002;26:279–287. doi: 10.1385/IR:26:1-3:279. [DOI] [PubMed] [Google Scholar]
- 35.Reynolds LR, Kingsley FJ, Karounos DG, Tannock LR. Differential effects of rosiglitazone and insulin glargine on inflammatory markers, glycemic control, and lipids in type 2 diabetes. Diabetes Res Clin Pract. 2007;77:180–187. doi: 10.1016/j.diabres.2006.12.011. [DOI] [PubMed] [Google Scholar]
- 36.Pradhan AD, Everett BM, Cook NR, Rifai N, Ridker PM. Effects of initiating insulin and metformin on glycemic control and inflammatory biomarkers among patients with type 2 diabetes: the LANCET randomized trial. Jama. 2009;302:1186–1194. doi: 10.1001/jama.2009.1347. [DOI] [PubMed] [Google Scholar]
- 37.Fonseca VA, Theuma P, Mudaliar S, Leissinger CA, Clejan S, Henry RR. Diabetes treatments have differential effects on nontraditional cardiovascular risk factors. J Diabetes Complications. 2006;20:14–20. doi: 10.1016/j.jdiacomp.2005.05.009. [DOI] [PubMed] [Google Scholar]
- 38.Aas AM, Seljeflot I, Torjesen PA, Diep LM, Thorsby PM, Birkeland KI. Blood glucose lowering by means of lifestyle intervention has different effects on adipokines as compared with insulin treatment in subjects with type 2 diabetes. Diabetologia. 2006;49:872–880. doi: 10.1007/s00125-006-0205-8. [DOI] [PubMed] [Google Scholar]
- 39.Purnell JQ, Dev RK, Steffes MW, et al. Relationship of family history of type 2 diabetes, hypoglycemia, and autoanti-bodies to weight gain and lipids with intensive and conventionaltherapy in the Diabetes Control and Complications Trial. Diabetes. 2003;52:2623–2629. doi: 10.2337/diabetes.52.10.2623. [DOI] [PMC free article] [PubMed] [Google Scholar]
- 40.Wu Y, Kim JY, Zhou S, Smas CM. Differential screening identifies transcripts with depot-dependent expression in white adipose tissues. BMC Genomics. 2008;9:397. doi: 10.1186/1471-2164-9-397. [DOI] [PMC free article] [PubMed] [Google Scholar]
- 41.Caesar R, Manieri M, Kelder T, et al. A combined transcriptomics and lipidomics analysis of subcutaneous, epididymal and mesenteric adipose tissue reveals marked functional differences. PLoS One. 2010;5:e11525. doi: 10.1371/journal.pone.0011525. [DOI] [PMC free article] [PubMed] [Google Scholar]
- 42.Montague CT, Prins JB, Sanders L, et al. Depot-related gene expression in human subcutaneous and omental adipocytes. Diabetes. 1998;47:1384–1391. doi: 10.2337/diabetes.47.9.1384. [DOI] [PubMed] [Google Scholar]
- 43.Fajardo Montanana C, Hernandez Herrero C, Rivas Fernandez M. Less weight gain and hypoglycaemia with once-daily insulin detemir than NPH insulin in intensification of insulin therapy in overweight type 2 diabetes patients: the PREDICTIVE BMI clinical trial. Diabet Med. 2008;25:916–923. doi: 10.1111/j.1464-5491.2008.02483.x. [DOI] [PubMed] [Google Scholar]
- 44.Marre M, Pinget M, Gin H, et al. Insulin detemir improves glycaemic control with less hypoglycaemia and no weight gain: 52-week data from the PREDICTIVE Study in a cohort of French patients with type 1 or type 2 diabetes. Diabetes Metab. 2009;35:469–475. doi: 10.1016/j.diabet.2009.06.004. [DOI] [PubMed] [Google Scholar]
- 45.De Leeuw I, Vague P, Selam JL, et al. Insulin detemir used in basal-bolus therapy in people with type 1 diabetes is associated with a lower risk of nocturnal hypoglycaemia and less weight gain over 12 months in comparison to NPH insulin. Diabetes Obes Metab. 2005;7:73–82. doi: 10.1111/j.1463-1326.2004.00363.x. [DOI] [PubMed] [Google Scholar]
- 46.Van Lenten BJ, Wagner AC, Navab M, et al. Lipoprotein inflammatory properties and serum amyloid a levels but not cholesterol levels predict lesion area in cholesterol-fed rabbits. J Lipid Res. 2007;48:2344–2353. doi: 10.1194/jlr.M700138-JLR200. [DOI] [PubMed] [Google Scholar]
- 47.Wada T, Azegami M, Sugiyama M, Tsuneki H, Sasaoka T. Characteristics of signalling properties mediated by long-acting insulin analogue glargine and detemir in target cells of insulin. Diabetes Res Clin Pract. 2008;81:269–277. doi: 10.1016/j.diabres.2008.05.007. [DOI] [PubMed] [Google Scholar]
Associated Data
This section collects any data citations, data availability statements, or supplementary materials included in this article.