

Abstract
The visceral endoderm (VE) is an epithelial tissue in the early postimplantation mouse embryo that encapsulates the pluripotent epiblast distally and the extraembryonic ectoderm proximally. In addition to facilitating nutrient exchange before the establishment of a circulation, the VE is critical for patterning the epiblast. Since VE is derived from the primitive endoderm (PrE) of the blastocyst, and PrE-derived eXtraembryonic ENdoderm (XEN) cells can be propagated in vitro, XEN cells should provide an important tool for identifying factors that direct VE differentiation. In this study, we demonstrated that BMP4 signalling induces the formation of a polarized epithelium in XEN cells. This morphological transition was reversible, and was associated with the acquisition of a molecular signature comparable to extraembryonic (ex) VE. Resembling exVE which will form the endoderm of the visceral yolk sac, BMP4-treated XEN cells regulated hematopoiesis by stimulating the expansion of primitive erythroid progenitors. We also observed that LIF exerted an antagonistic effect on BMP4-induced XEN cell differentiation, thereby impacting the extrinsic conditions used for the isolation and maintenance of XEN cells in an undifferentiated state. Taken together, our data suggest that XEN cells can be differentiated towards an exVE identity upon BMP4 stimulation, and therefore represent a valuable tool for investigating PrE lineage differentiation.
Keywords: BMP, AFP, LIF, extraembryonic endoderm, XEN cell, visceral endoderm, hematopoiesis, live imaging
INTRODUCTION
The patterning of the early mouse embryo relies on reciprocal signalling interactions between embryonic and extraembryonic tissues (reviewed in (Arnold and Robertson, 2009; Rossant and Tam, 2009)). The two extraembryonic tissues, trophectoderm (TE) and primitive endoderm (PrE), are specified and spatially segregated away from the pluripotent epiblast (EPI) prior to embryo implantation into the maternal uterus (reviewed in (Cockburn and Rossant, 2010; Zernicka-Goetz et al., 2009)). TE is the first extraembryonic lineage established and forms an epithelial layer surrounding the inner cell mass (ICM) of the blastocyst stage embryo. TE will form the trophoblast giant cells and the extraembryonic ectoderm (ExE), essential for the establishment of a fetal-maternal connection. The PrE is one of the two cell populations specified within the ICM, the other being the EPI. PrE and EPI cells emerge initially in an apparent salt-and-pepper fashion but, by the end of the preimplantation period, are spatially segregated, with the PrE forming a single cell layer on the surface of the ICM in contact with the blastocoel cavity (Chazaud et al., 2006; Meilhac et al., 2009; Plusa et al., 2008). Thus, at the time of blastocyst implantation, the pluripotent EPI is encapsulated by the TE and the PrE (Figure 1A).
Figure 1. BMP treatment alters XEN cell morphology.

(A) Schematic representation of periimplantation (E4.5) and early postimplantation (E5.5 and E7.25) stage mouse embryos. High magnification insets on the region where the exVE and extraembryonic mesoderm are apposed, representing the site of blood island formation (Ferkowicz and Yoder, 2005; Li et al., 2005). Red, EPI and its derivatives; green, TE and TE derivatives; blue, PrE and PrE derivatives. (B) Diagramatic representation of the timeline of BMP treatment. (C) XEN cell morphology after addition of BMP2 and BMP4 for 4 days at concentrations ranging from 5 to 20 ng/mL in serum culture conditions. (D) Kinetics of the morphological changes upon addition of 10 ng/mL of BMP4 in serum and serum-free (N2B27) conditions. (C-D) High magnification zooms of low magnification images (inset) acquired with a 10X magnification. In the insets, areas of epithelial cell colonies are highlighted in red.
After implantation, the PrE differentiates into the parietal endoderm (PE) and the visceral endoderm (VE). The PE, which lies adjacent to trophoblast giant cells, will form the endoderm of the parietal yolk sac, while the majority of the VE will come to lie adjacent to extraembryonic mesoderm where it will form the visceral yolk sac, the site of primitive hematopoiesis and vasculogenesis (Figure 1A). Cell transplantation experiments have revealed some degree of lability between these two PrE derivatives, as VE cells from early postimplantation embryos (around embryonic day (E) 5.5 – Figure 1A) transplanted to recipient blastocysts were able to contribute to both PE and VE (Gardner, 1982; Hogan and Tilly, 1981). Even so, these cell types can be distinguished by their morphology and their distinct biological properties. PE cells are characterized by their dispersed distribution and migratory behavior along the mural TE. They secrete the extracellular matrix proteins that comprise Reichert’s membrane. By contrast, the VE forms an epithelial monolayer that encapsulates the ExE proximally (where it is also referred as exVE) and the EPI distally (where it is also referred to as emVE).
The VE is required for embryo survival and patterning. It functions as the primary site of gas, nutrient and waste exchange prior to the establishment of a circulation. As a polarized epithelium it possesses the necessary intracellular machinery for directional absorption and transport of compounds (reviewed in (Bielinska et al., 1999)). At periimplantation stages, the VE plays a role in epiblast cell survival as well as in the formation of the proamniotic cavity (Coucouvanis and Martin, 1995; Coucouvanis and Martin, 1999). More recently, it has been shown that specialized regions within the VE are required for embryonic axis formation and epiblast patterning. For example at E5.5, a population of molecularly and morphologicaly distinct emVE cells is evident at the distal tip of the embryo (Rivera-Perez et al., 2003). This population, referred to as the distal VE (DVE), expresses transcripton factors such as Lhx1 and Hhex, and secretes antagonists of Wnt and Nodal signalling including CER1, DKK1 and LEFTY1 (reviewed in (Pfister et al., 2007)). Live imaging studies have revealed that DVE cells actively and collectively migrate proximally within the plane of the emVE epithelium towards the embryonic-extraembryonic junction (Migeotte et al., 2010; Srinivas et al., 2004), as they will converge with a second population the anterior VE (AVE) (Takaoka et al., 2011; Thomas and Beddington, 1996). This translocation of DVE/AVE cells effectively converts the proximal-distal axis of the periimplantation embryo into an anterior-posterior axis, and results in the correct positioning of the primitive streak, defining the posterior side of the embryo concomitant with the start of gastrulation.
Gastrulation cell movements will give rise to the visceral yolk sac, where exVE becomes apposed to extraembryonic mesoderm (Figure 1A). This is the site of specification of hematopoietic and endothelial progenitors, which are organized into blood islands (reviewed in (Baron, 2005; Fraser and Baron, 2009; Medvinsky et al., 2011)). Instructive signals emanating from exVE are essential in this process, and exVE can reprogram anterior epiblast into posterior fates (Belaoussoff et al., 1998). Candidate exVE secretory factors include Vascular Endothelial Growth Factor (VEGF) and Indian Hedgehog (IHH) (Dyer et al., 2001; Pierre et al., 2009).
Dissection of the underlying molecular mechanisms that orchestrates the dialog between embryonic and extraembryonic tissues has been hampered by the limiting amounts and relative inaccessibility of embryonic tissues. The isolation of stem cell lines derived from, and representing, the three lineages of the blastocyst has offered an attractive tool for investigating these events. At least three distinct cell types of stem cells can be isolated from blastocyst stage mouse embryos and propagated in culture, they include: EPI-derived embryonic stem (ES) cells (Evans and Kaufman, 1981; Martin, 1981), TE-derived trophoblast stem (TS) cells (Tanaka et al., 1998) and PrE-derived extraembryonic endoderm (XEN) cells (Kunath et al., 2005).
In terms of their molecular signature and cell morphology XEN cells share many properties with the PrE as well as its PE and VE derivatives, suggesting that they constitute a heterogenous population when maintained in routine culture (Brown et al., 2010b; Kunath et al., 2005). For example, the transcription factors GATA4, GATA6, SALL4 and SOX17 and the receptor tyrosine kinase PDGFRα are required for the maintenance of XEN cells in vitro and are also required in the PrE lineage in vivo (Artus et al., 2010; Artus et al., 2011; Lim et al., 2008; Niakan et al., 2010). XEN cells express PE markers including Cytokeratin 19 (Krt19), Laminin B1 (Lamb1) and Sparc and t-type Plasminogen activator (tPA). They also express VE markers including Hepatocyte nuclear factor 4, (Hnf4a), Transthyretin (Ttr) and u-type Plasminogen activator (uPA) (Brown et al., 2010b; Kunath et al., 2005). In chimeras, XEN cells generally contribute preferentially to the PE (Kunath et al., 2005). Live imaging has revealed morphological transitions independent of cell division in XEN cell cultures, an indication that even if XEN cells resemble PE cells some heterogeneity exists within the cell population (Kunath et al., 2005). Most importantly, the extrinsic signals required to maintain XEN cells in their undifferentiated state, versus directing their differentiation into PE and VE lineages, are currently not understood. Interestingly, Nodal stimulation induced XEN cell to differentiate towards visceral endoderm and anterior visceral endoderm fates (Kruithof-de Julio et al., 2011).
Given the role of BMP4 in VE differentiation in the embryo (Soares et al., 2005; Soares et al., 2008; Yamamoto et al., 2009), we sought to test the effect of this factor on XEN cells. We observed that upon BMP4 stimulation, XEN cells underwent a dramatic change in their morphology and formed a polarized epithelium. This morphological transformation was accompanied by modulation of the expression of several regulators of epithelium-to-mesenchyme (EMT) transition. The effect of BMP4 was stable and reversible. Since BMP4-treated XEN cells could be maintained in an epithelial state without further changes in their morphology or gene expression, they likely had not entered into a program of terminal differentiation. Strikingly, the effect of BMP4 on XEN cells was alleviated when LIF was added to the culture medium, an observation that might shed light on the extrinsic conditions necessary to isolate, maintain and manipulate XEN cells in culture.
To determine more precisely the identity of these cells, we characterized their molecular signature by gene expression analysis. In addition to expressing epithelial markers, BMP4-treated XEN cells upregulated markers highly expressed in the exVE, but not markers specific to emVE or DVE, suggesting that BMP4 signalling directed XEN cell differentiation towards an exVE-like identity. BMP4-treated XEN cells expressed the VE-specific Afp∷GFP transgene (Kwon et al., 2006) but did so, surprisingly, in a mosaic manner. Detailed analysis revealed that this reporter was fluctuating and that these fluctuations were associated with changes in the expression of only five genes. These observations therefore suggest that BMP4-treated cells represent a relatively homogenous population.
We were not able to formally validate the identity of BMP4-treated XEN cells using chimera or teratoma experiments to probe their developmental potential. However, as the exVE is adjacent to the site of blood island formation in vivo, we assayed the ability of BMP4-treated XEN cells to promote the expansion of primitive erythroid cells (EryP) progenitors. We noted that even though both untreated and BMP4-treated XEN cells promoted EryP progenitor expansion in vitro, BMP4-treated XEN cells exhibited a more potent effect, suggesting that these cells were functioning as exVE. In sum, our observations suggest that XEN cells can be directed to differentiate into various PrE derivatives and used as a cellular tool to investigate inductive developmental processes, such as hematopoiesis (this study) and cardiogenesis (Brown et al., 2010a).
MATERIAL AND METHODS
XEN cell isolation and culture
The Afp∷GFPTg/+ (Kwon et al., 2006) and Afp∷GFPTg/+; CAG∷mRFP1Tg/+ (Long et al., 2005) XEN cell lines were established as previously described (Artus et al., 2010) on mitomycin C-treated primary murine embryonic fibroblasts (MEFs) in ES cell media containing recombinant leukemia inhibitory factor (LIF) (Mereau et al., 1993). Wild-type (Brown et al., 2010b) and Afp∷GFP Tg/+ XEN cell lines were routinely passaged every 2 to 3 days and maintained on gelatin-coated dishes in high glucose Dulbecco’s modified Eagle’s media (D-MEM, Gibco) supplemented with 0.1 mM 2-mercaptoethanol, 1 mM non-essential amino acids, 1 mM sodium pyruvate, 2 mM glutamine, 100 units/mL penicillin and 100 μg/mL streptomycin and 15% fetal bovine serum (FBS). All cells were grown at 37°C in 5% CO2. Stably expressing cell lines were generated by co-transfection of CAG∷GFP-GPI (Rhee et al., 2006) and PGK∷Puro (Tucker et al., 1996) plasmids. 10 days after selection in the presence of 1.5 μg/mL puromycin, fluorescent XEN cell colonies were picked and expanded. IM8A1 XEN cells (kind gift of T. Kunath) were maintained exactly as decribed previously (Kunath et al., 2005).
For differentiation, XEN cells were cultured in presence of recombinant BMP2, BMP4 or Noggin proteins (R&D systems) or LIF (103 units/mL, ESGRO, Chemicon) at the indicated concentrations in serum-containing conditions or in N2B27 medium. N2B27 media is a 1:1 mixture of DMEM/F12 supplemented with N-2 and neurobasal media supplemented with B-27 (all products from Gibco), as described in (Ying and Smith, 2003). Inhibitor compounds used were: 2μM Dorsomorphin (Sigma), 1 μM P6, 10 μM SB203580 (both from Calbiochem), 20 μM LY294002 and 10 μM U0126 (both from Cell Signaling).
Kidney capsule and blastocyst injection
Approximately 106 XEN cells were embedded in 0.2% agarose and injected under kidney capsules of SCID mice (C.B-17 SCID, Taconic Farms Inc.) as described in (Nagy et al., 2003). Tumors were collected one to two months later, fixed in formalin, embedded in paraffin wax and sectioned. Sections were stained with Masson’s trichrome stain.
5-10 Afp∷GFPTg/+, CAG∷mRFP1Tg/+ or CAG∷GFP-GPI XEN cells were injected into recipient ICR blastocysts and transferred to E2.5 pseudopregnant ICR females as described in (Nagy et al., 2003). Embryos were dissected at E6.5 days and fluorescently labeled cells were identified using a laser scanning confocal microscope.
Immunostaining and DiI-HDL uptake assay
Cells were cultured on glass coverslips prior to immunostaining. Coverslips were coated for 1h at room temperature with 0.1% gelatin (Sigma), Poly-L-Lysine (Sigma) or 10 μg/mL Collagen type IV (BD Biosciences), Laminin (BD Biosciences) or Fibronectin (Gibco). Immunostaining was performed as previously described (Artus et al., 2010; Artus et al., 2005). Primary antibodies used were: anti-AMN (1:500, kind gift from E. Lacy), anti-βCAT (1:500, BD Transduction laboratories), anti-CDH1 (1:300, Sigma), anti-CUBN (1:1000, kind gift from R. Kozyraki), anti-CX43 (1:200, Sigma), anti-ITGA5 (1:100, Santa Cruz), anti-ITGA6 (1:100, Abcam), anti-LRP2 (1:5000, kind gift from R. Kozyraki), anti-STAT3 (1:200, R&D Systems), anti-ZO-1 (1:200, Zymed). Alexa Fluor-conjugated secondary antibodies (Invitrogen) were used at 1:200. DNA was counterstained with Hoechst 33342 (1:200, Invitrogen) and F-actin was visualized with Alexa Fluor-phalloidin (1:1000, Invitrogen). Coverslips were mounted in Vectashield (Vector Laboratories).
For DiI-HDL uptake, XEN cells were cultured in XEN cell medium supplemented with 10 μg/mL DiI-HDL (Biomedical Technologies Inc.) for 2h 30min at 37°C, then fixed or washed twice in pre-warmed media and cultured for an additional 30 min before fixation.
Image data acquisition and processing
Widefield images were acquired using a Leica M165FC stereo-dissecting microscope equipped with a Zeiss axiocam MRc camera. Laser scanning confocal images of immunostained and GFP reporter expressing cells were acquired on a Zeiss LSM 510 META. Fluorescence was excited with a 405-nm laser diode (Hoechst), a 488-nm Argon laser (GFP, Alexa Fluor 488), a 543-nm HeNe laser (Alexa Fluor 546, 568) and a 633-nm HeNe laser (Alexa Fluor 633 and 647). Images were acquired using a Plan-apochromat 20x/NA 0.75 objective, with z-stacks comprising an optical section thickness of 0.2-1.2 μm. Raw data were processed using Zeiss AIM software (Carl Zeiss Microsystems) or IMARIS 6.4.2 software (Bitplane AG). 3D time-lapse data comprised z-stacks acquired at 10 min time intervals.
Microarray analysis
Afp∷GfpTg/+ XEN cells were cultured for 10 days in N2B27 medium (control) or N2B27 medium supplemented with 25 ng/mL BMP4 before RNA extraction using TRIzol (Invitrogen). Afp∷GfpTg/+ treated XEN were routinely maintained in N2B27 supplemented with 10 ng/mL BMP4. GFP-positive and -negative cells were sorted and cultured for 24 hours before RNA extraction. 200 ng of total RNA was labelled using an Illumina® TotalPrep™ RNA Amplification Kit (Applied Biosystems) and used to probe an Illumina expression array (MouseWG-6_V2_0_R0_11278593) in triplicate for untreated and BMP-treated conditions using Illumina BeadStudio version 3.4.0.
The raw Illumina data were analyzed using Bioconductor packages in R statistical language. Data were first normalized using LumiExpresso ( ) function. The differentially expressed genes in each pair-wise comparison were obtained using the Limma ( ) R-package (with FDR = 0.05 and fold-change cut-off 2). Functional categories were identified using the DAVID tool (http://david.abcc.ncifcrf.gov/) and illumina probes were mapped to gene symbols names using lumiMouseIDMapping.db. Functional categories with Benjamini-corrected enrichment p-values ≤0.05 were declared enriched. Data have been deposited in NCBI GEO database under the accession number GSE32094 (http://www.ncbi.nlm.nih.gov/geo/query/acc.cgi?acc=GSE32094).
Real-time quantitative PCR
Total RNA was reverse transcribed using the Superscript III First-Strand Synthesis Kit (Invitrogen) and 50 ng of the product used as template for PCR amplification. Quantitative real-time reverse transcription-polymerase chain reaction (q-PCR) was performed in triplicate using SYBR Green (Roche) on a LightCycler 480 real-time PCR instrument and analyzed with LightCycler 480 software (version 1.5.0.39). Primer sequences used are described in (Samavarchi-Tehrani et al., 2010).
Primitive erythroid colony formation
ε-globin∷H2B-EGFPTg/+ (Isern et al., 2008) embryos were dissected at E8.0-8.5 (2-12 somite pairs). Whole embryos were dispersed into single cells using 0.05% trypsin/0.53mM EDTA (Cellgro, 25-052-CI), and EryP (GFP+) cells were sorted on an BD Influx™ Cell Sorter or DAKO-Cytomation MoFlo High Speed Sorter. 104 EryP cells were cultured on gelatin-coated 24-well plates containing XEN cells, BMP4-induced XEN cells or without XEN cells in Iscove’s Modified Dulbecco’s Media (IMDM; Gibco, 12440) supplemented with 10% fetal bovine plasma derived serum (PDS; Animal Technologies, FBP-186), 5% protein-free hybridoma medium (PHMII; Invitrogen, 12040-077), 2 mM L-Glutamine, 25 μg/mL ascorbic acid, 0.6 mM 1-Thioglycerol (MTG; Sigma, M6145) and 4 U/mL human recombinant erythropoietin (EPO; Epogen). XEN cells were plated 1-4 days prior to co-culture with EryP and they were always >90% confluent at the time of EryP co-culture. After 5 or 10 hr, non-adherent cells were collected and mixed with EryP-CFC medium (40% Methylcellulose Methocult M3134 (Stemcell Technologies, 03134), 10% PDS, 5% PFHMII, 2 mM L-Glutamine, 25 μg/mL ascorbic acid, 0.6 mM MTG and 4 U/mL human EPO in IMDM) and incubated at 37°C in 5% CO2 as previously described (Isern et al., 2011). Primitive erythroid colonies were scored 4-5 days later. Of note, we found that culturing EryP for as long as 24 hr resulted in reduced cell viability and progenitor activity (JI, S. Fraser, Z. He, PD and MHB data not shown).
RESULTS AND DISCUSSION
BMP4 signalling stably and reversibly alters XEN cell morphology
XEN cells are stem cells derived from and representative of the PrE lineage (Kunath et al., 2005). Given the role of BMP signalling in the formation and differentiation of the visceral endoderm within the PrE cell lineage of the mouse embryo (Fig. 1A), we sought to determine the consequences of activating this signalling pathway in XEN cells. To do so, we first tested the effect of adding recombinant BMP proteins at various concentrations ranging from 5 to 20 ng/mL in serum containing culture conditions for 4 consecutive days (Fig. 1B).
As previously reported (Kunath et al., 2005), when maintained under standard culture conditions at low densities, XEN cells resemble PE cells and exhibit at least two distinct morphologies that are readily identified with brightfield illumination: a round refringent-type morphology and a more adherent-type morphology. At higher densities these two cell types coexisted but were more difficult to distinguish (Fig. 1C). We noted that exposure of XEN cells to BMP4 or BMP2 produced a profound effect, such that after 4 days of treatment, cells acquired a homogenous morphology. They appeared flattened and formed tight monolayer colonies that usually covered 50 to 80% of the surface of the cell culture dish (Fig. 1C, insets). This morphology was rarely observed in XEN cells maintained under standard culture conditions. We noted that BMP2 and BMP4 had a similar effect on cell morphology. Interestingly, Bmp2 and Bmp4 expression has previously been reported in XEN cells (Brown et al., 2010b; Kunath et al., 2005). Our observations suggest the existence of a threshold of BMP activity that, when exceeded, leads to the observed morphological transition.
A similar effect was observed using several independently derived XEN cell lines including IM8A1, a cell line isolated under TS cell derivation conditions and maintained in TS cell media without heparin and FGF4 (Kunath et al., 2005) (Fig. S1A). We also noticed that the effect was more pronunced when BMP4 was apply to serum containing medium (RPMI1640) compared to fibroblast conditioned medium (MEF-CM). This suggests that components secreted from fibroblasts inhibitit the effect of BMP stimulation. Of note, although addition of recombinant Noggin protein (100 ng/mL) or Dorsomorphin (2 μM) inhibited the effect on XEN cells resulting from the addition of 10 ng/mL BMP4, neither elicited an overall effect of BMP inhibition on untreated XEN cells as evident by cell morphology, cell proliferation and cell death (Fig. S2). These data would suggest that BMP signaling is not active in XEN cells, but that these cells are primed to respond to BMP stimulation.
We next analyzed the kinetics of the observed morphological transition resulting from addition of BMP proteins to XEN cell cultures. XEN cells were treated with 10 ng/mL BMP4 in both serum conditions and serum-free conditions (N2B27 medium) and their morphology was monitored daily (Fig. 1D). During the first 2-3 days after BMP4 addition, both untreated and treated XEN cells exhibited their usual dispersed morphology. However, after 3 days, a few flattened colonies were observed in cells maintained in the presence of BMP4. The size of these colonies greatly increased by 4 days. This rapid morphological conversion between day 3 to day 4 suggests that almost all XEN cells are able to undergo this transition, rather than a subset of the population which then exhibit a selective growth advantage. Notably, we did not observe any increase in cell death during BMP4 stimulation that could account for a selective elimination of a subset of cells. We also noticed that when treated cells were trypsinized and replated in presence of BMP4, they would retain this morphology at high density (data not shown). This would suggest that this morphological change was dependent on cell density and could account for the change in morphology between day 3 and day 4 which corresponds to the time when cells reached confluency.
This morphological change was observed both in cells maintained in serum containing conditions on tissue culture treated dishes or on glass coverslips coated with gelatin. In serum-free N2B27 media, we noted that, in contrast to untreated XEN, BMP-treated cells were more difficult to grow on glass or gelatin-coated glass, as they failed to properly attach (Fig. S3). We tested different extracellular matrix (ECM) substrates including poly-L-lysine, and found that coating coverglass with collagen type IV, laminin or fibronectin supported the attachment and subsequent growth of both treated and untreated cells (Fig. S3). These data suggest that ECM components can affect XEN cell behavior, growth and differentiation, as also suggested by our microarray analyses (Fig. S4).
Interestingly, we found that BMP4-treated XEN cells could be maintained for extended periods of time (more than ten passages) without any significant loss of viability or change in their morphology. Moreover, these cells could be efficiently recovered in this state upon cryopreservation and subsequent thawing. Thus, despite the profound change in cell morphology, BMP signalling might not promote entry into a full program of cellular differentiation often associated with cell cycle exit. This is for example the case with ES cells, which can be maintained virtually indefinitely in an undifferentiated state, however their differentiation is usually irreversible and accompanied by cell death (Duval et al., 2000) and cell cycle exit (Burdon et al., 2002).
Next, we tested whether sustained BMP4 signalling was required to maintain this phenotype. To do so, we removed BMP4 from the culture medium and monitored cell behavior daily (Fig. 2A). BMP4-treated XEN cells maintained a flattened adhesive morphology over a period of 4 days (Fig. 2B, upper panel). By contrast, 2 days after BMP4 removal, some cells started to detach and migrate away from colonies, and by 4 days most of the cells within a culture were no longer associated in colonies (Fig. 2B, lower panel). This loss of epithelial integrity was not accompanied by an overall increase in cell death (data not shown). These data therefore suggest that the effect of BMP stimulation is reversible, and that maintenance and expansion of the XEN cells exhibiting a flattened epithelial-like morphology requires the presence of BMP4 or BMP2 in the culture media.
Figure 2. Removal of BMP4 leads to a reversion of the morphological transition.
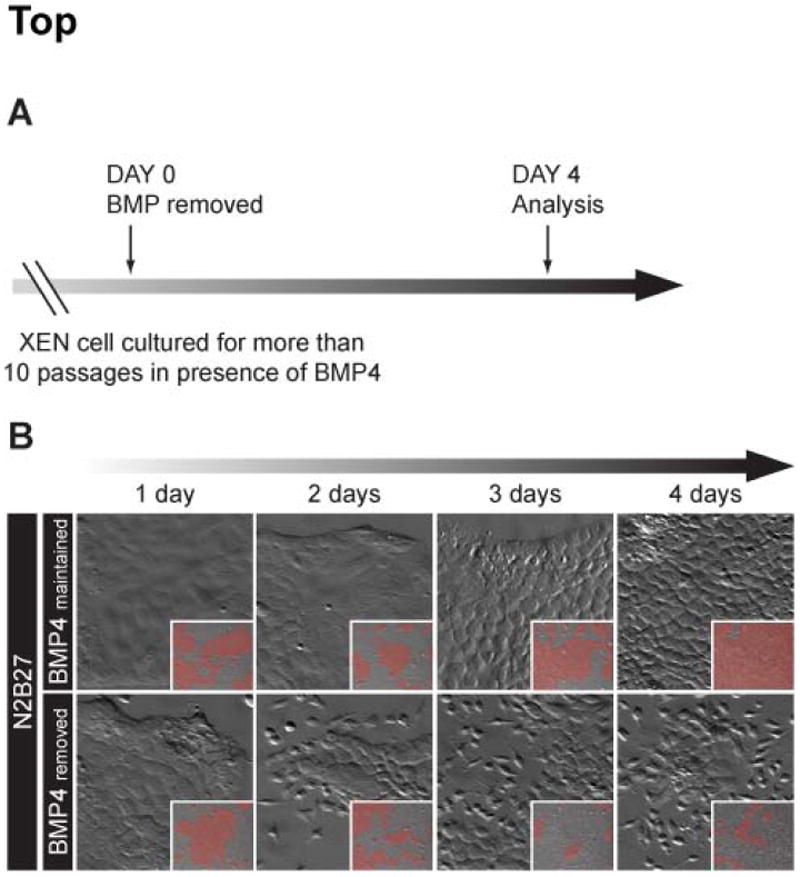
(A) Diagramatic representation of BMP withdrawal scheme. (B) Kinetics of the morphological changes induced upon BMP4 removal (lower panels) compared to XEN cells maintained in serum-free (N2B27) medium supplemented with 10 ng/mL BMP4 (upper panels). High magnification zooms of low magnification images (inset) acquired with a 10X magnification. In the insets, areas of epithelial cell colonies are highlighted in red.
Taken together, our data suggest that BMP2/4 signalling regulates XEN cell morphology by inducing the coordinate formation of adherent flattened cells. In serum-free culture conditions this effect is promoted by the presence of ECM such as fibronectin. Sustained signalling is required to maintain cells in this state. Moreover, this morphological transition is reversible and apparently stable, as XEN cells can be maintained in this state for extended periods of time before reverting in the absence of BMP4 protein.
BMP4 signalling induces the formation of a polarized epithelium in XEN cells
Since the morphology adopted by BMP4-treated XEN cells was reminiscent of epithelia, we sought to clarify the nature of this morphological transition. To do so, we analyzed the localization of various proteins exhibiting a polarized distribution in epithelial cells and involved in cell-cell junctions and communication. These included adherens junction components such as βcatenin (βCAT) and E-cadherin (CDH1), Zona occludens-1 (ZO-1), which localizes to tight-junctions, and the gap junction protein Connexin-43 (CX43) (Fig. 3A and Fig. S1B). Immunodetection of these proteins revealed that, in contrast to control XEN cells that established relatively poor connections with their neighbors, even at high densities, treatment with BMP4 induced a morphological transformation of XEN cells and concomitant localization of these proteins at cell-cell contacts. These data indicate the establishment of adherens, tight and gap junctions in BMP4-treated XEN cells, and suggest these cells have transformed into an epithelium.
Figure 3. BMP4 stimulation induces the formation of a polarized epithelium.
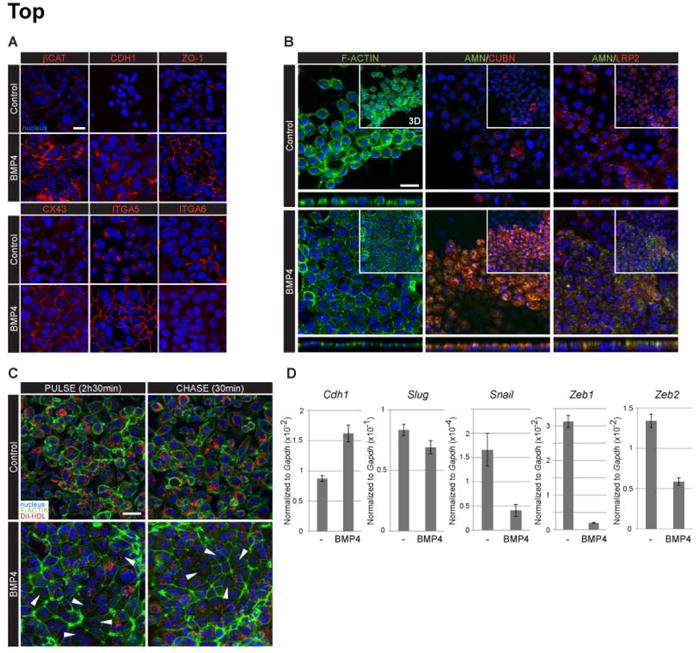
(A) Visualization of adherens junction (βCAT, CDH1), tight junction (ZO-1) and gap junction (CX43) constituent proteins in control and BMP4-treated XEN cells. BMP4 treatment also affected the localization and expression of Integrin α5 (ITGA5) and Integrin α6 (ITGA6) proteins. (B) Changes in the localization of F-actin, Amnionless (AMN), Cubilin (CUBN) and LRP2 proteins upon BMP4 treatment. Images correspond to single optical sections and orthogonal views (below), insets are 3D projections. (C) DiI-HDL uptake of control and BMP-4 treated XEN cells incubated for 2h 30min in presence (PULSE) and then for 30 min in absence (CHASE) of the dye. Arrowheads indicate cells with low levels of DiI-HDL. (D) qPCR analysis of MET transcriptional regulator gene expression in control (-) and BMP4-treated XEN cells. (A-C) βCAT, CDH1, ZO-1, CUBN, LRP2, Di-HDL, red; F-actin, AMN, green; nuclei counterstained with Hoechst, blue. Scale bars: 20 μm.
Gene expression analyses, carried out by expression profiling cells using microarrays, revealed that in addition to the establishment of cell-cell junctions, BMP4- treated XEN cells had modulated the expression of various genes encoding structural proteins (Fig. S4). We observed an upregulation of the intermediate filament proteins Cytokeratin 18 (Krt1-18), Cytokeratin 19 (Krt1-19) and downregulation of Cytokeratin 23 (Krt1-23). Interestingly, several genes encoding laminin subunits were downregulated (e.g. Lama1, Lamb1-1 and Lamc1), and the expression levels of Nidogen 1 (Nid1) and Vitrin (Vit) were reduced. Thus, several major components of Reichert’s membrane synthesized by PE cells were downregulated upon BMP4 treatment (Oner et al., 2006).
In addition, we observed a change in the signature of expression of various integrins, suggesting that BMP4 treated XEN cells might modify their affinity for ECM proteins. For example, comparisons between our expression profile analysis with the KEGG pathway ‘ECM-receptor interaction’ (http://www.genome.jp/kegg-bin/show_pathway?hsa04512) revealed that fibronectin receptors (ITGA5-ITGB1 and ITGAV-ITGB6) were enriched, whereas ITGA6-ITGB1 (laminin receptor) and ITGAVITGB5 (vitronectin receptor) were downregulated (Fig. 3A and S4).
In vivo, the PrE of the blastocyst and VE of the postimplantation embryo, but not the PE, form an epithelium that exhibits apical-basal polarity. A first indication that BMP4-treated XEN cells had acquired apical-basal polarity came from the distribution of F-actin, which was homogenously distributed in control XEN cells, but which was localized at the apical cortex of BMP4-treated cells (Fig. 3B). During embryonic development, a complex of membrane-associated proteins comprising Amnionless (AMN), Cubilin (CUBN) and Megalin (LRP2) is localized to the apical surface of VE cells, where it mediates endocytosis critical for embryogenesis (Kalantry et al., 2001; Smith et al., 2006; Strope et al., 2004; Tomihara-Newberger et al., 1998). We noted that BMP4 treatment increased the level of expression of both Amn (array fold-change (FC)=+16.5) and Lrp2 (array FC=+3.7) in XEN cells. To further investigate the establishment of epithelial polarity in these cells, we analyzed the localization and noted any changes in the subcellular distribution of this complex. AMN was not detected in untreated cells, whereas CUBN and LRP2 were expressed in a subset of cells where they exhibited a homogenous localization at the cell surface (Fig. 3B). BMP4 stimulation induced a global increase in the level of AMN/CUBN/LRP2 complex proteins, which were found to be apically localized, consistent with the notion that a polarized epithelium resembling VE had formed upon BMP treatment.
It has previously been reported that the AMN/CUBN/LRP2 complex mediates HDL uptake in the VE, intestine and kidney (Hammad et al., 1999; Kozyraki et al., 1999). Uptake can be visualized using a fluorescent DiI-HDL probe (Hatzopoulos et al., 1998; Smith et al., 2006). The status of HDL uptake by PrE cells of the blastocyst or PE is not known. We therefore sought to determine if BMP4 treated XEN cells were endocytosing HDL via the apically-localized CUBN complex. Cells were incubated in the presence of the fluorescent DiI-HDL dye, washed and immediately fixed or chased for 30 min. Surprisingly, we found that virtually all untreated XEN cells were labeled, whereas BMP-treated cells exhibited lower levels of DiI-HDL incorporation, with approximately half of them not having incorporated the dye (Fig. 3C, arrowhead). We therefore conclude that polarized, BMP-treated XEN cells exhibited different properties with respect to endocytosis in comparison to untreated XEN cells. This observation is interesting as untreated cells, which do not express Amn, more readily take up DiI-HDL as compared to treated cells which express all three components of this complex.
This situation apparently contrasts with the endoderm of the visceral yolk sac which has a high propensity for DiI-HDL uptake (Hatzopoulos et al., 1998; Smith et al., 2006). Several explanations could account for this disparity. First, the activity of the CUBN complex may be modulated by post-translational modifications that differ in vivo and in cells grown in culture. Second, the difference of cell morphology between rounded untreated XEN cells and epithelial BMP4-treated XEN cells may affect the total cell membrane surface that can uptake the DiI-HDL. Lastly, additional HDL binding proteins may be differentially expressed between treated and untreated XEN cells. This is for example the case of Scarb2, an alternative splicing variant of SR-BI, encoding the scavenger protein SR-BII (Eckhardt et al., 2004) which we found to be downregulated by a 2.5 fold-change.
We next sought to determine whether this dramatic epithelialization concomitant with BMP4 addition to the culture media was driven by a mesenchymal-to-epithelial transition (MET) mechanism. A major effector of MET is E-cadherin, which we found to be upregulated in BMP4-treated XEN cells as assayed by immunofluorescence (Fig. 3A), microarray (FC=+1.96) and qPCR (FC=+1.86; Fig. 3D). E-cadherin expression is tightly and directly controlled by the action of multiple negative mesenchymal transcriptional regulators, such as SLUG, SNAIL, ZEB1 and ZEB2 (Thiery et al., 2009). We therefore analyzed the expression of these negative transcriptional regulators by global gene expression and qPCR (Fig. 3D and Table 2). We did not find evidence for differential expression of Slug (array FC~1, qPCR FC=-1.2). Snail was modestly upregulated in our arrays (array FC=+1.3 and +1.5) but downregulated by qPCR (qPCR FC=-4.1). This discrepancy could be explained by the specificity of the microarray probesets. Similarly, Zeb2 (Zfhx1b) was not found to be differentially expressed in our microarray (array FC~1), but was downregulated by qPCR (qPCR FC=-2.3). The most significantly differentially expressed gene was Zeb1 (Zfhx1a), which we found downregulated both in our microarray (FC=-3.1) and by qPCR (FC=-16.1), suggesting that ZEB1 is likely to be a key regulator of E-cadherin in XEN cells, and also perhaps in vivo within the VE.
Table 2.
List of the genes downregulated (FC ≤-2, FDR=0.05) in XEN cells upon BMP4 treatment.
| Illumina ID | Gene Symbol | Fold Change | Illumina ID | Gene Symbol | Fold Change | Illumina ID | Gene Symbol | Fold Change | Illumina ID | Gene Symbol | Fold Change |
|---|---|---|---|---|---|---|---|---|---|---|---|
| 1240424 | Nupr1 | -23.0 | 3440767 | 9230117N10Rik | -3.4 | 510722 | Tgfbr3 | -2.8 | 5900424 | LOC384009 | -2.4 |
| 5550161 | 8430408G22Ri | -8.7 | 2810685 | Glipr1 | -3.4 | 5960020 | Fmnl2 | -2.8 | 1300747 | Clu | -2.4 |
| 2470717 | Aqp8 | -8.3 | 1660368 | Vit | -3.3 | 4640463 | Evl | -2.8 | 3890022 | Ndrl | -2.4 |
| 2850670 | C030002B11Ri | -8.1 | 5270452 | Tiam1 | -3.3 | 4210619 | Mgst3 | -2.8 | 6480554 | BC023892 | -2.4 |
| 7160093 | Aqp8 | -8.0 | 450632 | Igf1 | -3.3 | 7330292 | Mgst2 | -2.8 | 2360519 | Tek | -2.4 |
| 4590414 | Igfbp5 | -7.7 | 4120687 | Glipr2 | -3.2 | 5570669 | Epb4.9 | -2.7 | 1070274 | St3gal4 | -2.4 |
| 2760053 | 6430704N06 | -7.4 | 650435 | A730054J21Rik | -3.2 | 4570201 | AA407270 | -2.7 | 5340091 | 2310058A03Rik | -2.4 |
| 290315 | 1700093E07Rik | -6.9 | 3360343 | Pde1b | -3.2 | 4860445 | Stard8 | -2.7 | 3450180 | 1810009M01Ri | -2.4 |
| 4010292 | Nid1 | -6.8 | 2350019 | Fhl2 | -3.2 | 5670465 | Pvrl3 | -2.7 | 7160070 | 6430548M08Ri | -2.4 |
| 5490121 | Capn6 | -6.3 | 2230068 | Gaa | -3.2 | 6100523 | Cugbp2 | -2.7 | 1660450 | Tmtc4 | -2.4 |
| 5360228 | Lor | -6.0 | 4480411 | Set7 | -3.2 | 1770152 | Itgb5 | -2.7 | 1050095 | Upp1 | -2.4 |
| 430561 | Bcat1 | -6.0 | 7510072 | Gstm2 | -3.2 | 4060075 | Nfib | -2.7 | 650291 | Calr | -2.4 |
| 4920487 | Ckb | -5.8 | 6350196 | Mrg1 | -3.2 | 1400601 | Stard8 | -2.7 | 4880026 | Tspan17 | -2.4 |
| 4760224 | Ctgf | -5.7 | 2470228 | 6330404C01Rik | -3.2 | 3390192 | Psca | -2.7 | 4920193 | Mertk | -2.4 |
| 6550379 | 1810036H07Rik | -5.6 | 7560647 | Meis1 | -3.1 | 6520129 | Atf5 | -2.7 | 6280689 | 9530081N05Rik | -2.4 |
| 2940592 | Gsta1 | -5.6 | 2070152 | Timp2 | -3.1 | 6380255 | Rtn1 | -2.6 | 6940634 | Mllt3 | -2.4 |
| 160100 | Igfbp5 | -5.5 | 3420056 | Pde1b | -3.1 | 2000739 | 1110012J17Rik | -2.6 | 2140753 | Grina | -2.4 |
| 2470040 | Gnai1 | -5.3 | 510286 | Aldh6a1 | -3.1 | 4830040 | C130076O07Ri | -2.6 | 6040292 | Tgfb1i4 | -2.4 |
| 160333 | Mllt3 | -5.1 | 2970500 | Serpinb6c | -3.1 | 70386 | Satb1 | -2.6 | 4050670 | Efnb2 | -2.4 |
| 1230767 | Thbd | -5.0 | 6200719 | Acas2l | -3.1 | 4200678 | 9030625A11Rik | -2.6 | 1850170 | Slc6a15 | -2.3 |
| 4010082 | Ctgf | -4.9 | 4640685 | 6230401I02Rik | -3.1 | 60132 | LOC385644 | -2.6 | 5700364 | Trpm6 | -2.3 |
| 160097 | Bmper | -4.8 | 4230452 | Glipr2 | -3.1 | 2850575 | Vcam1 | -2.6 | 4670504 | LOC382162 | -2.3 |
| 6270037 | Susd2 | -4.6 | 3940639 | Glipr2 | -3.1 | 1690187 | Ly6a | -2.6 | 2140678 | Tmem150 | -2.3 |
| 5080292 | Igfbp5 | -4.5 | 4290403 | Zfhx1a | -3.1 | 1990091 | S100a13 | -2.6 | 580465 | Klf3 | -2.3 |
| 870309 | Serpine2 | -4.5 | 2000722 | Calr3 | -3.1 | 7160167 | Emp1 | -2.6 | 3400577 | Mybpc3 | -2.3 |
| 460403 | Gsta1 | -4.3 | 610273 | Obfc2a | -3.1 | 730025 | Gstm2 | -2.6 | 3390221 | Bace2 | -2.3 |
| 4040435 | Ndg2 | -4.3 | 6130722 | Spink4 | -3.1 | 6330195 | Camk2n1 | -2.6 | 4900110 | Lamc1 | -2.3 |
| 7320685 | Akr1b8 | -4.3 | 5720136 | Aldh3b1 | -3.1 | 1440040 | Garnl4 | -2.6 | 6270112 | Frrs1 | -2.3 |
| 620372 | Sphk1 | -4.2 | 7610215 | 2810410A03Rik | -3.0 | 2370687 | Rtn1 | -2.6 | 5050427 | Lamc1 | -2.3 |
| 1090239 | Pip5k1a | -4.2 | 4280131 | Slc24a3 | -3.0 | 7610678 | Comt | -2.6 | 2680520 | mtDNA_ND4L | -2.3 |
| 5420730 | Calr3 | -4.1 | 3520328 | BC038479 | -3.0 | 1300475 | Stra6 | -2.6 | 2760139 | A830039N02Ri | -2.3 |
| 1440019 | Cd59a | -4.1 | 5890059 | Epb4.9 | -3.0 | 6290133 | 2310067E08Rik | -2.5 | 2350397 | Wars | -2.3 |
| 6650035 | 2210401J11Rik | -4.1 | 1050619 | Herpud1 | -2.9 | 3310564 | Scarb2 | -2.5 | 1190431 | Lama1 | -2.3 |
| 7040243 | D0H4S114 | -4.0 | 3190731 | Prickle1 | -2.9 | 4850091 | 8-Sep | -2.5 | 5820204 | Emp2 | -2.3 |
| 70544 | Gsta1 | -4.0 | 4540674 | 6720469N11Rik | -2.9 | 7320239 | Reck | -2.5 | 1580349 | 1810006K23Rik | -2.3 |
| 60593 | Tm4sf3 | -4.0 | 240348 | Chn2 | -2.9 | 2000647 | Igf1 | -2.5 | 7050328 | 2310016C16Rik | -2.3 |
| 2630446 | Fbxo15 | -4.0 | 7100259 | Mme | -2.9 | 3400050 | Man2a1 | -2.5 | 110706 | Ppic | -2.3 |
| 6510270 | Sema6d | -3.9 | 6510736 | 1500005K14Rik | -2.9 | 4200341 | Lbp | -2.5 | 3610440 | Psap | -2.3 |
| 3710465 | Gsta2 | -3.9 | 2120286 | Mfge8 | -2.9 | 3420500 | Oxct | -2.5 | 6200563 | Cct6b | -2.3 |
| 1090180 | Arhgdib | -3.9 | 2690025 | Gstm2 | -2.9 | 3710402 | Cln2 | -2.5 | 3870328 | 2310016C16Rik | -2.3 |
| 1660376 | 1110032E23Rik | -3.8 | 2230026 | 9130213B05Rik | -2.9 | 3830048 | Selenbp1 | -2.5 | 150504 | Efna5 | -2.3 |
| 1340253 | 4930403J22Rik | -3.8 | 7040253 | Msmb | -2.9 | 4730066 | Schip1 | -2.5 | 6960369 | Aadacl1 | -2.3 |
| 4780164 | Krt1-23 | -3.8 | 3930156 | Ptpla | -2.9 | 6620187 | Ndrg1 | -2.5 | 6550082 | Lamb1-1 | -2.3 |
| 1300121 | 9530018I07Rik | -3.7 | 4560731 | 1110014O20Ri | -2.8 | 1940669 | Hexb | -2.5 | 270681 | E030026I10Rik | -2.3 |
| 3060019 | Fbxo15 | -3.7 | 50129 | Herpud1 | -2.8 | 6940136 | Mllt4 | -2.5 | 2190048 | 2310005P05Rik | -2.3 |
| 7040600 | Tm7sf1 | -3.6 | 4540598 | Wfdc1 | -2.8 | 1340255 | C330002I19Rik | -2.5 | 5960070 | Fkbp9 | -2.3 |
| 7610239 | 2510009E07Rik | -3.6 | 3360681 | Nppb | -2.8 | 6330086 | Leprel1 | -2.5 | 4480333 | Ppic | -2.2 |
| 380246 | 5930418K15Rik | -3.5 | 2490682 | Dpp7 | -2.8 | 6550603 | Sepn1 | -2.4 | 3460110 | 5031436O03Ri | -2.2 |
| 1010435 | Gsto1 | -3.4 | 2470754 | BQ952480 | -2.8 | 5560470 | Psap | -2.4 | 6510465 | Mfge8 | -2.2 |
| 5560112 | Ccdc46 | -3.4 | 3710544 | Mgst3 | -2.8 | 1850487 | Foxq1 | -2.4 | 5390193 | Cd59b | -2.2 |
| 430403 | Ppfibp2 | -2.2 | 2070376 | Xpnpep2 | -2.1 | 60639 | Sbk | -2.0 | |||
| 5670634 | Synpo | -2.2 | 3400546 | Slc12a2 | -2.1 | 4260181 | 4930506M07Ri | ||||
| 1110382 | Arl10b | -2.2 | 2600121 | Pigt | -2.1 | 5570132 | Ppm1l | ||||
| 5860725 | 6430527G18Ri | -2.2 | 3930050 | 2310016C16Rik | -2.1 | 6560181 | Lepre1 | ||||
| 2680561 | Ctns | -2.2 | 5340446 | 6330439P19Rik | -2.1 | 4060132 | Lrp4 | ||||
| 7050546 | Hist2h2aa1 | -2.2 | 7400392 | Sepw1 | -2.1 | 1470553 | Cpxm1 | ||||
| 2810603 | AW536289 | -2.2 | 2480059 | Anxa5 | -2.1 | ||||||
| 1850037 | Knsl5 | -2.2 | 7050446 | Cklfsf3 | -2.1 | ||||||
| 510050 | Sparc | -2.2 | 2000373 | Serping1 | -2.1 | ||||||
| 1990674 | Clps | -2.2 | 6350132 | Ctsl | -2.1 | ||||||
| 870370 | A930001D11Ri | -2.2 | 4730634 | 4631422O05Ri | -2.1 | ||||||
| 7160307 | Nr2f1 | -2.2 | 5360551 | B430214A04Ri | -2.1 | ||||||
| 3780040 | Taf9b | -2.2 | 5420397 | Tbc1d2b | -2.1 | ||||||
| 5260079 | Fchsd2 | -2.2 | 50079 | Hist1h1c | -2.1 | ||||||
| 6620717 | Pdir | -2.2 | 4860630 | 9930116P15Rik | -2.1 | ||||||
| 6020609 | Sesn1 | -2.2 | 4880553 | Sox5 | -2.1 | ||||||
| 6020356 | Prickle1 | -2.2 | 5810398 | Rnase4 | -2.1 | ||||||
| 5820133 | Ampd2 | -2.2 | 5090445 | Unc84b | -2.1 | ||||||
| 1240259 | Comt | -2.2 | 3850113 | A730017D01Ri | -2.1 | ||||||
| 6520603 | Reck | -2.2 | 1300082 | Clcn2 | -2.1 | ||||||
| 6510112 | Ybx3 | -2.2 | 2260253 | Clps | -2.1 | ||||||
| 4640114 | Actb | -2.2 | 160292 | Tyro3 | -2.1 | ||||||
| 3400709 | scl0001905.1_3 | -2.2 | 4040181 | Hey2 | -2.1 | ||||||
| 7050477 | Spock1 | -2.2 | 5090619 | 4732435N03Rik | -2.1 | ||||||
| 2100402 | Bgn | -2.2 | 3930154 | Tmem150 | -2.1 | ||||||
| 2900333 | Pdir | -2.2 | 1170037 | Sdfr2 | -2.1 | ||||||
| 7050056 | Crtap | -2.2 | 1820224 | Marcks | -2.1 | ||||||
| 2510382 | 3732412D22Rik | -2.2 | 1440600 | Copz2 | -2.1 | ||||||
| 620593 | Crtap | -2.2 | 2630224 | Gnaq | -2.1 | ||||||
| 1230612 | Aqp1 | -2.2 | 6400669 | Aldh3b1 | -2.1 | ||||||
| 1410113 | Uap1l1 | -2.2 | 1260519 | 5033403D15Rik | -2.1 | ||||||
| 6940278 | Bmp1 | -2.2 | 1230411 | Xpot | -2.0 | ||||||
| 4230086 | Slc39a13 | -2.2 | 3450735 | Wars | -2.0 | ||||||
| 3120520 | mtDNA_ND5 | -2.2 | 6550523 | 9630037P07Rik | -2.0 | ||||||
| 7650154 | C130027E04Ri | -2.2 | 840541 | Ptk6 | -2.0 | ||||||
| 2600286 | Fgf10 | -2.2 | 270086 | Slc5a5 | -2.0 | ||||||
| 6270131 | 2310009N05Rik | -2.2 | 4150739 | Cdc42ep3 | -2.0 | ||||||
| 1190377 | Cerk | -2.2 | 4200059 | Selenbp2 | -2.0 | ||||||
| 6650039 | Raver2 | -2.2 | 7380048 | BC017612 | -2.0 | ||||||
| 4180437 | Slc7a5 | -2.2 | 130519 | Sat1 | -2.0 | ||||||
| 2100278 | Plk2 | -2.2 | 7380241 | C230093N12Ri | -2.0 | ||||||
| 50242 | 9430080K19Rik | -2.2 | 2320356 | Calu | -2.0 | ||||||
| 20706 | 5730537D05Rik | -2.1 | 5490452 | Galnt2 | -2.0 | ||||||
| 5860075 | App | -2.1 | 130121 | Asah1 | -2.0 | ||||||
| 3460670 | Oxct1 | -2.1 | 5870687 | Slc29a1 | -2.0 | ||||||
| 4780113 | Large | -2.1 | 7650273 | Hist1h1c | -2.0 | ||||||
| 1850041 | 5-Sep | -2.1 | 50292 | Cobl | -2.0 | ||||||
| 4210139 | Aqp1 | -2.1 | 4280064 | Rcn3 | -2.0 | ||||||
| 7200520 | Ostm1 | -2.1 | 5080594 | Mtap | -2.0 | ||||||
| 2470746 | A830080H07Ri | -2.1 | 830608 | Trpm6 | -2.0 |
Epithelium to mesenchyme transition plays important roles during embryogenesis and in cancer progression and metastasis (reviewed in (Ferrer-Vaquer et al., 2010; Moustakas and Heldin, 2007; Nowotschin and Hadjantonakis, 2010; Thiery et al., 2009)). Contrasting with its effect on XEN cell differentiation, BMP signaling has been associated with various EMT transitions where its role is relatively well documented in neural crest formation and delamination (Trainor et al., 2003), atrioventricular valvulogenesis (Inai et al., 2008) and in metastasis and cancer progression (Bailey et al., 2007). However, BMP4 has also been identified as a key mediator of MET during somatic cell reprogramming (Samavarchi-Tehrani et al., 2010) and BMP7 has been implicated in MET in melanoma cells (Na et al., 2009) and adult renal fibroblasts (Zeisberg et al., 2005). This indicates that the effect of BMP signalling on cell morphology is largely context dependent.
Collectively, our data demonstrate that BMP4 signalling induces a mesenchymal-to-epithelial transition (MET) in XEN cells. This epithelium is polarized and shares some common characteristics with the exVE, as well as the mature PrE layer of the late blastocyst, which also expresses Amn, Cubn and Lrp2 (Gerbe et al., 2008).
The effect of BMP4 is antagonized by LIF signalling
Mouse ES cells can be maintained undifferentiated in defined media supplemented with LIF and BMP4 (Ying et al., 2003). In this scenario, LIF and BMP4 signalling cooperate to suppress ES cell exit from pluripotency and lineage commitment. We therefore sought to determine if this might be also the case for XEN cells. Having determined that BMP4 treatment induces a morphological change within 4 days, we repeated this experiment in presence of LIF at a concentration used in standard ES cell cultures (103 units/mL) (Fig. 4A). Strikingly, there was no change in XEN cell morphology when cells were cultured in the presence of BMP4 and LIF, suggesting that LIF antagonizes the effect of BMP4 treatment on XEN cells.
Figure 4. LIF signalling antagonizes the effect of BMP4.

(A) Effect of BMP4 treatment on XEN cell morphology in absence (control) or in presence (LIF) of LIF. XEN cells were cultured for 4 days in serum conditions supplemented with 5 to 10 ng/mL BMP4 and 103 units/mL LIF. (B) Schematic representation of signal transduction pathways activated upon LIF ligand binding to LIFR/GP130 receptor and inhibitors used to block their activities. (C) Inhibition of P38 and JAK/STAT attenuates the inhibitory effect of LIF signalling on BMP driven MET. (A, C) Zoom magnified pictures of low magnification acquisitions (inset) acquired with a 10X zoom. In the insets, epithelial cell colonies were highlighted in red.
LIF activates its LIFR/GP130 heterodimeric receptor and several secondary signal transducers including MAPK, PI3K and JAK/STAT (Fig. 4B). To determine which of these pathway branches might be transducing the LIF antagonizing signal, we pre-treated control and BMP4-treated cells with various pharmacological compounds inhibited these secondary transducers for 6h, and then added LIF protein and subsequently cultured the cells for 3 additional days in the presence of LIF and inhibitors (Fig. 4C). We noted that inhibition of p38 (SB203580), PI3K (LY294002) and P6 (JAK/STAT) affected XEN cell morphology, but none of these inhibitors were found to induce MET transition. When BMP4-treated cells were cultured in the presence of LIF, epithelial cell morphology was lost and XEN cells reverted to their original morphology. This effect was even more pronounced when cells were treated with MEK or PI3K inhibitors. Strikingly, inhibition of p38 or JAK/STAT pathways attenuated the LIF effect such that various areas maintained an epithelial morphology (Fig. 4C).
Collectively our data demonstrate that LIF antagonizes the morphological transition induced by BMP, likely through the P38 and JAK/STAT downstream signal transducers. These observations might provide some insight into the extrinsic conditions required for XEN cell isolation and maintenance. Indeed, XEN cell lines have been isolated using both protocols for ES cellas well as TS cell derivation (Kunath et al., 2005). Interestingly, these protocols have at least one factor in common, this being LIF. LIF is secreted by embryonic fibroblast feeder cells, and so is present in the fibroblast-conditioned medium used in some TS cell protocols, while exogenous LIF is also added to ES cell medium. This may also explain why we observed an attenuated effect consecutive to BMP4 stimulation when cells were cultured in presence of fibroblast conditioned medium compared to serum containing medium (Fig. S1A). In addition, Lif, LifR and Gp130 transcripts were detected in our microarray analysis. It is therefore possible that LIF acts as a paracrine signal that promotes XEN cell maintenance. Future studies will be required to address the role of LIF signalling in XEN cell biology.
BMP4-treated XEN cells acquire an exVE-like identity
Epithelium formation and localization of AMN/CUBN/LRP2 complex was an indication that BMP-treated XEN cells had acquired a VE-like identity and did not resemble PE, which are dispersed migratory cells. To gain further insight into the identity of the BMP-treated cells, we analyzed their global gene expression by microarray analysis using Illumina MouseWG-6 beadchip technology (Fig. 5A). Out of 45,279 probesets, 20,178 probesets were detected in our assay. Pair-wise comparisons between untreated and BMP4-treated XEN cells with a fold-change cut-off of 2 and a false discovery ratio (FDR) of 0.05 identified 195 upregulated genes and 305 downregulated genes in the BMP4- treated population (Fig. 5 and Table 1, 2). Gene ontology analyses of the differentially expressed genes revealed an enrichment of genes assigned to “extracellular” and “basement membrane” categories, supporting the idea that BMP4-treated cells had adopted VE epithelial characteristics (Fig. 5B).
Figure 5. Microarray data analysis.

(A) Diagramatic representation of the experimental scheme used for global gene expression analysis. Cells were treated for 10 days in presence of 25 ng/mL BMP4, a concentration optimal for the induction of the Afp∷GFP transgene. (B) Functional gene ontology analysis of the differentially expressed genes using the DAVID tool with a p-value ≤10-3. Top 50 genes downregulated (C) and upregulated (D) upon BMP4 treatment with their associated fold changes.
Table 1.
List of the genes upregulated (FC ≥2, FDR=0.05) in XEN cells upon BMP4 treatment.
| Illumina ID | Gene Symbol | Fold Change | Illumina ID | Gene Symbol | Fold Change | Illumina ID | Gene Symbol | Fold Change | Illumina ID | Gene Symbol | Fold Change |
|---|---|---|---|---|---|---|---|---|---|---|---|
| 1070452 | Tnnc1 | 26.2 | 6590343 | Rab15 | 3.3 | 1170706 | Krt1-19 | 2.4 | 1710377 | scl0002449.1_ | 2.1 |
| 2510743 | Amn | 16.5 | 7100577 | Axl | 3.2 | 2760750 | Mreg | 2.3 | 4640215 | Timp1 | 2.1 |
| 3830114 | Flt1 | 14.5 | 2680431 | Rnf130 | 3.1 | 4040750 | Edg2 | 2.3 | 1400309 | Timp3 | 2.1 |
| 7610097 | Spink3 | 11.8 | 3890332 | Gadd45a | 3.1 | 2470437 | Hnf4 | 2.3 | 2490091 | Bbx | 2.1 |
| 3890500 | Gpc3 | 10.8 | 4040270 | Agrn | 3.1 | 4150427 | 1110002D22R | 2.3 | 3390273 | Ndc80 | 2.1 |
| 3990292 | Cited1 | 9.3 | 2470086 | Slc39a4 | 3.1 | 1110452 | 2510049J12Rik | 2.3 | 7320338 | Pitx2 | 2.1 |
| 3370136 | Gpc3 | 9.1 | 6370020 | scl0001849.1_23 | 3.1 | 2510369 | Elf3 | 2.3 | 1980138 | Mdk | 2.1 |
| 2690070 | Fbln1 | 9.1 | 4290678 | Snx15 | 2.9 | 5290333 | Me2 | 2.3 | 2850286 | LOC227393 | 2.1 |
| 6450193 | Lgals2 | 8.6 | 580609 | Gadd45a | 2.8 | 3290402 | Pgc | 2.3 | 3190685 | Ldh1 | 2.1 |
| 4850253 | BC049730 | 7.7 | 3610025 | BC004728 | 2.7 | 4220326 | Mcm10 | 2.3 | 4670246 | Adam19 | 2.1 |
| 5260364 | 4933402E13Rik | 7.6 | 5720239 | Inpp5f | 2.7 | 2760187 | Apom | 2.3 | 5340093 | Mlp | 2.1 |
| 1660445 | scl0002507.1_236 | 7.3 | 4490554 | Sema4a | 2.7 | 6040066 | Cdx2 | 2.3 | 5820601 | Stx3 | 2.1 |
| 1440543 | H19 | 7.2 | 5960577 | Ifitm1 | 2.7 | 1190026 | 5530401J07Ri | 2.3 | 2490053 | Efna1 | 2.1 |
| 5860243 | Plac8 | 6.9 | 4220554 | Dsg2 | 2.7 | 1990037 | Dhx32 | 2.3 | 5860010 | Spire2 | 2.1 |
| 4490020 | Cldn6 | 6.5 | 270341 | Emb | 2.7 | 110471 | Idb3 | 2.3 | 4210246 | Kif22 | 2.1 |
| 7210687 | Apoe | 6.5 | 4290709 | Ifi30 | 2.7 | 3460703 | Hdac6 | 2.3 | 3780228 | Akr7a5 | 2.1 |
| 2340300 | Ddc | 6.3 | 6350044 | Slc2a1 | 2.7 | 460327 | Slc2a3 | 2.3 | 1470386 | CRG-L1 | 2.1 |
| 5050653 | Igf2 | 6.1 | 1710747 | Nr6a1 | 2.7 | 50168 | 3110043J09Rik | 2.3 | 6290390 | Aurkb | 2.1 |
| 5050468 | 2210011C24Rik | 6.0 | 4250280 | 9130210N20R | 2.6 | 2320129 | A930017N06R | 2.3 | 6250193 | Txnip | 2.0 |
| 780348 | Grb7 | 6.0 | 650711 | Dgat2 | 2.6 | 70630 | Pgd | 2.3 | 610039 | E130016E03Rik | 2.0 |
| 4640446 | Fmo1 | 5.9 | 6250180 | Cyp2s1 | 2.6 | 110400 | LOC382127 | 2.2 | 4610722 | Cdc20 | 2.0 |
| 3290056 | H19 | 5.9 | 70221 | Mtap7 | 2.6 | 940646 | 9130210N20R | 2.2 | 4230717 | Galk1 | 2.0 |
| 7160204 | Serpina10 | 5.8 | 6520356 | Igf2bp3 | 2.6 | 2510204 | Apoa1 | 2.2 | 7040544 | Lisch7 | 2.0 |
| 2070692 | Akr1c19 | 5.6 | 5490301 | Tnk1 | 2.6 | 3400209 | Stx3 | 2.2 | 3310196 | Cdca5 | 2.0 |
| 1570594 | Socs3 | 5.6 | 6290411 | Pank1 | 2.6 | 610743 | Nasp | 2.2 | 4480646 | Casp6 | 2.0 |
| 6200692 | Idb1 | 5.6 | 270592 | Plekha2 | 2.6 | 10575 | Cideb | 2.2 | 650347 | MGC68323 | 2.0 |
| 610601 | Ddc | 5.4 | 4880386 | Ly64 | 2.5 | 240653 | G6pdx | 2.2 | 4120008 | 2610318I01Rik | 2.0 |
| 1690164 | Fbln1 | 5.4 | 110717 | AI428936 | 2.5 | 2970273 | 1200014P03Ri | 2.2 | 6650711 | Pfkl | 2.0 |
| 5360181 | Cpm | 5.1 | 5810538 | 2610001E17Ri | 2.5 | 7510070 | Nme4 | 2.2 | 2370390 | Krtcap3 | 2.0 |
| 5290376 | Foxa3 | 5.0 | 780360 | Car14 | 2.5 | 3060470 | Peg10 | 2.2 | 3450162 | Echs1 | 2.0 |
| 4010019 | Ifitm1 | 4.9 | 4610474 | Prrg2 | 2.5 | 7040133 | Avpi1 | 2.2 | 3990246 | Ahcy | 2.0 |
| 1740114 | Spint1 | 4.6 | 2650601 | Prss8 | 2.5 | 2340167 | Rad52b | 2.2 | 4540634 | 2700083E18Ri | 2.0 |
| 4760040 | Habp2 | 4.2 | 1990551 | Cyp26a1 | 2.5 | 4900288 | A630098G22R | 2.2 | 4670598 | 1700034H14R | 2.0 |
| 4390553 | 6330505N24Rik | 4.2 | 6620328 | AW548124 | 2.5 | 2970647 | 2610206G21R | 2.2 | 4480102 | H2afv | 2.0 |
| 7330278 | Lgals1 | 4.1 | 1030170 | Map3k1 | 2.5 | 2690368 | BC004728 | 2.2 | 5860358 | Vegfa | 2.0 |
| 6350537 | Apoa2 | 4.1 | 7200240 | Sap30 | 2.5 | 3180068 | Akr7a5 | 2.2 | 3370711 | H2afy | 2.0 |
| 4570451 | Cdkn1c | 3.9 | 6450347 | B4galnt2 | 2.5 | 5340402 | Loxl2 | 2.2 | 4230142 | Rras2 | 2.0 |
| 4590025 | Habp2 | 3.9 | 4730367 | Ifi30 | 2.5 | 5900274 | Gyltl1b | 2.2 | 2510008 | Fbxo2 | 2.0 |
| 3060546 | Dpp4 | 3.9 | 2340131 | Igf2bp3 | 2.4 | 7380037 | Mlp | 2.1 | 3520093 | Avpi1 | 2.0 |
| 2320403 | Gch1 | 3.7 | 1170228 | Tdh | 2.4 | 6580129 | Hook2 | 2.1 | 7100008 | Mnd1 | 2.0 |
| 6270296 | Slc9a3r1 | 3.7 | 1770707 | Sephs2 | 2.4 | 1050170 | Cdca3 | 2.1 | 2680020 | Ocln | 2.0 |
| 5690367 | Lrp2 | 3.7 | 4010133 | Cdc42ep4 | 2.4 | 4540612 | Igsf4a | 2.1 | 1010131 | LOC238943 | 2.0 |
| 5670722 | Hspb1 | 3.6 | 3360053 | Pcsk9 | 2.4 | 5340072 | Mdk | 2.1 | 4390338 | Dgkk | 2.0 |
| 3990397 | Nipsnap1 | 3.6 | 3940687 | Myo6 | 2.4 | 2320541 | Car12 | 2.1 | 1470528 | Hn1 | 2.0 |
| 4150682 | 0610009F02Rik | 3.5 | 4880193 | Abcc4 | 2.4 | 10402 | Trim25 | 2.1 | 3420600 | 1110060I01Rik | 2.0 |
| 5870220 | Car14 | 3.5 | 4880433 | Upk1b | 2.4 | 6020181 | Abat | 2.1 | |||
| 10364 | Dp1l1 | 3.5 | 6480433 | H2afy | 2.4 | 4540603 | 9630055N22R | 2.1 | |||
| 10768 | Gm2a | 3.5 | 5810414 | Cxadr | 2.4 | 70341 | Txnip | 2.1 | |||
| 3130739 | 4933402E13Rik | 3.4 | 730753 | Map3k1 | 2.4 | 160332 | Timp1 | 2.1 | |||
| 670500 | Fignl1 | 3.4 | 3840446 | Mlp | 2.4 | 3780082 | Edg2 2.1 | 2.1 |
Interestingly, we found that BMP4-treated cells upregulated a significant number of genes whose expression is specific to the VE, and to exVE in particular (Fig. 5D and Tables 1 and 2). These included Amn (Kalantry et al., 2001; Strope et al., 2004; Tomihara-Newberger et al., 1998), Spink3, Lgals2, Tdh, (Hou et al., 2007), Habp2 (Hou et al., 2007), Cited1 (Dunwoodie et al., 1998), Claudin6 (Anderson et al., 2008), Dpp4, Foxa3, Rab15 (Sherwood et al., 2007), as well as the imprinted genes H19 (Pachnis et al., 1984) and Igf2 (DeChiara et al., 1991) and several genes encoding apolipoprotein family members including Apoa1, Apoa2, Apoe and Apom. In addition, we observed that the panVE-specific Afp∷GFP transgenic reporter (Kwon et al., 2006) was expressed in BMP4-treated but not in untreated XEN cells (Fig. 6A).
Figure 6. Fluctuation of Afp∷GFP reporter within the BMP-treated XEN cell population.

(A) Detection of the Afp∷GFP transgene in control and BMP4-treated XEN cells. (B) percentage GFP-positive cells determined by flow cytometry upon culture for 4 days in the presence of various concentrations of BMP2 or BMP4 in serum and serum-free conditions. (C) Diagramatic representation of the experimental scheme used for global gene expression profiling in GFP+ and GFP- XEN cells maintained in 10 ng/mL BMP4. (D) The 5 genes found differentially upregulated (green, FC≥2) and downregulated (red, FC≤-2) in the GFP-positive population. (E) Kinetics of Afp∷GFP reporter expression after FACS sorting of the GFP-negative cells (upper panels) and the GFP-positive cells (lower panels). The diagrams depicts the evolution of the percentage of GFP-positive cells in the GFP- and GFP+ FACS sorted cells. (F) Single frames from 3D time-lapse imaging of Afp∷GFP Tg/+ XEN cells treated with 10 ng/mL BMP4. Annotated movie sequence is provided as Movie 1. Some cells upregulating GFP during the time-course are highlighted (red dashed lines depict cell perimeters). (A, E, F) GFP, green; nuclei counterstained with Hoechst, blue, brightfield, bf. Scale bars: 50 μm.
We next used flow cytometry to analyze the percentage of Afp∷GFP positive cells after 4 days of culture in serum or serum-free conditions in the presence of increasing concentrations of BMP2 or BMP4 (Fig. 6B). We observed that a maximum induction of Afp∷GFP reporter expression was reached between 25 ng/mL and 50 ng/mL BMP4. Interestingly, we noticed an improved induction under serum-free as compared to serum-containing conditions. Similarly, addition of BMP2 also induced reporter expression, and optimal induction was observed at a concentration of 50 ng/mL. Taken together, both BMP2 and BMP4 have the ability to induce Afp reporter suggesting that they may exert similar effects on XEN cell differentiation.
Importantly, with the exception of Hhex (1.9-fold change upregulation), the array data did not reveal a significant increase in the expression of DVE/AVE markers including Cer1, Dkk1, Lefty1 and Lhx1. We therefore conclude that BMP4 activity preferentially affects the expression of exVE genes. Notably, we did not observe any differential change in the expression levels of several transcription factors proposed to comprise a PrE ‘stem’ core regulatory network such as Gata4, Gata6, Sox7, Sox17 and Sall4 (Lim et al., 2008; Niakan et al., 2010). Taken together, our gene expression data suggested that BMP4 stimulation directs XEN cell differentiation towards exVE-like identity.
Surprisingly, no major defect in PrE lineage differentiation has been reported from the genetic inactivation of various BMP ligand-encoding genes. For example, Bmp2-deficient embryos exhibit defects in amnion/chorion formation and heart development (Zhang and Bradley, 1996). Bmp4 inactivation results in impaired mesoderm formation at the time of gastrulation (Lawson et al., 1999; Winnier et al., 1995) and downregulation of Bmp4 has been reported to affect AVE formation (Soares et al., 2005; Soares et al., 2008). Furthermore, Bmpr2 mutants fail to properly specify the DVE (Yamamoto et al., 2009). Though it cannot be ruled out that the VE layer of these mutants may exhibit further uncharacterized defects, some degree of functional redundancy may exist between co-expressed BMP ligands that could account for the absence of a phenotype in PrE maturation. Using XEN cells as an ex vivo model of PrE lineage maturation, we provide evidence suggesting that BMP signalling promotes differentiation towards an exVE fate.
Fluctuation of the Afp∷GFP reporter in BMP4-treated XEN cells
Having demonstrated that the Afp∷GFP transgene reporter was activated upon BMP4 treatment of XEN cells, we sought to further investigate the observed heterogeneity in transgene expression. We noted that approximately half (40-50%) the population of BMP-treated XEN cells were GFP-positive at any one time, and that GFP-positive and GFP-negative cells were intermixed within the culture dish (Fig. 6A). These observations could be explained by a non-uniform ability of XEN cells to respond to BMP signalling, perhaps reflecting the inherent heterogeneity of XEN cell cultures. Alternatively, the expression of the transgene could fluctuate within a single cell, and observations made at single time-points would reveal the coexistence of GFP-positive and GFP-negative cells. To distinguish between these two scenarios, we flow sorted GFP-positive and GFP-negative cells and monitored the activity of the Afp∷GFP reporter for 3 days post-sorting, when cells were maintained in the presence of BMP (Fig. 6E). In the GFP-negative sorted cells, we observed the appearance of GFP-positive cells after 2 days in culture and, by 3 days, 40% of the cells were expressing the reporter. Conversely, GFP-negative cells were identified 3 days post sorting the GFP-positive cells. Together, these data suggest that Afp∷GFP reporter expression was fluctuating within BMP-treated XEN cells.
To further validate these observations, we live imaged BMP-treated XEN cells over a 13-hour time period (Fig. 6F and Movie 1). Several cells within the frame of view were seen to upregulate the Afp∷GFP reporter (Fig. 6F, dashed red lines depict cell perimeters). However, we did not readily detect cells exhibiting a significant decrease in levels of GFP fluorescence. Since we previously noted that the Afp promoter drives very high levels of transgene expression, and as a result the Afp∷GFP reporter is extremely bright, with GFP protein detectable over 48 hours after downregulation of transgene expression (Kwon et al., 2008), it is likely that the transgene behaves similarly in our cell culture conditions, and that the loss of GFP fluorescence takes longer than the 13-hour window for time-lapse image acquisition.
We next sought to determine if the observed fluctuations in expression of the Afp∷GFP reporter had biological significance. Importantly, for the transgenic reporter to provide a relevant readout for understanding how XEN cells behave when they respond to BMP stimulation, it must reflect endogenous Afp expression. To address this question, we analyzed the differences in global gene expression between GFP-positive and GFP-negative BMP-treated cells (Fig. 6C, D). As expected, GFP-positive cells exhibited an increase in the level of Afp expression (Fig. 6D), indicating that the Afp∷GFP transgene reporter recapitulated endogenous gene activity. Surprisingly, only 5 genes were differentially expressed between GFP-positive and GFP-negative cells (FC≥2): Afp, Spp2, Lgals1, Wfdc1 and Apom. Interestingly, all of these genes encode secreted proteins. Afp encodes an abundant serum protein specifically expressed in the VE (Dziadek and Adamson, 1978; Kwon et al., 2006). Secreted phosphoprotein 2 (also referred as SPP24) acts as a pseudoreceptor that regulates BMP activity (Brochmann et al., 2009), suggesting a negative feedback loop may operate upon BMP stimulation. Spp2 transcripts have been detected in the yolk sac (Hou et al., 2007), while Galectin-1 (LGALS1) is a β-galactoside binding lectin protein that regulates MAPK signaling in various cellular contexts (Brandt et al., 2010; Thijssen et al., 2010). The expression of LGALS1 has not been reported in vivo in the extraembryonic endoderm, but it was previously reported to be activated after retinoic acid induced endodermal differentiation of F9 embryonal carcinoma cells (Lu et al., 1998). WAP four-disulfide core domain 1 (WFDC1, also referred as PS20) was identified as a prostate secreted protein with a putative serine protease inhibitor activity. WFDC1 inhibits proliferation and induces the synthesis of secreted proteins (Madar et al., 2009; Rowley et al., 1995). Lastly, Apom encodes a HDL-associated apolipoprotein who’s expression is regulated by insulin through FOXA2 in adult animals (Wolfrum et al., 2008). Given the small number of genes exhibiting fluctuating expression, it is tempting to speculate that common mechanisms may regulate their expression.
The observed dynamic equilibrium of Afp∷GFP expressing vs. non-expressing cells in BMP4-treated XEN populations resembled observations made in various pluripotent cell types. This is the case of mouse ES cells which exhibit heterogenous expression of several markers including Nanog (Chambers et al., 2007; Singh et al., 2007), Rex1 (Toyooka et al., 2008) and Stella (Hayashi et al., 2008). Several subpopulations have also been described in EpiSCs (Han et al., 2010) and in human ES cells (Enver et al., 2005; Fischer et al., 2010; Hough et al., 2009; Stewart et al., 2006). The current model posits that pluripotency is associated with various (or a spectrum of) usually interconvertible metastable states, each of which is defined by the expression of distinct markers, as well as different abilities to differentiate. A similar situation may occur during PrE lineage maturation, and therefore may be the case in BMP4-treated, as well as untreated XEN cells. Indeed, untreated XEN cells undergo morphological transitions that are likely to be associated with fluctuations in gene expressing revealing an inherent bistability in the system (Kunath et al., 2005). Additional studies will be required to address the origin and significance of the fluctuations that are observed and stably maintained in XEN cells.
Investigating the developmental potential of BMP-treated XEN cells
To confirm the exVE-like identity of BMP-treated XEN cells, we sought to assess their developmental potential. First, when XEN cells were injected under the kidney capsule of an adult mouse, they generated teratomas, as do ES cells. We observed that after 2 months, grafts of BMP-treated XEN cells usually developed into visible teratomas, but at different rates (Fig. S5A), likely resulting from variations in the number of grafted cells. Histological sections of these XEN cell-derived teratomas revealed they comprised a limited number of cell types, usually only two, as distinguished by their eosinophilic coloration (Fig. S5C’ and C” are high magnification of the two cell types). Overall, cells were organized into small clusters and were surrounded by extensive deposits of extracellular matrix, as visualized by the green coloration (Fig. S5B-C). The identity of these cells was not determined, but these data suggest that BMP-treated XEN cells, like untreated XEN cells (data not shown), exhibit a restricted developmental potential. In contrast, in teratomas formed from grafts of ES (and iPS) cells, the cells differentiate into multiple cell types comprising derivatives of all three germ layers. Since we noted that BMP treatment was reversible (Fig. 2), and since BMP signalling likely would not be sustained in the XEN cell kidney capsule grafts, we did not pursue this line of investigation any further.
We therefore sought to determine the developmental potential of BMP-treated XEN cells by generating chimeras. To do this, we injected 5-10 BMP-treated XEN cells into recipient E3.5 blastocysts, transferred them to pseudopregnant females, recovered embryos at E6.5 and analyzed the localization of XEN cell descendents. Out of 57 embryos recovered, 31 embryos (55%) were chimeric and only one had detectable XEN cell contribution to VE. The remaining 30 chimeras exhibited XEN cell derivatives exclusively within the PE layer. This observation is in agreement with other reports in which 99% of wild-type XEN cells preferentially contributed to the PE layer in chimeras (Kruithof-de Julio et al., 2011; Kunath et al., 2005). A possible reason for this failure to promote XEN cell contribution to the VE cell layer is that injected XEN cells (BMP-treated or not) preferentially interact with the TE layer of the blastocyst. Support for this comes from our observation that the majority of XEN cells attached to the mural TE in injected E3.5 blastocysts cultured for 24-hours (data not shown). Alternatively, BMP-treated XEN cells may fail to sustain BMP signalling following their injection and may, therefore, revert to their original state, behaving as untreated XEN cells. To definitively assess the developmental potential of BMP-treated XEN cells in these assays, it would be necessary to maintain BMP signalling in a cell autonomous manner in embryo chimeras.
XEN cells stimulate the expansion of EryP progenitors in vitro
We previously reported that development of the primitive erythroid and vascular endothelial lineages is regulated by a signal(s) secreted from the adjacent exVE (Belaoussoff et al., 1998; Dyer et al., 2001). To evaluate the VE-like properties of control and BMP-treated XEN cells, we tested whether these cells could promote the expansion of EryP progenitors in a co-culture assay. To do this, we took advantage of a transgenic mouse line carrying an ε-globin∷H2B-GFP transgene specifically expressed in primitive erythroid cells that we previously generated and validated (Isern et al., 2008; Isern et al., 2010; Isern et al., 2011). Importantly, we demonstrated that all EryP progenitor activity is present within the GFP-positive population of cells from ~E7.5-E8.5 embryos and that this activity is lost by E9.5 (Isern et al., 2011). GFP-positive EryPs were FACS-sorted from E8.0-E8.5 transgenic embryos and cultured alone or in the presence of untreated or BMP4-treated XEN cells for 5 (data not shown) or 10 hours. The non-adherent EryP were then collected and cultured at clonal density in EryP-colony-forming cell (CFC) assays for 4-5 days (Fig. 7A). Red colonies that developed contained GFP-positive cells confirming their EryP identity (Fig. 7B). The number of EryP progenitors was stimulated by 2.2-fold in co-cultures with control XEN cells, and by 3.2-fold in co-cultures with BMP4-treated XEN cells (Fig. 7C). Therefore, both untreated and BMP4-treated XEN cells stimulated the numbers of EryP progenitors, suggesting that these cells regulate primitive hematopoiesis. However, our data also suggest that the enhancement of EryP progenitor expansion by BMP4-treated XEN cells might be more potent than that of untreated cells, which would correlate with the acquisition of an exVE-like identity.
Figure 7. XEN cells promote EryP progenitor expansion.
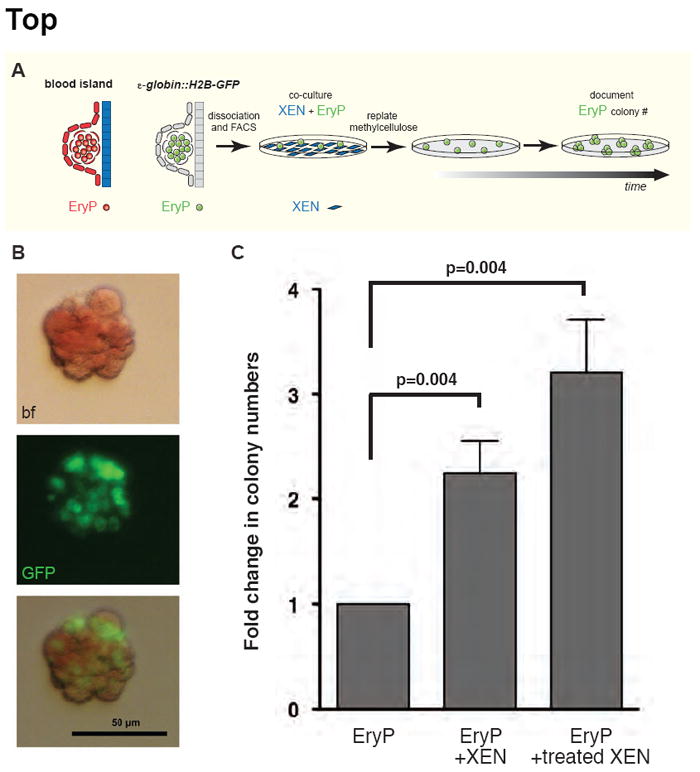
(A) Schematic representation of the assay used to test XEN cell ability to promote EryP expansion. (B) A representative red EryP colony expressing the ε-globin∷H2B-GFP transgene (GFP). Brigthfield, bf. Scale bar: 50μm. (C) The diagram depicts the average fold change in EryP colony number for EryP co-cocultured with XEN cells and BMP4-treated XEN cells compared to culture of EryP alone (n=6 experiments). P-values calculated from Mann-Whitney test indicate statistical significance.
Interestingly, we noted that Vegfa and Ihh genes were upregulated in BMP-treated XEN cells by 2.0- and 1.9-fold respectively. Vegf (Miquerol et al., 1999) and Ihh (Dyer et al., 2001) are both expressed by the VE of mouse embryos. Gene targeting studies have established a requirement for VEGF in primitive erythropoiesis (Carmeliet et al., 1996; Ferrara et al., 1996) that is mediated, at least in part, through Gata1 (Drogat et al., 2010). IHH protein can substitute for VE in embryo explant cultures and may function through activation of Bmp4 (Dyer et al., 2001). It is likely that the enhanced ability of BMP4-treated XEN cells to promote EryP expansion is partly due to the upregulation of these genes; however we cannot exclude additional as yet unknown contributing factors.
CONCLUSIONS
By investigating the mechanisms promoting XEN cell differentiation we have determined that BMP signalling directs XEN cells towards an exVE identity. In doing so, BMP induces stable but reversible, cell polarization and epithelialization, and upregulation of genes highly expressed within the exVE, as well as the expression of a fluorescent VE-specific live imaging reporter. Validating their exVE identity, our data suggest that BMP-treated XEN cells promoted hematopoiesis by enhancing the proliferation of EryP progenitors. Notably the effect of BMP treatment on XEN cells was antagonized by LIF signalling, suggesting that reciprocal signalling pathways control the balance between PrE cell states.
Supplementary Material
(A) IM8A1 XEN cells cultured for 4 days in XEN cell morphology after addition of BMP4 for 4 days at concentrations ranging from 0 to 20 ng/mL in 70% fibroblast conditioned medium (MEF-CM) or 20% FBS RPMI1640 (RPMI1640). High magnification zooms of low magnification images (inset) acquired with a 10X magnification. In the insets, areas of epithelial cell colonies are highlighted in red. (B) Immunodetection of βCAT, CDH1 (adherens junctions) and ZO-1 (tight junction). βCAT, CDH1 and ZO-1, red; nuclei counterstained with Hoechst, blue. Scale bar: 20 μm.
Afp∷GFP tg/+ XEN cells were pre-cultured for 3 hours in presence of 2μM Dorsomorphin or 100 ng/mL Noggin before addition of 10 ng/mL BMP4. Cells were subsequently cultured for 4 additional days. Afp∷GFP, green.
Glass coverslips were coated with gelatin, poly-L-Lysine, collagen type IV, laminin or fribronectin before plating untreated (control) or BMP4-treated XEN cells. Cells were cultured for 2 days in N2B27 media with or without BMP4 at 10 ng/mL. Control XEN cells attached to most of the supports except for poly-L-Lysine, exhibited low levels of Ecadherin (CDH1) and usually did not develop adherens junctions. BMP-treated cells attached better so supports coated with collagen type IV, laminin and fibronectin, expressed CDH1 and acquired epithelial morphology. CDH1, red; F-actin, green; nuclei counterstained with Hoechst, blue. Scale bar: 50 μm.
Diagrams depict the differential expression of gene encoding for structural proteins and for integrins, catenins and cadherins that were detected in our microarray assay. In grey are genes that are not differentially expressed (FC~1). Genes upregulated (FC≥1.8) in BMP-treated conditions are depicted in red, genes downregulated (FC≤-1.8) in green.
(A) Images of kidneys dissected from two independent animals 2 months after injection of BMP-treated XEN cells into one kidney (injected). (B, C) Images of paraffin sections from injected kidney #1 (B) and kidney #2 (C) counterstained with Masson’s trichrome stain. B’, C’ and C” are magnified views of (B) and (C) respectively.
3D time-lapse imaging of Afp∷GFPtg/+ XEN cells treated with 10 ng/mL BMP4 and plated on fibronectin-coated chambered coverglass slides (Lab-tek). Z-stacks were acquired every 10 minutes for a total of 13 h. Blue arrows indicate cells starting to express detectable levels of GFP.
HIGHLIGHTS.
BMP signalling promotes extraembryonic endoderm stem (XEN) cell epithelialisation.
BMP drives XEN cell differentiation towards an extraembryonic visceral endoderm (exVE) identity.
Effect of BMP is reversible and is antagonized by LIF signalling.
Fluctuations in Afp∷GFP visceral endoderm (VE) reporter expression reveal a dynamic equilibrium in BMP-treated XEN cells.
XEN cells promote primitive erythroid progenitor (EryP) expansion.
Acknowledgments
We thank Tilo Kunath and Tristan Rodriguez for communication prior to publication; Ginny Papaioannou and Salma Begum for instruction on kidney capsule injections; Ann Foley for critical reading of the manuscript; Bernadette Holdner and Janet Lighthouse for discussions on VE cell trafficking; Jackie Bromberg for discussions on STAT3 signalling; Renata Kozyraki and Liz Lacy for antibodies; Tilo Kunath for IM8A1 XEN cells; the MSKCC and MSSM Flow Cytometry Core Facilities for cell sorting, MSKCC Genomics Core Facility for gene expression profiling and Raya Khanin and Yupu Liang for assistance with data analysis. Work in AKH’s laboratory is supported by the Human Frontier Science Program, National Institutes of Health (NIH, RO1-HD052115 and RO1-DK084391) and New York State Department of Health (NYSTEM IDEA grant N08G-175); work in MHB’s laboratory is supported by grants from the NIH (RO1-HL62248 and RO1-DK52191) and the New York State Department of Health (NYSTEM grant N08G-024).
Footnotes
Publisher's Disclaimer: This is a PDF file of an unedited manuscript that has been accepted for publication. As a service to our customers we are providing this early version of the manuscript. The manuscript will undergo copyediting, typesetting, and review of the resulting proof before it is published in its final citable form. Please note that during the production process errors may be discovered which could affect the content, and all legal disclaimers that apply to the journal pertain.
LITERATURE CITED
- Anderson WJ, Zhou Q, Alcalde V, Kaneko OF, Blank LJ, Sherwood RI, Guseh JS, Rajagopal J, Melton DA. Genetic targeting of the endoderm with claudin-6CreER. Dev Dyn. 2008;237:504–12. doi: 10.1002/dvdy.21437. [DOI] [PMC free article] [PubMed] [Google Scholar]
- Arnold SJ, Robertson EJ. Making a commitment: cell lineage allocation and axis patterning in the early mouse embryo. Nat Rev Mol Cell Biol. 2009;10:91–103. doi: 10.1038/nrm2618. [DOI] [PubMed] [Google Scholar]
- Artus J, Panthier JJ, Hadjantonakis AK. A role for PDGF signaling in expansion of the extra-embryonic endoderm lineage of the mouse blastocyst. Development. 2010;137:3361–72. doi: 10.1242/dev.050864. [DOI] [PMC free article] [PubMed] [Google Scholar]
- Artus J, Piliszek A, Hadjantonakis AK. The primitive endoderm lineage of the mouse blastocyst: Sequential transcription factor activation and regulation of differentiation by Sox17. Dev Biol. 2011;350:393–404. doi: 10.1016/j.ydbio.2010.12.007. [DOI] [PMC free article] [PubMed] [Google Scholar]
- Artus J, Vandormael-Pournin S, Frodin M, Nacerddine K, Babinet C, Cohen-Tannoudji M. Impaired mitotic progression and preimplantation lethality in mice lacking OMCG1, a new evolutionarily conserved nuclear protein. Mol Cell Biol. 2005;25:6289–302. doi: 10.1128/MCB.25.14.6289-6302.2005. [DOI] [PMC free article] [PubMed] [Google Scholar]
- Bailey JM, Singh PK, Hollingsworth MA. Cancer metastasis facilitated by developmental pathways: Sonic hedgehog, Notch, and bone morphogenic proteins. J Cell Biochem. 2007;102:829–39. doi: 10.1002/jcb.21509. [DOI] [PubMed] [Google Scholar]
- Baron MH. Early patterning of the mouse embryo: implications for hematopoietic commitment and differentiation. Exp Hematol. 2005;33:1015–20. doi: 10.1016/j.exphem.2005.06.001. [DOI] [PubMed] [Google Scholar]
- Belaoussoff M, Farrington SM, Baron MH. Hematopoietic induction and respecification of A-P identity by visceral endoderm signaling in the mouse embryo. Development. 1998;125:5009–18. doi: 10.1242/dev.125.24.5009. [DOI] [PubMed] [Google Scholar]
- Bielinska M, Narita N, Wilson DB. Distinct roles for visceral endoderm during embryonic mouse development. Int J Dev Biol. 1999;43:183–205. [PubMed] [Google Scholar]
- Brandt B, Abou-Eladab EF, Tiedge M, Walzel H. Role of the JNK/c-Jun/AP-1 signaling pathway in galectin-1-induced T-cell death. Cell Death Dis. 2010;1:e23. doi: 10.1038/cddis.2010.1. [DOI] [PMC free article] [PubMed] [Google Scholar]
- Brochmann EJ, Behnam K, Murray SS. Bone morphogenetic protein-2 activity is regulated by secreted phosphoprotein-24 kd, an extracellular pseudoreceptor, the gene for which maps to a region of the human genome important for bone quality. Metabolism. 2009;58:644–50. doi: 10.1016/j.metabol.2009.01.001. [DOI] [PubMed] [Google Scholar]
- Brown K, Doss MX, Legros S, Artus J, Hadjantonakis AK, Foley AC. eXtraembryonic ENdoderm (XEN) stem cells produce factors that activate heart formation. PLoS One. 2010a;5:e13446. doi: 10.1371/journal.pone.0013446. [DOI] [PMC free article] [PubMed] [Google Scholar]
- Brown K, Legros S, Artus J, Doss MX, Khanin R, Hadjantonakis AK, Foley A. A comparative analysis of extra-embryonic endoderm cell lines. PLoS One. 2010b;5:e12016. doi: 10.1371/journal.pone.0012016. [DOI] [PMC free article] [PubMed] [Google Scholar]
- Burdon T, Smith A, Savatier P. Signalling, cell cycle and pluripotency in embryonic stem cells. Trends Cell Biol. 2002;12:432–8. doi: 10.1016/s0962-8924(02)02352-8. [DOI] [PubMed] [Google Scholar]
- Carmeliet P, Ferreira V, Breier G, Pollefeyt S, Kieckens L, Gertsenstein M, Fahrig M, Vandenhoeck A, Harpal K, Eberhardt C, Declercq C, Pawling J, Moons L, Collen D, Risau W, Nagy A. Abnormal blood vessel development and lethality in embryos lacking a single VEGF allele. Nature. 1996;380:435–9. doi: 10.1038/380435a0. [DOI] [PubMed] [Google Scholar]
- Chambers I, Silva J, Colby D, Nichols J, Nijmeijer B, Robertson M, Vrana J, Jones K, Grotewold L, Smith A. Nanog safeguards pluripotency and mediates germline development. Nature. 2007;450:1230–4. doi: 10.1038/nature06403. [DOI] [PubMed] [Google Scholar]
- Chazaud C, Yamanaka Y, Pawson T, Rossant J. Early lineage segregation between epiblast and primitive endoderm in mouse blastocysts through the Grb2-MAPK pathway. Dev Cell. 2006;10:615–24. doi: 10.1016/j.devcel.2006.02.020. [DOI] [PubMed] [Google Scholar]
- Cockburn K, Rossant J. Making the blastocyst: lessons from the mouse. J Clin Invest. 2010;120:995–1003. doi: 10.1172/JCI41229. [DOI] [PMC free article] [PubMed] [Google Scholar]
- Coucouvanis E, Martin GR. Signals for death and survival: a two-step mechanism for cavitation in the vertebrate embryo. Cell. 1995;83:279–87. doi: 10.1016/0092-8674(95)90169-8. [DOI] [PubMed] [Google Scholar]
- Coucouvanis E, Martin GR. BMP signaling plays a role in visceral endoderm differentiation and cavitation in the early mouse embryo. Development. 1999;126:535–46. doi: 10.1242/dev.126.3.535. [DOI] [PubMed] [Google Scholar]
- DeChiara TM, Robertson EJ, Efstratiadis A. Parental imprinting of the mouse insulin-like growth factor II gene. Cell. 1991;64:849–59. doi: 10.1016/0092-8674(91)90513-x. [DOI] [PubMed] [Google Scholar]
- Drogat B, Kalucka J, Gutierrez L, Hammad H, Goossens S, Farhang Ghahremani M, Bartunkova S, Haigh K, Deswarte K, Nyabi O, Naessens M, Ferrara N, Klingmuller U, Lambrecht BN, Nagy A, Philipsen S, Haigh JJ. Vegf regulates embryonic erythroid development through Gata1 modulation. Blood. 2010;116:2141–51. doi: 10.1182/blood-2010-01-264143. [DOI] [PubMed] [Google Scholar]
- Dunwoodie SL, Rodriguez TA, Beddington RS. Msg1 and Mrg1, founding members of a gene family, show distinct patterns of gene expression during mouse embryogenesis. Mech Dev. 1998;72:27–40. doi: 10.1016/s0925-4773(98)00011-2. [DOI] [PubMed] [Google Scholar]
- Duval D, Reinhardt B, Kedinger C, Boeuf H. Role of suppressors of cytokine signaling (Socs) in leukemia inhibitory factor (LIF) -dependent embryonic stem cell survival. FASEB J. 2000;14:1577–84. doi: 10.1096/fj.14.11.1577. [DOI] [PubMed] [Google Scholar]
- Dyer MA, Farrington SM, Mohn D, Munday JR, Baron MH. Indian hedgehog activates hematopoiesis and vasculogenesis and can respecify prospective neurectodermal cell fate in the mouse embryo. Development. 2001;128:1717–30. doi: 10.1242/dev.128.10.1717. [DOI] [PubMed] [Google Scholar]
- Dziadek M, Adamson E. Localization and synthesis of alphafoetoprotein in post-implantation mouse embryos. J Embryol Exp Morphol. 1978;43:289–313. [PubMed] [Google Scholar]
- Eckhardt ER, Cai L, Sun B, Webb NR, van der Westhuyzen DR. High density lipoprotein uptake by scavenger receptor SR-BII. J Biol Chem. 2004;279:14372–81. doi: 10.1074/jbc.M313793200. [DOI] [PubMed] [Google Scholar]
- Enver T, Soneji S, Joshi C, Brown J, Iborra F, Orntoft T, Thykjaer T, Maltby E, Smith K, Abu Dawud R, Jones M, Matin M, Gokhale P, Draper J, Andrews PW. Cellular differentiation hierarchies in normal and culture-adapted human embryonic stem cells. Hum Mol Genet. 2005;14:3129–40. doi: 10.1093/hmg/ddi345. [DOI] [PubMed] [Google Scholar]
- Evans MJ, Kaufman MH. Establishment in culture of pluripotential cells from mouse embryos. Nature. 1981;292:154–6. doi: 10.1038/292154a0. [DOI] [PubMed] [Google Scholar]
- Ferkowicz MJ, Yoder MC. Blood island formation: longstanding observations and modern interpretations. Exp Hematol. 2005;33:1041–7. doi: 10.1016/j.exphem.2005.06.006. [DOI] [PubMed] [Google Scholar]
- Ferrara N, Carver-Moore K, Chen H, Dowd M, Lu L, O’Shea KS, Powell-Braxton L, Hillan KJ, Moore MW. Heterozygous embryonic lethality induced by targeted inactivation of the VEGF gene. Nature. 1996;380:439–42. doi: 10.1038/380439a0. [DOI] [PubMed] [Google Scholar]
- Ferrer-Vaquer A, Viotti M, Hadjantonakis AK. Transitions between epithelial and mesenchymal states and the morphogenesis of the early mouse embryo. Cell Adh Migr. 2010;4:447–57. doi: 10.4161/cam.4.3.10771. [DOI] [PMC free article] [PubMed] [Google Scholar]
- Fischer Y, Ganic E, Ameri J, Xian X, Johannesson M, Semb H. NANOG reporter cell lines generated by gene targeting in human embryonic stem cells. PLoS One. 2010;5 doi: 10.1371/journal.pone.0012533. [DOI] [PMC free article] [PubMed] [Google Scholar]
- Fraser ST, Baron MH. Embryonic fates for extraembryonic lineages: New perspectives. J Cell Biochem. 2009;107:586–91. doi: 10.1002/jcb.22165. [DOI] [PubMed] [Google Scholar]
- Gardner RL. Investigation of cell lineage and differentiation in the extraembryonic endoderm of the mouse embryo. J Embryol Exp Morphol. 1982;68:175–98. [PubMed] [Google Scholar]
- Gerbe F, Cox B, Rossant J, Chazaud C. Dynamic expression of Lrp2 pathway members reveals progressive epithelial differentiation of primitive endoderm in mouse blastocyst. Dev Biol. 2008;313:594–602. doi: 10.1016/j.ydbio.2007.10.048. [DOI] [PubMed] [Google Scholar]
- Hammad SM, Stefansson S, Twal WO, Drake CJ, Fleming P, Remaley A, Brewer HB, Jr, Argraves WS. Cubilin, the endocytic receptor for intrinsic factor-vitamin B(12) complex, mediates high-density lipoprotein holoparticle endocytosis. Proc Natl Acad Sci U S A. 1999;96:10158–63. doi: 10.1073/pnas.96.18.10158. [DOI] [PMC free article] [PubMed] [Google Scholar]
- Han DW, Tapia N, Joo JY, Greber B, Arauzo-Bravo MJ, Bernemann C, Ko K, Wu G, Stehling M, Do JT, Scholer HR. Epiblast stem cell subpopulations represent mouse embryos of distinct pregastrulation stages. Cell. 2010;143:617–27. doi: 10.1016/j.cell.2010.10.015. [DOI] [PubMed] [Google Scholar]
- Hatzopoulos AK, Rigotti A, Rosenberg RD, Krieger M. Temporal and spatial pattern of expression of the HDL receptor SR-BI during murine embryogenesis. J Lipid Res. 1998;39:495–508. [PubMed] [Google Scholar]
- Hayashi K, Lopes SM, Tang F, Surani MA. Dynamic equilibrium and heterogeneity of mouse pluripotent stem cells with distinct functional and epigenetic states. Cell Stem Cell. 2008;3:391–401. doi: 10.1016/j.stem.2008.07.027. [DOI] [PMC free article] [PubMed] [Google Scholar]
- Hogan BL, Tilly R. Cell interactions and endoderm differentiation in cultured mouse embryos. J Embryol Exp Morphol. 1981;62:379–94. [PubMed] [Google Scholar]
- Hou J, Charters AM, Lee SC, Zhao Y, Wu MK, Jones SJ, Marra MA, Hoodless PA. A systematic screen for genes expressed in definitive endoderm by Serial Analysis of Gene Expression (SAGE) BMC Dev Biol. 2007;7:92. doi: 10.1186/1471-213X-7-92. [DOI] [PMC free article] [PubMed] [Google Scholar]
- Hough SR, Laslett AL, Grimmond SB, Kolle G, Pera MF. A continuum of cell states spans pluripotency and lineage commitment in human embryonic stem cells. PLoS One. 2009;4:e7708. doi: 10.1371/journal.pone.0007708. [DOI] [PMC free article] [PubMed] [Google Scholar]
- Inai K, Norris RA, Hoffman S, Markwald RR, Sugi Y. BMP-2 induces cell migration and periostin expression during atrioventricular valvulogenesis. Dev Biol. 2008;315:383–96. doi: 10.1016/j.ydbio.2007.12.028. [DOI] [PMC free article] [PubMed] [Google Scholar]
- Isern J, Fraser ST, He Z, Baron MH. The fetal liver is a niche for maturation of primitive erythroid cells. Proc Natl Acad Sci U S A. 2008;105:6662–7. doi: 10.1073/pnas.0802032105. [DOI] [PMC free article] [PubMed] [Google Scholar]
- Isern J, Fraser ST, He Z, Zhang H, Baron MH. Dose-dependent regulation of primitive erythroid maturation and identity by the transcription factor Eklf. Blood. 2010;116:3972–80. doi: 10.1182/blood-2010-04-281196. [DOI] [PMC free article] [PubMed] [Google Scholar]
- Isern J, He Z, Fraser ST, Nowotschin S, Ferrer-Vaquer A, Moore R, Hadjantonakis AK, Schulz V, Tuck D, Gallagher PG, Baron MH. Single lineage transcriptome analysis reveals key regulatory pathways in primitive erythroid progenitors in the mouse embryo. Blood. 2011 doi: 10.1182/blood-2010-10-313676. [DOI] [PMC free article] [PubMed] [Google Scholar]
- Kalantry S, Manning S, Haub O, Tomihara-Newberger C, Lee HG, Fangman J, Disteche CM, Manova K, Lacy E. The amnionless gene, essential for mouse gastrulation, encodes a visceral-endoderm-specific protein with an extracellular cysteine-rich domain. Nat Genet. 2001;27:412–6. doi: 10.1038/86912. [DOI] [PubMed] [Google Scholar]
- Kozyraki R, Fyfe J, Kristiansen M, Gerdes C, Jacobsen C, Cui S, Christensen EI, Aminoff M, de la Chapelle A, Krahe R, Verroust PJ, Moestrup SK. The intrinsic factor-vitamin B12 receptor, cubilin, is a high-affinity apolipoprotein A-I receptor facilitating endocytosis of high-density lipoprotein. Nat Med. 1999;5:656–61. doi: 10.1038/9504. [DOI] [PubMed] [Google Scholar]
- Kruithof-de Julio M, Alvarez MJ, Galli A, Chu J, Price SM, Califano A, Shen MM. Regulation of extra-embryonic endoderm stem cell differentiation by Nodal and Cripto signaling. Development. 2011;138:3885–3895. doi: 10.1242/dev.065656. [DOI] [PMC free article] [PubMed] [Google Scholar]
- Kunath T, Arnaud D, Uy GD, Okamoto I, Chureau C, Yamanaka Y, Heard E, Gardner RL, Avner P, Rossant J. Imprinted X-inactivation in extra-embryonic endoderm cell lines from mouse blastocysts. Development. 2005;132:1649–61. doi: 10.1242/dev.01715. [DOI] [PubMed] [Google Scholar]
- Kwon GS, Fraser ST, Eakin GS, Mangano M, Isern J, Sahr KE, Hadjantonakis AK, Baron MH. Tg(Afp-GFP) expression marks primitive and definitive endoderm lineages during mouse development. Dev Dyn. 2006;235:2549–58. doi: 10.1002/dvdy.20843. [DOI] [PMC free article] [PubMed] [Google Scholar]
- Kwon GS, Viotti M, Hadjantonakis AK. The endoderm of the mouse embryo arises by dynamic widespread intercalation of embryonic and extraembryonic lineages. Dev Cell. 2008;15:509–20. doi: 10.1016/j.devcel.2008.07.017. [DOI] [PMC free article] [PubMed] [Google Scholar]
- Lawson KA, Dunn NR, Roelen BA, Zeinstra LM, Davis AM, Wright CV, Korving JP, Hogan BL. Bmp4 is required for the generation of primordial germ cells in the mouse embryo. Genes Dev. 1999;13:424–36. doi: 10.1101/gad.13.4.424. [DOI] [PMC free article] [PubMed] [Google Scholar]
- Li W, Ferkowicz MJ, Johnson SA, Shelley WC, Yoder MC. Endothelial cells in the early murine yolk sac give rise to CD41-expressing hematopoietic cells. Stem Cells Dev. 2005;14:44–54. doi: 10.1089/scd.2005.14.44. [DOI] [PubMed] [Google Scholar]
- Lim CY, Tam WL, Zhang J, Ang HS, Jia H, Lipovich L, Ng HH, Wei CL, Sung WK, Robson P, Yang H, Lim B. Sall4 regulates distinct transcription circuitries in different blastocyst-derived stem cell lineages. Cell Stem Cell. 2008;3:543–54. doi: 10.1016/j.stem.2008.08.004. [DOI] [PubMed] [Google Scholar]
- Long JZ, Lackan CS, Hadjantonakis AK. Genetic and spectrally distinct in vivo imaging: embryonic stem cells and mice with widespread expression of a monomeric red fluorescent protein. BMC Biotechnol. 2005;5:20. doi: 10.1186/1472-6750-5-20. [DOI] [PMC free article] [PubMed] [Google Scholar]
- Lu Y, Amos B, Cruise E, Lotan D, Lotan R. A parallel association between differentiation and induction of galectin-1, and inhibition of galectin-3 by retinoic acid in mouse embryonal carcinoma F9 cells. Biol Chem. 1998;379:1323–31. doi: 10.1515/bchm.1998.379.11.1323. [DOI] [PubMed] [Google Scholar]
- Madar S, Brosh R, Buganim Y, Ezra O, Goldstein I, Solomon H, Kogan I, Goldfinger N, Klocker H, Rotter V. Modulated expression of WFDC1 during carcinogenesis and cellular senescence. Carcinogenesis. 2009;30:20–7. doi: 10.1093/carcin/bgn232. [DOI] [PMC free article] [PubMed] [Google Scholar]
- Martin GR. Isolation of a pluripotent cell line from early mouse embryos cultured in medium conditioned by teratocarcinoma stem cells. Proc Natl Acad Sci U S A. 1981;78:7634–8. doi: 10.1073/pnas.78.12.7634. [DOI] [PMC free article] [PubMed] [Google Scholar]
- Medvinsky A, Rybtsov S, Taoudi S. Embryonic origin of the adult hematopoietic system: advances and questions. Development. 2011;138:1017–31. doi: 10.1242/dev.040998. [DOI] [PubMed] [Google Scholar]
- Meilhac SM, Adams RJ, Morris SA, Danckaert A, LeGarrec JF, Zernicka-Goetz M. Active cell movements coupled to positional induction are involved in lineage segregation in the mouse blastocyst. Dev Biol. 2009;331:210–21. doi: 10.1016/j.ydbio.2009.04.036. [DOI] [PMC free article] [PubMed] [Google Scholar]
- Mereau A, Grey L, Piquet-Pellorce C, Heath JK. Characterization of a binding protein for leukemia inhibitory factor localized in extracellular matrix. J Cell Biol. 1993;122:713–9. doi: 10.1083/jcb.122.3.713. [DOI] [PMC free article] [PubMed] [Google Scholar]
- Migeotte I, Omelchenko T, Hall A, Anderson KV. Rac1-dependent collective cell migration is required for specification of the anterior-posterior body axis of the mouse. PLoS Biol. 2010;8:e1000442. doi: 10.1371/journal.pbio.1000442. [DOI] [PMC free article] [PubMed] [Google Scholar]
- Miquerol L, Gertsenstein M, Harpal K, Rossant J, Nagy A. Multiple developmental roles of VEGF suggested by a LacZ-tagged allele. Dev Biol. 1999;212:307–22. doi: 10.1006/dbio.1999.9355. [DOI] [PubMed] [Google Scholar]
- Moustakas A, Heldin CH. Signaling networks guiding epithelial-mesenchymal transitions during embryogenesis and cancer progression. Cancer Sci. 2007;98:1512–20. doi: 10.1111/j.1349-7006.2007.00550.x. [DOI] [PMC free article] [PubMed] [Google Scholar]
- Na YR, Seok SH, Kim DJ, Han JH, Kim TH, Jung H, Lee BH, Park JH. Bone morphogenetic protein 7 induces mesenchymal-to-epithelial transition in melanoma cells, leading to inhibition of metastasis. Cancer Sci. 2009;100:2218–25. doi: 10.1111/j.1349-7006.2009.01301.x. [DOI] [PMC free article] [PubMed] [Google Scholar]
- Nagy A, Gertsenstein M, Vintersten K, Behringer R. A laboratory manual. Cold Spring Harbor Press; 2003. Manipulating the Mouse Embryo. [Google Scholar]
- Niakan KK, Ji H, Maehr R, Vokes SA, Rodolfa KT, Sherwood RI, Yamaki M, Dimos JT, Chen AE, Melton DA, McMahon AP, Eggan K. Sox17 promotes differentiation in mouse embryonic stem cells by directly regulating extraembryonic gene expression and indirectly antagonizing self-renewal. Genes Dev. 2010;24:312–26. doi: 10.1101/gad.1833510. [DOI] [PMC free article] [PubMed] [Google Scholar]
- Nowotschin S, Hadjantonakis AK. Cellular dynamics in the early mouse embryo: from axis formation to gastrulation. Curr Opin Genet Dev. 2010;20:420–7. doi: 10.1016/j.gde.2010.05.008. [DOI] [PMC free article] [PubMed] [Google Scholar]
- Oner H, Oner J, Demir R. Expression of nidogens in rat uterus and embryo during decidualization and implantation. J Morphol. 2006;267:822–30. doi: 10.1002/jmor.10449. [DOI] [PubMed] [Google Scholar]
- Pachnis V, Belayew A, Tilghman SM. Locus unlinked to alpha-fetoprotein under the control of the murine raf and Rif genes. Proc Natl Acad Sci U S A. 1984;81:5523–7. doi: 10.1073/pnas.81.17.5523. [DOI] [PMC free article] [PubMed] [Google Scholar]
- Pfister S, Steiner KA, Tam PP. Gene expression pattern and progression of embryogenesis in the immediate post-implantation period of mouse development. Gene Expr Patterns. 2007;7:558–73. doi: 10.1016/j.modgep.2007.01.005. [DOI] [PubMed] [Google Scholar]
- Pierre M, Yoshimoto M, Huang L, Richardson M, Yoder MC. VEGF and IHH rescue definitive hematopoiesis in Gata-4 and Gata-6-deficient murine embryoid bodies. Exp Hematol. 2009;37:1038–53. doi: 10.1016/j.exphem.2009.05.011. [DOI] [PMC free article] [PubMed] [Google Scholar]
- Plusa B, Piliszek A, Frankenberg S, Artus J, Hadjantonakis AK. Distinct sequential cell behaviours direct primitive endoderm formation in the mouse blastocyst. Development. 2008;135:3081–91. doi: 10.1242/dev.021519. [DOI] [PMC free article] [PubMed] [Google Scholar]
- Rhee JM, Pirity MK, Lackan CS, Long JZ, Kondoh G, Takeda J, Hadjantonakis AK. In vivo imaging and differential localization of lipid-modified GFP-variant fusions in embryonic stem cells and mice. Genesis. 2006;44:202–18. doi: 10.1002/dvg.20203. [DOI] [PMC free article] [PubMed] [Google Scholar]
- Rivera-Perez JA, Mager J, Magnuson T. Dynamic morphogenetic events characterize the mouse visceral endoderm. Dev Biol. 2003;261:470–87. doi: 10.1016/s0012-1606(03)00302-6. [DOI] [PubMed] [Google Scholar]
- Rossant J, Tam PP. Blastocyst lineage formation, early embryonic asymmetries and axis patterning in the mouse. Development. 2009;136:701–13. doi: 10.1242/dev.017178. [DOI] [PubMed] [Google Scholar]
- Rowley DR, Dang TD, Larsen M, Gerdes MJ, McBride L, Lu B. Purification of a novel protein (ps20) from urogenital sinus mesenchymal cells with growth inhibitory properties in vitro. J Biol Chem. 1995;270:22058–65. doi: 10.1074/jbc.270.37.22058. [DOI] [PubMed] [Google Scholar]
- Samavarchi-Tehrani P, Golipour A, David L, Sung HK, Beyer TA, Datti A, Woltjen K, Nagy A, Wrana JL. Functional genomics reveals a BMP-driven mesenchymal-to-epithelial transition in the initiation of somatic cell reprogramming. Cell Stem Cell. 2010;7:64–77. doi: 10.1016/j.stem.2010.04.015. [DOI] [PubMed] [Google Scholar]
- Sherwood RI, Jitianu C, Cleaver O, Shaywitz DA, Lamenzo JO, Chen AE, Golub TR, Melton DA. Prospective isolation and global gene expression analysis of definitive and visceral endoderm. Dev Biol. 2007;304:541–55. doi: 10.1016/j.ydbio.2007.01.011. [DOI] [PubMed] [Google Scholar]
- Singh AM, Hamazaki T, Hankowski KE, Terada N. A heterogeneous expression pattern for Nanog in embryonic stem cells. Stem Cells. 2007;25:2534–42. doi: 10.1634/stemcells.2007-0126. [DOI] [PubMed] [Google Scholar]
- Smith BT, Mussell JC, Fleming PA, Barth JL, Spyropoulos DD, Cooley MA, Drake CJ, Argraves WS. Targeted disruption of cubilin reveals essential developmental roles in the structure and function of endoderm and in somite formation. BMC Dev Biol. 2006;6:30. doi: 10.1186/1471-213X-6-30. [DOI] [PMC free article] [PubMed] [Google Scholar]
- Soares ML, Haraguchi S, Torres-Padilla ME, Kalmar T, Carpenter L, Bell G, Morrison A, Ring CJ, Clarke NJ, Glover DM, Zernicka-Goetz M. Functional studies of signaling pathways in peri-implantation development of the mouse embryo by RNAi. BMC Dev Biol. 2005;5:28. doi: 10.1186/1471-213X-5-28. [DOI] [PMC free article] [PubMed] [Google Scholar]
- Soares ML, Torres-Padilla ME, Zernicka-Goetz M. Bone morphogenetic protein 4 signaling regulates development of the anterior visceral endoderm in the mouse embryo. Dev Growth Differ. 2008;50:615–21. doi: 10.1111/j.1440-169X.2008.01059.x. [DOI] [PMC free article] [PubMed] [Google Scholar]
- Srinivas S, Rodriguez T, Clements M, Smith JC, Beddington RS. Active cell migration drives the unilateral movements of the anterior visceral endoderm. Development. 2004;131:1157–64. doi: 10.1242/dev.01005. [DOI] [PubMed] [Google Scholar]
- Stewart MH, Bosse M, Chadwick K, Menendez P, Bendall SC, Bhatia M. Clonal isolation of hESCs reveals heterogeneity within the pluripotent stem cell compartment. Nat Methods. 2006;3:807–15. doi: 10.1038/nmeth939. [DOI] [PubMed] [Google Scholar]
- Strope S, Rivi R, Metzger T, Manova K, Lacy E. Mouse amnionless, which is required for primitive streak assembly, mediates cell-surface localization and endocytic function of cubilin on visceral endoderm and kidney proximal tubules. Development. 2004;131:4787–95. doi: 10.1242/dev.01341. [DOI] [PubMed] [Google Scholar]
- Takaoka K, Yamamoto M, Hamada H. Origin and role of distal visceral endoderm, a group of cells that determines anterior-posterior polarity of the mouse embryo. Nat Cell Biol. 2011;13:743–52. doi: 10.1038/ncb2251. [DOI] [PubMed] [Google Scholar]
- Tanaka S, Kunath T, Hadjantonakis AK, Nagy A, Rossant J. Promotion of trophoblast stem cell proliferation by FGF4. Science. 1998;282:2072–5. doi: 10.1126/science.282.5396.2072. [DOI] [PubMed] [Google Scholar]
- Thiery JP, Acloque H, Huang RY, Nieto MA. Epithelial-mesenchymal transitions in development and disease. Cell. 2009;139:871–90. doi: 10.1016/j.cell.2009.11.007. [DOI] [PubMed] [Google Scholar]
- Thijssen VL, Barkan B, Shoji H, Aries IM, Mathieu V, Deltour L, Hackeng TM, Kiss R, Kloog Y, Poirier F, Griffioen AW. Tumor cells secrete galectin-1 to enhance endothelial cell activity. Cancer Res. 2010;70:6216–24. doi: 10.1158/0008-5472.CAN-09-4150. [DOI] [PubMed] [Google Scholar]
- Thomas P, Beddington R. Anterior primitive endoderm may be responsible for patterning the anterior neural plate in the mouse embryo. Curr Biol. 1996;6:1487–96. doi: 10.1016/s0960-9822(96)00753-1. [DOI] [PubMed] [Google Scholar]
- Tomihara-Newberger C, Haub O, Lee HG, Soares V, Manova K, Lacy E. The amn gene product is required in extraembryonic tissues for the generation of middle primitive streak derivatives. Dev Biol. 1998;204:34–54. doi: 10.1006/dbio.1998.9034. [DOI] [PubMed] [Google Scholar]
- Toyooka Y, Shimosato D, Murakami K, Takahashi K, Niwa H. Identification and characterization of subpopulations in undifferentiated ES cell culture. Development. 2008;135:909–18. doi: 10.1242/dev.017400. [DOI] [PubMed] [Google Scholar]
- Trainor PA, Melton KR, Manzanares M. Origins and plasticity of neural crest cells and their roles in jaw and craniofacial evolution. Int J Dev Biol. 2003;47:541–53. [PubMed] [Google Scholar]
- Tucker KL, Beard C, Dausmann J, Jackson-Grusby L, Laird PW, Lei H, Li E, Jaenisch R. Germ-line passage is required for establishment of methylation and expression patterns of imprinted but not of nonimprinted genes. Genes Dev. 1996;10:1008–20. doi: 10.1101/gad.10.8.1008. [DOI] [PubMed] [Google Scholar]
- Winnier G, Blessing M, Labosky PA, Hogan BL. Bone morphogenetic protein-4 is required for mesoderm formation and patterning in the mouse. Genes Dev. 1995;9:2105–16. doi: 10.1101/gad.9.17.2105. [DOI] [PubMed] [Google Scholar]
- Wolfrum C, Howell JJ, Ndungo E, Stoffel M. Foxa2 activity increases plasma high density lipoprotein levels by regulating apolipoprotein M. J Biol Chem. 2008;283:16940–9. doi: 10.1074/jbc.M801930200. [DOI] [PubMed] [Google Scholar]
- Yamamoto M, Beppu H, Takaoka K, Meno C, Li E, Miyazono K, Hamada H. Antagonism between Smad1 and Smad2 signaling determines the site of distal visceral endoderm formation in the mouse embryo. J Cell Biol. 2009;184:323–34. doi: 10.1083/jcb.200808044. [DOI] [PMC free article] [PubMed] [Google Scholar]
- Ying QL, Nichols J, Chambers I, Smith A. BMP induction of Id proteins suppresses differentiation and sustains embryonic stem cell self-renewal in collaboration with STAT3. Cell. 2003;115:281–92. doi: 10.1016/s0092-8674(03)00847-x. [DOI] [PubMed] [Google Scholar]
- Ying QL, Smith AG. Defined conditions for neural commitment and differentiation. Methods Enzymol. 2003;365:327–41. doi: 10.1016/s0076-6879(03)65023-8. [DOI] [PubMed] [Google Scholar]
- Zeisberg M, Shah AA, Kalluri R. Bone morphogenic protein-7 induces mesenchymal to epithelial transition in adult renal fibroblasts and facilitates regeneration of injured kidney. J Biol Chem. 2005;280:8094–100. doi: 10.1074/jbc.M413102200. [DOI] [PubMed] [Google Scholar]
- Zernicka-Goetz M, Morris SA, Bruce AW. Making a firm decision: multifaceted regulation of cell fate in the early mouse embryo. Nat Rev Genet. 2009;10:467–77. doi: 10.1038/nrg2564. [DOI] [PubMed] [Google Scholar]
- Zhang H, Bradley A. Mice deficient for BMP2 are nonviable and have defects in amnion/chorion and cardiac development. Development. 1996;122:2977–86. doi: 10.1242/dev.122.10.2977. [DOI] [PubMed] [Google Scholar]
Associated Data
This section collects any data citations, data availability statements, or supplementary materials included in this article.
Supplementary Materials
(A) IM8A1 XEN cells cultured for 4 days in XEN cell morphology after addition of BMP4 for 4 days at concentrations ranging from 0 to 20 ng/mL in 70% fibroblast conditioned medium (MEF-CM) or 20% FBS RPMI1640 (RPMI1640). High magnification zooms of low magnification images (inset) acquired with a 10X magnification. In the insets, areas of epithelial cell colonies are highlighted in red. (B) Immunodetection of βCAT, CDH1 (adherens junctions) and ZO-1 (tight junction). βCAT, CDH1 and ZO-1, red; nuclei counterstained with Hoechst, blue. Scale bar: 20 μm.
Afp∷GFP tg/+ XEN cells were pre-cultured for 3 hours in presence of 2μM Dorsomorphin or 100 ng/mL Noggin before addition of 10 ng/mL BMP4. Cells were subsequently cultured for 4 additional days. Afp∷GFP, green.
Glass coverslips were coated with gelatin, poly-L-Lysine, collagen type IV, laminin or fribronectin before plating untreated (control) or BMP4-treated XEN cells. Cells were cultured for 2 days in N2B27 media with or without BMP4 at 10 ng/mL. Control XEN cells attached to most of the supports except for poly-L-Lysine, exhibited low levels of Ecadherin (CDH1) and usually did not develop adherens junctions. BMP-treated cells attached better so supports coated with collagen type IV, laminin and fibronectin, expressed CDH1 and acquired epithelial morphology. CDH1, red; F-actin, green; nuclei counterstained with Hoechst, blue. Scale bar: 50 μm.
Diagrams depict the differential expression of gene encoding for structural proteins and for integrins, catenins and cadherins that were detected in our microarray assay. In grey are genes that are not differentially expressed (FC~1). Genes upregulated (FC≥1.8) in BMP-treated conditions are depicted in red, genes downregulated (FC≤-1.8) in green.
(A) Images of kidneys dissected from two independent animals 2 months after injection of BMP-treated XEN cells into one kidney (injected). (B, C) Images of paraffin sections from injected kidney #1 (B) and kidney #2 (C) counterstained with Masson’s trichrome stain. B’, C’ and C” are magnified views of (B) and (C) respectively.
3D time-lapse imaging of Afp∷GFPtg/+ XEN cells treated with 10 ng/mL BMP4 and plated on fibronectin-coated chambered coverglass slides (Lab-tek). Z-stacks were acquired every 10 minutes for a total of 13 h. Blue arrows indicate cells starting to express detectable levels of GFP.