Abstract
Chirality and liquid crystals are both widely expressed in nature and biology. Helical assembly of mesophasic molecules and colloids may produce intriguing chiral liquid crystals. To date, chiral liquid crystals of 2D colloids have not been explored. As a typical 2D colloid, graphene is now receiving unprecedented attention. However, making macroscopic graphene fibres is hindered by the poor dispersibility of graphene and by the lack of an assembly method. Here we report that soluble, chemically oxidized graphene or graphene oxide sheets can form chiral liquid crystals in a twist-grain-boundary phase-like model with simultaneous lamellar ordering and long-range helical frustrations. Aqueous graphene oxide liquid crystals were continuously spun into metres of macroscopic graphene oxide fibres; subsequent chemical reduction gave the first macroscopic neat graphene fibres with high conductivity and good mechanical performance. The flexible, strong graphene fibres were knitted into designed patterns and into directionally conductive textiles.
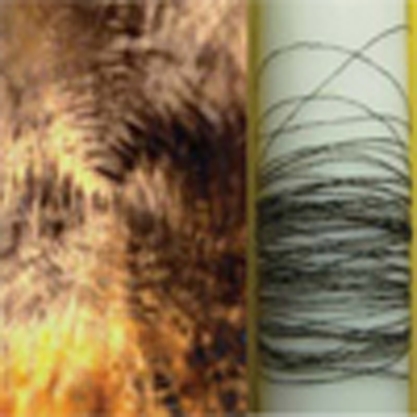 Chiral liquid crystals of two-dimensional colloids have not been extensively investigated. Xu and Gao show that graphene oxide can form chiral liquid crystals, and demonstrate that they can be spun into macroscopic fibres, and that subsequent chemical reduction provides graphene fibres with high conductivity.
Liquid crystalline colloids are of great interest due to their significance in understanding colloid physics and accessing fluid-phase assembly. The chiral liquid crystals (CLCs) of one-dimensional (1D) colloids such as DNA1, bacteriophage fd virus2 and imogolite3 have been reported. Various conventional liquid crystalline mesophases of two-dimensional (2D) colloids—nematic, columnar and lamellar—have been reported4,5,6,7,8,9,10. However, the CLC phase of 2D colloids has not been reported previously, possibly because no one knows whether achiral flake particles can form long-range helical systems.
As a typical 2D colloid, graphene, a single atomic layer of graphite, consists of sp2-hybridized carbon atoms in a honeycomb lattice11. It has possibly become the fastest growing topic in science and technology because of its marvellous properties such as the strongest mechanical strength ever measured, giant intrinsic carrier mobility, tunable band gap or electrical conductivity and record thermal conductivity12,13,14,15. Advances have been achieved in the area of graphene-based devices and composites15,16,17,18,19, but to effectively translate the properties of graphene into macroscopic-ordered materials, such as continuous fibres, challenges must be overcome in terms of its limited dispersibility in common solvents as the lack of scalable assembly methods20. Alternatively, chemically oxidized graphene or graphene oxide (GO), the most accessible precursor of graphene, possesses good solubility in water and polar organic solvents, and can form lyotropic nematic liquid crystals (LC)21,22, a typical mesophase of highly anisotropic colloids4,23. This conventional phase behaviour of GO sheets could lead to the discovery of novel mesophases. Furthermore, GO LC with regular ordering promises the most viable fluid assembly approach to macroscopic graphene fibres via wet-spinning techniques. Such fibres would further result in robust and conductive textiles useful for numerous applications, in the light of strong Kevlar fibres and carbon nanotube (CNT) fibres24,25,26 similarly spun from their liquid crystalline spinning dopes.
Here we discover and demonstrate that GO sheets can form a CLC in their aqueous dispersions that obeys a twist-grain-boundary (TGB) phase-like model. The first continuous, neat graphene fibres, without any supporting surfactant or polymer, have been produced by industrially viable wet-spinning of GO LCs followed by chemical reduction. The graphene fibre possesses good mechanical performance (~140 MPa at ultimate elongation of 5.8%) and high conductivity (~2.5×10⁴ S m−1). The fibres can be woven into designed patterns and complex textiles. This LC-based wet-spinning technology promises a brand-new methodology to fabricate high-performance carbonaceous fibres with versatile functionalities from natural graphite.
Results
Textures of GO CLCs
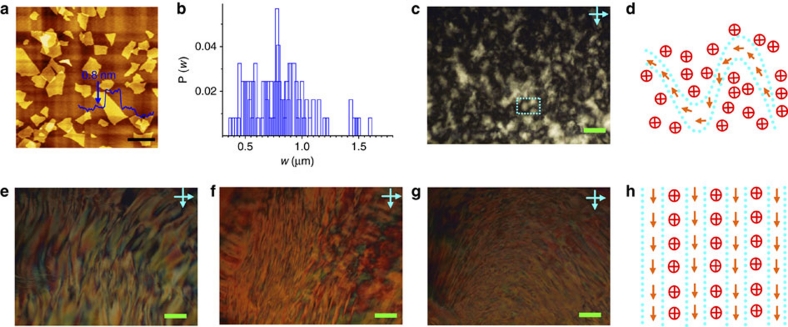
The GO sheets we used are single-layered, narrowly polydispersed and individually dispersed in water (Fig. 1a,b; Supplementary Fig. S1). The 2D morphology and width distribution of GO sheets are demonstrated in Figure 1a,b, respectively. Their average thickness (t) is 0.8 nm and the average lateral width (w) is 0.81 μm with a narrow polydispersity of 13% (much lower than 83% of the crude GO sample without size fractionation21). The GO aqueous dispersions were observed by polarized optical microscopy (POM) between crossed polarizers (Fig. 1c–h). Upon increasing the volume fraction (φ) to 0.23%, GO dispersions evolve from blank to Schlieren texture (Fig. 1c), a typical birefringent texture of nematic LCs7,8,21,22,23. According to the model for polydispersed infinitely thin platelets, this concentration of isotropic–nematic phase transition (0.23%) is very close to the theoretical value (0.25%)23. In the stable nematic phase, the black brushes represent the disclinations of orientational orders, corresponding to the neighbouring crossed direct vectors (Fig. 1d). As φ increases up to 0.39, 0.60 and 0.76%, the textures turn into aligned, vivid bands, which are similar to the fingerprint texture of cholesteric phase27 and Grandjean texture of TGB phase28 (Fig. 1e–g, additional fingerprint textures see Supplementary Fig. S2). As the incompatibility of helical director field and smectic-layered feature in a continuous system results in frustrated structures containing a regular screw lattice of grain boundaries in TGB phase28, we can speculate that the textures of our samples result from the helical arrangement of GO sheets with vectors map between neighbouring bands as indicated in Figure 1h. The width of these aligned bands could be related to the pitch length, and becomes thinner with φ increasing from 0.39% (Fig. 1e) to 0.60% (Fig. 1f) and 0.76% (Fig. 1g). Such aligned banded structures have been confirmed by laser confocal microscopy with the fluorescent character of GO sheets21 (Supplementary Fig. S3).
Figure 1. Atomic force microscopy image of graphene oxide sheets and POM observations of GO aqueous dispersions.
(a) Typical atomic force microscopy image of GO sheets. (b) The width distribution of GO sheets obtained from Supplementary Figure S1. (c–g) POM images of GO LCs with successively increased volume fractions (φs) of 0.23, 0.38, 0.60, 0.76%. (d,h) Director fields of the disclination in the nematic phase (rectangle in c) and the fingerprint texture of chiral phase (e–g). The director vector (n) is defined as the normal direction of GO sheet plane. The crosses indicate ns into the paper and the arrows show ns on the paper in d and h. Scale bars, 2 μm (a) and 200 μm (c,e–g).
Lamellar structure in GO CLCs
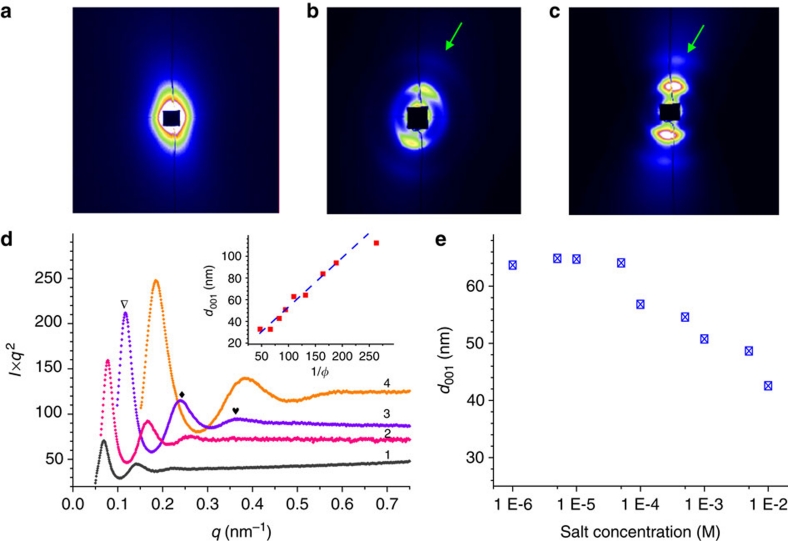
Small-angle X-ray scattering (SAXS) studies further revealed quantitative structural information of GO dispersions (Fig. 2; Supplementary Fig. S4). In the very dilute isotropic dispersion (φ 0.03%), the X-ray scattering intensity (I) monotonously decreases with scattering vector modulus (q) as I~q−2, following the typical scattering law of 2D planar colloids and proving the flat morphology of dispersed GO sheets8,9. In the nematic GO phase (φ 0.23%), elliptical SAXS diffusive pattern together with the absence of sharp scattering peak indicates the sole orientational order in the dilute dispersions (Fig. 2a). In comparison, for those concentrated dispersions (φ≥0.38%) with aligned banded textures (Fig. 1e–g), strong anisotropic patterns (Fig. 2b–c) and multiple correlation peaks (up to 3) are observed (Fig. 2d). The profiles of scattering intensity as a function of scattering vector show detailed information of lamellar orders depending on GO concentration, and the peaks can be indexed to the 001 reflection of the lamellar structure8,9. Compared with the widely dispersed GO LCs21, the narrowly dispersed GO LCs show stronger reflection signals, demonstrating more orderly organized structures resulted from their more uniform distribution in size.
Figure 2. SAXS investigation of GO aqueous dispersions.
(a–c) 2D scattering patterns of GO dispersions with successive volume fractions (φs) of 0.38, 0.91 and 1.5%. The diffusive arcs (arrows) in b and c denote the reflection arcs. (d) Profiles of scattering intensity as a function of scattering vector q (q=4πsinθ/λ=2π/d) in samples with successive φs of 0.38, 1.06, 1.51 and 2.12% (successively numbered by 1–4). The triangular, diamond and heart signals denote the first-, the second- and the third-order scattering peaks in order. Inset: the correlation of d(001) spacing and 1/φ; the red dots are experimental values and the blue line is the fitting function in the linear region (φ≥0.5%). (e) Variation of the interlayer spacing d with salt concentration at φ=1.0%.
Particularly, the evolution of interlayer spacing (d=2π/q0) upon the inverse volume fraction (1/φ) is concluded in Figure 2d insert (detailed data see Supplementary Table S1). At 0.5% <φ<2.3%, the evolution displays a linear relation, where d is proportional to 1/φ (d=t/φ, t is the thickness of 2D colloids), following the typical 1D swelling behaviour of lamellar 2D colloids LCs8,9. The fitting line slope reflecting the experimental thickness of GO sheets is 0.46±0.03 nm, near to the theoretical thickness of a monolayer graphene sheet (0.34 nm), which proves that GO sheets are perfectly exfoliated to individual ones in their LCs. The linear region ends as φ approaches 0.5%, around the transition concentration (φ 0.38%) from nematic to lamellar phase observed in POM investigations (Fig. 1c,e). For dilute dispersions with lower φs, d value is deviated from the first linear region, possibly suggesting the isotropic volume swelling behaviour in the nematic phase.
Similar to the liquid crystalline system of phosphatoantimonate platelets9, the major interaction mainly considered to stabilize the GO LC in an aqueous surrounding is the electrostatic repulsion because of the negative zeta potential (−61±5 mV) of GO sheets and the strong salt effect of its LC phase. We performed SAXS measurements for the samples with gradient salt concentrations at the same GO volume fraction (Supplementary Fig. S5). The interlayer spacing calculated from the corresponding SAXS patterns largely decreases at relatively high ionic strength beyond [NaCl]≈1×10⁻⁴ M (Fig. 2e), because the electrostatic interactions are strongly screened9. As a result, at φ=0.7%, the interlayer spacing falls from 63 nm in pure water to 42 nm at [NaCl]≈1×10⁻² M. As the salt concentration rises to 0.1 M, flocculated solids are emerged, and the corresponding SAXS pattern shows neither scattering peaks nor anisotropy, implying that the flocculated solids consist of randomly aggregated GO sheets.
CD activity of GO CLCs
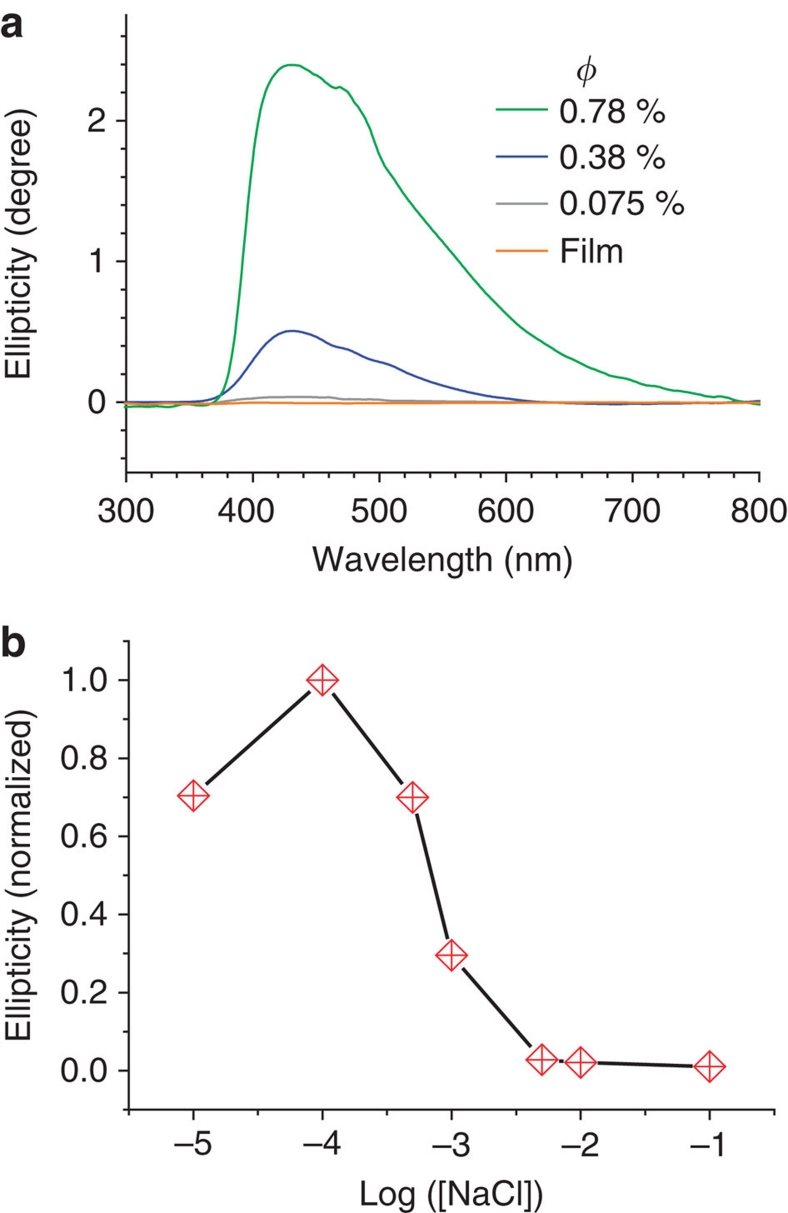
For a CLC, circular dichroism (CD) is a useful tool to characterize the selective reflection coefficients for right- and left-handed circularly polarized waves29,30. To examine the chirality of our GO CLCs, we obtained their CD spectra, as shown in Figure 3a. The CD activity is very weak for the dilute GO dispersions, and becomes stronger upon increasing φ, for instance to 0.38% (a value close to nematic–CLC phase transition). Very strong CD signal (up to 2,400 millidegree) is detected as φ rises to 0.76% (a value of GO CLC with stable lamellar structure). The characteristic CD spectrum spans around 420 nm from 380 to 800 nm that covers a wide range from near ultraviolet and visible light to near infrared, implying a gradient helical arrangement of GO sheets. GO CLC with such a wide CD response can be used as potential optical components31. By contrast, no obvious CD activity was detected for the filtrated transparent GO solid films, in which GO sheets are aligned parallel along the film surface19. These results validate that the CD activity of GO CLC is generated by the helical arrangements of different GO sheets, rather than by the possible optical activity from the asymmetrical structures on GO planes. Therefore, we can conclude that the GO CLC holds both lamellar and helical arrangements simultaneously.
Figure 3. CD activity of GO CLCs.
(a) CD spectra of GO aqueous dispersions and GO solid film. (b) Normalized CD activity of GO CLC (φ=1.0%) as a function of salt concentration.
Considering the major role of electrostatic repulsion to affect the lamellar structure (Fig. 2e), we further assessed the effect of ionic strength on the CD activity of GO CLCs (Fig. 3b; Supplementary Fig. S6). At low salt concentration ([NaCl]<1×10⁻⁴ M), the ellipiticity of GO CLC is strong, and decays with increasing [NaCl] from 1×10⁻⁴ to 5×10⁻³ M. Eventually, the ellipticity falls to zero at [NaCl]>1×10⁻² M.. These measurements clarify that the helical arrangement in GO CLCs is dominated by the electrostatic repulsion between GO sheets.
Helical structures in GO CLCs
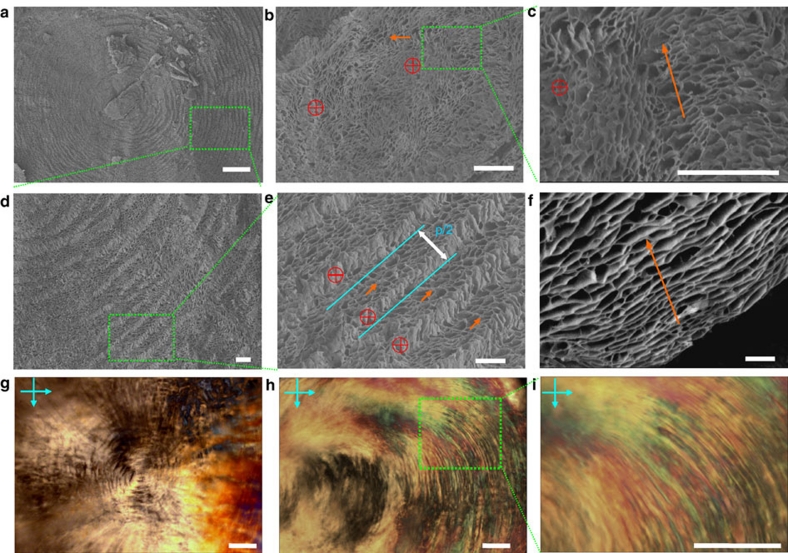
The helical structural details of GO CLC have been directly visualized by cryo-scanning electron microscopy (SEM), as shown in Figure 4a–f. The freeze-fracture morphology of the GO CLC confined to a circular cavity shows annual ring-like structures comprising of undulating bands with distinct boundaries (Fig. 4a). We can distinguish that GO sheets pile up to form the bands with neighbouring orthogonal vectors along the radius, leading to the undulating morphology. The distance between two adjacent bands can be assigned to one-half of the pitch (p/2) of the helix (Fig. 4e). The measured pitch (~42 μm) is much wider than those (0.1–1.2 μm) of ever reported giant TGB phases of small molecules32, due to the large lateral width (micrometre scale) of constituent GO sheets. Furthermore, the lamellar feature with a regular interlayer spacing is revealed in the side-view SEM examination of the assembled GO blocks (Fig. 4f). Meanwhile, highly regular fingerprint-like and focal conic textures (Fig. 4g–i; Supplementary Fig. S7b,c) are observed under POM for the confined GO CLCs in a cavity with the same diameter. These regular bands are related to the pitches of CLC helixes (p), and the interspacing between two neighbouring bands is 15–25 μm, close to p/2 (~21 μm), ascertained from the above cryo-SEM measurements. The corresponding director field of CLC is depicted in Supplementary Figure S7d, in which the vectors (ns) rotate on the helical axis (parallel to the surface) along the radius and form alternatively perpendicular vector bands. In Figure 1e–g, the texture bands get thinner upon increasing φ, indicating that the pitch of GO sheets helix narrows down as the GO concentration rises. This leads to a greater twist between GO sheet boundaries, thus causing stronger CD activity (Fig. 3a).
Figure 4. Cryo-SEM images and POM textures for GO CLCs.
(a–e) Top-view SEM images show the fracture morphology of GO CLCs at volume fraction φ 0.98% confined in a circular cavity. The red crosses denote vectors (ns) into the paper and the orange arrows on the paper. (b) The central domain in a.(c) The screw dislocation of neighbouring GO lamellar blocks with twist vectors. (f) Side-view SEM image of assembled GO blocks. (g–i) POM images between crossed polarizers of GO CLCs in central (g) and lateral (h,i) domains. The regular ring textures (g–i) are in accordance with the annual-ring undulating fracture morphology (a–e) of GO CLC. Scale bars, 200 μm (a), 25 μm (b–f) and 300 μm (g–i).
TGB-like model for GO CLC
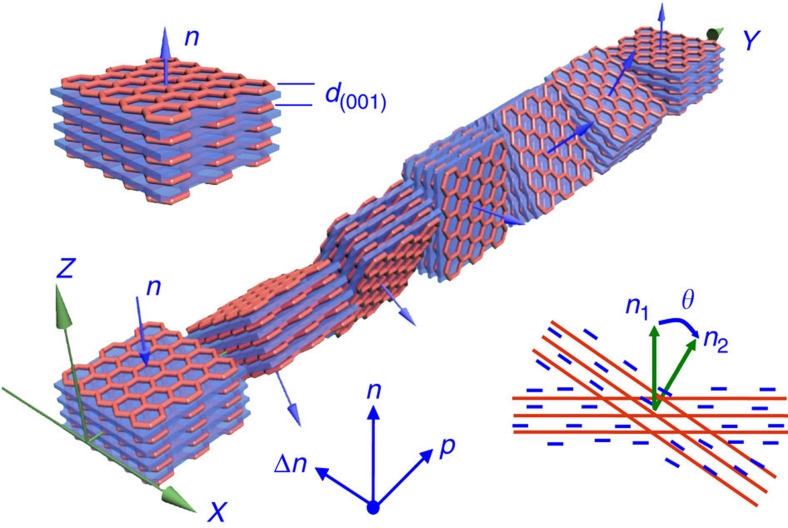
On the basis of above experimental results, we constructed a model in one-pitch range for the CLC of 2D colloidal GO sheets that holds both continuous lamellar and helical features (Fig. 5). GO sheets assemble into lamellar blocks with a local vector (n) in their normal direction, and the d between adjacent graphene sheets deceases with the increasing of φ (top left, Fig. 5). Because of negative charges at boundaries and on surfaces of GO sheets (zeta potential of GO dispersions is −61±5 mV), the neighbouring blocks repel each other, forming the rotated conformation by turning to a certain angle (calculated as 7.0°, θ≈360w/p at φ=0.98%) to minimize the free energy (bottom right, Fig. 5). Along the helical axis, the blocks rotate successively in the same direction (clockwise or anticlockwise) to establish the helical arrangements (centre, Fig. 5). In other words, the negatively charged grain boundaries of GO sheets produce helical dislocations in their lamellar fluids and thus set the orderly frustrated structures in their chiral phases. In fact, we can recognize two twisted neighbouring lamellar blocks under the high magnification of cryo-SEM (Fig. 4c). Our twist-lamellar-block model for CLCs of 2D colloids can be analogous to the reported TGB phase of conventional small molecules28,33.
Figure 5. Proposed model for one pitch of GO CLCs.
The vectors (ns) of the lamellar blocks rotate anticlockwise along the helical axis. Top left: the lamellar structure of the organized GO block with an identical n and a regular spacing d; the semitransparent blue blocks indicate interlayer water, and GO sheets are indicated as pink nets (double bonds in the basal planes and pedant functional groups have been omitted for clarity). Bottom right: the screw dislocation between two neighbouring grain boundaries of GO lamellar blocks (the red line denotes GO sheet boundaries). The negative charges (blue minus) spread the surface and boundaries of GO sheets and make two blocks repulse each other, with an angle θ between two vectors (n1 and n2).
Chiral silica gels by GO CLC templating
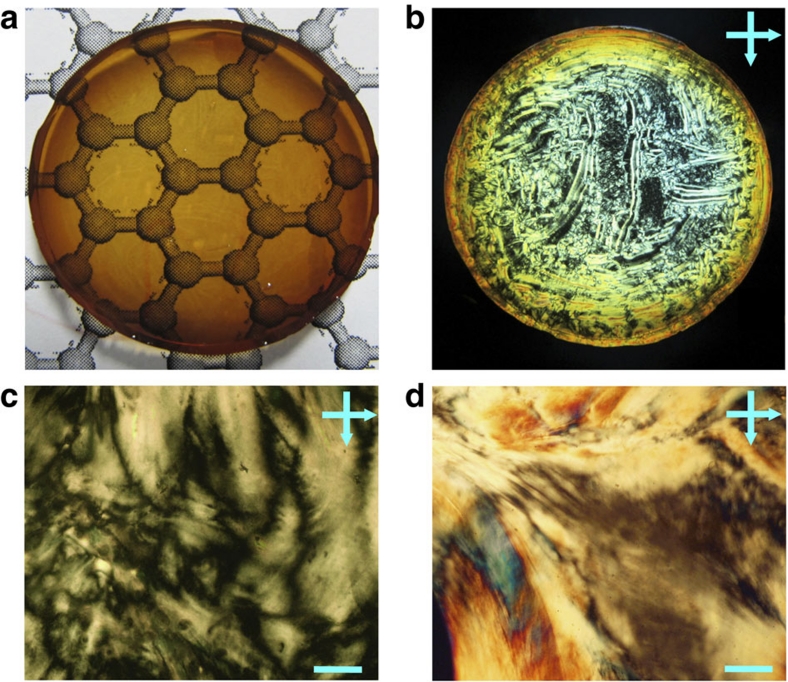
The fluid GO CLC can be fixed by hydrolysis of tetraethyl orthosilicate via a sol–gel method, affording a transparent, self-standing gel film (Fig. 6a,b), with the parent structure of GO CLC. The central and fringe domains of the film show Schlieren (Fig. 6c) and vivid banded textures under POM (Fig. 6d), respectively. The difference between textures is likely ascribed to the tensile force of the fringe during cross-linking. Importantly, the film shows considerable CD activity, demonstrating that the gel holds the helical structure of original CLC (Supplementary Fig. S8). The resultant gel films with specific chirality can be practically applied to optical apparatus31, and GO CLC could serve as templates to fabricate chiral porous materials34.
Figure 6. Chiral gel film templated from GO CLCs.
(a,b) Respective photographs of the chiral gels under natural light and between crossed polarizers. The diameter of the film is 3 cm. (c,d) The respective POM images in the central zoom and fringe of the chiral film. Scale bars, 200 μm.
Continuous graphene fibres by wet-spinning
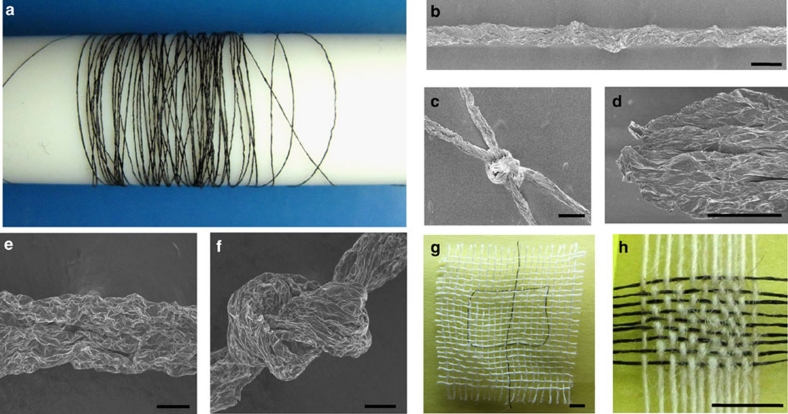
To construct macroscopic graphene fibres is a big challenge that remains unsolved. Clearly, wet-spinning is the only viable approach because of the high-temperature stability of graphene (melt-spinning is not an option), as is the case for CNTs24,25,26. Our discovery of GO LCs with lamellar structures allows to disperse GO at high-enough concentrations, suitable for efficient alignment and effective coagulation. For the first time, we have fabricated neat GO fibres by spinning the aqueous LCs in a coagulation bath of 5 wt% NaOH/methanol solution (spinning apparatuses are sketched in Supplementary Fig. S9). Direct spinning of GO LCs at concentrations of φs 0.76 and 2.0% resulted in brittle fibres and collapsed belts, respectively, (Supplementary Fig. S10a). From the concentrated LC dispersion (for example, φ=5.7%), we obtained continuous fibres successfully. Metres of GO fibres have been readily produced in ~10 min, with tunable diameters (50–100 μm), by adjusting the size of nozzle and the drawing speed (Fig. 7a,b). Typical knots are made and the fibres do not break as the knots are tightened (Fig. 7c; Supplementary Fig. S10b). The curved structure through 360° demonstrates the excellent flexibility and high resistance to torsion of GO fibres compared with the classical carbon fibres. Through SEM kept in high magnitude (Supplementary Fig. S10c), we identified that GO sheets aligned in their planar directions with crumbled surfaces.
Figure 7. Macroscopic neat GO fibres and chemically reduced graphene fibres.
(a) Four-metre-long GO fibre wound on a Teflon drum (diameter, 2 cm). SEM image of the fibre (b), and its typical tighten knots (c). (d) The fracture morphology of GO fibre after tensile tests. The surface winkled morophology (e) and the tighten knot (f) of graphene fibre. j: A Chinese character (' ', Zhong) pattern knitted in the cotton network (white) using two graphene fibres (black). k: A mat of graphene fibres (horizontal) woven together with cotton threads (vertical). Scale bars, 50 μm (b–f) and 2 mm (g, h).
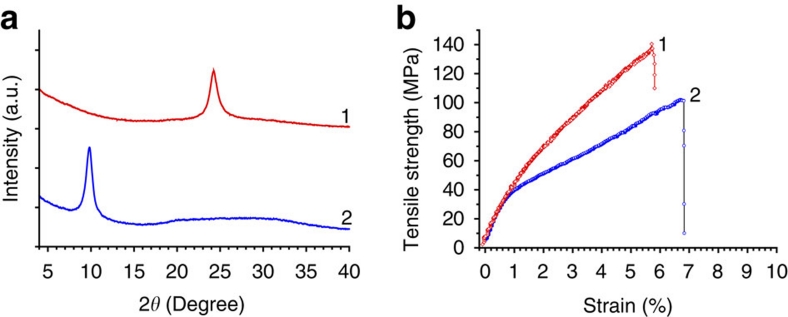
Subsequently, we prepared neat graphene fibres by chemical reduction of GO fibres in hydroiodic acid (40%)35. The reduced graphene fibre shrinks in diameter and exhibits grey metallic lustre. The X-ray diffraction studies (Fig. 8a) indicate that the interlayer spacing decreases from 8.9 Å (2θ=9.86°) for GO fibres to 3.7 Å (2θ=24.25°) for graphene fibres, a value close to the interlayer spacing (3.35 Å) of graphite, due to the elimination of pendant functional groups of GO sheets during the chemical reduction. The reduction was further confirmed with Raman spectra of fibres (Supplementary Fig. S11). The reduced graphene fibre shows high electrical conductivity up to ~2.5×10⁴ S m−1, even higher than the filtrated graphene paper reduced by hydrazine hydrate (~7.2×10³ S m−1)36.
Figure 8. X-ray diffraction patterns and typical mechanical measurements under tensile loading of GO and graphene fibres.
X-ray diffraction patterns (a) and typical mechanical measurements under tensile loading (b) of GO and graphene fibres. The number 1 and 2 denote graphene and GO fibres, respectively. The strain rate is 5% min−1. The Young's moduli of GO and graphene fibres at low deformation are about 5.4 and 7.7 GPa, respectively.
The continuous GO fibres exhibit a typical plastic deformation at room temperature (Fig. 8b). This behaviour possibly arises from the stretching of the crumbled GO sheets and by the displacements of GO sheets (see the fracture morphology in Fig 7d; Supplementary Fig. 11d-f). In the elastic region, the fibres have a typical Young's modulus of 5.4 GPa at small deformation. Importantly, the fibres show fracture elongations of ~6.8–10.1%, an order of magnitude greater than that of filtrated GO papers (~0.4%)19. The fracture strength of our GO fibres is measured to be 102 MPa, comparable to that (70–130 MPa) of filtrated GO papers18,19.
The chemically reduced graphene fibres we obtained were strong and flexible. Compared with GO fibres, graphene fibres show enhanced Young's modulus (7.7 GPa) and fracture strength (140 MPa), while keeping considerable fracture elongation (~5.8%; Fig. 8b). This enhanced strength could be ascribed to the stronger interactions between graphene sheets resulting from the more compact stacking (small interlayer distance from Fig. 8a) for the graphene fibre. Although our fibres are far weaker than the individual graphene sheets (Young's modulus 1.0 TPa and fracture strength 130 GPa13), we believe that the mechanical property can be greatly improved by optimization of the spinning process and post annealing to decrease the voids in fibres and then enhance interactions between the graphene sheets. Similar to GO fibres, the crumbled graphene sheets can be stretched under tensile stress, leading to the high fracture elongation for the graphene fibre (see the surface and fracture morphology in Fig. 7e; Supplementary Fig. S12). No breakage occurs when the fibre is curved to a tightened knot (Fig. 7f), showing the flexibility of neat graphene fibres. In addition, we used the flexible graphene fibres to embroider patterns in other textiles (for example, a Chinese character, ZHONG, in Fig. 7g), and to wave pure graphene textiles or mixed ones with commercial threads (Fig. 7h). These graphene-based fibres and textiles should have promising applications in electromagnetic shields, antennas and batteries.
Discussion
Recently, some exotic phase behaviours have been observed in the liquid crystalline system of asymmetrical 2D colloids, such as in empty liquids37 and in biaxial LCs38, indicating the fluid physics of 2D colloids is still growing with various unknown mesophases despite the past 70 years4. Herein, we found that 2D colloids can form a CLC phase by using the prototype of GO sheets. With the help of synchrotron SAXS measurements, we have disclosed two different arrangements in GO dispersions, depending on the concentration: orientational order and lamellar attributes, which are assigned to the nematic and chiral mesophases, respectively.
Theoretically, Landau–Peierls instability in the system with the 1D density wave in 2D liquid medium exhibits a quasi-long-range order in smectic phases, rather than in the true-long-range order, caused by the thermal fluctuation27. Experimental results have demonstrated that the positional correlation function decay algebraically as some power of the distance in smectic-A mesophase39,40,41. To further explain the orderings in GO CLCs, Callié lineshape analyses (see Supplementary Note) were carried out to the first scattering peak (q0) in SAXS profiles. We observed that the scattering intensity also obeys the power-law decay as a function of scattering vectors (S(0, 0, q) ~ (q−q0)−2+η, η the Callié exponent), implying the lamellar structures of GO CLCs. In a single GO sheet, all the atoms involved are covalently bonded, and thus the sheet has an extremely high Young's modulus (experimental value for the chemically converted graphene 0.25 TPa42). We estimate that the Young's modulus multiplies by the average area of GO sheets (‹w›=0.81±0.13 μm) to make the value of elastic modulus (K=1.6±0.5×10⁻⁴ N), about five orders of magnitude higher than that of self-assembled bilayers without any intermolecular covalent bonding in the conventional smectic phase39. By fitting the scattering profiles, we obtained the Callié exponents ηs of GO CLCs with gradient φs from 2.12 to 0.38%. Derived from the equations (1) and (2)39,40,41,
| 1 |
| 2 |
where kB is the Boltzmann constant (1.38×10²³ JK−1), B the compression modulus, T the thermodynamic temperature (298 degree Kelvin for our samples), ξ a correlation length for the fluctuation (for the distance longer than ξ, the layer height fluctuations are coherent from layer to layer, whereas for distance smaller than ξ, fluctuations are single layer and incoherent41), we further obtained the corresponding correlation lengths (ξs) of GO CLCs that range from 161.4±25.7 to 589.5±93.0 μm (detail fitting and quantitative analysis are given in Supplementary Note and Table S2). These calculated correlation lengths are giant, around four orders of magnitude longer than that in the conventional smectic phase of small molecules41, implying that there are little thermal fluctuation in GO CLCs. This effect is mainly attributed to the rigid, solid-like structure of individual GO sheet. The lamellar structures have also been observed previously in the suspensions of solid-like, single colloidal platelets with very little thermal fluctuation9,10. It is worth pointing out that more effort is needed to put on the specific theory model and computer simulation on LCs of 2D colloids, as the solid flakes have essentially different natures from the conventional bilayers noncovalently assembled from small molecules or lipids.
Importantly, we have detected that GO LCs begin to exhibit CD activity from φ>0.38%, and the optical activity is significantly enhanced with increasing φ. In the combination of CD inactivity in the filtrated GO films with uniform lamellar structure (Fig. 3a), we speculated that the observed optical activity originates from the twist dislocations of the lamellar structure in GO CLCs. To assess the major role of electrostatic repulsion in the formation of CLC, we have investigated both structures (by SAXS) and CD activities of GO dispersions with gradient salt concentrations. With enhancing the screening effect caused by the stronger ionic strength of higher salt concentration, the weakened repulsive interaction between the basal planes of GO sheets brought the stepwise compression of the lamellar structure (with decreasing interlayer spacing), and the weakened repulsive interaction between GO sheets boundaries induced the faded optical activity (Figs 2e and 3b). Therefore, the electrostatic interaction in GO CLCs is the dominate force and contributes to this new phase behaviour.
Owing to the similar POM textures between our GO CLC and TGB phase, we offered a twist-lamellar-block model to explain the natures of the CLC of 2D colloids, holding lamellar and helical structural attributes simultaneously (Fig. 5). Moreover, the fingerprint textures (Fig. 4g–i) and annual ring-like fracture structures (Fig. 4a–f) are in accordance with this model. Following with the first exposal of CLC for 2D colloids, more CLCs of 2D colloids (for example, clays) will be probably unveiled in the future, to enrich our understandings on colloidal LC regime, which will in turn boost the creation of new materials. In addition, this discovery also calls for the construction of theoretical model for CLC of 2D colloids.
It is known that one of the most important applications of lyotropic LCs is to make macroscopic fibres by wet-spinning technology. Up to date, linear, rigid polymers such as aromatic polyamides as well as 1D nanowires, such as CNTs, have been successfully spun into strong and continuous fibres from their LC dopes24,25,26, due to the noncovalent chemical bonds (for example, van der Waals forces and hydrogen bondings) and strong mechanical chain entanglements or interconnection among different tubes. Even though LCs of 2D colloids have been reported for several decades, however, macroscopic fibres made from neat 2D plates have never been achieved previously, partly because the interactions between solid-like flakes are weak, and partly because the solubility of colloids is not high enough for continuous spinning. We have demonstrated that highly soluble graphene sheets, a typical model of 2D colloids, can be readily spun into continuous and robust fibres from their LC dispersions. The sheet alignment inherited from the intrinsic lamellar order of LCs provides strong interactions between contacted sheets that are responsible for the strong mechanical strength of graphene fibres, and the locally crumbled structures of individual sheets make the graphene fibres flexible. The integration of high conductivity, excellent mechanical property and unique attributes associated with graphene makes the fibres highly attractive in many applications such as functional textiles and chemical sensors. The industrially viable wet-spinning technique provides a novel approach to fabrication of carbon fibres from natural graphite. In our near term, particularly promising applications of GO LCs as useful hosts are macroscopic graphene-based fibres with diversiform guests such as polymers, nanocrystals and CNTs; such new materials would be widely useful in the fields of high-performance fibres, energy storage and fuel cells. Inspired by the concept of continuous fibres made from graphene sheets, we believe that the possible LCs of other 2D colloids (such as montmorillonite4, metallic sheets43, MoS2, BN and other 2D nanosheets44) can be wet-spun into macroscopic fibres with unique properties for many promising applications.
Methods
Preparation of narrowly dispersed GO samples
GO sheets were prepared by the protocol described previously21. The isopycnic differential centrifugation was performed on the GO dispersion (φ=0.075%). After the centrifugation at 5,000 r.p.m. for 2 h, the bottom gel is the classified GO sample, and the supernatant was processed for the successive centrifugation. Through repeating process at respective speeds of 10,000 and 15,000 r.p.m. (23,300 g) for 2 h, we obtained two corresponding classified samples and took the sample (at 15,000 r.p.m.) with the smallest width for investigations in this study. GO dispersions (5 ml) were freeze-dried for 2 days and then further dried at room temperature under vacuum for 5 days and their mass fractions (fm) were obtained. The volume fraction (φ) is calculated by: φ≈fm/ρGO, where ρGO is the GO density that is estimated to be 1.32 g cm−3.
Silica-based chiral gel film
The silica-based chiral gel was prepared by cross-linking of tetraethyl orthosilicate under weak basic surrounding, using CLC of GO as the template. We introduced 1 ml tetraethyl orthosilicate into 2 ml methanol/water solution of GO (volmethonal:volwater=9:1, φ=0.38%), and stirred for 12 h to get a homogeneous solution. After injecting few drops of ammonia solution (pH=11) and stirring, the mixture was loaded into a circular disc with a diameter of 3 cm, and kept at room temperature for 24 h. Finally, we obtained the self-standing, silica-based gel film with CD activity.
Preparation of GO and graphene fibres
During the spinning process for GO fibres (Supplementary Fig. S9), the GO dispersions were loaded into glass syringes and injected into the NaOH/methanol solution under 1.5 MPa held by N2. The fibres in the coagulation bath were rolled onto the drum, washed by methanol to remove the salt and dried for 24 h under room temperature. The chemically converted graphene fibres were prepared by chemical reduction of as-prepared GO fibres in the aqueous solution of hydroiodic acid (40%) at 80 °C for 8 h, followed by washing with methanol and vacuum drying for 12 h.
Instruments
Atomic force microscopy images were taken in the tapping mode by carrying out on a NSK SPI3800, with samples prepared by spin-coating GO dispersions onto freshly cleaved mica substrates at 1000 r.p.m. SEM images were taken on a Hitachi S4800 field-emission SEM system. Cryo-SEM images were taken on a Hitachi S3000N equipped with a cryotransfer. The liquid sample was dropped into the cavity, loaded into liquid nitrogen, transferred into the cryotransfer and the sample was cut by a blade. The fracture was sublimed for 1 h before imaging. SAXS tests were carried out in the Shanghai Synchrotron Radiation Facility, using a fixed wavelength of 0.124 nm, a sample-to-detector distance of 5 m and an exposure time of 600 s. The 2D scattering patterns were collected on a charge coupled device camera, and the curve intensities versus q were obtained by integrating the data from the patterns. POM observations were performed with a Nikon E600POL and the liquid samples were loaded into the planar cells for observations. CD spectra were collected on a Bio-Logic MOS-450 spectrometer, and the samples were injected into the cell with a thickness of 0.5 cm. Confocal observations were performed on a Zeiss Lsm510 microscopy, using a 488-nm laser to excite with a filtrate around 560 nm. The measurement of zeta potential was performed on a Malvern ZET-3000HS apparatus. The conductivity of chemically reduced fibres was measured by two-probe resistivity-measuring instrument.
Author contributions
Z.X. and C.G. conceived and designed the research, analysed the experimental data and wrote the paper; Z.X. conducted the experiments; C.G. supervised and directed the project.
Additional information
How to cite this article: Xu, Z. & Gao, C. Graphene chiral liquid crystals and macroscopic assembled fibres. Nat. Commun. 2:571 doi: 10.1038/ncomms1583 (2011).
Supplementary Material
Supplementary Figures S1-S13, Supplementary Tables S1-S2 and Supplementary Note
Acknowledgments
We thank Professor S.F. Chen, Dr H.Q. Zhao, Dr Y.Z. Jin and Dr M. Hanif for the helpful discussions and the staffs in the Shanghai Synchrotron Radiation Facility for SAXS characterizations. This work is funded by the National Natural Science Foundation of China (20974093 and 51173162), National Key Basic Research Program of China (2007CB936004), Qianjiang Talent Foundation of Zhejiang Province (2010R10021), Fundamental Research Funds for the Central Universities (2009QNA4040), Research Fund for the Doctoral Program of Higher Education of China (20100101110049) and Zhejiang Provincial Natural Science Foundation of China (20100101110049).
References
- Strzelecka T. E., Davidson M. W. & Rill R. L. Multiple liquid crystal phases of DNA at high concentrations. Nature 331, 457–460 (1988). [DOI] [PubMed] [Google Scholar]
- Dogie Z. & Fraden S. Smectic phase in a colloidal suspension of semiflexible virus particles. Phys. Rev. Lett. 78, 2417–2420 (1997). [Google Scholar]
- Donkai N., Hoshino H., Kajiwara K. & Miyamoto T. Lyotropic mesophase of imogolite, 3 observation of liquid crystal structure by scanning electron and novel polarized optical microscopy. Die Makromolekulare Chemie 194, 559–580 (1993). [Google Scholar]
- Davidson P. & Gabriel J. C. P. Mineral liquid crystals. Curr. Opin. Colloid Interface Sci. 9, 377–383 (2004). [Google Scholar]
- Emerson W. H. Liquid crystals of montmorillonite. Nature 178, 1248–1249 (1956). [Google Scholar]
- Anderson V. J. & Lekkerkerker H. N. W. Insights into phase transition kinetics from colloid science. Nature 416, 811–815 (2002). [DOI] [PubMed] [Google Scholar]
- van der Kooij F. M., Kassapidou K. & Lekkerkerker H. N. W. Liquid crystal phase transitions in suspensions of polydisperse plate-like particles. Nature 406, 868–871 (2000). [DOI] [PubMed] [Google Scholar]
- Michot L. J. et al. Liquid-crystalline aqueous clay suspensions. Proc. Natl Acad. Sci. USA 103, 16101–16104 (2006). [DOI] [PMC free article] [PubMed] [Google Scholar]
- Gabriel J. C. P. et al. Swollen liquid-crystalline lamellar phase based on extended solid-like sheets. Nature 413, 504–508 (2001). [DOI] [PubMed] [Google Scholar]
- Sun D. Z., Sue H. J., Cheng Z. D., Martínez-Ratón Y. & Velasco E. Stable smectic phase in suspensions of polydisperse colloidal platelets with identical thickness. Phys. Rev. E 80, 041704 (2009). [DOI] [PubMed] [Google Scholar]
- Geim A. K. & Novoselov K. S. The rise of graphene. Nat. Mater. 6, 183–191 (2007). [DOI] [PubMed] [Google Scholar]
- Novoselov K. S. et al. Electric field effect in atomically thin carbon films. Science 306, 666–669 (2004). [DOI] [PubMed] [Google Scholar]
- Lee C. G., Wei X. D., Kysar J. W. & Hone J. Measurement of the elastic properties and intrinsic strength of monolayer graphene. Science 321, 385–388 (2008). [DOI] [PubMed] [Google Scholar]
- Balandin A. A. et al. Superior thermal conductivity of single-layer graphene. Nano Lett. 8, 902–907 (2008). [DOI] [PubMed] [Google Scholar]
- Rao C. N. R., Sood A. K., Subrahmanyam K. S. & Govindaraj A. Graphene: the new two-dimensional nanomaterial. Angew. Chem. Int. Ed. 48, 7752–7777 (2009). [DOI] [PubMed] [Google Scholar]
- Stankovich S. et al. Graphene-based composite materials. Nature 442, 282–286 (2006). [DOI] [PubMed] [Google Scholar]
- Xu Z. & Gao C. In situ polymerization approach to graphene-reinforced nylon-6 composites. Macromolecules 43, 6716–6723 (2010). [Google Scholar]
- Compton O. C. & Nguyen S. T. Graphene oxide, highly reduced graphene oxide, and graphene: versatile building blocks for carbon-based materials. Small 6, 711–723 (2010). [DOI] [PubMed] [Google Scholar]
- Dikin D. A. et al. Preparation and characterization of graphene oxide paper. Nature 448, 457–460 (2007). [DOI] [PubMed] [Google Scholar]
- Park S. & Ruoff R. S. Chemical methods for the production of graphene. Nat. Nanotechnol. 4, 217–224 (2009). [DOI] [PubMed] [Google Scholar]
- Xu Z. & Gao C. Aqueous liquid crystals of graphene oxide. ACS Nano 5, 2908–2915 (2011). [DOI] [PubMed] [Google Scholar]
- Kim J. E et al. Graphene oxide liquid crystals. Angew. Chem. Int. Ed. 50, 3043–3047 (2011). [DOI] [PubMed] [Google Scholar]
- Bates M. A. & Frenkel D. Nematic-isotropic transition in polydisperse systems of infinitely thin hard platelets. J. Chem. Phys. 10, 6553–6559 (1999). [Google Scholar]
- Song W. H., Kinloch I. A. & Windle A. H. Nematic liquid crystallinity of multiwall carbon nanotubes. Science 302, 1363 (2003). [DOI] [PubMed] [Google Scholar]
- Ericson L. M. et al. Macroscopic, neat, single-walled carbon nanotube fibres. Science 305, 1447–1450 (2004). [DOI] [PubMed] [Google Scholar]
- Davis V. A. et al. True solutions of single-walled carbon nanotubes for assembly into macroscopic materials. Nat. Nanotechnol. 4, 830–834 (2009). [DOI] [PubMed] [Google Scholar]
- de Gennes P. G. The Physics of Liquid Crystals Ch. 6 (Oxford Univiversity Press, 1974). [Google Scholar]
- Goodby J. W. et al. Characterization of a new helical smectic liquid crystal. Nature 337, 449–452 (1989). [Google Scholar]
- Saeva F. D. & Wysocki J. J. Induced circular dichroism in cholesteric liquid crystals. J. Am. Chem. Soc. 93, 5928–5929 (1971). [DOI] [PubMed] [Google Scholar]
- Saeva F. D., Sharpe P. E. & Olin G. R. Cholesteric liquid crystal induced circular dichroism (LCICD). V. Some mechanistic aspects of LCICD. J. Am. Chem. Soc. 95, 7656–7659 (1973). [Google Scholar]
- Hikmet R. A. M. & Kemperman H. Electrically switchable mirrors and optical components made from liquid-crystal gels. Nature 392, 476–479 (1998). [Google Scholar]
- Fernsler J. et al. Giant-block twist grain boundary smectic phases. Proc. Natl Acad. Sci. USA 102, 14191–14196 (2005). [DOI] [PMC free article] [PubMed] [Google Scholar]
- Renn S. S. & Lubensky T. C. Abrikosov dislocation lattice in a model of the cholesteric-to-smectic-A transition. Phys. Rev. A 38, 2132–2147 (1988). [DOI] [PubMed] [Google Scholar]
- Che S. et al. Synthesis and characterization of mesoporous silica with chiral structure. Nature 429, 281–284 (2004). [DOI] [PubMed] [Google Scholar]
- Pei S. F., Zhao J. P., Du J. H., Ren W. C. & Cheng H. M. Direct reduction of graphene oxide films into highly conductive and flexible graphene films by hydrohalic acids. Carbon 48, 4466–4474 (2010). [Google Scholar]
- Chen H. Q., Müller M. B., Gilmore K. J., Wallace G. G. & Li D. Mechanically strong, electrically conductive, and biocompatible graphene paper. Adv. Mater. 20, 3557–3561 (2008). [Google Scholar]
- Ruzicka B. et al. Observation of empty liquids and equilibrium gels in a colloidal clay. Nat. Mater. 10, 56–60 (2011). [DOI] [PubMed] [Google Scholar]
- van den Pol E., Petukhov A. V., Thies-Weesie D. M. E., Byelov D. V. & Vroege G. J. Experimental realization of biaxial liquid crystal phases in colloidal dispersions of boardlike particles. Phys. Rev. Lett. 103, 258301 (2009). [DOI] [PubMed] [Google Scholar]
- Als-Nielsen J. et al. Observation of algebraic decay of positional order in a smectic liquid crystal. Phys. Rev. B 22, 312–320 (1980). [Google Scholar]
- Safinya C. R. et al. Steric interactions in a model multimembrane system : a synchrotron X-ray study. Phys. Rev. Lett. 57, 2718–2721 (1986). [DOI] [PubMed] [Google Scholar]
- Lei N., Safinya C. R. & Bruinsma R. F. Discrete harmonic model for stacked membranes: theory and experiment. J. Phys. II France 5, 1155–1163 (1995). [Google Scholar]
- Gómez-Navarro C., Burghard M. & Kern K. Elastic properties of chemically derived single graphene sheets. Nano Lett. 8, 2045–2049 (2008). [DOI] [PubMed] [Google Scholar]
- Huang X. et al. Synthesis of hexagonal close-packed gold nanostructures. Nat. Commun. 2, 292 (2011). [DOI] [PubMed] [Google Scholar]
- Coleman J. N et al. Two-dimensional nanosheets produced by liquid exfoliation of layered materials. Science 331, 568–571 (2011). [DOI] [PubMed] [Google Scholar]
Associated Data
This section collects any data citations, data availability statements, or supplementary materials included in this article.
Supplementary Materials
Supplementary Figures S1-S13, Supplementary Tables S1-S2 and Supplementary Note


