

Abstract
Nanopore translocation experiments are increasingly applied to probe the secondary structures of RNA and DNA molecules. Here, we report two vital steps toward establishing nanopore translocation as a tool for the systematic and quantitative analysis of polynucleotide folding: 1), Using α-hemolysin pores and a diverse set of different DNA hairpins, we demonstrate that backward nanopore force spectroscopy is particularly well suited for quantitative analysis. In contrast to forward translocation from the vestibule side of the pore, backward translocation times do not appear to be significantly affected by pore-DNA interactions. 2), We develop and verify experimentally a versatile mesoscopic theoretical framework for the quantitative analysis of translocation experiments with structured polynucleotides. The underlying model is based on sequence-dependent free energy landscapes constructed using the known thermodynamic parameters for polynucleotide basepairing. This approach limits the adjustable parameters to a small set of sequence-independent parameters. After parameter calibration, the theoretical model predicts the translocation dynamics of new sequences. These predictions can be leveraged to generate a baseline expectation even for more complicated structures where the assumptions underlying the one-dimensional free energy landscape may no longer be satisfied. Taken together, backward translocation through α-hemolysin pores combined with mesoscopic theoretical modeling is a promising approach for label-free single-molecule analysis of DNA and RNA folding.
Introduction
Although early experiments studying the translocation of DNA or RNA molecules through narrow pores were primarily motivated by the prospect of single-molecule sequencing (1, 2), translocation experiments now appear increasingly promising as assays for intra- and intermolecular basepairing (3, 4, 5, 6, 7, 8, 9, 10, 11, 12, 13). So far, the best-characterized nanopore system remains the α-hemolysin ion channel (1, 14, 15, 16), with a pore diameter (∼1.5 nm) that allows single- but not double-stranded DNA to pass. Hence, the translocation of polynucleotides with intra- or intermolecular basepairs is coupled to the disruption of their secondary structure, and potentially to the reformation of such structure on the other side of the pore. The process is driven by an applied voltage bias across the pore, which acts on the negatively charged polynucleotide backbone. The voltage also drives an ionic current that is significantly reduced when a polynucleotide is inserted into the pore. This signature of translocation in the ionic current can be measured with high sensitivity and time resolution using a patch-clamp setup.
A number of recent experiments showed that hairpin structures as well as longer double-stranded DNA molecules have translocation behaviors that are qualitatively consistent with theoretical expectations. In addition, quantitative estimates of energetic translocation barriers were extracted by fitting the data to generic theoretical expressions based on Kramers theory (3, 4, 5, 6). However, because the thermodynamic free energy rules for DNA and RNA basepairing are well known and even simple secondary structures can be accurately predicted, the incorporation of this knowledge should, in principle, significantly increase the information that can be obtained from translocation experiments. If the translocation dynamics of simple structured sequences could be predicted, this quantitative description could serve as a framework for the interpretation of experiments with more complex polynucleotides. Such a framework is needed to develop nanopore force spectroscopy into a full-fledged single-molecule tool for label-free analysis of RNA or DNA folding.
So far, however, a quantitative match between experiment and a predictive model was not possible. Our own previous effort (12) indicated that additional complications, such as interactions between the pore and the polynucleotides, significantly affect the measurements in a way that appears difficult to predict. Here, we do not investigate these complications, but instead seek to minimize their effect with the help of an altered experimental design. The α-hemolysin pore is intrinsically asymmetric and the standard approach is to thread the molecules into the pore from the side of the vestibule (see Fig. 1), which effectively acts as a funnel, greatly increasing the rate at which molecules are captured. However, the downside of this approach is that interactions between folded polynucleotides and the pore are likely stronger on the vestibule side. To unfold molecules in the backward direction while retaining the advantage of a high capture rate, we chose an experimental design that allows us to thread the molecules from the vestibule side, translocate the structure to be probed, let it refold on the other side, and then measure the dynamics of backward translocation (see Fig. 1). We apply this approach to probe various DNA hairpin structures with a wide range of stabilities.
Figure 1.
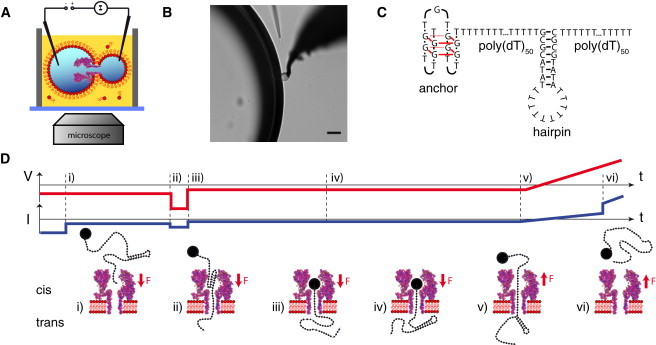
(A) Schematic depiction of the experimental setup. A single α-hemolysin pore resides in a lipid bilayer formed between two electrically contacted aqueous droplets within a lipid-oil bath. (B) The two droplets observed through a microscope (scalebar: 50 μm). (C) The hairpin of interest is connected to a stable anchor via a poly(T) sequence and extended with a second poly(T) tail on the other side acting as a capture sequence. (D) Voltage protocol used for the experiments. (i) First, a constant voltage is applied for several hundreds of milliseconds in which DNA is captured in most of the cases. (ii and iii) Then a high voltage pulse is applied to open the hairpin, regardless of whether the hairpin was already opened before. (iv) The DNA is then held in the pore at low voltage to allow reformation of the hairpin on the trans side. Finally, a voltage ramp is started (v) and the unzipping of the hairpin is observed as a sudden jump in pore current (vi).
For the quantitative analysis of this and future data, we devise a theoretical framework, which is schematically depicted in Fig. 3. It is based on the construction of sequence-dependent one-dimensional free energy landscapes, which are calculated using the thermodynamic free energy rules for RNA or DNA. The framework generalizes our previous model (17) and can be applied to a wide range of experimental situations. Conceptually, this mesoscopic description is on an intermediate level between more detailed simulations of the coupled folding and translocation dynamics (18, 19, 20) and more coarse-grained expressions for the thermally activated escape from a single potential well (6, 21). We believe this level of description is particularly well suited for the systematic quantitative analysis of polynucleotide translocation. It permits the exact calculation of experimental observables, based on the analytical first-passage time formalism, and it has few adjustable parameters, which can be inferred experimentally, as we demonstrate with our data. Specifically, we show that the framework can describe translocation experiments with 12 different sequences, ranging from completely unstructured to tightly folded, using a single set of parameters.
Figure 3.
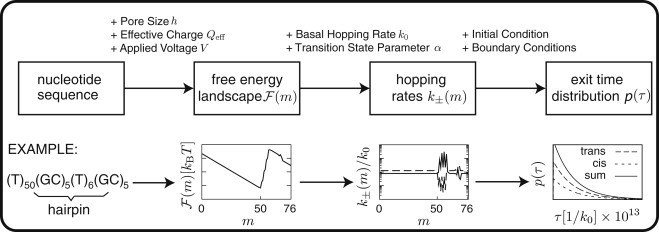
A schematic illustration of the theoretical framework that shows the general logic (top) as well as representative plots for an exemplary DNA (bottom). The starting point is the nucleotide sequence, from which a free energy landscape (m) is computed that incorporates basepairing and the effect of the applied voltage. Assuming detailed balance, the landscape leads to the hopping rates k±(m) once the sequence-independent basal hopping rate k0 and the asymmetry (or microscopic transition state) parameter α are fixed. These mesoscopic rates define the Master equation from which the experimental observables can be calculated (the full distribution of exit times is calculated numerically, whereas its mean, variance, and higher moments can be calculated analytically). The additional information entering each step of the flow-chart is indicated above the arrows. Typical results for a hairpin-structured polynucleotide at the bottom. At an intermediate voltage, the free energy landscape displays a minimum in front of the energy barrier for unfolding. The exponential decay of the exit time distributions is characteristic for such thermally assisted barrier crossings.
The Results section first describes the theoretical framework, with its underlying assumptions and the individual steps of the scheme in Fig. 3. We then present our experimental data and apply the framework for its analysis. All experimental and theoretical details are referred to Materials and Methods and the accompanying Supporting Material.
Materials and Methods
Experimental methods
The experimental setup was previously described in detail in Renner et al. (22). In brief, using voltage pulses (23) a single α-hemolysin pore was incorporated into an interface bilayer between two aqueous droplets attached to Ag/AgCl electrodes in a lipid-containing hexadecane bath (10 mg/ml DPhPC from Avanti Polar Lipids, Alabaster, AL), as shown in Fig. 1, A and B. As electrolyte, a solution containing 1 M KCl, 2 mM EDTA, and 20 mM Tris with pH = 8.0 was used and the temperature was set to 23°C. Oligonucleotides were purchased from biomers.net (see the Supporting Material for sequences).
To minimize geometrical and interaction effects due to the vestibule of α-hemolysin (24), all hairpins were unzipped in backward direction—i.e., the DNA was pulled from the trans to the cis side of the membrane, and the hairpins were unzipped on the trans side. Because the capture rate (frequency of translocation initiation) is much lower for backward than for forward translocations (25), an anchor technique was used: DNA was initially captured from the cis side, held in the pore, and then pulled back from the trans side. To prevent complete translocation during capture, the DNA molecules under study were extended at one end with a stable secondary structural motif acting as an anchor. Thus, the DNA strands studied contained four functionally distinct sections as depicted in Fig. 1 C: the anchor sequence was separated from the hairpin of interest by a poly(T) region, and the hairpin was followed by a second poly(T) tail for initial capture in the pore.
As shown in Fig. 1 D, during an experiment a constant voltage of mV was applied for several hundreds of milliseconds that pulled the DNA into the pore from the cis side. Then a short voltage pulse (e.g., mV; 20 ms) was applied to unzip the hairpin and further force the DNA to the trans side until the anchor stopped the translocation. Then the voltage was set to mV for a couple of milliseconds to allow reformation of the hairpin on the trans side. Finally, the voltage was ramped linearly to positive voltages until DNA escape (and hence, unzipping of the hairpin) was recorded. With this technique, (backward) unzipping events were observed in >50% of the experiments.
In contrast to our previous study (22), with the anchor approach a sophisticated low-noise setup is not required for the measurements, as it is not necessary to initially detect DNA capture in the nanopore with a fast-reacting feedback circuit. Furthermore, in voltage-ramp experiments the usual waiting times for translocations are >10 times longer than for typical constant voltage experiments.
Previously, Nakane et al. (26) used an avidin anchor bound to biotinylated DNA for nanopore translocation studies. By contrast, in our experiments we simply utilize stable DNA secondary structures that do not require any chemical modification of the oligonucleotides under study. The main requirement then is that the anchor sequence be more stable than the hairpin of interest, because the hairpin has to be unzipped while the anchor must prevent complete translocation. For most experiments, a G-quadruplex structure was used as an anchor, which, in the presence of potassium ions, is much more stable than the hairpins studied (22). However, a quadruplex can be trapped inside the vestibule of the pore (27), and consequently a potential of +25 to +50 mV is required to force it out of the pore again, i.e., back toward the cis side (see Fig. S1 in the Supporting Material). As this potential is already above the unzipping voltages of the weakest hairpins studied here, in these cases the G-quadruplex anchor was replaced by a stable DNA hairpin containing 12 consecutive GC basepairs. Hairpins already escape out of the cis side of the pore at membrane voltages <+5 mV (see Fig. S1).
First-passage formalism
This section provides the mathematical tools for our theoretical framework. Within our model, the probability P(n,t|m,t') to find a polynucleotide after a time t with n nucleotides on the trans side, given that it started at time t' with m nucleotides on the trans side, satisfies the backward Master equation (28, 29)
| (1) |
The dynamics are specified by the hopping rates k+(m) and k−(m) to move one base forward or backward through the pore, respectively. We assume an initial condition where the molecule is already partially inserted into the pore, and write the probability P(n,t|m,t') = P(n,τ|m) in terms of the elapsed time τ = t – t'. Because the exit can generally occur to both sides of the pore, there exist two exit time distributions, for cis exit to n = 0 and for trans exit to n = N. Hence, the probabilities P(0,τ|m) and P(N,τ|m) contain all polymers that have left the pore until a given time τ to the cis and trans side, respectively. The derivative of these cumulative functions defines the cis and trans exit time distributions,
| (2) |
which are easily obtained for any set of hopping rates k±(m) by means of numerical integration of Eq. 1. Other relevant observables can be obtained analytically starting from Eq. 1, by applying the first-passage time formalism (28, 29). The most elementary observable is the total probability wtrans(m) to ultimately exit to the trans side, and thus to successfully translocate from a given initial position m. It is defined as the integral over the exit time probability distribution,
| (3) |
where we omit the trans index on w and p, because this relation can equally be applied to the case of cis exit (from now on, all index-free observables in equations can either be chosen to apply to cis or to trans). Using (1), (3), one obtains
| (4) |
Although the same equation governs wtrans(m) and wcis(m), the respective boundary conditions differ, resulting in separate solutions that satisfy probability conservation, wcis + wtrans = 1. For the trans case, wtrans(0) = 0 and wtrans(N) = 1, because the polynucleotide will never reach the trans side if initially positioned at m = 0, whereas it has already translocated when m = N initially (the reverse holds for the cis case). The recursive Eq. 4 is then solved to
| (5) |
while wcis(m) = 1 – wtrans(m). The ultimate exit probabilities w(m) can be considered as the 0th moments of the exit time distributions. The higher moments
| (6) |
with n ≥ 1 are calculated using similar recursion schemes. The most important case is that of the first moment, the mean exit time. For the trans side, 〈τtrans〉(N) = 0, because molecules starting at m = N have already arrived. However, there is no corresponding mean first-passage time from m = 0, because these molecules will never reach the trans side. One therefore considers a combined quantity, the product of the ultimate exit probability and the mean exit time,
| (7) |
such that ϑ(0) = 0 and ϑ(N) = 0 for both cis and trans, because either the exit probability or the mean exit time vanishes at the boundary. The recursion relation
| (8) |
then yields the mean exit time to either side,
| (9) |
Here, wtrans explicitly enters the equation, due to the choice of the summation in the second term (summation from N − 1 to m would yield a factor wcis, and the equation could be made symmetric by taking the mean of the two expressions).
The calculation can be generalized to higher moments 〈τn〉 of the exit time distribution. Defining ϑn(m) = w(m) 〈τn〉 (m), the governing equation is
| (10) |
which yields a recursive exact solution for the moments,
| (11) |
Given a set of hopping rates k+(j), k−(j), all desired observables of the translocation model can thus be calculated.
All equations above assume a constant applied voltage. Nanopore force spectroscopy experiments instead use a constant rate of voltage loading and record the distribution of rupture voltages p(V|) at this given rate. If the translocation process remains adiabatic, this protocol yields the same information and the rupture voltage distribution can be transformed into the voltage-dependent mean translocation time 〈τ〉(V) that would be measured in constant voltage experiments (21, 30, 31),
| (12) |
Because the resulting translocation time should be independent of the loading rate , data recorded at different loading rates have to collapse onto a single master curve. Lack of agreement therefore indicates a breakdown of the adiabatic assumption.
Folding free energies
For the construction of the free energy landscapes the folding free energies fold(m) need to be computed. In the main text, two limiting conditions are considered—frozen secondary structure and the adiabatic limit. Both are computed using the Vienna RNA package (32), available at http://rna.tbi.univie.ac.at/. The DNA energy parameters (33) are available in dna.par on the same webpage. For all numerical calculations in this work we assume room temperature T = 25°. Included in the Vienna RNA package are the functions fold and pf_fold, which derive the minimal free energy and partition function of a given sequence, respectively. In the frozen limit, fold(m) = ΔG0(m + h + 1, N) is calculated with the function fold. First the structure and minimal free energy ΔG0(1, N) of the sequence is computed and then ΔG0(m + h + 1, N) is determined by removing basepairs from the minimum free energy structure. In the adiabatic limit, fold(m) = ΔG(m + h + 1, N) + ΔG (1,m) is obtained by applying the function pf_fold to the two subsequences from 1 to m and m + h to N.
Results
Mesoscopic description of the translocation process
The translocation process has a natural reaction coordinate, the number m of translocated bases, which changes stochastically in discrete steps until m = N, when a polynucleotide of N monomers has completely translocated (see Fig. 2). Let us briefly consider these dynamics from a general theoretical point of view. Given the reaction coordinate m, the stochastic translocation process is described by a Master equation for the time-dependent probability distribution P(m,t). This Master equation has the general form
with a transition rate matrix (t) ≡ [,t] that depends explicitly on time via the voltage protocol, as well as implicitly via the polymer conformation and the secondary structure of the polynucleotide, both of which involve many degrees of freedom and dynamics that are intricately coupled. Therefore, even though the reaction coordinate m is always well defined, it is useful only under conditions where the transition rates can be approximated by an appropriate average over polymer conformations and secondary structures that are accessible at a given value of m. Under such conditions, one obtains a coarse-grained description of the translocation dynamics, with m as the single degree of freedom and an effective free energy landscape (m) that constrains the dynamics of m. A description on this level is the basis for our theoretical framework.
Figure 2.
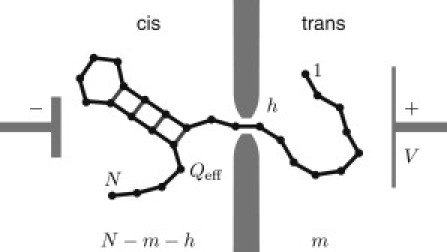
Sketch of a polynucleotide of N bases, with a hairpin structure translocating through a nanopore from cis to trans driven by an applied voltage V acting on the effective charge Qeff per monomer (not to scale). The position of the molecule is labeled by the number of monomers, m, on the trans side, whereas N – m – h bases remain on the cis side and h bases are confined in the pore.
Such a reduced description is clearly not generally valid. Even for a homopolymer that forms no structure the timescales of the conformational dynamics (t) span a wide range and generally are not separated from the timescale of the translocation dynamics m(t) (34). However, when the molecular friction between the pore and the polymer is significant and the polymer is not too long, (t) has a faster dynamics than m(t) and an adiabatic approximation is possible. For the α-hemolysin pore this approximation is valid for polynucleotides of up to several hundred bases (15).
Structured polynucleotides have an additional set of timescales associated with the (t) dynamics, and rearrangements in the secondary structures of large RNA molecules can be as slow as minutes and even hours (35, 36). Because translocation can never be faster than the timescale for the opening of the individual hairpins that make up the structure, there are two limiting cases with a well-defined free energy landscape: i), a frozen secondary structure, where the given structure is simply unzipped without any structural rearrangements during the translocation process; and ii), a fluid structure that reequilibrates after each change in m. For cases where neither limit is a good approximation, one limit is likely at least a useful reference point for the identification of structural transitions or other interesting properties that are not accounted for in the one-dimensional description (18).
Construction of the free energy landscape
The first step in the scheme of Fig. 3 is the construction of the sequence-dependent free energy landscape (m). We write this landscape in the general form
| (13) |
The first term arises from the applied voltage V, which primarily drops across the pore. The voltage is negative for a bias from cis to trans and positive for a reversed bias (see Fig. 1). An increment of the coordinate m by one effectively amounts to the transport of one base across the pore and changes the free energy by VQeff. Here, Qeff denotes a global effective charge parameter. In other words, we take a mean-field approach of replacing the possibly sequence-dependent microscopic effective charge by a single global value, to keep the number of adjustable parameters to a minimum. Also, we consider only the case of constant voltage in our free energy landscape. For comparison to dynamic voltage data, we apply Eq. 12 to transform from a constant voltage to a constant loading rate.
The second term arises from the reduction in the number of available backbone conformations of the polymer due to constriction by the pore. This entropic penalty depends only logarithmically on m,
| (14) |
and has a weak amplitude γ < 1, which corresponds to the scaling exponent associated with the statistics of random polymer configurations, where one polymer end is attached to an impenetrable plane; see Chuang et al. (34) and references therein. This form holds for an unfolded polymer chain, where the folding free energy fold(m) vanishes, such that conf(m) is the only nonlinear term in the total free energy (m). Even then the conformational contribution is negligible, because it does not change the drift-diffusive translocation behavior (34). We note that a free energy contribution of the form of Eq. 14 but with γ > 1 does indeed qualitatively affect the adiabatic translocation behavior of long chains (37). In the case of interest here, however, the conformational contribution is always negligible compared to fold(m).
In constructing the free energy landscape, the focus is therefore on the folding free energy. The thermodynamic free energy parameters for secondary structure formation of DNA (33) and RNA (38) are well characterized. Using these parameters, we can calculate free energy landscapes for the two limits discussed above, i.e., frozen and fluid structures. In addition, one can take into account different experimental situations. For instance, whereas opening of the structure is always required for translocation, refolding on the other side may be too slow or even be prevented by different buffer conditions.
Another situation arises when an additional mechanical force is applied to one end of the polynucleotide (39). We consider these different cases in turn. Note, however, that in all cases the theoretical free energy landscapes should be considered as trial landscapes, which do not take into account possible interesting complications, e.g., due to tertiary structure, pore-DNA interactions, and multiscale folding kinetics. The purpose of the calculated landscape is to set a baseline for comparison that helps identify such additional effects in experiments.
The simplest situation is the unzipping of a frozen structure by electrostatic forcing through the pore, assuming that refolding on the other side of the pore either does not occur or has a negligible effect (as for a single short hairpin). In this case,
| (15) |
where h denotes the depth of the pore, i.e., the number of bases inside the pore that are neither available for basepairing on the cis nor the trans side (see Fig. 2). For the α-hemolysin pore, we estimated h to be eight bases. The function ΔG0(n,N) denotes the DNA or RNA folding free energy that is obtained by first computing the minimum free energy structure of the given sequence, removing all basepairs in this structure that involve any of the bases 1 to n − 1, and then computing the free energy of the remaining structure. In other words, it is the folding free energy that remains after the first n bases of the frozen structure have disappeared into the pore. Here, we tacitly assumed that the initial structure before translocation is identical to the minimum free energy structure. Under certain circumstances other structures can be more appropriate, for instance if larger RNA molecules would be cotranscriptionally folded before translocation, such that they are kinetically locked in a structure that can be distinct from the minimum free energy structure (40). In any case, ΔG0(n,N) can be easily calculated using the Vienna RNA package ((32), and see Materials and Methods).
The other extreme is the adiabatic limit with completely fluid structures on both the cis and the trans side, which reequilibrates after each translocation step. In this limit, the free energy landscape takes the form
| (16) |
where ΔG(n,m) = −kBT ln Z(n,m) denotes the total folding free energy for the sequence segment from base n to base m, i.e., the free energy associated with the partition sum
over all possible secondary structures with corresponding energies . This limit is appropriate only for small structures with rapid basepairing dynamics.
How should refolding be incorporated in the free energy landscape, if translocation is faster than the equilibration of the secondary structure on the trans side, i.e., the adiabatic limit of Eq. 16 is not appropriate? This situation is similar to cotranscriptional folding, where the structure forms as the sequence gets longer. An appropriate refolding contribution to the free energy landscape is obtained by constrained folding (32): Initially, the minimum free energy structure is calculated for the first few bases that reach the trans side. Then, the basepairs of this structure are taken into account as constraints for the free energy minimization with the next base included. One by one, bases are added, whereas the previously formed structure is retained as constraint.
Another interesting situation arises by hybridizing short oligonucleotides to a longer RNA molecule at specific locations to probe its structure before translocation. These oligonucleotides will be stripped from the RNA during the translocation process and can lead to characteristic signatures in the dynamics. The expected signatures can be calculated with a free energy landscape based on simultaneous optimization of intra- and intermolecular basepairs. The experimentally obtainable information from translocation experiments is further increased if a mechanical force is used to pull the molecule through the pore (39), such that force-distance curves can be recorded. In contrast to experiments where molecules are unfolded by pulling on the ends, a combined nanopore-tweezer approach probes unfolding forces locally inside the molecule and could be used to reconstruct the entire secondary structure (17). A mechanical force can be taken into account by adding a term of the form
| (17) |
to Eq. 13, where FJC+spring(x,m) denotes a combination of the free energy of a freely jointed chain model for the exterior backbone of the polynucleotide on the pulling side, with end-to-end distance x that is increased with a constant velocity v, and a harmonic potential for the optical trap (17).
In all cases, the constructed trial free energy landscape depends only on a small number of sequence-independent adjustable parameters, because all sequence-dependence is contained in the fixed thermodynamic parameters for DNA or RNA folding. In our case, these parameters are the depth of the pore, h, the effective charge per nucleotide, Qeff, and the applied voltage bias, V.
Construction of the hopping rates
The second step of the scheme in Fig. 3 defines the dynamics on the free energy landscape. The stochastic motion in the landscape (m) is determined by position-dependent hopping rates, k+(m) and k−(m), respectively, for the increase and decrease of our reaction coordinate, which amounts to forward or backward motion of the nucleotide chain through the pore with a step-size of one monomer. Because translocation is a passive process, driven only by an external potential, the detailed balance condition
| (18) |
must be satisfied. Because there are only half as many conditions from Eq. 18 as kinetic rate constants, additional knowledge or assumptions are needed to fully define the dynamics. A plausible form of the rates that satisfies Eq. 18 is
| (19) |
where we introduced the free energy differences Δ(m) = [(m) – (m – 1)]/kBT. Here, k0 is the basal hopping rate of a single unpaired nucleotide in the absence of any bias, which sets the overall timescale for translocation. Although k0 may be sequence-dependent on a microscopic level, we take the same mean-field approach as for the effective charge and treat it as a single global parameter. The asymmetry parameter α physically determines the relative position of the microscopic transition state for the translocation of a single nucleotide (0 ≤ α ≤ 1). For α = 0, only the backward rate depends on m, whereas for α = 1, only the forward rate is variable; α = 0.5 corresponds to the completely symmetric case where both forward and backward rates are equally affected by the free energy differences. In principle, α could also depend on m via the nucleotide sequence. However, α turns out to be a parameter of minor importance in all our applications of the model, and we restrict ourselves to the simplest case of a constant α.
From translocation experiments with unstructured single-stranded DNA in α-hemolysin pores, the basal hopping rate k0 can be estimated to be of ∼105 s–1 (16). A recent experiment (41) also succeeded to determine the asymmetry parameter, by applying a combination of constant and oscillating voltages to unstructured single-stranded DNA. They found α = 0.6 for DNA entering the vestibule of the α-hemolysin pore with the 5′ end first.
Calculation of experimental observables
The last step of the scheme in Fig. 3 is the calculation of the experimental observables. From a theoretical point of view, the translocation experiments pose a so-called first-passage problem, where the observable is the time τ needed to reach a specified final state or one of several final states. Typically, the polynucleotide can exit to either side of the pore, and thus we have two possible final states. The most complete solution of the problem therefore consists of the two exit time distributions ptrans(τ,m) and pcis(τ,m), where m denotes the initial state and the total weight in each distribution corresponds to the probability to exit to either end, i.e., the normalization condition is
Because the final states are fixed whereby the initial state is considered a parameter, it is convenient to base the treatment of this problem on the backward Master Eq. 1. Although the full distributions can easily be obtained by numerical integration, all moments 〈τn〉 of these distributions can also be obtained analytically, as described in Materials and Methods. The 0th moments correspond to the total exit probability to the cis and trans side (see Eq. 5). The primary observables are the first moments, i.e., the mean exit times (see Eq. 9).
We focus on the translocation dynamics after the initial threading process into the pore and ignore unsuccessful threading events (which do not lead to a discernible current drop experimentally). Hence, we consider initial conditions with the molecule already inserted into the pore. To increase the capture probability for structured polynucleotides, experiments typically add a leading homopolymeric stretch as threading strand (5). The natural initial condition m then corresponds to the state where the threading strand is fully inserted into the pore, but the folded structure is still intact. Finally, the appropriate boundary conditions for the backward Master Eq. 1 are also determined by the experimental setup. In most cases, the polynucleotides can exit the pore either to the cis or the trans side, such that both boundaries become absorbing, leading to the separate exit time distributions described above. When a stopper is attached to one end of the molecule, full translocation is prevented in one direction, leading to a reflective boundary condition. The general case of two absorbing boundaries is covered in Materials and Methods, whereas the case with one reflecting boundary is obtained by setting the exit probability to the absorbing side to unity.
Experimental results and analysis
We performed experiments with 11 DNA hairpins, widely differing in thermodynamic stability and sequence composition. As described in Materials and Methods, we measured the translocation times in backward direction using an anchor technique, to minimize the effect of pore-DNA interactions. We carried out nanopore force spectroscopy (4) at different voltage-ramp speeds, and used Eq. 12 to calculate the corresponding constant-voltage mean translocation times. The resulting data are shown in Fig. 4 (colored dots). Taken together, the converted experimental data span a translocation time range from 2 × 10⁻⁴ s to 0.3 s and a voltage range from <10 mV to >120 mV. We complemented this data set with data from Mathé et al. (42) and Muzard et al. (24) for unstructured single-stranded DNA (open triangles in Fig. 4).
Figure 4.
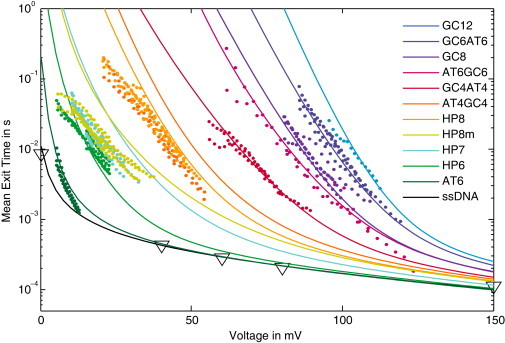
Experimental data and predictions of the theoretical framework for the voltage-dependent mean exit time τ(V) of 11 different hairpins and an unstructured single-stranded DNA (ssDNA). The stability of the hairpins is chosen to cover a broad range down to very weak structures that display translocation dynamics similar to the ssDNA. The theoretical curves all share the same values for our two global fit parameters, k0 = 1.1 × 10⁵ 1/s and Qeff = 0.82e. The shape of each curve is then determined only by the nucleotide sequence of the molecule, which fixes the folding free energy landscape. The ssDNA data are taken from Muzard et al. (24) and Mathé et al. (42).
The individual sequences of the 11-hairpin structures are listed in the Supporting Material. They share the general design
with a (T)50 linker region between the anchor and the hairpin, and another poly(T) sequence for threading. We labeled the sequences according to the content of their hairpin stem, e.g., GC12 contains the hairpin-forming sequence
Because repetitive sequences like GCGCGC have various alternative structures, we also tested a number of hairpins with nonrepetitive sequences, which are denoted by HP6-8 according to the length of their stem region. To further probe our thermodynamic free energy landscapes, we also constructed a hairpin HP8m that contains a mismatch within the stem region. The thermodynamic stabilities of the hairpins span a wide range from just 3.5 kBT for AT6 to 42.5 kBT for GC12 (we use the thermal energy scale kBT as a physical energy unit; at room temperature, 1 kcal/mol ≈ 1.6 kBT). We have two pairs of hairpins, which have approximately the same stability, AT6GC6 and GC6AT6 with 28 kBT, as well as AT4GC4 and GC4AT4 with a shorter stem and only a 16 kBT stability.
As explained in Materials and Methods, we used a G-quadruplex structure as anchor for the strong hairpins, whereas a strong hairpin served as anchor for the weaker hairpins. It is known that the G-quadruplex can be trapped inside the vestibule of the pore (27). To test whether this has an effect on our measurements, we used both types of anchors for the hairpin GC4AT4. The results, shown in Fig. S2, are mutually compatible. Because GC4AT4 is the weakest of our hairpins with G-quadruplex anchor, this indicates that none of our measurements is affected by quadruplex-pore interactions. This is consistent with the fact that the voltage required to eject the G-quadruplex out of the pore is <+50 mV (see Fig. S1), whereas our strong hairpins all required larger voltages to unzip.
Fig. 4 also shows the analytical results (lines) calculated using our theoretical framework developed above. For these calculations, we determined the free energy landscapes assuming the adiabatic limit of Eq. 16 with a pore depth of h = 8. Because the anchor is tightly bound and cannot be unzipped at the applied voltages, it simply acts like a reflecting boundary. Hence, we used Eq. 9 with wtrans = 1 for the calculation of the mean translocation time τ, where the hopping rates are obtained from Eq. 19 with the asymmetry parameter α = 0.6 as determined experimentally in Lathrop et al. (41). According to our experimental protocol, the voltage ramp is started after the molecule is inserted into the pore (such that the pore is in between the anchor and the hairpin structure to be probed) and some time for reequilibration of the structure has elapsed. Hence, we chose m = 50 as initial condition for our calculation of τ, which corresponds to the minimum of the free energy landscape in the presence of a voltage (see also Fig. 3). The result of our calculation is not sensitive to the precise value of the initial condition, because the translocation of the unstructured linker is rapid.
As a result, the only two parameters in our theoretical description that were not fixed experimentally are the basal translocation rate k0 and the effective charge Qeff. Importantly, these two parameters are taken to be global parameters that affect all curves. We adjusted their values using a least-squares fit simultaneously to the experimental data for the five most stable hairpins and the AT6 hairpin, where each hairpin received equal weight in the fit. Because k0 sets the overall timescale of the translocation process, changing k0 in Fig. 4 corresponds to a vertical shift, whereas the effective charge Qeff determines the response to the electrical voltage. Because we only used six data sets to determine the values of k0 and Qeff the remaining seven curves (corresponding to the last seven curves in the legend of Fig. 4) are predictions of the theoretical description. Taken together, the data are surprisingly well described with only two adjustable parameters.
It is remarkable, in particular, that the mean translocation time of the unstructured single-stranded DNA is perfectly described over the whole range of voltages from 0 to 150 mV (here, the theoretical curve is obtained with a flat free energy landscape, fold(m) = 0). Interestingly, this agreement is obtained only when the experimentally determined (41) microscopic asymmetry of α = 0.6 is incorporated (as opposed to the symmetric case, α = 0.5). For the intermediate-strength hairpins HP7, HP8m, HP8, and AT4GC4, clear deviations are apparent. However, important experimental features are correctly obtained by the theoretical description, such as the fact that two pairs of these sequences each yield almost identical 〈τ(V)〉 curves (HP7 and HP8m, HP8, and AT4GC4), as well as the absolute slopes of the curves.
The global best-fit values for our two parameters were k0 = 1.1 × 10⁵ s−1 and Qeff = 0.82e. These values are virtually independent of the precise length of the pore: We repeated the fit for h = 12 and obtained k0 = 1.2 × 10⁵ s−1 and Qeff = 0.81e. Although the basal hopping rate is consistent with literature values (16), the effective charge is significantly larger than previous estimates (3, 4, 12, 43). We note that our particular unzipping orientation in the backward direction of the pore with the 5′ DNA end first was previously found to display marked differences in the translocation behavior compared to the other orientations (24). This study did not determine effective charges, however. Because the effective charge for structured sequences must also account for the process of force transduction from electrical to mechanical unzipping force, it is likely that the different geometries for the different orientations will lead to different microscopic unzipping pathways and to different effective charges.
Another difference between our study and most other studies is the use of poly(T) single-stranded sequences instead of poly(A). We chose poly(T) to avoid the strong single-strand stacking in poly(A), which is not accounted for by the theoretical model. To test whether this choice does indeed affect our results, we designed another version of our GC4AT4 hairpin with poly(A) single-strands. As shown in Fig. S2, the overall translocation timescale of this sequence is very similar to its poly(T) counterpart; however, the poly(A) version displays a flatter voltage-dependence, which is characteristic for a smaller effective charge. This suggests that the choice of single-stranded sequence may indeed have a significant effect on the effective charge value. However, a more detailed study will be necessary to characterize the effect of the sequence content on the effective charge.
Designing experiments
The theoretical framework may also be useful during the design stage of experiments, e.g., to compare the size of systematic errors expected for different designs. One source for such systematic errors is the fact that the cis and trans exit from the pore cannot be distinguished experimentally in the usual setups, because only the blockage of the pore is observed. A typical strategy then is to introduce a cutoff in the distribution of blockage times, and to consider only blockage times longer than the cutoff as true translocation events. This procedure introduces false-positives, blockage events longer than the cutoff that were in fact only cis exits, as well as false-negatives, blockage events shorter than the cutoff that were in fact true translocation events (trans exits). Using the separate exit time distributions for cis and trans exit, one can determine the expected fraction of such false-positives and false-negatives. We demonstrate this and other applications in the Supporting Material.
Summary and Conclusion
Our main result is that the translocation dynamics of structured polynucleotides measured using backward nanopore force spectroscopy through α-hemolysin pores can be understood on a quantitative level. Fig. 4 shows a proof-of-principle for simple hairpin structures. An important goal for future work will be to explore how far this quantitative analysis can be extended to more complex and biologically interesting structures. We designed our theoretical framework with that goal in mind, and pointed out the simplicity with which it can be applied to various experimental situations. We believe that this mesoscopic description, which reduces the many degrees of freedom of the translocation process to a single reaction coordinate with an associated one-dimensional free energy landscape, is an appropriate starting point for the quantitative analysis.
The prior knowledge about the basepairing of a specific molecule under study is distilled into the free energy landscape, together with basic assumptions about the dynamics of the translocation process, e.g., whether the structure remains frozen during translocation or it constantly reequilibrates. Of course, we expect all versions of this description to fail, sooner or later, when the degree of complexity of the polynucleotides is increased. Such a failure will be informative, because it indicates that a nontrivial dynamic structural process occurs on the same timescale as the translocation process. The translocation dynamics will then have to be described using a model that allows for alternative pathways, in a network of states rather than just a one-dimensional set.
Acknowledgments
We thank U. F. Keyser for helpful comments.
We gratefully acknowledge financial support by the Deutsche Forschungsgemeinschaft through SFB 248 and SFB 863, the Cluster of Excellence “Nanoinitiative Munich”, and by the Bundesministerium für Bildung und Forschung (BMBF 13N10970). K.A. acknowledges funding by the “Studienstiftung des Deutschen Volkes”.
Editor: Hagan Bayley.
Footnotes
This is an Open Access article distributed under the terms of the Creative Commons-Attribution Noncommercial License (http://creativecommons.org/licenses/by-nc/2.0/), which permits unrestricted noncommercial use, distribution, and reproduction in any medium, provided the original work is properly cited.
Additional sections with eight equations and six figures are available at http://www.biophysj.org/biophysj/supplemental/S0006-3495(11)05362-8.
Supporting Material
References
- 1.Kasianowicz J.J., Brandin E., et al. Deamer D.W. Characterization of individual polynucleotide molecules using a membrane channel. Proc. Natl. Acad. Sci. USA. 1996;93:13770–13773. doi: 10.1073/pnas.93.24.13770. [DOI] [PMC free article] [PubMed] [Google Scholar]
- 2.Branton D., Deamer D.W., et al. Schloss J.A. The potential and challenges of nanopore sequencing. Nat. Biotechnol. 2008;26:1146–1153. doi: 10.1038/nbt.1495. [DOI] [PMC free article] [PubMed] [Google Scholar]
- 3.Sauer-Budge A.F., Nyamwanda J.A., et al. Branton D. Unzipping kinetics of double-stranded DNA in a nanopore. Phys. Rev. Lett. 2003;90:238101. doi: 10.1103/PhysRevLett.90.238101. [DOI] [PubMed] [Google Scholar]
- 4.Mathé J., Visram H., et al. Meller A. Nanopore unzipping of individual DNA hairpin molecules. Biophys. J. 2004;87:3205–3212. doi: 10.1529/biophysj.104.047274. [DOI] [PMC free article] [PubMed] [Google Scholar]
- 5.Mathé J., Arinstein A., et al. Meller A. Equilibrium and irreversible unzipping of DNA in a nanopore. Europhys. Lett. 2006;73:128–134. [Google Scholar]
- 6.Dudko O.K., Mathé J., et al. Hummer G. Extracting kinetics from single-molecule force spectroscopy: nanopore unzipping of DNA hairpins. Biophys. J. 2007;92:4188–4195. doi: 10.1529/biophysj.106.102855. [DOI] [PMC free article] [PubMed] [Google Scholar]
- 7.Tropini C., Marziali A. Multi-nanopore force spectroscopy for DNA analysis. Biophys. J. 2007;92:1632–1637. doi: 10.1529/biophysj.106.094060. [DOI] [PMC free article] [PubMed] [Google Scholar]
- 8.McNally B., Wanunu M., Meller A. Electromechanical unzipping of individual DNA molecules using synthetic sub-2 nm pores. Nano Lett. 2008;8:3418–3422. doi: 10.1021/nl802218f. [DOI] [PMC free article] [PubMed] [Google Scholar]
- 9.Zhao Q., Comer J., et al. Timp G. Stretching and unzipping nucleic acid hairpins using a synthetic nanopore. Nucleic Acids Res. 2008;36:1532–1541. doi: 10.1093/nar/gkm1017. [DOI] [PMC free article] [PubMed] [Google Scholar]
- 10.Viasnoff V., Chiaruttini N., Bockelmann U. Probing DNA base pairing energy profiles using a nanopore. Eur. Biophys. J. 2009;38:263–269. doi: 10.1007/s00249-008-0372-2. [DOI] [PubMed] [Google Scholar]
- 11.Comer J., Dimitrov V., et al. Aksimentiev A. Microscopic mechanics of hairpin DNA translocation through synthetic nanopores. Biophys. J. 2009;96:593–608. doi: 10.1016/j.bpj.2008.09.023. [DOI] [PMC free article] [PubMed] [Google Scholar]
- 12.Renner S., Bessonov A., et al. Simmel F.C. Sequence-dependent unfolding kinetics of DNA hairpins studied by nanopore force spectroscopy. J. Phys. Condens. Matter. 2010;22:454119. doi: 10.1088/0953-8984/22/45/454119. [DOI] [PubMed] [Google Scholar]
- 13.Derrington I.M., Butler T.Z., et al. Gundlach J.H. Nanopore DNA sequencing with MspA. Proc. Natl. Acad. Sci. USA. 2010;107:16060–16065. doi: 10.1073/pnas.1001831107. [DOI] [PMC free article] [PubMed] [Google Scholar]
- 14.Song L., Hobaugh M.R., et al. Gouaux J.E. Structure of staphylococcal α-hemolysin, a heptameric transmembrane pore. Science. 1996;274:1859–1866. doi: 10.1126/science.274.5294.1859. [DOI] [PubMed] [Google Scholar]
- 15.Lubensky D.K., Nelson D.R. Driven polymer translocation through a narrow pore. Biophys. J. 1999;77:1824–1838. doi: 10.1016/S0006-3495(99)77027-X. [DOI] [PMC free article] [PubMed] [Google Scholar]
- 16.Meller A., Nivon L., Branton D. Voltage-driven DNA translocations through a nanopore. Phys. Rev. Lett. 2001;86:3435–3438. doi: 10.1103/PhysRevLett.86.3435. [DOI] [PubMed] [Google Scholar]
- 17.Gerland U., Bundschuh R., Hwa T. Translocation of structured polynucleotides through nanopores. Phys. Biol. 2004;1:19–26. doi: 10.1088/1478-3967/1/1/002. [DOI] [PubMed] [Google Scholar]
- 18.Bundschuh R., Gerland U. Coupled dynamics of RNA folding and nanopore translocation. Phys. Rev. Lett. 2005;95:208104. doi: 10.1103/PhysRevLett.95.208104. [DOI] [PubMed] [Google Scholar]
- 19.Lakatos G., Chou T., et al. Patey G.N. First passage times of driven DNA hairpin unzipping. Phys. Biol. 2005;2:166–174. doi: 10.1088/1478-3975/2/3/004. [DOI] [PubMed] [Google Scholar]
- 20.Bockelmann U., Viasnoff V. Theoretical study of sequence-dependent nanopore unzipping of DNA. Biophys. J. 2008;94:2716–2724. doi: 10.1529/biophysj.107.111732. [DOI] [PMC free article] [PubMed] [Google Scholar]
- 21.Dudko O.K., Hummer G., Szabo A. Intrinsic rates and activation free energies from single-molecule pulling experiments. Phys. Rev. Lett. 2006;96:108101. doi: 10.1103/PhysRevLett.96.108101. [DOI] [PubMed] [Google Scholar]
- 22.Renner S., Geltinger S., Simmel F.C. Nanopore translocation and force spectroscopy experiments in microemulsion droplets. Small. 2010;6:190–194. doi: 10.1002/smll.200901435. [DOI] [PubMed] [Google Scholar]
- 23.Renner S., Bessonov A., Simmel F.C. Voltage-controlled insertion of single α-hemolysin and Mycobacterium smegmatis nanopores into lipid bilayer membranes. Appl. Phys. Lett. 2011;98:083701. [Google Scholar]
- 24.Muzard J., Martinho M., et al. Viasnoff V. DNA translocation and unzipping through a nanopore: some geometrical effects. Biophys. J. 2010;98:2170–2178. doi: 10.1016/j.bpj.2010.01.041. [DOI] [PMC free article] [PubMed] [Google Scholar]
- 25.Henrickson S.E., Misakian M., et al. Kasianowicz J.J. Driven DNA transport into an asymmetric nanometer-scale pore. Phys. Rev. Lett. 2000;85:3057–3060. doi: 10.1103/PhysRevLett.85.3057. [DOI] [PubMed] [Google Scholar]
- 26.Nakane J., Wiggin M., Marziali A. A nanosensor for transmembrane capture and identification of single nucleic acid molecules. Biophys. J. 2004;87:615–621. doi: 10.1529/biophysj.104.040212. [DOI] [PMC free article] [PubMed] [Google Scholar]
- 27.Shim J.W., Gu L.-Q. Encapsulating a single G-quadruplex aptamer in a protein nanocavity. J. Phys. Chem. B. 2008;112:8354–8360. doi: 10.1021/jp0775911. [DOI] [PMC free article] [PubMed] [Google Scholar]
- 28.Gardiner C.W. 3rd Ed. Springer; New York: 2003. Handbook of Stochastic Methods: For Physics, Chemistry and the Natural Sciences. [Google Scholar]
- 29.Redner S. 1st Ed. Cambridge University Press; Cambridge, MA: 2001. A Guide to First-Passage Processes. [Google Scholar]
- 30.Raible M., Evstigneev M., et al. Reimann P. Theoretical analysis of single-molecule force spectroscopy experiments: heterogeneity of chemical bonds. Biophys. J. 2006;90:3851–3864. doi: 10.1529/biophysj.105.077099. [DOI] [PMC free article] [PubMed] [Google Scholar]
- 31.Dudko O.K., Hummer G., Szabo A. Theory, analysis, and interpretation of single-molecule force spectroscopy experiments. Proc. Natl. Acad. Sci. USA. 2008;105:15755–15760. doi: 10.1073/pnas.0806085105. [DOI] [PMC free article] [PubMed] [Google Scholar]
- 32.Gruber A.R., Lorenz R., et al. Hofacker I.L. The Vienna RNA websuite. Nucleic Acids Res. 2008;36(Web Server issue):W70-W74. doi: 10.1093/nar/gkn188. [DOI] [PMC free article] [PubMed] [Google Scholar]
- 33.SantaLucia J., Jr. A unified view of polymer, dumbbell, and oligonucleotide DNA nearest-neighbor thermodynamics. Proc. Natl. Acad. Sci. USA. 1998;95:1460–1465. doi: 10.1073/pnas.95.4.1460. [DOI] [PMC free article] [PubMed] [Google Scholar]
- 34.Chuang J., Kantor Y., Kardar M. Anomalous dynamics of translocation. Phys. Rev. E Stat. Nonlin. Soft Matter Phys. 2002;65:011802. doi: 10.1103/PhysRevE.65.011802. [DOI] [PubMed] [Google Scholar]
- 35.Pan J., Woodson S.A. Folding intermediates of a self-splicing RNA: mispairing of the catalytic core. J. Mol. Biol. 1998;280:597–609. doi: 10.1006/jmbi.1998.1901. [DOI] [PubMed] [Google Scholar]
- 36.Zhuang X., Bartley L.E., et al. Chu S. A single-molecule study of RNA catalysis and folding. Science. 2000;288:2048–2051. doi: 10.1126/science.288.5473.2048. [DOI] [PubMed] [Google Scholar]
- 37.McCauley M., Forties R., et al. Bundschuh R. Anomalous scaling in nanopore translocation of structured heteropolymers. Phys. Biol. 2009;6:036006. doi: 10.1088/1478-3975/6/3/036006. [DOI] [PubMed] [Google Scholar]
- 38.Mathews D.H., Sabina J., et al. Turner D.H. Expanded sequence dependence of thermodynamic parameters improves prediction of RNA secondary structure. J. Mol. Biol. 1999;288:911–940. doi: 10.1006/jmbi.1999.2700. [DOI] [PubMed] [Google Scholar]
- 39.Keyser U.F., Koeleman B.N., et al. Dekker C. Direct force measurements on DNA in a solid-state nanopore. Nat. Phys. 2006;2:473–477. [Google Scholar]
- 40.Xayaphoummine A., Viasnoff V., et al. Isambert H. Encoding folding paths of RNA switches. Nucleic Acids Res. 2007;35:614–622. doi: 10.1093/nar/gkl1036. [DOI] [PMC free article] [PubMed] [Google Scholar]
- 41.Lathrop D.K., Ervin E.N., et al. Hibbs A.H. Monitoring the escape of DNA from a nanopore using an alternating current signal. J. Am. Chem. Soc. 2010;132:1878–1885. doi: 10.1021/ja906951g. [DOI] [PMC free article] [PubMed] [Google Scholar]
- 42.Mathé J., Aksimentiev A., et al. Meller A. Orientation discrimination of single-stranded DNA inside the α-hemolysin membrane channel. Proc. Natl. Acad. Sci. USA. 2005;102:12377–12382. doi: 10.1073/pnas.0502947102. [DOI] [PMC free article] [PubMed] [Google Scholar]
- 43.Zhang J., Shklovskii B.I. Effective charge and free energy of DNA inside an ion channel. Phys. Rev. E Stat. Nonlin. Soft Matter Phys. 2007;75:021906. doi: 10.1103/PhysRevE.75.021906. [DOI] [PubMed] [Google Scholar]
Associated Data
This section collects any data citations, data availability statements, or supplementary materials included in this article.