

Abstract
The metabolic machinery of marine microbes can be remarkably plastic, allowing organisms to persist under extreme nutrient limitation. With some exceptions, most theoretical approaches to nutrient uptake in phytoplankton are largely dominated by the classic Michaelis–Menten (MM) uptake functional form, whose constant parameters cannot account for the observed plasticity in the uptake apparatus. Following seminal ideas by earlier researchers, we propose a simple cell-level model based on a dynamic view of the uptake process whereby the cell can regulate the synthesis of uptake proteins in response to changes in both internal and external nutrient concentrations. In our flexible approach, the maximum uptake rate and nutrient affinity increase monotonically as the external nutrient concentration decreases. For low to medium nutrient availability, our model predicts uptake and growth rates larger than the classic MM counterparts, while matching the classic MM results for large nutrient concentrations. These results have important consequences for global coupled models of ocean circulation and biogeochemistry, which lack this regulatory mechanism and are thus likely to underestimate phytoplankton abundances and growth rates in oligotrophic regions of the ocean.
Keywords: nutrient-uptake kinetics, phenotypic plasticity, acclimation, uptake sites
Phytoplankton have the capacity to acclimate to changes in environmental conditions by altering their chemical composition in response to environmental variability. Two particularly dramatic examples are their ability to replace phospholipids with non-phosphorus membrane lipids in P-depleted environments (1), and the swapping of iron between nitrogen fixing and light harvesting during the diel cycle in the diazotroph Crocosphaera watsonii (2). Acclimation not only allows the organism to increase its growth rate in a changing, adverse environment but also to avoid possible damages due to an overexposure to the resource (3). Thus, those organisms able to take advantage of their physiological ranges in a more efficient way will make better use of the available resource and, eventually, will dominate its exploitation.
One important example of phytoplankton acclimation is their ability to adjust the uptake machinery in response to changes in nutrient availability. The physiological range for uptake-related traits constrains the capability of a given species to acclimate, thus playing a key role in determining the ecological niche and, ultimately, overall community composition. Because all phytoplankton species are able to regulate the number of uptake sites (proteins that incorporate the nutrient from the cell membrane into the cytoplasm) (4–7), taking into consideration the flexibility of the uptake apparatus should be an essential component in models of ocean biogeochemistry that aim to predict global distributions of microbial abundance and community structure, together with the distribution of key elements such as carbon, nitrogen, and phosphorus.
The classic way to represent phytoplankton uptake is based on the Michaelis–Menten (MM) functional form for the uptake rate (8), V = Vmax[S]/([S] + KS). Its dependence on nutrient concentration [S] is controlled by two parameters (the so-called kinetic parameters), which are considered constant traits of the population: the maximum uptake rate, Vmax; and the half-saturation constant, KS, which is related to the ability of an organism to capture nutrient ions at a low concentration of the nutrient S. Crucially, Vmax is related to the total number of uptake sites of the cell (see below). Therefore, treating Vmax as a constant prevents the classic MM formulation from accounting for acclimation, which can be identified in this case with the ability of the cell to adjust its kinetic parameters in response to environmental changes (9).
The problem of introducing dynamics into the phytoplankton uptake apparatus has a rich literature spanning over three decades. On one hand, there are models grounded in biochemical and regulatory details (see, for instance, ref. 10), whereas others focus on phenomenological relations that aim instead at simpler, effective models (11, 12). The middle ground includes approaches that attempt to reduce model complexity on the basis of physiological tradeoffs related to resource allocation strategies (7, 13–16) (for a complete up-to-date review on the subject, see ref. 17). A lack of a proper formulation for the dynamic regulation of the nutrient-uptake apparatus also entails the loss of other relevant physiological responses of the cell. For instance, it is well-documented that the cell requires some time (generally hours) to adjust its machinery to changes in the external nutrient concentration (18). This time lag is missing in the simple phenomenological descriptions mentioned above, as well as in any static expression for the uptake rate.
Other important details have to be taken into consideration to achieve a broader understanding of the process, covering not only the physiological but also the physical aspects of nutrient uptake. In that sense, the physical limitations that arise when nutrient concentration is reduced have been the focus of intense study (19–21). In this regime, nutrient uptake is faster than the diffusion of the ions to the cell (uptake limited by diffusion). Consequently, the organism develops a boundary layer surrounding its membrane where the local nutrient concentration, [S0], is lower than the bulk concentration, [S]. It is possible to find a diffusion limitation-corrected expression for the uptake rate by harmonizing the kinetic and physical aspects of the process as a whole (19, 21).
All these examples represent different ways to tackle the necessary corrections to the classic, static MM formulation. In this paper, we propose a general approach devised to address, together, all these important limitations of the static MM formulation. By using an expression for a diffusion limitation-corrected uptake rate, we introduce a simple model for the description of a dynamic, flexible-uptake process whereby the cell reacts to changes in nutrient concentration by regulating the number of uptake sites. We investigate how the kinetic parameters and, therefore, the population-level uptake rate, vary when considering individual-based dynamics. This provides mechanistic support for both the dependence of the number of uptake sites on [S] and the wide physiological ranges for uptake that have been reported in the literature. Furthermore, we quantify the ecological implications of our approach by studying how the growth rate and other observables are affected by the presence of the regulatory mechanism. To assess their importance, we use as a reference the static MM, used by the vast majority of models of ocean biogeochemistry.
Generalized Kinetic Framework
In the enzymatic analogy, commonly used to formalize nutrient uptake in phytoplankton, the role of enzymes is played by the uptake sites [or transporters (22)]. These are the points on the cell membrane where nutrient ions are captured from the surrounding medium and transported into the cytoplasm. The analogy assumes that the uptake sites [which are specific to each type of nutrient ion (23)], as the enzymes, are not consumed during the uptake process, and their concentrations are generally much smaller than that of the nutrient present in the medium. Thus, the derivation of the classic MM uptake rate considers a system composed of an enclosure containing a medium with nutrient ions, S, and (unoccupied) uptake sites, Ef, diffusing freely. The uptake process can then be described by means of the reaction
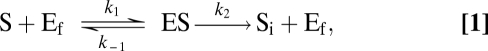 |
where ES is the enzyme–substrate compound and Si represents the nutrient incorporated by the transporter into the cell. The reaction scheme (1) describes a process in which nutrient ions hit an uptake site at a constant encounter rate k1; the site remains occupied until the enzyme–ion pair is completely dissociated inside the cytoplasm, which occurs at a constant rate k2. In the rebound process, an ion–transporter complex is dissociated outside the cell at a rate k–1. We will consider that this process occurs so rarely that its effects on the overall reaction are negligible.
Either by applying the Law of Mass Action to this reaction scheme (24) or using Holling's predator–prey approach for the description of the uptake process (25), it is possible to deduce an equation for the nutrient-uptake rate (SI Text):
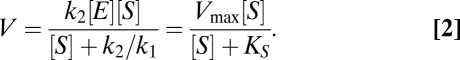 |
This is the Michaelis–Menten functional form (8), where Vmax = k2[E] (maximum uptake rate) and KS = k2/k1 (half-saturation constant) are the MM kinetic parameters, both considered constant traits of the population. [S] represents the external nutrient concentration, measured in units of mol/L, whereas [E] = [Ef] + [ES] is the (constant) total number of uptake sites, in mol per cell (Table S1).
The necessary diffusion-limitation correction to this expression (see above) is deduced from considering the more realistic situation where the transporters are not freely diffusing in the system but are instead attached to the cell membrane. If we treat the uptake sites of the cell as a system of immobilized enzymes (26), the cell can potentially develop a boundary layer surrounding the cell where the local nutrient concentration, [S0], can be smaller than the bulk concentration [S]. This is because of the difference in the fluxes owing to nutrient consumption by the organism and the diffusive transport of nutrient ions in the medium toward the cell (19). The relative difference between these two determines whether uptake is limited due to physical constraints imposed by nutrient diffusion (i.e., uptake rate faster than diffusion rate and, therefore, [S0] < [S]) or due to the performance of the uptake apparatus (porter or chemical limitation, [S0] = [S]) (19). Thus, now the organism and its surroundings form an open system, where a flow of nutrient ions ΦD (in mol per unit time) entrains the boundary layer due to diffusion from the bulk.
To complete the description of nutrient uptake as a flexible, dynamic process, we also introduce the ability of the cell to regulate the number of uptake sites by considering the “flow” of new uptake sites synthesized by the cell, ΦE (in mol per unit time). The resulting scheme, depicted in Fig. 1, provides a kinetic framework that combines the essential modifications to the classic, static MM made separately in the literature.
Fig. 1.

The uptake process as an open enzymatic reaction. ΦD represents the flow of nutrient ions arriving at the cell membrane. When one of the local nutrient ions, S0, encounters one of the free immobilized transporters, Ef, it is incorporated into the cytoplasm (Si). The number of uptake sites changes with time due to the “flow” of new produced transporters, ΦE.
The application of the Law of Mass Action to this scheme results in an alternative way to deduce the necessary MM-like functional form for the nutrient uptake where the effects of the potential diffusion limitation are considered (SI Text). By assuming stationary conditions and a spherical cell, we can write the incoming flow of ions as ΦD = 4πDrc([S] − [S0]), where D is the diffusion constant of the nutrient and rc is the cell radius (19), reaching an expression similar to that deduced in ref. 21,
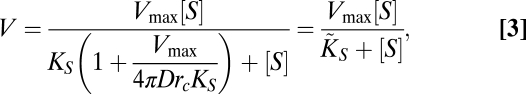 |
where [E] represents the total number of transporters in the cell, Vmax = k2[E], and KS = k2/k1 (see above). This generalized MM-like function, which in our case represents the uptake rate of a single cell, takes into account how the possible presence of a boundary layer formed around the cell modifies the uptake rate of the organism. This is basically encoded in the effective half-saturation constant,  . For cases where the organism is limited by diffusion (D or [S] very small), the uptake rate will be given by
This expression coincides with the pure diffusive flow of ions to the cell when it depletes completely the surrounding nutrient ([S0] = 0). As [S] or D is increased, Eq. 3 approaches Eq. 2 (and, therefore, the uptake is limited solely by the transport through the membrane, i.e., porter limitation), reaching eventually the limit V = Vmax (19).
We can also obtain a generalized form for the specific affinity of the cell. From its definition as the ratio of the kinetic parameters (27), the affinity aff is given, in this case, by
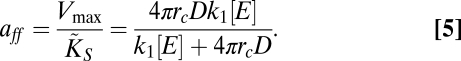 |
For the case of diffusion limitation, the specific affinity is reduced to aff = 4πDrc, whereas for porter limitation it is given by aff = k1[E].
Flexible Metabolic Framework
Concerning the remaining new term in Fig. 1, the combination of Eqs. S7 and S10 tells us that d[E]/dt = d[Ef]/dt + d[ES]/dt = ΦE. Therefore, the change in the total number of uptake sites of the cell is given by the flow ΦE of new synthesized sites. This ability of the cell to change [E] affects the otherwise static Vmax and  (see above), transforming the (static) uptake rate, Eq. 3, into a dynamic expression where the kinetic parameters depend on time.
This is the key ingredient of our approach: We allow the cell to acclimate in response to changes in the environmental conditions by introducing a simple formulation that accounts for the dynamics in the regulation of the number of uptake sites, detailed below. It needs to be complemented with a metabolic, cell-level framework that describes the dynamics in the carbon and nutrient budgets, as both play a key role in the regulation of the synthesis of transporter proteins (see below).
For this metabolic framework, we follow a standard approach, using a set of equations covering the essential physiological processes for each of the individuals in the population, plus an aggregated equation for the temporal change of the external nutrient concentration. Thus, for each individual cell, we write an equation describing the rate of change of the organic-carbon content, C, another for the internal amount of nutrient (for the sake of concreteness here we use nitrogen, N, but we could easily adapt the formulation to any other nutrient), and a third for the number of uptake sites n on the cell surface. Note that, to adapt the units of the metabolic framework variables to the standard choice used in this kind of model, the internal carbon and nutrient are measured in g per cell and the amount of sites in sites per cell. To avoid confusion with the units used in the kinetic framework, we change the notation, from [Si] and [E] to N and n, respectively.
The individual-level equations for the internal carbon and nutrient are a balance between source and loss terms. For C, we consider an incoming organic-carbon flow due to photosynthesis, and the expenditure of carbon due to maintenance costs (cost of keeping the various apparatuses and biostructures operational) and biosynthesis of new biomaterial. On the other hand, for N, the source term is given by the uptake of nitrogen, in addition to the maintenance and biosynthetic costs. See SI Text for additional details.
Concerning the dynamics of the number of nitrogen-uptake sites n, there are only a few experimental results that can be used as a guide for establishing the dependencies. A crucial factor in this regulation is the cell's own internal nutrient content (9, 28, 29). For instance, the internal levels of nutrients such as nitrate are the main inducers of genes that encode membrane transporters and enzymes involved in assimilation pathways (4, 6, 30). Concretely, repression of regulation must affect transport capabilities, minimizing synthesis when the cell contains a sufficient amount of the incoming nutrient element (29); on the other hand, when nutrient is low, the cell activates the synthesis of sites (5, 9, 31) to maximize the probability of occurrence of an encounter with the scarce amount of nutrient ions arriving at the cell surface. Then, we can use the C-based quota, Q = N/C, as a proxy for the need (or absence thereof) to synthesize new transporters. For a given value of C, the quota is low if the internal nutrient concentration is low for the current size or biomass of the cell, and vice versa. Thus, there will be up-regulation if the cell needs to incorporate nutrient (Q close to its minimum, Qmin), and down-regulation when the performance of the intake of nutrient is sufficiently high so that Q is large and the cell can reduce the number of transporters to decrease maintenance and biosynthetic costs.
Luxury uptake, that is, uptake rates larger than what would be required to sustain growth, is another factor that can influence transporter regulation, in this case with an opposite result. We can proxy this effect by using the fraction of occupied sites [ES]/[E] = V/Vmax. Values of this ratio close to unity imply a high encounter rate for every uptake site, and therefore indicate high concentrations of nutrient. One can expect the cell to up-regulate the synthesis of transporters to exploit the excess of nutrient available if there are sufficient internal resources to spend and space available on the cell surface (32); for V/Vmax close to zero, the cell down-regulates the production of transporter for energetic purposes, saving energy when nutrient availability is low.
Finally, there is the physical impossibility of having an absorbing area larger than the total area of the cell. We introduce that factor by defining the relative absorbing area,  (with rs being the radius associated with the area occupied by an uptake site).
With those ingredients, the equation for the rate of change of the number of nitrogen-uptake sites per cell is given by
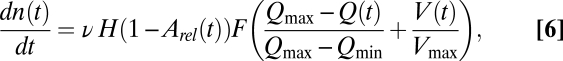 |
where ν is a constant rate of synthesis (in sites per unit time), H is the Heaviside step function, and F(x) ∈ [ –1, 1] is a sigmoid function, for example, the Hill function (33), because the synthesis of uptake sites is a consequence of the activation or repression (positive or negative feedback) of gene expression. As an alternative to the Hill function (with two parameters), we use here the similar, one-parameter function F(x) = 2/(1 + e–kx/2) – 1 (although a linear form for F would not affect the results either). See Fig. S1 for an intuitive visualization of the functional dependence of dn/dt on Q and V.
Note the time dependence not only of Q and V but also of Vmax in Eq. 6. As dn/dt depends on the current values of those variables, n depends implicitly on the whole nutritional history of the cell. Furthermore, there exists an implicit time lag between changes in external nutrient concentration and changes in the number of uptake sites, mostly controlled by the production rate, ν. All those factors may have dramatic consequences for the study of fluctuating environments, such as in the presence of nutrient pulses (34).
The dynamics of the model considers a clonal population in which all individuals follow the same equations, Eqs. S15 and S16, and Eq. 6, with the same set of parameters. Each individual is born with a certain minimum size Cmin and grows according to those equations until it doubles its biomass. When that happens, it divides into two identical cells (that is, a deterministic reproduction event). As environmental context, we assume a chemostat or continuous culture. Changes in the external nutrient concentration are described by the (aggregated-level) equation  , where [S](0) is the concentration of the fresh incoming flow of nutrient into the chemostat, w is the dilution rate, and the last term represents the total nutrient concentration taken up by the population, with L(t) being the total number of individuals and νc the chemostat volume. A complete list of observables and parameter values can be found in SI Text.
Results and Discussion
Following the steps and parameterizations described in the previous section and the SI Text, we ran the individual-based model (IBM) and measured the stationary value of the following observables, for a wide range of values of the stationary nutrient concentration [S]: the population-level uptake rate, V, kinetic param-eters Vmax and aff (normalized by unit of biomass), the average number of uptake sites per cell, n, and the growth rate, μ. For the sake of simplicity, we do not include the contribution of V/Vmax to Eq. 6 in the analysis introduced here, as the presence of this term does not qualitatively affect the results.
The resulting curve for the population-level uptake rate V can be observed in the red plot of Fig. 2. The uptake rate follows in this log-log representation an initial straight line that saturates for large nutrient concentrations. This behavior is to be expected, because of the resemblance of Eq. 3 to a Holling type-II saturating function (35). However, this result is not trivial if we take into account the fact that, in our model, the parameters of the functional form do depend on the nutrient concentration. The green curve in Fig. 2 shows the dependence of Vmax on the nutrient concentration [S]. Under nutrient stress ([S] ≤ 10−7 mol/L), the maximum uptake rate remains at its maximum value (Vmax = Vmaxhi), decreasing monotonically as [S] increases. For large nutrient concentration or satiation, the maximum uptake rate reaches its minimum value (Vmax = Vmaxlo), which coincides with the maximum value shown by V.
Fig. 2.

Stationary values of the uptake rate V (red) and maximum uptake rate Vmax (green) for different external nutrient concentrations [S]. In contrast to the classic MM formulation, in our approach, Vmax is not constant but varies with [S], increasing as [S] decreases. (Inset) Same plot for the number of uptake sites.
A monotonic increase of Vmax for increasingly adverse nutritional conditions has been repeatedly reported in the literature (see the early work in refs. 31 and 36). To explain those and other experimental results, Morel explored in ref. 9 the theoretical relationship between Vmax and [S] (as well as with V, Q, and μ), pointing out the importance of considering as variable the kinetic parameters to adequately describe the acclimation of the cell. The behavior of Vmax([S]) shown by our model in Fig. 2 matches the qualitative behavior of the theoretical expression proposed by Morel in his seminal paper (9). Our model provides a simple, mechanistic basis for this behavior. The relation between the maximum uptake rate and the number of uptake sites, Vmax ∝ n, explains the behavior of Vmax as a consequence of the dependence of n on the external nutrient concentration. In the Inset of Fig. 2, we can see how the stationary values of n for the different nutrient concentrations, n([S]), decrease with [S]: For very small concentrations, when the cell is starved, it reaches a maximum number of sites, nmax, which is limited by cell size; on the other hand, for very large [S], just a minimum number of sites, nmin, is required to keep uptake at a high performance  .
.
Note that in Fig. 2 the diffusion-limited region is characterized by a maximum uptake rate  such that
 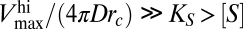 . These conditions, once replaced in Eq. 3, yield the same expression for the diffusion-limited uptake rate written in Eq. 4. On the other hand, for large nutrient concentrations, Vmax([S]) is such that
  first and
  finally, leading to
  (porter limitation). Our flexible-uptake description is, thus, general enough to recover those two well-known theoretical results, instead of needing two different expressions or parameterizations for the two extreme regimes. The qualitative replication of both the experimental behavior for Vmax reported in the literature and the theoretical expectations for the uptake rate in the limiting regimes reasserts the advantages of our choice for the dynamics of the number of uptake sites, Eq. 6.
It is important to emphasize how the classic, static way of thinking about the uptake rate V is affected by the presence of the regulatory mechanism. As explained in ref. 9, due to the change of Vmax with [S], the short-term steady-state uptake of the organism is described by a different curve for each nutrient concentration. Observe again the behavior of Vmax([S]) in Fig. 2. For [S] ≲ 10−7 mol/L, Vmax remains fixed around its highest value  , whereas for [S] ≳ 10−4 mol/L, it reaches its lowest value,
  . This means that, for [S] ≲ 10−7 mol/L, the uptake rate is described by a curve characterized by Eq. 3 with Vmax replaced by
  ; this is shown in the green curve of Fig. 3. On the other hand, for [S] ≳ 10−4 mol/L, the uptake rate is given by Eq. 3 after replacing Vmax with
  (blue curve, same plot). For intermediate values of the nutrient concentration (10−7 mol/L ≲ [S] ≲ 10−4 mol/L), the uptake rate follows Eq. 3, with Vmax replaced by the different values taken by Vmax([S]) depicted as green dots in Fig. 2. Thus, we can say that the organism follows a different short-term steady-state uptake curve (or strategy) for each value of [S], and transitions from one curve to another as the nutrient concentration increases. This leads to the population-level effective uptake curve commonly measured in experiments (see red curves, Figs. 2 and 3) (9), qualitatively similar to a Holling type-II curve but with a more complicated dependence on [S] due to the changing Vmax (37).
Fig. 3.

Maximum (green) and minimum (blue) potential uptake-rate curve for an organism represented by our approach; the effective uptake rate of the cell (red) is a composition of the different potential curves for each nutrient concentration. (Inset) Stationary values for the affinity obtained with our approach (orange) and the diffusion limited-corrected MM approach (violet).
On the contrary, in the static MM, Vmax is fixed at  . After taking into account the diffusion-limitation correction, VMM would be given by Eq. 3, with Vmax replaced by (the constant)
  , that is, the blue curve of Fig. 3, Vlo. Thus, as the nutrient concentration decreases, the differences between our regulatory approach (red curve, same plot) and the classical MM uptake rate become more apparent, reaching, with this specific parameterization, a maximum of 26%, and stabilizing around 21 ± 2% for smaller values of [S] (Fig. S2). The advantage of the flexible uptake illustrated here can be also quantified by means of the specific affinity. The Inset of Fig. 3 shows a comparison between the affinity obtained with the dynamic uptake given by our model and that obtained with VMM = Vlo (see above). Whereas, with the diffusion-limitation correction of the static MM formulation,
  remains constant for any nutrient condition, the change of n or the kinetic parameters with nutrient concentration in our approach entails a change in the specific affinity (Eq. 5): aff increases as [S] decreases. Moreover,
  . This means that our model predicts an improved uptake efficiency under adverse environmental conditions, in accordance with the consideration of the diffusion-limited range for [S] as a high-affinity transport regime (28).
The physiological range given by  determines, thus, the maximum relative difference in the capacity of the cell to take up nutrients. This range can be expressed in terms of the ratio nmax:nmin between the maximum and minimum numbers of sites that the cell can develop, and which provide a suitable performance of the uptake apparatus. Then, the individual traits that influence those two values will determine that physiological range. One of the main traits controlling this range is size (related to nmax), but the maximum and minimum values for the quota of the organism play important roles as well.
The dynamic regulation of the uptake apparatus and the enhancement of the maximum uptake rate under nutrient scarcity shown by our model entail important ecological consequences. As depicted in Fig. 4 and Fig. S3 (main panels), the growth rate of the organism predicted by the static MM, μMM, remains smaller than the prediction of our model. This can be explained in terms of the C-based quota. In both the dynamic and static descriptions of our IBM (SI Text), the growth rate is related to the quota by means of the relation μ = μmax(Q − Qmin)/(Qmax − Qmin) (29), with Qmax and Qmin the maximum and minimum quota values, respectively, reached by the cell in a Q versus [S] plot. The improved uptake rate makes the quota obtained with the dynamic approach, Q([S]), stay farther from its minimum value Qmin than the quota obtained with the static MM, QMM([S]), for the same values of [S]. Consequently, the growth-rate curve μ([S]) shows a shift (Fig. S3, main panel) that is ultimately translated in the relative error portrayed in Fig. 4 (main panel). This error increases as [S] decreases, reaching a stationary value around 19 ± 2%. As a direct consequence of these shifts in uptake and growth rates, the break-even concentration R* for an organism following our approach also varies from the static behavior. R* is defined as the external nutrient concentration of the most limiting resource in the stationary state, and it is inversely correlated with the competitive abilities of the organism (38). In our approach, R* always remains smaller than that of an organism that cannot regulate its uptake parameters (Insets in Fig. 4 and Fig. S3), the difference being larger as the dilution rate in the chemostat increases (it ranges between 17 ± 2% for the lowest w to 75% for the highest). The tendencies of both μ and R* indicate that our approach describes an enhanced ability of the organism to survive under adverse conditions, either nutrient depletion or changing environments. The strong modification shown by μ and R* highlights the importance of the role that our approach can play in improving the predictive skill of models of community assembly in oligotrophic regions of the ocean.
Fig. 4.

Relative error between our dynamic approach and the static, diffusion limitation-corrected MM approach. The error related to the growth rate, Δμ, increases as [S] decreases, reaching in this specific example 19 ± 2%. (Inset) The error related to the break-even concentration,  , increases with the dilution rate w, that is, the frequency of the changes in environmental conditions. The behaviors of both Δμ and
  indicate an enhanced survival probability for organisms that can regulate the kinetic parameters.
It is possible to find in the literature other models where Vmax depends indirectly on [S] through a dependence on Q based on phenomenological arguments (11, 12, 31). In ref. 12, for instance, the relation used for Vmax([Q]) theoretically might lead to a vanishing Vmax in the limit of satiation. Models based on optimality arguments, such as in refs. 14 and 15, eventually lead to an increase of Vmax and KS with [S], which contradicts the experimental and theoretical evidence previously mentioned. This would be equivalent in our framework to n being exclusively controlled by the number of occupied sites (see above). Moreover, the coupling between uptake and assimilation used as a starting point in optimality-based approaches seems to describe more the exception than the rule (6). On the other hand, none of the models above incorporate the diffusion-limitation correction for the uptake rate, nor can they account for the acclimation time. This time lag is controlled in our model by ν, which determines the timescale for the change of the number of uptake sites (Eq. 6) and, therefore, of Vmax. Our approach offers, thus, a more general formalism explaining the ability of the organism to acclimate to different external nutrient conditions.
In ref. 7, Klausmeier et al. introduce a simple temporal dependence of Vmax,j on the internal quotas of the resource j, for two different nutrients. The model proposes a tradeoff between the maximum uptake rates by using a linear relation between the allocation to uptake of both nutrients. This allows the model to describe a flexible uptake (with an implicit acclimation time) and study the dynamic response and the different allocation strategies of the cell under different scenarios. Scarcity of one nutrient entails, as in our dynamics, the increment of its associated Vmax,j. Our model can easily be extended to include competition between different types of nutrient-uptake machinery, by adding the specific nj equation required by each new nutrient j. A key ingredient to correctly replicate the different allocation strategies of the cell, especially under fluctuating conditions, is to explicitly account for the cost of changes in the uptake strategy (environment-dependent costs); the presence of these costs may result in the fixed strategy outcompeting the plastic strategy under very slowly or rapidly fluctuating conditions, in contrast to the results we obtained for R* (16).
Finally, it is important to remark that even though our results agree qualitatively with the relations proposed in ref. 9, they differ quantitatively. That is the case of, for example, Vmax. On one hand, our dynamics for the number of sites introduces a dependence of Vmax([S]) on ν. This modifies nontrivially the relations between Vmax and [S] proposed in ref. 9. On the other hand, the diffusion-limitation correction is not considered in that work. However, finding such a closed expression for Vmax([S]) is a valuable result per se. This would allow us to eliminate the necessity of the explicit formulation of the dynamics of the uptake-site regulation for describing stationary-state situations. So far, we have not been able to find a closed, general expression that works for a sufficiently broad range of parameters, with the site production rate, ν, playing a key role in the final shape of Vmax([S]).
Conclusions
We have shown that it is possible to describe in a more realistic way the dynamic and flexible nature of nutrient uptake in phytoplankton, preserving agreement with the experimental information currently available without compromising in terms of analytical and computational tractability. Starting from a generalized uptake-rate expression that incorporates a diffusion-limitation correction, we have devised an individual-based model that takes into account a regulatory process for the number of uptake sites, here considered as a dynamic variable.
Thanks to this regulatory mechanism, our model explains, from a mechanistic but still simple perspective, the phenomenology for V, Vmax, aff, and n observed in both experimental and theoretical work. Our approach is able, then, to describe well qualitatively both steady-state and short-term experiments (the latter being ones performed for the measurement of the kinetic parameters for different nutrient concentrations). Moreover, the large differences in uptake rate, growth rate, and break-even concentration indicate that the outcome of models that use the static uptake-rate formulation can be strongly affected by the consideration of the dynamic regulatory model proposed here.
All this phenomenology emerges naturally from our simple expression for the dynamics of n. In it, the essential traits of the individual can be directly associated with observed behavior, without getting entangled in a detailed description of the metabolic networks involved in resource uptake and expenditure.
Furthermore, our approach potentially provides a simple explanation for acclimation time, mainly controlled by the constant rate that regulates the synthesis of uptake sites, which plays an important role in cases of a fluctuating environment. Also, our model can be easily adapted to include different nutrients, either considered independently or taking into account competition among the uptake machineries involved. Further work may also involve extending this framework to additional ecological and evolutionary considerations directly affecting uptake. From an ecological perspective, we could take into account the presence of other species (i.e., competition for resources) or the role of grazers (either zooplankton or viruses; see ref. 39 for the latter). Other important features that could be included in our framework are mutation and adaptation, allowing for the inheritance of the modified parental features. These modifications can affect at a fundamental level the essential traits of uptake.
Only by regarding uptake as a flexible, dynamic process, as proposed here, is it possible to develop biogeochemical models not only able to reproduce past and present situations but also endowed with predictive capabilities required for a reliable forecasting of the response of marine biota to the types of changes in biogeochemical fluxes that are likely to arise under the various climate change scenarios.
Supplementary Material
Acknowledgments
We thank Steve Allison, John Dunne, Stephanie Dutkiewicz, Øyvind Fiksen, Peter Franks, Michael Follows, Miguel Fortuna, Christopher Klausmeier, Elena Litchman, Adam Martiny, François Morel, Jorge Sarmiento, Charles Stock, Bess Ward, and Joshua Weitz for helpful discussions and suggestions. We gratefully acknowledge support from the Defense Advanced Research Planning Agency under Grants HR0011-05-1-0057 and HR0011-09-1-055, and the National Science Foundation under Grant OCE-1046001. Part of this work was funded by the Department of Energy at Los Alamos National Laboratory under Contract DE-AC52-06NA25396 through the Laboratory Directed Research and Development Program, and also by the Cooperative Institute for Climate Science of Princeton University and the National Oceanographic and Atmospheric Administration's Geophysical Fluid Dynamics Laboratory.
Footnotes
The authors declare no conflict of interest.
This article contains supporting information online at www.pnas.org/lookup/suppl/doi:10.1073/pnas.1118012108/-/DCSupplemental.
References
- 1.Van Mooy BAS, et al. Phytoplankton in the ocean use non-phosphorus lipids in response to phosphorus scarcity. Nature. 2009;458(7234):69–72. doi: 10.1038/nature07659. [DOI] [PubMed] [Google Scholar]
- 2.Saito MA, et al. Iron conservation by reduction of metalloenzyme inventories in the marine diazotroph Crocosphaera watsonii. Proc Natl Acad Sci USA. 2011;108:2184–2189. doi: 10.1073/pnas.1006943108. [DOI] [PMC free article] [PubMed] [Google Scholar]
- 3.Raven JA. Chloroplasts of eukaryotic micro-organisms. In: Gooday GW, Lloyd D, Trinci APJ, editors. The Eukaryotic Microbial Cell—13th Symposium of the Society for General Microbiology. Cambridge, UK: Cambridge Univ Press; 1980. pp. 181–205. [Google Scholar]
- 4.Hildebrand M, Dahlin K. Nitrate transporter genes from the diatom Cylindrotheca fusiformis (Bacillariophyceae): mRNA levels controlled by nitrogen source and by the cell cycle. J Phycol. 2000;36:702–713. doi: 10.1046/j.1529-8817.2000.99153.x. [DOI] [PubMed] [Google Scholar]
- 5.Dyhrman ST, Palenik B. A single-cell immunoassay for phosphate stress in the dinoflagellate Prorocentrum minimum (Dinophyceae) J Phycol. 2001;37:400–410. [Google Scholar]
- 6.Song B, Ward BB. Molecular cloning and characterization of high affinity nitrate transporters in marine phytoplankton. J Phycol. 2007;43:542–552. [Google Scholar]
- 7.Klausmeier CA, Litchman E, Levin SA. A model of flexible uptake of two essential resources. J Theor Biol. 2007;246:278–289. doi: 10.1016/j.jtbi.2006.12.032. [DOI] [PubMed] [Google Scholar]
- 8.Michaelis L, Menten MM. The kinetics of invertase activity. Biochem Z. 1913;49:333–369. German. [Google Scholar]
- 9.Morel FMM. Kinetics of nutrient uptake and growth in phytoplankton. J Phycol. 1987;23:137–150. [Google Scholar]
- 10.Flynn K. A mechanistic model for describing dynamic multi-nutrient, light, temperature interactions in phytoplankton. J Plankton Res. 2001;23:977–997. [Google Scholar]
- 11.Grover JP. Resource competition in a variable environment: Phytoplankton growing according to the variable-internal-stores model. Am Nat. 1991;138:811–835. [Google Scholar]
- 12.Geider RJ, MacIntyre HL, Kana TM. A dynamic regulatory model of phytoplanktonic acclimation to light, nutrients, and temperature. Limnol Oceanogr. 1998;43:679–694. [Google Scholar]
- 13.Bruggeman J, Kooijman SALM. A biodiversity-inspired approach to aquatic ecosystem modeling. Limnol Oceanogr. 2007;52:1533–1544. [Google Scholar]
- 14.Pahlow M. Linking chlorophyll-nutrient dynamics to the Redfield N:C ratio with a model of optimal phytoplankton growth. Mar Ecol Prog Ser. 2005;287:33–43. [Google Scholar]
- 15.Smith SL, Yamanaka Y, Pahlow M, Oschlies A. Optimal uptake kinetics: Physiological acclimation explains the pattern of nitrate uptake by phytoplankton in the ocean. Mar Ecol Prog Ser. 2009;384:1–12. [Google Scholar]
- 16.Menge DNL, Ballantyne F, IV, Weitz JS. Dynamics of nutrient uptake strategies: Lessons from the tortoise and the hare. Theor Ecol. 2011;4:163–177. doi: 10.1007/s12080-010-0110-0. [DOI] [PMC free article] [PubMed] [Google Scholar]
- 17.Follows MJ, Dutkiewicz S. Modeling diverse communities of marine microbes. Ann Rev Mar Sci. 2011;3:427–451. doi: 10.1146/annurev-marine-120709-142848. [DOI] [PubMed] [Google Scholar]
- 18.Caperon J. Time lag in population growth response of Isochrysis galbana to a variable environment. Ecology. 1969;50:188–192. [Google Scholar]
- 19.Pasciak WJ, Gavis J. Transport limitation of nutrient uptake in phytoplankton. Limnol Oceanogr. 1974;19:881–888. [Google Scholar]
- 20.Karp-Boss L, Boss E, Jumars PA. Nutrient fluxes to planktonic osmotrophs in the presence of fluid motion. Oceanogr Mar Biol Annu Rev. 1996;34:71–107. [Google Scholar]
- 21.Armstrong RA. Nutrient uptake rate as a function of cell size and surface transporter density: A Michaelis-like approximation to the model of Pasciak and Gavis. Deep Sea Res Part I Oceanogr Res Pap. 2008;55:1311–1317. [Google Scholar]
- 22.Caperon J. Population growth in micro-organisms limited by food supply. Ecology. 1967;48:715–721. doi: 10.2307/1933728. [DOI] [PubMed] [Google Scholar]
- 23.Gouaux E, Mackinnon R. Principles of selective ion transport in channels and pumps. Science. 2005;310:1461–1465. doi: 10.1126/science.1113666. [DOI] [PubMed] [Google Scholar]
- 24.Murray JD. Mathematical Biology I: An Introduction. 3rd Ed. Berlin: Springer; 2002. [Google Scholar]
- 25.Aksnes DL, Egge JK. A theoretical model for nutrient uptake in phytoplankton. Mar Ecol Prog Ser. 1991;70:65–72. [Google Scholar]
- 26.Chaplin M, Bucke C. Enzyme Technology. Cambridge, UK: Cambridge Univ Press; 1990. [Google Scholar]
- 27.Healey FP. Slope of the Monod equation as indicator of advantage in nutrient competition. Microb Ecol. 1980;5:281–286. doi: 10.1007/BF02020335. [DOI] [PubMed] [Google Scholar]
- 28.Hudson RJM, Morel FMM. Iron transport in marine phytoplankton: Kinetics of cellular and medium coordination reactions. Limnol Oceanogr. 1990;35:1002–1020. [Google Scholar]
- 29.Flynn KJ. Use, abuse, misconceptions and insights from quota models: The Droop cell quota model 40 years on. Oceanogr Mar Biol Ann Rev. 2008;46:1–23. [Google Scholar]
- 30.Navarro FJ, Martín Y, Siverio JM. Phosphorylation of the yeast nitrate transporter Ynt1 is essential for delivery to the plasma membrane during nitrogen limitation. J Biol Chem. 2008;283:31208–31217. doi: 10.1074/jbc.M802170200. [DOI] [PMC free article] [PubMed] [Google Scholar]
- 31.Gotham IJ, Rhee G-Y. Comparative kinetic studies of nitrate-limited growth and nitrate uptake in phytoplankton in continuous culture. J Phycol. 1981;17:309–314. [Google Scholar]
- 32.Litchman EL, Klausmeier CA, Schofield OM, Falkowski PG. The role of functional traits and trade-offs in structuring phytoplankton communities: Scaling from cellular to ecosystem level. Ecol Lett. 2007;10:1170–1181. doi: 10.1111/j.1461-0248.2007.01117.x. [DOI] [PubMed] [Google Scholar]
- 33.Alon U. An Introduction to Systems Biology: Design Principles of Biological Circuits. Boca Raton, FL: Chapman & Hall/CRC; 2007. [Google Scholar]
- 34.Tozzi S, Schofield O, Falkowski PG. Historical climate change and ocean turbulence as selective agents for two key phytoplankton functional groups. Mar Ecol Prog Ser. 2004;274:123–132. [Google Scholar]
- 35.Holling CS. Some characteristics of simple types of predation and parasitism. Can Entomol. 1959;91:395–398. [Google Scholar]
- 36.McCarthy JJ, Goldman JC. Nitrogenous nutrition of marine phytoplankton in nutrient-depleted waters. Science. 1979;203:670–672. doi: 10.1126/science.203.4381.670. [DOI] [PubMed] [Google Scholar]
- 37.Franks P. Planktonic ecosystem models: Perplexing parameterizations and a failure to fail. J Plankton Res. 2009;31:1299–1306. [Google Scholar]
- 38.Tilman D. Resource Competition and Community Structure. Princeton, NJ: Princeton Univ Press; 1982. [PubMed] [Google Scholar]
- 39.Menge DNL, Weitz JS. Dangerous nutrients: Evolution of phytoplankton resource uptake subject to virus attack. J Theor Biol. 2009;257:104–115. doi: 10.1016/j.jtbi.2008.10.032. [DOI] [PubMed] [Google Scholar]
Associated Data
This section collects any data citations, data availability statements, or supplementary materials included in this article.