

Abstract
Little research has been done to address the huge opportunities that may exist to reposition existing approved or generic drugs for alternate uses in cancer therapy. Additionally, there has been little work on strategies to reposition experimental cancer agents for testing in alternate settings that could shorten their clinical development time. Progress in each area has lagged in part due to the lack of systematic methods to define drug off-target effects (OTEs) that might affect important cancer cell signaling pathways. In this study, we addressed this critical gap by developing an OTE-based method to repurpose drugs for cancer therapeutics, based on transcriptional responses made in cells before and after drug treatment. Specifically, we defined a new network component called cancer-signaling bridges (CSBs) and integrated it with Bayesian Factor Regression Model (BFRM) to form a new hybrid method termed CSB-BFRM. Proof of concept studies were performed in breast and prostate cancer cells and in promyelocytic leukemia cells. In each system, CSB-BFRM analysis could accurately predict clinical responses to >90% of FDA-approved drugs and >75% of experimental clinical drugs that were tested. Mechanistic investigation of OTEs for several high-ranking drug-dose pairs suggested repositioning opportunities for cancer therapy, based on the ability to enforce Rb-dependent repression of important E2F-dependent cell cycle genes. Together, our findings establish new methods to identify opportunities for drug repositioning or to elucidate the mechanisms of action of repositioned drugs.
Keywords: Off-target drug repositioning, cancer systems biology, cancer transcriptional response
Introduction
The study of drug repositioning has so far been limited to the “on-target repositioning” that applies a drug’s known pharmacological mechanism to a different therapeutic indication; for example, comparing the structural similarities of small molecules (1, 2) or known side effects (3). In contrast, “off-target repositioning” attempts to describe the pharmacological mechanisms still unclear for known molecules. A number of approaches have recently been developed for off-target repositioning by using gene signatures (4–7), i.e., subsets of genes, or drug-similarity network (8) identified in the cancer transcriptional profiles following drug treatment. One common limitation of these methods is that they do not include the disease-specific prior knowledge or known mechanisms in the off-target repositioning process, so that they can be used to find similarities between the drugs but not the preference between them. Thus, we need to develop a method that incorporates prior knowledge of specific diseases to provide a more precise off-target drug repositioning.
A primary challenge of off-target repositioning is to address the OTEs of a drug on the proteins downstream in the signaling pathways and the genes that are regulated by those proteins. As an example, in breast cancer raloxifene, tamoxifen, and fulvestrant are the pioneering drugs targeting the estrogen receptor (ER) (9). The targeted proteins, however, often generate downstream effects on the linked signaling proteins and ultimately exert unexpected off-target effects on cancer transcription (10–12). Creighton et al showed that tamoxifen together with estrogen deprivation (ED) can shut down classic estrogen signaling and activate alternative pathways such as HER2, which can also regulate gene expressions. The unexpected downstream signaling proteins and altered cancer transcription can be considered as the off-targets of the treated drugs.
Work has been conducted to address the off-targets using biomarkers or gene signatures (4, 12). Although the methods on gene signatures are able to identify which genes are changed during the treatment of a drug, they cannot explain the associations between the expression changes of the genes and the OTEs on these genes of the drug in terms of the pathway mechanism of the disease. Moreover, these methods also fail to identify frequently changed genes, which were not considered in the gene signatures.
In this paper, we present a new method of off-target drug repositioning for cancer therapeutics based on transcriptional response. To include prior knowledge of signaling pathways and cancer mechanisms into the off-target repositioning process, we propose the use of CSBs to connect signaling proteins to cancer proteins whose coding genes have a close relationship with cancer genetic disorders and then integrate CSBs with a powerful statistical regression model, the Bayesian Factor Regression Model (BFRM), to recognize the OTEs of drugs on signaling proteins. The off-target repositioning method is thus named as CSB-BFRM.
We applied CSB-BFRM to three cancer transcriptional response profiles and found that CSB-BFRM accurately predicts the activities of the FDA-approved drugs and clinical trial drugs for the three cancer types. Furthermore, we employed the identified OTEs and off-targets to explain the action of the repositioned drugs. Four known drugs each with two different doses, or eight drug-dose pairs repositioned to MCF7 breast cancer cell line [raloxifene (0.1 μM and 7.8 μM), tamoxifen (1 μM and 7 μM), fulvestrant (1 μM and 0.01 μM), and paclitaxel (4.6 μM and 1 μM)] were investigated. We showed that these drugs inhibit the transcription of certain key cell cycle genes by enhancing the Rb-dependent repression of E2F-mediated gene transcription. They exhibited negative OTEs on the off-targets, the heterodimer E2F and DP-1, and the kinases CDK2 and CDK4/6, of Rb, but positive OTEs on the inhibitors p15 and SCF of the Rb’s kinases. The results are consistent with the dose-response curves derived from the Developmental Therapeutics Program (DTP) of the National Cancer Institute (NCI).
Quick Guide to Main Model Equations
The strategy for off-target drug repositioning is illustrated in Figure 1. Facilitated by CSBs, we established a new method to facilitate drug repositioning for cancer therapy.
Fig. 1.

CSB-BFRM model
Major Assumptions of the Model
CSB Definition
S is denoted as a protein set of a signaling pathway (i.e. NCI-PID(Pathway Interaction Database) or BioCarta pathway(13)), C is denoted as a cancer protein set defined by the Online Mendelian Inheritance in Man (OMIM) database (14), in which each protein’s coding gene (or genes) has a close relationship with a cancer genetic disorder, Π is the instance set of network motifs (15), ΠS, C is an subset of Π, where an instance comprises a set of proteins and a number of protein-protein interactions between them (Supplementary Methods). Each CSB is a specific instance of one type of network motif; its protein set is denoted as CSB j (j ∈ {1,2,…,|ΠS, C |}). A CSB satisfies that,
| (A) |
Off-target Repositioning Method, CSB-BFRM
BFRM Model
Bayesian Factor and Regression Modeling (BFRM) (16, 17) is applied to the off-target drug repositioning. BFRM deconvolutes the cancer transcriptional response data into signatures with a model of the form,
| (B) |
where Xi is an n dimension vector of fold-change (treatment vs. control) of drug i in the cancer transcriptional response data; Xj,i, j = 1, 2, …, n, is the median value of fold-changes of gene j in consideration of corresponding instances treated by drug i; m is the number of drugs; and n is the number of the coding-genes for the CSB proteins expanded by the cancer proteins of a specific cancer type. Ā = (α1, α2, …, αk) is a sparse n×k matrix whose columns define the signatures Sl, l=1, 2, …, k, and each numerical value Āj,l defines the weight of gene j in the gene signature Sl To address which parts of the cancer signals are responsible for the unknown pharmacological mechanisms and to what extent they are targeted, the CSB-BFRM method needs to identify signatures (the targeted parts in the cancer signals) and effects (OTEs on the targeted parts) (Figure 1B). Thus, we define a weight matrix, A, as a combination of one output of BFRM, Ā, and another matrix, P=(ρ1, ρ2, …, ρk), that contains the (sparse) probabilities that each gene is associated with each signature(See Methods). We call the matrix, Λ = (λ1, λ2, …, λm), as an effect matrix. Each numerical value, Λl,i , defines the effect of drug i imposed on the gene signature, Sl Ψ = (ψ1, ψ2, …, ψm) reflects measurement error and residual biological noise.
Repositioning Profile
The OTEs of a drug on a specific cancer are defined as a repositioning profile using A and Λ (Figure 1C). A repositioning profile, Ω=(ω1, ω2, …, ωm)T, is an m×k matrix to characterize the overall effects of m drugs on k signatures. The known drug targets are essential for identification of a repositioning profile. The targetable signatures are defined by the non-zero weights at the rows of the targets across signatures of A. We denote the targetable signatures for drug i as a set Ti. For each targetable signature t ∈ Ti, we define the product between Rt and the effect score Λi,t as the overall effect of drug i imposed on signature t, Ωi,t = Rt × Λi,t, where denotes the response(or total weight)of the signature t to the drug i . The repositioning profile for drug i ,ωi, i =1, 2, …, m, is defined as,
| (C) |
The target information for certain drugs may be unavailable. To define repositioning profile for these drugs, we use a randomized process to simulate the targets of these drugs (see Methods). To reduce the computation bias, we repeated the randomized process for 1,000 times and generated a sequence for repositioning profiles, Ξ = (Ω1,Ω2,…,Ω1,000).
Repositioning Score
The identified repositioning profile is applied to define a numerical value, called repositioning score, to distinguish the OTEs of the drugs. We used a supervised regression model, Support Vector Regression (SVR), to define the repositioning score. If a drug i is approved by the FDA or undergoing clinical trials, the element of the label vector for prior knowledge, Li, equals to 1. SVR outputs a regression prediction vector, Ph, for each regression between repositioning profile Ωh, h=1, 2, …, 1,000, and the label vector, L. Ph is sorted in a descending order. The drugs’ ranks in the sorted Ph is recorded in a repositioning score vector, ℜh. Thus, we have a sequence for repositioning score,
| (D) |
The repositioning score for each drug is defined as mean± standard variation across the 1,000 repositioning score vectors.
Off-targets and OTEs
The proposed repositioning score recognizes a drug’s activity from the OTEs on the targetable signatures that comprise a number of off-targets. The off-targets are identified as the CSB proteins whose OTEs are non-zero. For a drug i, its OTE on a CSB protein j, j = 1, 2, …, n, in a targetable signature t, t ∈ {1, 2, …, k}, is defined as the product of Aj,t and Λt,i. Thus, the OTEs that drug i on the targetable signature t is a vector,
| (Ea) |
The OTE of drug i on CSB protein j is defined as the summation of all of Ei,t, j (t = 1, 2, …, k) across all of the targetable signatures Ti,
| (Eb) |
Materials and Methods
The drug-treated transcriptional response data were derived from Connectivity Map 02 (CMAP 02) (4). There are 6,100 treatment instances, in which 6,066 instances were treated on 3 types of cancer cell lines: MCF7 breast cancer cell line, PC3 prostate cancer cell line, and HL60 promyelocytic leukemia cell line. Each instance has a treatment case for one drug with one dosage and variable numbers of controls (1, 5, or 6). There are 3,095, 1,742, and 1,229 instances designed for MCF7, PC3, and HL60 cell lines respectively. The transcriptional response data of MCF7 include 3,628 gene microarrays for 1,198 single-dose drugs, 96 multiple-dose drugs and 1, 390 drug-dose pairs. The transcriptional response data of PC3 have 2,017 gene microarrays for 1,150 single-dose drugs, 31 multiple-dose drugs and 1,215 drug-dose pairs. The transcriptional response data of HL60 comprise 1,406 gene microarrays for 1,061 single-dose drugs, 17 multiple-dose drugs, and 1,099 drug-dose pairs. Additional data used in this paper can be found in the Supplementary materials.
Figure 1 illustrates the strategies used in our off-target repositioning method, CSB-BFRM, and the Quick Guide provides an overview of the key definitions and modeling components.
Figure 1A shows the advantage of combining CSB and BFRM (16–19) to reposition drugs that cater not only the treatment response but also the expanded cancer signaling mechanisms, making it feasible for off-target repositioning for cancers. In Figure 1B, the input to CSB-BFRM is a treatment-response matrix X (n×m) whose m columns correspond to the treated drugs and n rows correspond to the coding genes for the identified CSB proteins for the cancer type of interest. The statistical factor analysis, BFRM, decomposes the treatment-response matrix X into another two matrices, weight matrix A (n×k) and effect matrix Λ(k×m). A weight matrix, A (n×k), is a sparse matrix (most of elements are zero, as indicated by white color) whose columns define k signatures and their non-zero elements indicate which proteins are included in the signatures. BFRM imposes a sparse prior on the association of the genes to the signatures. Another matrix, P=(ρ1, ρ2, …, ρk), contains the (sparse) probabilities that each gene is associated with each factor. The cutoff for each element, Pi j, of P matrix was chosen as the mean of all the non-zero values in the P matrix. If Pi j is higher than the cutoff, the corresponding value, Ai j, of weight matrix A will be kept, and else, Ai j is set as zero. An effect matrix, Λ(k×m), demonstrates the effects of the m drugs imposed on the k signatures. BFRM model applies hierarchical priors for values of the non-zero elements in A and gets posterior via Markov Chain Monte Carlo (MCMC). MCMC analysis for the posterior simulation is implemented in a Gibbs sampling manner. The BFRM model is implemented by a software package, BFRM 2.0 (16, 17). The number of signatures, k, is determined by an evolution algorithm in the BFRM 2.0 software.
In Figure 1C, the repositioning profile definition takes advantages of the identification of the targetable signatures. If a drug’s target information is available, the targetable signatures are defined by the non-zero weights at the rows of the targets across signatures of A. The proteins in each targetable signature are determined by the non-zero elements in each corresponding column of A. For each targetable signature, the total of the non-zero weights is used to evaluate the response of the signature to the drug. In Λ, the score corresponding to the row of the signature and the column of the drug shows the effect of the drug on the signature. The OTE that the drug imposes on the signature is defined as a weighted score obtained by multiplying the response of the signature to the drug by the effect of the drug on the signature. The repositioning profile is used to illustrate the OTEs of the drug on all of the signatures, in which the OTEs for the targetable signatures are defined as the weighted scores while those for the untargetable signatures are zeros.
Sometimes, the target information of a drug may be unavailable. We designed a randomized process to find these targetable signatures. In the randomized process, a number of proteins randomly chosen from the CSB proteins were considered as the candidates for drug-targets. The hypothesis is that these drugs generate off-target effects (OTEs) on the CSB proteins even if they do not target the CSB proteins directly. The number of proteins chosen is determined by a random numerical value drawn from a uniform distribution between 1 and μ, where μ is the mean value of the targets for the drugs whose targets are known. The randomized process is repeated 1,000 times for those drugs whose targets are unknown to reduce the computational bias in the identification of their candidate targets or off-targets. Still some drugs have known drug-targets that are not included in the CSB protein set. These targets are led to the CSB proteins, using the shortest-paths in the protein-protein interaction network. The CSB proteins identified are considered as the targets or off-targets of these drugs.
To rank the activities of drugs, we propose a single numerical value, repositioning score, for each drug. In this study, since a number of drugs are known to be FDA-approved or undergoing clinical trials for breast cancer, prostate cancer, and promyelocytic leukemia, we used the supervised regression model to define the repositioning score (Figure 1D). For other cancer types, the FDA-approval and clinical trial information may be unavailable. To apply the CSB-BFRM method to these cancer types, the supervised method should be replaced by an unsupervised data mining method, for example, clustering. The SVR algorithm is implemented in R, using the package “e1071.” All of the parameters are used as default except that the parameter ‘c’ for cross validation is set to be 5. We specified cross validation as 5-fold.
All of the materials and methods reported in this paper are included in a web-based tool, R2D2-CSB, which is available at http://r2d2drug.org/Software/csb/csb.aspx
Results
CSBs expand the signaling proteins to cancer proteins
To investigate the off-target drug repositioning for cancers, we introduced the new network elements, CSBs, that can be used to extend the known canonical signaling pathways (13, 20) to the proteins whose coding genes have a close relationship with cancer genetic disorders (14, 21), for short, cancer proteins (Figure 2A). The data sources for definition of CSBs are listed in Supplementary Table 1. CSBs are the instances of network motifs (15, 22, 23), or building blocks, of the protein interaction networks (24–28) (Supplementary Table 2).
Fig. 2. Cancer signaling bridges (CSBs) and their roles in cancer study and drug discovery.

(A) CSBs extend the signaling proteins to cancer proteins. (B) Linked cancer types of CSBs. (C) Known anti-cancer drugs targeted on the proteins for signaling pathways, CSBs, and cancer. (D) Extended proteins by CSBs are more likely to be targeted by anti-cancer drugs than non-extended ones (Signaling proteins: P<10−5, Cancer proteins: P<10−14, Fisher’s exact two-tailed test). (E) The overall effects on protein sets evaluated by E-scores (see Supplementary Methods for details). For known anti-cancer drugs, they have significantly higher effects on cancer protein set than those of signaling pathways and CSB proteins (P<10−20, Mann–Whitney U test).
Besides being able to link many previously unrelated cancer proteins to a known signaling pathway of interest (Supplementary Figure 1), CSBs have the following four characteristics that determine their important role in off-target drug repositioning: i) CSBs are significantly enriched in the connections between oncogenic signaling pathways and cancer proteins (Supplementary Table 3 and Supplementary Methods); ii) most CSBs, nearly 70%, are not shared by multiple types of cancers but are specific to one cancer type (Figure 2B); iii) signaling proteins and cancer proteins linked by CSBs are significantly more likely to be targeted by known anti-cancer drugs (Figure 2D); and iv) although most known anti-cancer drugs select the proteins in signaling pathways as their targets (Figure 2C), they still generate relatively high effects, transmitted by CSBs, onto cancer proteins (Figure 2E, and Supplementary Methods).
Application of CSB-BFRM to cancer transcriptional response data
We applied the proposed off-target repositioning method, CSB-BFRM, to three cancer transcriptional response datasets of MCF7 breast cancer cell line, PC3 prostate cancer cell line, and HL60 promyelocytic leukemia cell line (Supplementary Methods). The inputs and outputs of CSB-BFRM are shown in Supplementary Tables 4–12. We tested the performance of CSB-BFRM to predict the activities of FDA-approved drugs and clinical trial drugs for breast cancer, prostate cancer, and promyelocytic leukemia, and employed the identified off-targets and OTEs to explain the mechanisms of action of repositioned drugs.
Performance of repositioning prediction
To evaluate the performance of CSB-BFRM in prediction of drug activities based on the identified repositioning profiles of drugs, we employed the Receiver Operating Characteristic (ROC) method. The area under the ROC Curve (AUC) illustrates how useful the repositioning profiles are for prediction of the known data of FDA-approval and clinical trials information. In Figure 3A and 3B, we show the ROC curves for the predictions on the activities of FDA-approved and clinical trial breast cancer drugs. The AUCs for the ROCs in Figure 3A are 0.94±0.02 (P<10−4, Fisher’s exact two-tailed test) and those for the ROCs in Figure 3B are 0.79±0.04 (P<10−4, Fisher’s exact two-tailed test). Since the FDA-approval information for prostate cancer and promyelocytic leukemia is limited, it was merged with clinical trial information in order to do the repositioning predictions. The performance of the prediction on the FDA-approved and clinical trial prostate cancer drugs is indicated by the ROC curve shown in Figure 3C. The AUC of the ROC curve in Figure 3C is 0.78±0.03 (P<10−4, Fisher’s exact two-tailed test). The ROC curve for the prediction on the FDA-approved and clinical trial promyelocytic leukemia drugs is shown in Figure 3D and its AUC is 0.91±0.06 (P<10−4, Fisher’s exact two-tailed test). The results indicate that the activities of the FDA-approved and clinical trials drugs for breast cancer, prostate cancer, and promyelocytic leukemia are accurately predicted by the CSB-BFRM.
Fig. 3.

The prediction performance of CSB-BFRM on FDA approved drugs and clinical trial drugs
For the repositioning on the MCF7 breast cancer cell line, we listed the first 22 drugs with the highest repositioning scores in Table 1 and showed the ranks for all the 1,390 drugs in Supplementary Table 14. These first 22 drugs predict all 14 FDA-approved drugs (with drug dosages) from the 1,390 drugs (P<10−10, Hypergeometric test). Furthermore, we listed the repositioned drugs with their repositioning scores for PC3 prostate cancer cell line and HL60 promyelocytic leukemia in the Supplementary Tables 15 and 16. The relatively small numbers of drugs with highest repositioning scores predict the FDA-approved drugs and clinical trial drugs for prostate cancer and promyelocytic leukemia (PC3: P<10−4, Hypergeometric test; HL60: P<10−2, Hypergeometric test).
Table 1.
The activities of drugs predicted by repositioning scores for MCF7 breast cancer cell line
| Predicted Rank | Repositioned drugs | Repositioning score (mean) | Repositioning score (std) | Status* |
|---|---|---|---|---|
| 1 | raloxifene 0.0000001 | 0.85 | 0.77 | FDA CT |
| 2 | paclitaxel 0.0000046 | 2.75 | 1.01 | FDA CT |
| 3 | tamoxifen 0.000001 | 3.43 | 1.97 | FDA CT |
| 4 | paclitaxel 0.0000001 | 5.46 | 33.73 | FDA CT |
| 5 | fulvestrant 0.000001 | 6.31 | 0.98 | FDA CT |
| 6 | exemestane 0.00000001 | 21.82 | 86.28 | FDA CT |
| 7 | letrozole 0.000014 | 26.43 | 96.52 | FDA CT |
| 8 | sulindac 0.00005 | 29.02 | 18.10 | CT |
| 9 | fulvestrant 0.00000001 | 31.01 | 42.76 | FDA CT |
| 10 | daunorubicin 0.000007 | 37.95 | 83.48 | |
| 11 | clomifene 0.0000066 | 38.97 | 20.41 | |
| 12 | sulindac 0.0001 | 46.48 | 19.31 | CT |
| 13 | estradiol 0.00000001 | 53.47 | 79.65 | FDA CT |
| 14 | imatinib 0.00001 | 55.64 | 68.28 | CT |
| 15 | estradiol 0.0000001 | 58.60 | 30.09 | FDA CT |
| 16 | methotrexate 0.0000088 | 59.80 | 127.82 | FDA CT |
| 17 | bezafibrate 0.000011 | 68.08 | 139.31 | |
| 18 | doxorubicin 0.0000068 | 70.22 | 218.72 | FDA CT |
| 19 | valproic acid 0.00005 | 76.00 | 69.52 | |
| 20 | raloxifene 0.0000078 | 80.74 | 84.14 | FDA CT |
| 21 | amiloride 0.0000132 | 113.04 | 193.55 | |
| 22 | tamoxifen 0.000007 | 124.33 | 137.36 | FDA CT |
FDA: FDA-approved breast cancer drug, CT: Clinical trial breast cancer drug
OTEs and off-targets
We investigated eight pairs of drug-doses with relatively high repositioning scores repositioned for MCF7 breast cancer cell line, as shown in Table 2. The eight drug-dose pairs are raloxifene at 0.1 μM and 7.8 μM, tamoxifen at 1 μM and 7 μM, paclitaxel at 4.6 μM and 1 μM, and fulvestrant at 1 μM and 0.01 μM. We identified the off-targets for the four repositioned drugs and listed them with their OTEs in Supplementary Table 17. To remove the redundant off-targets with relatively lower OTEs, we used the mean of the absolute values, |OTE|, of all off-targets as a threshold, δ. We chose those off-targets whose OTEs are higher than the threshold δ or lower than −δ for the following analysis. We did the gene set enrichment analysis (GSEA) (29) on the off-targets of each drug. The off-targets of each drug are significantly enriched in two important cellular functions, cell cycle (P<10−5, Hypergeometric test) and apoptosis of cells (P<10−26, Hypergeometric test). The enrichment P-values for all of the eight drugs are shown in Supplementary Table 18. We also did pathway analysis on the identified off-targets, using IPA (Ingenuity Pathway Analysis) software. Subsequently, two important signaling pathways related to cell cycle and apoptosis were identified, namely, cell cycle G1/S checkpoint and p53 signaling pathways.
Table 2.
The predicted off-targets and OTEs for the repositioned drugs on MCF7 breast cancer cell line
| Drugs | Off-targets | OTEs | ||||||
|---|---|---|---|---|---|---|---|---|
| Signaling pathway | Symbol | Entrez Gene Name | Location | Family | Entrez Gene ID | Target | Pathway | |
| raloxifene 0.1μMol | Cell cycle G1/S | TFDP1 | transcription factor Dp-1 | Nucleus | transcription regulator | 7027 | −0.0433 | ↘ |
| E2F1 | E2F transcription factor 1 | Nucleus | transcription regulator | 1869 | −0.0268 | ↘ | ||
| E2F2 | E2F transcription factor 2 | Nucleus | transcription regulator | 1870 | −0.0206 | ↘ | ||
| E2F4 | E2F transcription factor 4, p107/p130-binding | Nucleus | transcription regulator | 1874 | −0.0392 | ↘ | ||
| p53 signaling pathway | TP53 | tumor protein p53 | Nucleus | transcription regulator | 7157 | −0.0216 | ↘ | |
|
| ||||||||
| raloxifene 7.8μMol | Cell cycle G1/S | TFDP1 | transcription factor Dp-1 | Nucleus | transcription regulator | 7027 | −0.0611 | ↘ |
| p53 signaling pathway | TP53 | tumor protein p53 | Nucleus | transcription regulator | 7157 | 0.0274 | ↗ | |
|
| ||||||||
| tamoxifen 1μMol | Cell cycle G1/S | TFDP1 | transcription factor Dp-1 | Nucleus | transcription regulator | 7027 | −0.0222 | ↘ |
| p53 signaling pathway | TP53 | tumor protein p53 | Nucleus | transcription regulator | 7157 | 0.0178 | ↗ | |
| MDM2 | Mdm2 p53 binding protein homolog | Nucleus | transcription regulator | 4193 | −0.0115 | ↗ | ||
|
| ||||||||
| tamoxifen 7μMol | Cell cycle G1/S | TFDP1 | transcription factor Dp-1 | Nucleus | transcription regulator | 7027 | −0.0185 | ↘ |
| p53 signaling pathway | TP53 | tumor protein p53 | Nucleus | transcription regulator | 7157 | 0.0138 | ↗ | |
| MDM2 | Mdm2 p53 binding protein homolog | Nucleus | transcription regulator | 4193 | −0.0157 | ↗ | ||
|
| ||||||||
| paclitaxel 4.6μMol | Cell cycle G1/S p53 signaling pathway |
TFDP1 | transcription factor Dp-1 | Nucleus | transcription regulator | 7027 | −0.0583 | ↘ |
| RBL1 | retinoblastoma-like 1 (p107) | Nucleus | other | 5933 | 0.1404 | ↘ | ||
| CDKN2B | cyclin-dependent kinase inhibitor 2B (p15, inhibits CDK4) | Nucleus | transcription regulator | 1030 | 0.0933 | ↘ | ||
| BTRC | beta-transducin repeat containing | Cytoplasm | enzyme | 8945 | 0.0905 | ↘ | ||
| TP53 | tumor protein p53 | Nucleus | transcription regulator | 7157 | 0.083 | ↗ | ||
| MDM2 | Mdm2 p53 binding protein homolog | Nucleus | transcription regulator | 4193 | −0.0583 | ↗ | ||
|
| ||||||||
| paclitaxel 1μMol | Cell cycle G1/S | TFDP1 | transcription factor Dp-1 | Nucleus | transcription regulator | 7027 | −0.0201 | ↘ |
| p53 signaling pathway | TP53 | tumor protein p53 | Nucleus | transcription regulator | 7157 | 0.016 | ↗ | |
| MDM2 | Mdm2 p53 binding protein homolog | Nucleus | transcription regulator | 4193 | −0.0153 | ↗ | ||
|
| ||||||||
| fulvestrant 1μMol | Cell cycle G1/S | TFDP1 | transcription factor Dp-1 | Nucleus | transcription regulator | 7027 | −0.0192 | ↘ |
| E2F1 | E2F transcription factor 1 | Nucleus | transcription regulator | 1869 | −0.0134 | ↘ | ||
| E2F2 | E2F transcription factor 2 | Nucleus | transcription regulator | 1870 | −0.0184 | ↘ | ||
| E2F4 | E2F transcription factor 4, p107/p130-binding | Nucleus | transcription regulator | 1874 | −0.0142 | ↘ | ||
| CDK2 | cyclin-dependent kinase 2 | Nucleus | kinase | 1017 | −0.0192 | ↘ | ||
| p53 signaling pathway | TP53 | tumor protein p53 | Nucleus | transcription regulator | 7157 | −0.0115 | ↘ | |
| MDM2 | Mdm2 p53 binding protein homolog | Nucleus | transcription regulator | 4193 | 0.01 | ↘ | ||
|
| ||||||||
| fulvestrant 0.01μMol | Cell cycle G1/S | TFDP1 | transcription factor Dp-1 | Nucleus | transcription regulator | 7027 | −0.016 | ↘ |
| E2F1 | E2F transcription factor 1 | Nucleus | transcription regulator | 1869 | −0.0446 | ↘ | ||
| E2F2 | E2F transcription factor 2 | Nucleus | transcription regulator | 1870 | −0.0405 | ↘ | ||
| E2F4 | E2F transcription factor 4, p107/p130-binding | Nucleus | transcription regulator | 1874 | −0.0842 | ↘ | ||
| CDK2 | cyclin-dependent kinase 2 | Nucleus | kinase | 1017 | −0.0395 | ↘ | ||
| p53 signaling pathway | TP53 | tumor protein p53 | Nucleus | transcription regulator | 7157 | −0.0567 | ↘ | |
| MDM2 | Mdm2 p53 binding protein homolog | Nucleus | transcription regulator | 4193 | 0.0298 | ↘ | ||
Mechanisms of repositioned drugs
The Rb-dependent repression of E2F-mediated transcription (30) is the key to understanding the mechanisms of the eight repositioned drug-dose pairs. We summarized the signal cascade as the following:
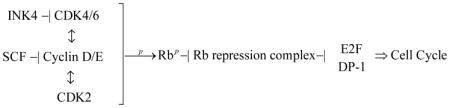
The OTEs and off-targets of the eight repositioning drug-dose pairs for this signaling cascade are shown in Table 2. To better illustrate the drugs’ effects on the signaling cascade, their OTEs and off-targets are also displayed in Figure 4. All eight drug-dose pairs inhibit the core part of the signaling cascade, the heterodimer of E2F and DP-1. The inhibition of either E2F or DP-1 ensures that the gene expression is repressed even if Rb is phosphorylated. Still, some drug-dose pairs targeting on other parts of the signaling cascade enforce the transcriptional repression. Paclitaxel at 4.6 μM has a relatively high positive OTE (higher than 0) on the RBL1 protein (a member of the Rb protein family), which increases the expression of RBL1 protein and strengthens the recruitment of HDACs and other nuclear factors to repress gene expression. Paclitaxel at 4.6 μM also has positive OTEs on the INK4 (p15) and SCF proteins, which enhances the inhibition of CDK4/6 and Cyclin D/E as well as phosphorylation of Rb, so that the association of Rb family members with both HDACs and E2Fs are enhanced and gene expression is repressed. Fulvetrant at 1 μM and 0.01 μM have negative OTEs (lower than 0) on the kinase CDK2, and decrease its expression, which in turn reduce the phosphorylated Rb and enhance the Rb-dependent repression of E2F-mediated transcription. Thus, by various means, these drugs enforce the transcriptional repression of key cell cycle genes.
Fig. 4. OTEs and off-targets of raloxifene, tamoxifen, paclitaxel, and fulvestrant on the cell cycle G1/S checkpoint and P53 signaling pathways.

The right side is for the signal cascade in the cell cycle G1/S checkpoint signaling pathway while the left side is for the P53 signaling pathway. The drug-dose pairs are listed in the middle. The drug-targeted pathway was generated using IPA software (Ingenuity Systems, Inc. Redwood City, CA).
Consistency with dose-response curves
We used the dose-response data derived from the Developmental Therapeutics Program (DTP) of NCI/NIH (31) to validate our hypothesis. Checking the dose-response curves for raloxifene, tamoxifene, paclitaxel, and fulvestrant (Figure 5), we found that all of the four drugs with considered dosages (lower than 10 μM) have a significant inhibition on the cell growth. This result is well consistent with the predicted OTEs enhancing the Rb-dependent repression of E2F-mediated transcription of the key genes for cell cycle progression.
Fig. 5. Dose-response curves for raloxifene, tamoxifen, fluvestrant, and paclitaxel.

The value of dots between 0% and 100% means the drug inhibits the cell growth. The growth percentage of −100 means all cells are killed. The dose-response curves for raloxifene and tamoxifen imply that they induce the cell death at higher dosages while the curve for paclitaxel shows that some experiments also cause the cell death. In contrast, the curve for fulvestrant indicates that at higher dosages fulvestrant does not induce the cell death. The data source is Developmental Therapeutics Program (DTP) of NCI/NIH (31).
The four repositioned drugs not only generate OTEs on the cell cycle G1/S checkpoint signaling pathway but also impose OTEs on the p53 signaling pathway (Table 2 and Figure 4). The OTEs on the p53 signaling pathway are helpful to understand why raloxifene, tamoxifen, and paclitaxel induce apoptosis at higher dosages, while fulvestrant does not induce any cell death on MCF7 (Figure 5). Comparing the OTEs of raloxifene at lower and higher dosages, these two OTEs are opposite to each other. At the lower dosage, the negative OTE decreases TP53 and blocks apoptosis while at the higher dosage it increases apoptotic cell death. This is also seen with tamoxifen. On the other hand, paclitaxel is predicted to increase the expression of TP53 and induce apoptosis of cells at both lower and higher dosages. Several experiments on paclitaxel with dosages between 10−7 M and 10−5M induce cell death. In contrast, fulvestrant decreases the expression of TP53 at both lower and higher dosages and cannot induce the apoptosis of cells at any of the considered dosages.
Discussion
In summary, we presented a new computational method for off-target drug repositioning using cancer transcriptional response data before and after treatment. Facilitated by the new network elements, CSBs, we have shown the potential of the proposed method, CSB-BFRM, in the repositioning of drugs for specific cancer types. CSB-BFRM performs well in predicting the activities of FDA-approved drugs and clinical trial drugs for breast cancer, prostate cancer, and promyelocytic leukemia, using the corresponding transcription response datasets. The predicted OTEs and off-targets help to better understand the mechanisms of action of repositioned drugs.
In Table 1, the repositioning list for MCF7 breast cancer cell line includes all of the FDA-approved breast cancer drugs targeting on ER, which appear in the 1,390 drug set. The drugs are raloxifene at 0.1 μM and 7.8 μM, tamoxifen at 1 μM and 7 μM, fulvestrant at 1 μM and 0.01 μM, and estradiol at 4.6 μM and 1 μM. The repositioning result is consistent with the fact that MCF7 is an ER+ breast cancer cell line. In addition, raloxifene and tamoxifen are the Selective Estrogen-Receptor Modulators (SERMs) (32). These SERMs function as pure antagonists when acting through estrogen receptor β on genes containing estrogen response elements but can function as partial agonists when acting on them through estrogen receptor α. The repositioning results for raloxifene and tamoxifen are consistent with the “partial agonist” property of raloxifene and tamoxifen. These two drugs generate higher effects at lower dosages. Raloxifene at 0.1 μM has a higher repositioning rank than raloxifene at 7.8 μM, and tamoxifen at 1 μM has a higher repositioning rank than tamoxifen at 7 μM.
The identified off-targets and OTEs display the complexity of drugs’ activities. On one hand, some drugs at higher dosages have their own specific off-targets or OTEs. In the repositioning for the MCF7 breast cancer cell line, paclitaxel at 4.6 μM has extra positive OTEs on the RBL1 protein, Rb’s kinase (CDK2), the cyclin proteins’ inhibitor (SCF), and the inhibitor of kinase CDK4/6, INK4 (p15), which are absent at the lower dosage. These OTEs ensure that paclitaxel can strengthen the transcription repression on the key genes regulating the cell cycle. On the other hand, at different dosages, the same drug would generate different effects on its specific off-targets and signaling pathways. For example, at the higher dosages, raloxifene and tamoxifen have positive OTEs on p53 protein while exhibiting negative OTEs on p53 protein at the lower dosages. Since the complexity of drugs’ activities is not easily explained by “on-target” studies, the OTEs on the downstream signaling proteins have to be identified and linked to transcription, rather than simple analysis of the effects on known drug-targets.
Bayesian Factor Regression Model (BFRM) plays a central role in recognizing the OTEs of repositioned drugs. It factorizes the response (fold-change of expression) of a molecule into different component values according to the latent factors (signatures). The CSB-BFRM recognizes the essential latent factors (targetable signatures) and factorized component values (OTEs) for these signatures. For the repositioning on the MCF7 breast cancer cell line, we compared the original response (fold-change) on off-targets in cell cycle G1/S checkpoint and p53 signaling pathways with the recognized OTEs on these targets (Supplementary Figure 2). The data scale is changed. Fold-changes of the molecules are between 0.4 and 1.6 while OTEs are between −0.10 and 0.10. The factorized OTEs allow the easy recognition of positive and negative effects. For instance, all of the original fold-changes of tamoxifen at 1 μM are higher than 1, while the OTEs are between −0.05 and 0.05. If we use the original fold-changes, we cannot tell the difference between OTEs on the heterodimer of E2F and DP-1 (negative) and those for p53 (positive). The recognized OTEs are better in reflecting the mechanism of action of repositioned drugs.
The proposed off-target drug repositioning method, CSB-BFRM, takes advantage of the availability of disease-specific prior knowledge. For example, the definition of CSBs as shown in Figure 1 needs the prior knowledge of the cancer genes that have genetic disorders associated with the cancer type of interest. However, CSB-BFRM would face difficulties in repositioning drugs for rare cancer types, as prior knowledge is often unavailable. Fortunately, with the rapid development of next generation sequencing, more people will be willing to study these rare cancer types and to generate corresponding genetic mutation data. The identification of key genes with genetic disorders would allow further identification of CSBs for these cancer types. Thus, we believe that using CSB-BFRM for repositioning drugs for rare cancer types will also be feasible.
Supplementary Material
Acknowledgments
Financial support: This work was supported by NIH grant U54CA149196 and John S Dunn Research Foundation to STCW.
We appreciate the discussion and advice of Suzanne Fuqua, Michael Lewis and Rachel Schiff from Lester and Sue Smith Breast Center, Baylor College of Medicine, Xiang-Sun Zhang from Institute of Applied Mathematics, Chinese Academy of Sciences, Luonan Chen from Key Laboratory of Systems Biology, Shanghai Institutes for Biological Sciences, Chinese Academy of Sciences, as well as colleagues in the Cancer Systems Biology Laboratory, The Methodist Hospital Research Institute.
Grant Support
This work was supported by NIH grant U54CA149196 and John S Dunn Research Foundation to STCW.
Footnotes
Disclose any potential conflicts of interest: No potential conflicts of interest were disclosed.
Major findings: By developing a systematic approach to characterize off-target effects of drugs, this study may help the field learn how to reposition existing approved and generic drugs for alternate uses in cancer treatment.
Author contributions: GJ and STCW initiated the idea for applying systems biology in cancer drug repositioning as well as the CSB-BFRM model. GJ and CF processed the data used in the analysis. GJ and CF developed the source code for CSB-BFRM model. GJ did the repositioning on MCF7, PC3, and HL60. CF designed the web-based interface for CSB-BFRM model. GJ, HZ, JC, and KC discussed the biological interpretation of the repositioning results. STCW supervised this work. GJ, HZ, JC, and STCW wrote the paper.
References
- 1.Keiser MJ, Setola V, Irwin JJ, Laggner C, Abbas AI, Hufeisen SJ, et al. Predicting new molecular targets for known drugs. Nature. 2009;462:175–81. doi: 10.1038/nature08506. [DOI] [PMC free article] [PubMed] [Google Scholar]
- 2.Miller MA. Chemical database techniques in drug discovery. Nat Rev Drug Discov. 2002;1:220–7. doi: 10.1038/nrd745. [DOI] [PubMed] [Google Scholar]
- 3.Campillos M, Kuhn M, Gavin AC, Jensen LJ, Bork P. Drug target identification using side-effect similarity. Science. 2008;321:263–6. doi: 10.1126/science.1158140. [DOI] [PubMed] [Google Scholar]
- 4.Lamb J, Crawford ED, Peck D, Modell JW, Blat IC, Wrobel MJ, et al. The Connectivity Map: using gene-expression signatures to connect small molecules, genes, and disease. Science. 2006;313:1929–35. doi: 10.1126/science.1132939. [DOI] [PubMed] [Google Scholar]
- 5.Lamb J. The Connectivity Map: a new tool for biomedical research. Nat Rev Cancer. 2007;7:54–60. doi: 10.1038/nrc2044. [DOI] [PubMed] [Google Scholar]
- 6.Sirota M, Dudley JT, Kim J, Chiang AP, Morgan AA, Sweet-Cordero A, et al. Discovery and preclinical validation of drug indications using compendia of public gene expression data. Sci Transl Med. 2011;3:96ra77. doi: 10.1126/scitranslmed.3001318. [DOI] [PMC free article] [PubMed] [Google Scholar]
- 7.Sardana D, Zhu C, Zhang M, Gudivada RC, Yang L, Jegga AG. Drug repositioning for orphan diseases. Brief Bioinform. 2011;12:346–56. doi: 10.1093/bib/bbr021. [DOI] [PubMed] [Google Scholar]
- 8.Iorio F, Bosotti R, Scacheri E, Belcastro V, Mithbaokar P, Ferriero R, et al. Discovery of drug mode of action and drug repositioning from transcriptional responses. Proc Natl Acad Sci U S A. 2010;107:14621–6. doi: 10.1073/pnas.1000138107. [DOI] [PMC free article] [PubMed] [Google Scholar]
- 9.Wishart DS, Knox C, Guo AC, Cheng D, Shrivastava S, Tzur D, et al. DrugBank: a knowledgebase for drugs, drug actions and drug targets. Nucleic Acids Res. 2008;36:D901–6. doi: 10.1093/nar/gkm958. [DOI] [PMC free article] [PubMed] [Google Scholar]
- 10.Keiser MJ, Hert J. Off-target networks derived from ligand set similarity. Methods Mol Biol. 2009;575:195–205. doi: 10.1007/978-1-60761-274-2_8. [DOI] [PubMed] [Google Scholar]
- 11.Feyen O, Lueking A, Kowald A, Stephan C, Meyer HE, Gobel U, et al. Off-target activity of TNF-alpha inhibitors characterized by protein biochips. Anal Bioanal Chem. 2008;391:1713–20. doi: 10.1007/s00216-008-1938-7. [DOI] [PubMed] [Google Scholar]
- 12.Creighton CJ, Massarweh S, Huang S, Tsimelzon A, Hilsenbeck SG, Osborne CK, et al. Development of resistance to targeted therapies transforms the clinically associated molecular profile subtype of breast tumor xenografts. Cancer Res. 2008;68:7493–501. doi: 10.1158/0008-5472.CAN-08-1404. [DOI] [PMC free article] [PubMed] [Google Scholar]
- 13.Schaefer CF, Anthony K, Krupa S, Buchoff J, Day M, Hannay T, et al. PID: the Pathway Interaction Database. Nucleic Acids Res. 2009;37:D674–9. doi: 10.1093/nar/gkn653. [DOI] [PMC free article] [PubMed] [Google Scholar]
- 14.Hamosh A, Scott AF, Amberger JS, Bocchini CA, McKusick VA. Online Mendelian Inheritance in Man (OMIM), a knowledgebase of human genes and genetic disorders. Nucleic Acids Res. 2005;33:D514–7. doi: 10.1093/nar/gki033. [DOI] [PMC free article] [PubMed] [Google Scholar]
- 15.Milo R, Shen-Orr S, Itzkovitz S, Kashtan N, Chklovskii D, Alon U. Network motifs: simple building blocks of complex networks. Science. 2002;298:824–7. doi: 10.1126/science.298.5594.824. [DOI] [PubMed] [Google Scholar]
- 16.Bild AH, Yao G, Chang JT, Wang Q, Potti A, Chasse D, et al. Oncogenic pathway signatures in human cancers as a guide to targeted therapies. Nature. 2006;439:353–7. doi: 10.1038/nature04296. [DOI] [PubMed] [Google Scholar]
- 17.Chang JT, Carvalho C, Mori S, Bild AH, Gatza ML, Wang Q, et al. A genomic strategy to elucidate modules of oncogenic pathway signaling networks. Mol Cell. 2009;34:104–14. doi: 10.1016/j.molcel.2009.02.030. [DOI] [PMC free article] [PubMed] [Google Scholar]
- 18.Andrechek ER, Mori S, Rempel RE, Chang JT, Nevins JR. Patterns of cell signaling pathway activation that characterize mammary development. Development. 2008;135:2403–13. doi: 10.1242/dev.019018. [DOI] [PMC free article] [PubMed] [Google Scholar]
- 19.Andrechek ER, Cardiff RD, Chang JT, Gatza ML, Acharya CR, Potti A, et al. Genetic heterogeneity of Myc-induced mammary tumors reflecting diverse phenotypes including metastatic potential. Proc Natl Acad Sci U S A. 2009;106:16387–92. doi: 10.1073/pnas.0901250106. [DOI] [PMC free article] [PubMed] [Google Scholar]
- 20.Izmailov A, Yager TD, Zaleski H, Darash S. Improvement of base-calling in multilane automated DNA sequencing by use of electrophoretic calibration standards, data linearization, and trace alignment. Electrophoresis. 2001;22:1906–14. doi: 10.1002/1522-2683(200106)22:10<1906::AID-ELPS1906>3.0.CO;2-5. [DOI] [PubMed] [Google Scholar]
- 21.Yildirim MA, Goh KI, Cusick ME, Barabasi AL, Vidal M. Drug-target network. Nat Biotechnol. 2007;25:1119–26. doi: 10.1038/nbt1338. [DOI] [PubMed] [Google Scholar]
- 22.Jin G, Zhang S, Zhang XS, Chen L. Hubs with network motifs organize modularity dynamically in the protein-protein interaction network of yeast. PLoS One. 2007;2:e1207. doi: 10.1371/journal.pone.0001207. [DOI] [PMC free article] [PubMed] [Google Scholar]
- 23.Shen-Orr SS, Milo R, Mangan S, Alon U. Network motifs in the transcriptional regulation network of Escherichia coli. Nat Genet. 2002;31:64–8. doi: 10.1038/ng881. [DOI] [PubMed] [Google Scholar]
- 24.Kerrien S, Alam-Faruque Y, Aranda B, Bancarz I, Bridge A, Derow C, et al. IntAct--open source resource for molecular interaction data. Nucleic Acids Res. 2007;35:D561–5. doi: 10.1093/nar/gkl958. [DOI] [PMC free article] [PubMed] [Google Scholar]
- 25.Xenarios I, Salwinski L, Duan XJ, Higney P, Kim SM, Eisenberg D. DIP, the Database of Interacting Proteins: a research tool for studying cellular networks of protein interactions. Nucleic Acids Res. 2002;30:303–5. doi: 10.1093/nar/30.1.303. [DOI] [PMC free article] [PubMed] [Google Scholar]
- 26.Chatr-aryamontri A, Ceol A, Palazzi LM, Nardelli G, Schneider MV, Castagnoli L, et al. MINT: the Molecular INTeraction database. Nucleic Acids Res. 2007;35:D572–4. doi: 10.1093/nar/gkl950. [DOI] [PMC free article] [PubMed] [Google Scholar]
- 27.Mewes HW, Frishman D, Guldener U, Mannhaupt G, Mayer K, Mokrejs M, et al. MIPS: a database for genomes and protein sequences. Nucleic Acids Res. 2002;30:31–4. doi: 10.1093/nar/30.1.31. [DOI] [PMC free article] [PubMed] [Google Scholar]
- 28.Breitkreutz BJ, Stark C, Reguly T, Boucher L, Breitkreutz A, Livstone M, et al. The BioGRID Interaction Database: 2008 update. Nucleic Acids Res. 2008;36:D637–40. doi: 10.1093/nar/gkm1001. [DOI] [PMC free article] [PubMed] [Google Scholar]
- 29.Subramanian A, Tamayo P, Mootha VK, Mukherjee S, Ebert BL, Gillette MA, et al. Gene set enrichment analysis: a knowledge-based approach for interpreting genome-wide expression profiles. Proc Natl Acad Sci U S A. 2005;102:15545–50. doi: 10.1073/pnas.0506580102. [DOI] [PMC free article] [PubMed] [Google Scholar]
- 30.Sherr CJ, McCormick F. The RB and p53 pathways in cancer. Cancer Cell. 2002;2:103–12. doi: 10.1016/s1535-6108(02)00102-2. [DOI] [PubMed] [Google Scholar]
- 31.Doh H, Roh S, Lee KW, Kim K. Response of primed human PBMC to synthetic peptides derived from hepatitis B virus envelope proteins: a search for promiscuous epitopes. FEMS Immunol Med Microbiol. 2003;35:77–85. doi: 10.1016/S0928-8244(02)00461-3. [DOI] [PubMed] [Google Scholar]
- 32.Riggs BL, Hartmann LC. Selective estrogen-receptor modulators -- mechanisms of action and application to clinical practice. N Engl J Med. 2003;348:618–29. doi: 10.1056/NEJMra022219. [DOI] [PubMed] [Google Scholar]
Associated Data
This section collects any data citations, data availability statements, or supplementary materials included in this article.