Abstract
Cellulose synthase (CESA) complexes can be observed by live-cell imaging to move with trajectories that parallel the underlying cortical microtubules. Here we report that CESA interactive protein 1 (CSI1) is a microtubule-associated protein that bridges CESA complexes and cortical microtubules. Simultaneous in vivo imaging of CSI1, CESA complexes, and microtubules demonstrates that the association of CESA complexes and cortical microtubules is dependent on CSI1. CSI1 directly binds to microtubules as demonstrated by in vitro microtubule-binding assay.
Keywords: cell expansion, cellulose, cell walls
The control of plant cell shape, and ultimately morphology, is achieved mostly by anisotropic expansion that results from the combined effects of uniform outward turgor pressure and nonuniform counteracting resistance exerted by cell walls. Cellulose microfibrils, as the major load-bearing polymers in cell walls, are the predominant component enforcing the asymmetric cell expansion (1). In growing cells, cellulose microfibrils are laid down transversely to the axis of elongation, thus forming a spring-like structure that reinforcing the cell laterally and favoring longitudinal expansion. The predominant theory of how plant cells establish cellulose microfibril orientation has implicated the cortical microtubules (1–7). Cortical microtubules were reported to be oriented in parallel to the cellulose microfibrils during cellulose synthesis in many different cell types and organisms (2, 4), and disruption of cortical microtubules using various microtubule inhibitors disorganizes the pattern of cellulose microfibril deposition (8–11).
A recent advance in testing the role of microtubules in cellulose synthesis was made by visualizing cortical microtubule and cellulose synthase (CESA) complexes simultaneously (12). CESA complexes can be directly observed by live-cell imaging moving through the plasma membrane on trajectories that parallel the underlying cortical microtubules. When the microtubule array is disorganized by exposure to oryzalin, a microtubule-disrupting herbicide, the trajectories of the CESA particles change accordingly (12). These experiments provide convincing evidence to support the idea that the orientation of cortical microtubules specifies the spatial orientation in which cellulose microfibrils are deposited. However, this concept is an oversimplification because there are circumstances where the alignment of cellulose microfibrils apparently occurs independently of microtubules and the mechanism of interaction between microtubules and cellulose synthase complexes has not been described (2). Here, we report that the recently identified CESA interactive protein 1 (CSI1) mediates an interaction between microtubules and cellulose synthase.
Results
CSI1 Colocalizes with Cortical Microtubules.
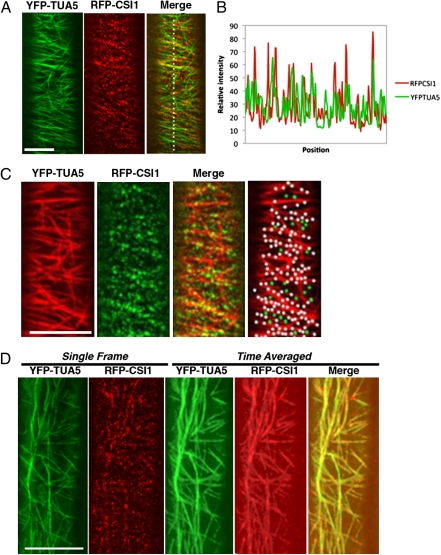
CESA complexes move along trajectories that closely parallel microtubules (12–15). We examined whether CSI1 coaligns with microtubules in a transgenic line bearing both YFP-TUA5 (an α-tubulin) and red fluorescent protein (RFP)-CSI1. The RFP-CSI1 signal overlapped with YFP-TUA5 extensively, as shown in Fig. 1A (Right) and the plot of the signal intensity (Fig. 1B). To further characterize the spatial relation between CSI1 and microtubules, we quantified their colocalization. In single optical sections of cells expressing RFP-CSI1 and YFP-TUA5, we observed 84 ± 4% (n = 6 cells from six seedlings) of RFP-CSI1 particles coaligned with microtubules (Fig. 1C and Table 1). This extensive coalignment between RFP-CSI1 and YFP-TUA5 suggests that RFP-CSI1 binds cortical microtubules (Fig. 1D).
Fig. 1.
CSI1 colocalized with cortical microtubules. (A) Two-channel confocal imaging of epidermal cells in 3-d-old dark-grown hypocotyls expressing markers for cortical microtubules (YFP-TUA5) and CSI1 (RFP-CSI1). (Scale bar, 5 μm.) (B) Plot of a line scan showing a strong correlation between the spatial localization of YFP-TUA5 and RFP-CSI1. (C) Colocalization analysis of YFP-TUA5 and RFP-CSI1. White dots represent colocalized RFP-CSI1 with microtubules. RFP-CSI1 particles that did not colocalize with microtubules are green. Analysis was performed in six cells from six seedlings (Table 1). YFP-TUA5 is displayed in pseudocolor red and RFP-CSI1 is displayed in green for better visualization in colocalization analysis. (Scale bar, 10 μm.) (D) Time-average image showing that CSI1 moved along the underlying microtubules. Average of 31 frames (duration 150 s, 5-s interval) shows identical localization of YFP-TUA5 and RFP-CSI1. (Scale bar, 10 μm.)
Table 1.
Quantification of colocalization among CSI1, CESA complexes, and microtubules
| RFP-CSI1 (A) vs. GFP-CESA6 (B) | RFP-CSI1 (A) vs. YFP-TUA5 (B) | YFP-CESA6 (A) vs. RFP-TUA5 (B) in WT | YFP-CESA6 (A) vs. RFP-TUA5 (B) in csi1 | |
| No. of colocalized voxels | 509 | 489 | 555 | 643 |
| % of material A/B colocalized | 91 ± 2%*/75 ± 3%† | 84 ± 4% | 73 ± 4% | 47 ± 11% |
| P value | <0.001 | <0.001 | <0.001 | 0.111 |
| % expected random colocalized | 41 ± 3%*/38 ± 3%† | 49 ± 6% | 46 ± 6% | 43 ± 6% |
*The percentage of RFP-CSI1 particles colocalized with GFP-CESA6.
†The percentage of GFP-CESA6 particles colocalized with RFP-CSI1.
We next examined whether the widespread colocalization of microtubules and CSI1 changes over time. Time-lapse observations of RFP-CSI1 and YFP-TUA5 revealed dynamic behavior for two molecular systems on a scale of minutes (Movie S1). Microtubules were highly dynamic and underwent the process known as “treadmilling” (i.e., growth at the leading end and shrinkage at the trailing end) at an average net growth rate of 0.5 μm/min. RFP-CSI1 particles (150 in four cells) were observed to move along trajectories coincident with microtubules, and there was no preference of association with either microtubule ends (Movie S1). Because of these dynamics, at any given time, the association between the ends of microtubules and the associated subpopulation of CSI1 particles is subject to rapid change. We propose that this effect may account for the imperfect colocalization of CSI and microtubules.
CSI1 Is a Microtubule-Binding Protein.
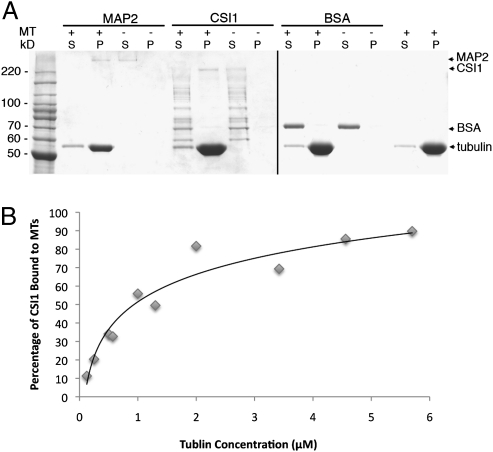
The association of CSI1 with microtubules might be through direct binding to microtubules or binding to microtubule-associated proteins (MAPs). CSI1 has multiple armadillo (ARM) repeats across the entire protein. Several ARM repeat-containing proteins have recently been shown to interact with microtubules (16–19). To test the possibility that CSI1 might directly bind microtubules, we carried out an in vitro microtubule-binding assay (20, 21). Microtubules were polymerized in vitro and mixed with a known microtubule-associated protein (MAP2, positive control), BSA (negative control), or affinity-purified, his-tagged CSI1 that had been expressed in Escherichia coli. After incubation, samples were centrifuged, and proteins present in pellet and supernatant were analyzed by SDS/PAGE (Fig. 2A). Unlike BSA but similar to MAP2, CSI1 cosedimented with polymerized tubulin. In the absence of microtubules, CSI1 remained in the supernatant. To determine the affinity of CSI1 for microtubules, a saturation-binding assay was performed where a constant amount of his-tagged CSI1 was incubated with various amounts of taxol-stabilized microtubules. CSI1 binding to microtubules was saturated at ∼2 μM, and the dissociation constant (Kd) was 1.07 ± 0.33 μM (Fig. 2B and Fig. S1). This value is comparable to the dissociation constants of well-established microtubule-binding proteins (22, 23).
Fig. 2.
CSI1 is a microtubule-binding protein. (A) Microtubule-binding assay. Coomassie-stained gels show supernatants and pellets after the microtubule-binding assay. S, supernatant fraction; P, pellet fraction; + or −, presence or absence of microtubules in the assay. The positions of positive control (MAP2), negative control (BSA), tubulin, and CSI1 are indicated by arrows. (B) Quantitative analysis of the binding properties between CSI1 and microtubules. The disassociation constant (Kd) for CSI1, determined by best fit to the data, is 1.07 ± 0.33 μM. The data were collected from three technical replicates.
CSI1 Localization Is Dependent on Microtubules and CESA Complexes.
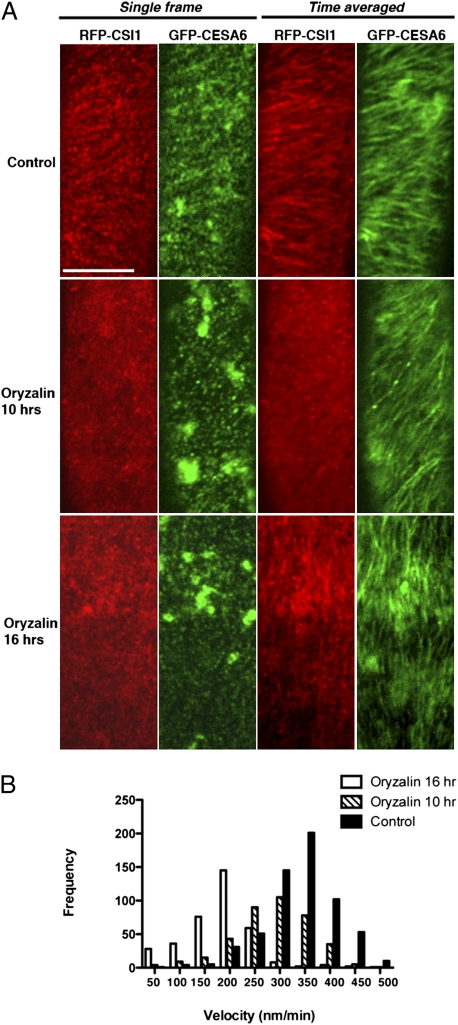
To determine whether CSI1 localization to the plasma membrane requires microtubule function, seedlings coexpressing CSI1-RFP and GFP-MAP4-MBD were treated with the microtubule-disrupting drug oryzalin. Treatment with 20 μM oryzalin for 7 h abolished microtubule arrays in epidermal cells in dark-grown seedlings and caused significant changes in CSI1 organization (n = 22 cells) (Fig. S2). CSI1 particles appeared to be disorganized and fluorescent signals were more diffuse. By contrast, oryzalin treatment did not prevent CESA complexes from moving in linear trajectories (12). We confirmed the effect of oryzalin in seedlings coexpressing CSI1-RFP and GFP-CESA6. As expected, treatment with 20 μM oryzalin for 10 h did not appreciably deplete GFP-CESA6 from the plasma membrane, and the signal continued to localize in linear trajectories although at slightly reduced rates of movement (n = 24 cells) (Fig. 3A and Movie S2). In the same seedlings, the treatment caused the CSI1-RFP signal to become diffuse, and the signal intensity of most CSI1-RFP particles was not significantly different from the background noise. Thus, the deployment of CSI1 is more sensitive than that of CESA to the loss of cortical microtubules.
Fig. 3.
Temporal distinction in localization changes upon oryzalin treatment. (A) 2-d-old dark-grown seedlings coexpressing GFP-CESA6 and RFP-CSI1 were incubated in Murashige and Skoog liquid solution containing 0.1% methanol (control) or 20 μM oryzalin. Single frame shows distribution of RFP-CSI1 and GFP-CESA6. Time average of 61 frames (5-min duration, 5-s interval) shows linear trajectories of RFP-CSI1 and GFP-CESA6. (Scale bar, 10 μm.) (B) Histogram of GFP-CESA6 particle velocities in mock control or oryzalin treatment for indicated time.
To determine whether the integrity of CESA complexes is important for membrane localization of CSI1, seedlings expressing CSI1-RFP were treated with the cellulose inhibitor isoxaben. Isoxaben was previously shown to cause rapid clearance of CESA complexes from the cell membrane (12). Thirty minutes after introduction of isoxaben, significant reductions in CSI1-RFP particle densities were observed (n = 21 cells, Fig. S3), similar to what was observed for CESA complexes upon isoxaben treatment (12). Most CSI1-RFP signals were diffuse and not significantly above the background noise.
Rate of CESA Movement Depends on Microtubules.
Although the guidance of microfibril deposition by cortical microtubules is widely accepted under most circumstances, it is an open question whether the function of microtubules extends to other attributes of cellulose synthesis. Despite the fact that GFP-CESA6 particles form uniform linear trajectories following oryzalin treatment, we observed that their velocity was reduced significantly (Fig. 3B and Movie S3) and that the trajectories were shorter than in untreated cells (n = 25 cells) (Fig. 3A and Movie S3). In cells treated with 20 μM oryzalin for 10 h, the average velocity of GFP-CESA6 particles was reduced from 353 ± 68 nm/min in control cells (n = 603) to 245 ± 72 nm/min (n = 349), a reduction of more than 30%. Longer oryzalin treatment (16 h) reduced average velocity by 54% (189 ± 45 nm/min, n = 381).
Oryzalin Phenocopies Effects of Loss of CSI1 Function.
If CSI1 functions through its interaction with microtubules, then we can predict that loss of microtubules will have effects similar to the loss of CSI1. We tested this prediction by comparing the csi1-3 null mutant to wild type treated with oryzalin. Oryzalin's effect on wild-type seedlings is exemplified by decreased elongation and stimulated radial expansion. Interestingly, oryzalin phenocopied the anisotropic growth defect in csi1 hypocotyls (Figs. S4 and S5A). If CSI1 mediates the interaction between microtubules and CESA complexes, then we can predict that csi1 hypocotyls will be insensitive to oryzalin. Indeed, quantification of hypocotyl length for 4-d-old dark-grown seedlings on increasing concentrations of oryzalin revealed that csi1-3 is less sensitive to oryzalin treatment at higher concentrations (Fig. S5B). We next examined CESA complex velocity (Fig. S5 C–F). The average velocity of GFP-CESA6 particles in csi1-3 was indistinguishable from wild type under prolonged oryzalin treatment (Fig. S5F). Additionally, treating csi1 seedlings with oryzalin, for 10 or 16 h, caused no further reduction in velocity of CESA movement. Taken together, these data are compatible with the idea that some of oryzalin's effect on morphology and essentially all of its effect on CESA velocity are mediated via CSI1.
Loss of CSI1 Delocalizes CESA Complexes from Microtubules.
Loss of CSI1 has a significant effect on the dynamics of CESA complexes, an effect that was fully phenocopied by the loss of microtubules (Fig. S4). Therefore, we next examined the relation between microtubules and CESA complexes in a csi1 null background. In optical sections of wild type expressing both RFP-TUA5 and YFP-CESA6, more than 73 ± 4% of YFP-CESA6 particles (n = 6 cells from six seedlings) coaligned with microtubules (Fig. 4 and Table 1). In contrast, in csi1-3, around 47 ± 11% of YFP-CESA6 particles were coaligned with microtubules in cells (n = 6 cells from five seedlings (Fig. 4 and Movie S4), an extent of overlap that was indistinguishable from random colocalization (43 ± 6%) (Table 1). These results indicate that CSI1 mediates a direct interaction between CESA complexes and microtubules.
Fig. 4.
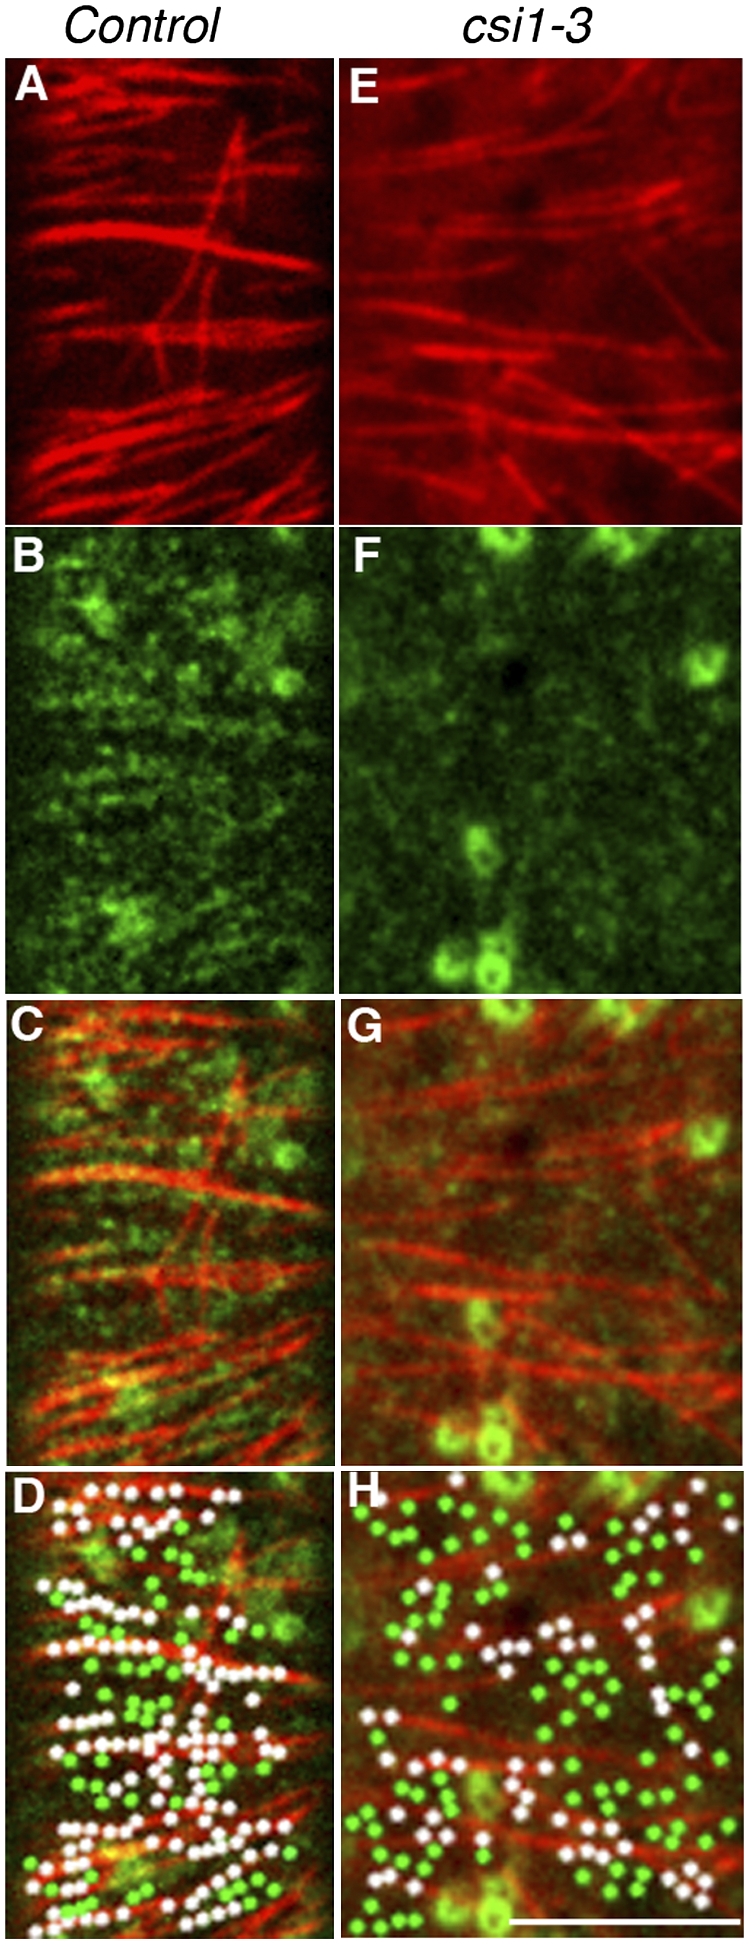
Mis-alignment of CESA complexes and cortical microtubules in csi1. Single optical section of epidermal cells in 3-d-old dark-grown hypocotyls expressing RFP-TUA5 and YFP-CESA6 in wild type (A–D) or csi1-3 (E–H). (A and E) RFP-TUA5. (B and F) YFP-CESA6. (C and G) Merge. (D) Representative image from five cells used for colocalization analysis (Table 1). In the wild-type cell shown here, observed coincidence is 71% and expected random coincidence is 42%. (H) Representative image from six cells used for colocalization analysis (Table 1). In the csi1-3 cell shown here, 60/150 (40%) of YFP-CESA6 particles were coaligned with microtubules in cells, which is not significantly different from the expected random coincidence of 69/178 (39%). White dots represent YFP-CESA6 particles that coincide with microtubules. YFP-CESA6 particles that did not colocalize with microtubules are green. (Scale bar, 5 μm.)
Association of CESA Complexes and Cortical Microtubules Is Dependent on CSI1.
Previously, RFP-labeled CSI1 was shown to at least partially colocalize with GFP-CESA3 protein at the level of resolution of confocal microscopy (24). To more closely examine the spatial relationship between CSI1 and CESA complexes, we carried out two-channel confocal imaging of epidermal cells in dark-grown hypocotyls of a line carrying RFP-CSI1 and GFP-CESA6. Similar to previously noted colocalization of RFP-CSI1 and GFP-CESA3 (24), the RFP-CSI1 signal extensively overlapped with labeled CESA6 at the plasma membrane. However, despite their extensive overlap, the distribution patterns were not identical, as evident in Fig. S6A (Right) and the plot of signal intensities in Fig. S6B. Quantification of the colocalization showed about 75 ± 3% of GFP-CESA6 particles (n = 5 cells from five seedlings) colocalized with RFP-CSI1 particles (Fig. S6C and Table 1). Further indicating the similarity of localization, the dynamics of these two molecular components were nearly identical (Fig. S7 and Movie S5). The mean velocity is 337 ± 157 nm/min for RFPCSI1 (n = 686 particles) and 361 ± 163 nm/min for GFP-CESA6 (n = 646 particles). The frequency distribution of velocity for RFPCSI1 was similar to that of GFP-CESA6 previously reported (12, 13).
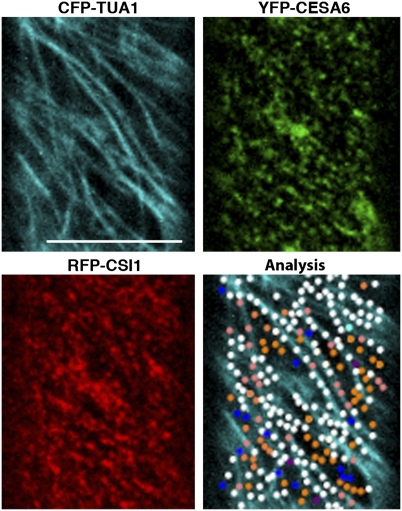
About 75 ± 3% of GFP-CESA6 particles (n = 5 cells from five seedlings) colocalized with RFP-CSI1 particles, and a similar percentage, about 73 ± 4% of the YFP-CESA6 particles, colocalized with microtubules (n = 6 cells from six seedlings). We reasoned that the population of microtubule-coaligned CESA complexes might be the same population that colocalized with RFP-CSI1. To further characterize the spatial relation among CSI1, CESA complexes, and microtubules, we quantified their colocalization in triple-labeled line-expressing CFP-TUA1, YFP-CESA6, and RFP-CSI1 (Fig. 5). In triple-labeled line, the percentage of colocalization between CSI1 and CFP-TUA1 was 82 ± 4% (n = 3 cells from three seedlings), and the percentage of colocalization between YFP-CESA6 and CFP-TUA1 was 76 ± 5%, similar to that observed in double-labeled line (Fig. 1C and Table 1). For all YFP-CESA6 particles colocalized with CFP-TUA1 (n = 3 cells from three seedlings), only 3 of 511 YFP-CESA6 particles were absent of accompanying RFP-CSI1. These results indicate that the association of CESA complexes and cortical microtubules is dependent on CSI1.
Fig. 5.
Colocalization of CESA complexes, CSI1, and cortical microtubules. Quantification of colocalization pattern in three-channel imaging of epidermal cells expressing CFP-TUA1, YFP-CESA6, and RFP-CSI1 (n = 3 cells from three seedlings). Shown is a representative image from three cells used for colocalization analysis. White dots represent colocalized CFP-TUA1, YFP-CESA6, and RFP-CSI1. Orange dots represent colocalized YFP-CESA6 and RFP-CSI1 but not CFP-TUA1. Pink dots represent colocalized RFP-CSI1 and CFP-TUA1 but not YFP-CESA6. Cyan dots represent colocalized CFP-TUA1 and YFP-CESA6 but not RFP-CSI1. Blue dots represent YFP-CESA6 that did not colocalize with others. Purple dots represent RFP-CSI1 that did not colocalize with others. (Scale bar, 10 μm.)
Discussion
The microtubule–microfibril alignment hypothesis, since its first appearance in the literature in 1962 (1), has stimulated numerous tests over the past five decades. A convincing experiment in support of microtubule–microfibril alignment model came from the observation that CESA complexes associate with cortical microtubules through simultaneous imaging of these two components in live cells (12). It has been proposed that cellulose synthases associate with microtubules directly or through linker proteins, but, to date, no such interactions have been documented or linker proteins identified. Results presented here suggest that CSI1 functions as a molecular bridge between microtubules and cellulose synthase complexes. In csi1 mutants, CESA complexes delocalize from microtubules, presumably due to the unavailability of the CSI1 link (Fig. S8).
CSI1 was identified using CESA6 as bait in a yeast two-hybrid assay and later was found to interact with multiple primary CESAs (24). Live-cell imaging shows that RFP-CSI1 shares a localization pattern with GFP-CESA3 (24) and GFP-CESA6 (Fig. S6), indicating that CSI1 associates with cellulose synthase in vivo. Simultaneous imaging of CSI1 and CESA demonstrated that each protein travels bidirectionally at indistinguishable speed (Fig. S7), as expected for colocalized proteins. The colocalization of YFP-CESA6 and CFP-TUA1 requires the presence of RFP-CSI1 (Fig. 5), suggesting that CSI1 links CESA complexes to cortical microtubules. Supporting this suggestion, full-length CSI1 expressed and purified from E. coli interacts with microtubules in vitro to a similar extent as MAP2. The observations that CSI1 is a bona-fide MAP that associates with cellulose synthase (13) satisfy the requirements for a putative linker protein.
The hypothesis that CSI1 mediates the interaction between microtubules and cellulose synthase makes two predictions: (i) that the CESA distribution depends on the interaction between CSI1 and microtubules and (ii) that the loss of either CSI1 or cortical microtubules will lead to a similar effect on cellulose synthase. Our results are consistent with both predictions. CESA distribution is dramatically affected in the csi1 null mutants where CSI1 is unavailable to link the CESA complex to the microtubules. And further, removal of microtubules in csi1 by oryzalin treatment has no additional effect on CESA distribution. Loss of cortical microtubules by oryzalin treatment led to disorganized CESA distribution and reduced CESA velocities that are similar to what we observed in the csi1 mutant. Furthermore, CESA mis-aligned with microtubules in the csi1 mutant, indicating that coalignment of CESA and microtubules is dependent on CSI1. Thus, characterization of the CSI1 protein may facilitate dissection of the molecular mechanisms by which microtubules guide the deposition of cellulose microfibrils.
Materials and Methods
Plant Materials and Growth Conditions.
Arabidopsis thaliana L. seeds were surface-sterilized, stratified at 4 °C for 4 d, plated on Murashige and Skoog (MS) plates (1/2 × MS salts, 0.8% agar, 0.05% MES, pH 5.7), and grown vertically at 22 °C in darkness for 3 d before imaging. All material was in the Columbia background. For soil-grown plants, seedlings were germinated and grown on MS plates containing 1% sucrose for 7 d and then transferred to pots in an Arabidopsis growth chamber (Percival) at 22 °C under a 16-h light and 8-h dark cycle.
Transgenic Lines.
GFP-CESA3 and GFP-CESA6 seeds were provided by H. Höfte (Institut Jean-Pierre Bourgin, Versailles, France; ref. 14). CSI1-RFP plants were as described previously (24) and crossed with GFP-CESA3 or GFP-CESA6 to create double-labeled transgenic lines. YFP-CESA6 seeds were provided by R. Gutierrez (Carnegie Institution for Science, Stanford, CA) and crossed with CSI1-RFP to create double-labeled transgenic lines. CFP-TUA1 seeds were provided by R. Gutierrez (13) and crossed with YFP-CESA6/RFP-CSI1 to generate triple-labeled transgenic lines. mCherry-TUA5 constructs were provided by R. Gutierrez and transformed into a line expressing YFP-CESA6 in the csi1-3 mutant background by Agrobacterium-mediated transformation to generate double-labeled lines. YFP-CESA6 and mCherry-TUA5 double-labeled lines were provided by R. Gutierrez. A line expressing GFP-MAP4 was a gift from A. Paredez (University of California, Berkeley, CA) and was crossed with RFP-CSI1 to create double-labeled transgenic lines.
Confocal Microscopy.
Imaging was performed on a Yokogawa CSUX1spinning disk system featuring a DMI6000 Leica motorized microscope, a Photometrics QuantEM:512SC CCD camera, and a Leica 100×/1.4 n.a. oil objective. An ATOF laser with three laser lines (440/491/561 nm) was used to enable fast shuttering and switching between different excitations. Band-pass filters (485/30 nm for CFP; 520/50 nm for GFP; 535/30 nm for YFP; 620/60 nm for RFP) were used for emission filtering. Image analysis was performed using Metamorph (Molecular Devices), ImageJ software (version 1.36b; http://rsbweb.nih.gov/ij/), V3.8 (Shenzhen), and Imaris (Bitplane) software.
Drug Treatments.
For live-cell imaging, 2-d-old dark-grown seedlings were submerged in MS liquid medium containing the drug and incubated in darkness for a variable length of time. For short-term treatment, 3-d-old dark-grown seedlings were mounted in MS liquid medium containing drug and imaged at various time points. Oryzalin was dissolved in dimethyl sulfoxide (DMSO) to create stock solutions. Stocks were diluted using Murashige and Skoog solution immediately before each experiment. For mock treatment, seedlings were incubated in appropriately diluted DMSO solution.
Protein Expression.
For protein expression in E. coli, the full-length CSI1 coding sequence was fused to the His6 tag sequence at the C terminus and expressed in BL21 DE3 cells. Fusion proteins were expressed at 15 °C for 4 h after induction with 1 mM isopropyl-β-d-thiogalactopyranoside. Fusion proteins were purified from soluble fractions of cell lysates by nickel (Ni-NTA, Qiagen) affinity chromatography. For binding, nickel-Sepharose beads were incubated in a phosphate buffer containing 50 mM NaH2PO4 (pH 8.0), 300 mM NaCl, and 20 mM imidazole. The proteins were eluted with phosphate buffer containing 50 mM NaH2PO4 (pH 8.0), 300 mM NaCl, and 250 mM imidazole and dialyzed against the microtubule-binding assay buffer (see below).
In Vitro Microtubule-Binding Assay.
Bovine tubulin and bovine MAP2 were obtained commercially (Cytoskeleton). The microtubule-binding assay was performed according to the manufacturer's instructions (Cytoskeleton). Briefly, to assemble microtubules in vitro, purified tubulin was incubated in assay buffer [80 mM 1,4-piperazinediethanesulfonic acid (Pipes), 2 mM MgCl2, 0.5 mM EGTA, and 1 mM GTP, pH 7.0] at 35 °C for 20 min. After assembly, taxol was added (final concentration 20 μM) to stabilize the microtubules. About 10 μg of taxol-stabilized microtubules were used for each binding assay. Before use in the assay, fusion proteins were spun in a Beckman Airfuge at 18 lb/sq in. (120,000 × g) for 40 min, and the supernatant collected. After incubation of proteins with or without microtubules at room temperature for 30 min, samples were spun in the Airfuge at 16 lb/sq (100,000 × g) for 40 min at room temperature onto a 100-μL cushion (60% glycerol in assay buffer). The supernatant and pellet were collected and analyzed by SDS/PAGE.
For measurement of binding affinity, taxol-stabilized microtubules were prepared as described above, and various concentrations were incubated with 0.7 μM purified CSI1 protein for 30 min at room temperature. After centrifugation, 5 μL of each pellet was resolved by SDS/PAGE and visualized by Coomassie blue staining. Protein levels were quantified from transmission images by commercial software (GeneTools; Syngene). The dissociation constant (Kd) for CSI1 binding to taxol-stablized microtubules was determined by best fit to the data according to the equation: q = (qmax × c)/(Kd + c).
Supplementary Material
Acknowledgments
We thank R. Cyr and D. Fisher for their assistance on microtubule-binding assay; R. Gutierrez, D. Ehrhardt, and H. Höfte for providing constructs and transgenic A. thaliana seeds; and R. Cyr and T. Baskin for helpful discussions. This work was supported, in part, by start-up funds from the Department of Biochemistry and Molecular Biology, Pennsylvania State University and by grants from the National Science Foundation (1121375), the Department of Energy (DOE-FG02-03ER20133), and the Center for LignoCellulose Structure and Formation, an Energy Frontier Research Center funded by the Department of Energy, Office of Science.
Footnotes
The authors declare no conflict of interest.
1S.L. and L.L. contributed equally to this work.
This article contains supporting information online at www.pnas.org/lookup/suppl/doi:10.1073/pnas.1118560109/-/DCSupplemental.
References
- 1.Green PB. Mechanism for plant cellular morphogenesis. Science. 1962;138:1404–1405. doi: 10.1126/science.138.3548.1404. [DOI] [PubMed] [Google Scholar]
- 2.Baskin TI. On the alignment of cellulose microfibrils by cortical microtubules: A review and a model. Protoplasma. 2001;215:150–171. doi: 10.1007/BF01280311. [DOI] [PubMed] [Google Scholar]
- 3.Giddings TH, Staehelin LA. Microtubule-mediated control of microfibril deposition: A re-examination of the hypothesis. In: Lloyd CW, editor. The Cytoskeletal Basis of Plant Growth and Form. London: Academic; 1991. pp. 85–99. [Google Scholar]
- 4.Heath IB. A unified hypothesis for the role of membrane bound enzyme complexes and microtubules in plant cell wall synthesis. J Theor Biol. 1974;48:445–449. doi: 10.1016/s0022-5193(74)80011-1. [DOI] [PubMed] [Google Scholar]
- 5.Herth W. Calcofluor white and Congo red inhibit chitin microfibril assembly of Poterioochromonas: Evidence for a gap between polymerization and microfibril formation. J Cell Biol. 1980;87:442–450. doi: 10.1083/jcb.87.2.442. [DOI] [PMC free article] [PubMed] [Google Scholar]
- 6.Ledbetter MC, Porter KR. A “microtubule” in plant cell fine structure. J Cell Biol. 1963;19:239–250. doi: 10.1083/jcb.19.1.239. [DOI] [PMC free article] [PubMed] [Google Scholar]
- 7.Lloyd C, Chan J. The parallel lives of microtubules and cellulose microfibrils. Curr Opin Plant Biol. 2008;11:641–646. doi: 10.1016/j.pbi.2008.10.007. [DOI] [PubMed] [Google Scholar]
- 8.Brower DL, Hepler PK. Microtubules and secondary wall deposition in xylem: The effects of isopropyl N-phenylcarbamate. Protoplasma. 1976;87:91–111. doi: 10.1007/BF01623961. [DOI] [PubMed] [Google Scholar]
- 9.Hardham AR, Gunning BES. Interpolation of microtubules into cortical arrays during cell elongation and differentiation in roots of Azolla pinnata. J Cell Sci. 1979;37:411–442. doi: 10.1242/jcs.37.1.411. [DOI] [PubMed] [Google Scholar]
- 10.Hepler P, Palevitz BA. Microtubules and microfilaments. Annu Rev Plant Physiol. 1974;25:309–362. [Google Scholar]
- 11.Itoh T. Microfibrillar orientation of radially enlarged cells of coumarin- and colchicine-treated pine seedlings. Plant Cell Physiol. 1976;17:385–398. [Google Scholar]
- 12.Paredez AR, Somerville CR, Ehrhardt DW. Visualization of cellulose synthase demonstrates functional association with microtubules. Science. 2006;312:1491–1495. doi: 10.1126/science.1126551. [DOI] [PubMed] [Google Scholar]
- 13.Gutierrez R, Lindeboom JJ, Paredez AR, Emons AM, Ehrhardt DW. Arabidopsis cortical microtubules position cellulose synthase delivery to the plasma membrane and interact with cellulose synthase trafficking compartments. Nat Cell Biol. 2009;11:797–806. doi: 10.1038/ncb1886. [DOI] [PubMed] [Google Scholar]
- 14.Desprez T, et al. Organization of cellulose synthase complexes involved in primary cell wall synthesis in Arabidopsis thaliana. Proc Natl Acad Sci USA. 2007;104:15572–15577. doi: 10.1073/pnas.0706569104. [DOI] [PMC free article] [PubMed] [Google Scholar]
- 15.Crowell EF, et al. Pausing of Golgi bodies on microtubules regulates secretion of cellulose synthase complexes in Arabidopsis. Plant Cell. 2009;21:1141–1154. doi: 10.1105/tpc.108.065334. [DOI] [PMC free article] [PubMed] [Google Scholar]
- 16.Smith EF, Lefebvre PA. PF16 encodes a protein with armadillo repeats and localizes to a single microtubule of the central apparatus in Chlamydomonas flagella. J Cell Biol. 1996;132:359–370. doi: 10.1083/jcb.132.3.359. [DOI] [PMC free article] [PubMed] [Google Scholar]
- 17.Smith HM, Raikhel NV. Nuclear localization signal receptor importin alpha associates with the cytoskeleton. Plant Cell. 1998;10:1791–1799. doi: 10.1105/tpc.10.11.1791. [DOI] [PMC free article] [PubMed] [Google Scholar]
- 18.Neilson LI, et al. cDNA cloning and characterization of a human sperm antigen (SPAG6) with homology to the product of the Chlamydomonas PF16 locus. Genomics. 1999;60:272–280. doi: 10.1006/geno.1999.5914. [DOI] [PubMed] [Google Scholar]
- 19.Sapiro R, et al. Sperm antigen 6 is the murine homologue of the Chlamydomonas reinhardtii central apparatus protein encoded by the PF16 locus. Biol Reprod. 2000;62:511–518. doi: 10.1095/biolreprod62.3.511. [DOI] [PubMed] [Google Scholar]
- 20.Mollinari C, et al. PRC1 is a microtubule binding and bundling protein essential to maintain the mitotic spindle midzone. J Cell Biol. 2002;157:1175–1186. doi: 10.1083/jcb.200111052. [DOI] [PMC free article] [PubMed] [Google Scholar]
- 21.Huang TG, Hackney DD. Drosophila kinesin minimal motor domain expressed in Escherichia coli. Purification and kinetic characterization. J Biol Chem. 1994;269:16493–16501. [PubMed] [Google Scholar]
- 22.Wicker-Planquart C, Stoppin-Mellet V, Blanchoin L, Vantard M. Interactions of tobacco microtubule-associated protein MAP65-1b with microtubules. Plant J. 2004;39:126–134. doi: 10.1111/j.1365-313X.2004.02115.x. [DOI] [PubMed] [Google Scholar]
- 23.Curmi PA, et al. The stathmin/tubulin interaction in vitro. J Biol Chem. 1997;272:25029–25036. doi: 10.1074/jbc.272.40.25029. [DOI] [PubMed] [Google Scholar]
- 24.Gu Y, et al. Identification of a cellulose synthase-associated protein required for cellulose biosynthesis. Proc Natl Acad Sci USA. 2010;107:12866–12871. doi: 10.1073/pnas.1007092107. [DOI] [PMC free article] [PubMed] [Google Scholar]
Associated Data
This section collects any data citations, data availability statements, or supplementary materials included in this article.


