Abstract
Pheochromocytoma is the most common tumor of the adrenal medulla in adults. The lack of sensitive animal models of pheochromocytoma has hindered the study of this tumor and in vivo evaluation of antitumor agents. In this study we generated two sensitive luciferase models using bioluminescent pheochromocytoma cells: an experimental metastasis model to monitor tumor spreading and a subcutaneous model to monitor tumor growth and spontaneous metastasis. These models offer a platform for sensitive, non- invasive and real-time monitoring of pheochromocytoma primary growth and metastatic burden to follow the course of tumor progression and for testing relevant antitumor treatments in metastatic pheochromocytoma.
Keywords: Pheochromocytoma, metastasis, luminescence, BLI, animal model
1. Introduction
Pheochromocytoma is a rare neuroendocrine tumor that develops in the adrenal medulla and represents the most common tumor in this location in adults [1]. Closely related tumors in other locations are classified as paragangliomas. Although often sporadic, pheochromocytoma/paraganglioma may present in several familial syndromes, and certain subtypes are particularly prone to malignancy [2]. The risk of developing metastases can be 30%, or higher, depending on the genetic background and location of the primary tumor [3; 4]. In particular, metastatic lesions in the liver and lungs are associated with shorter (usually less than 5 years) survival rate [5; 6]. Currently there is no curative treatment for this disease. Several therapeutic options can relieve patient symptoms, but relapses occur [7; 8]. The lack of novel therapies, especially novel targeted therapies, is in part due to the lack of suitable animal models. All efforts to establish cell lines from primary human pheochromocytomas and paragangliomas have been unsuccessful because the cells survive but do not proliferate in vitro [9]. It is therefore important to develop reliable animal models for sensitive screening and preclinical testing of novel antitumor compounds [10; 11; 12].
Successful treatment of any metastatic cancer depends on early detection and localization [13; 14]. Despite excellent improvements in various imaging techniques, small metastatic lesions are often not detected because of suboptimal spatial resolution of current anatomical and functional imaging modalities. The same applies to animal models of metastatic cancer. Optimal use of animal models for the development of new therapeutic approaches should therefore employ optimal imaging techniques.
In recent years, several non invasive imaging techniques, including magnetic resonance imaging (MRI) and computed tomography (CT), have been adapted to imaging studies in small laboratory animals [15]. One of the methods used recently for non-invasive tracking of tumor cells in experimental animals is the use of luciferase bioluminescence[16]. Bioluminescence refers to the enzymatic generation of visible light by living organisms. Currently, the most common luminescence reporter used is the firefly luciferase [17], which in the presence of oxygen (O2) and ATP, catalyses the cleavage of the substrate luciferin and results in the emission of a photon of light [18]. In vivo implantation of tumor cells transfected or transduced with the luciferase gene allows sequential monitoring of tumor growth within the viscera by measuring these photon signals. This technology is reshaping efficacy evaluations and drug-target algorithms in drug animal testing for several tumor types [19; 20]. No reports to date have evaluated the use of this technology in pheochromocytoma cell models of tumor growth and metastasis in vivo. For these reasons we generated a bioluminescent pheochromocytoma cell line and we injected these cells into immunocompromised nude mice for the real time monitoring of tumor and metastatic burden. Here we report the development and characterization of two animal models of pheochromocytoma using bioluminescence for rapid and quantifiable tumor measurement and identification of tumor metastasis in real time in vivo and ex vivo. We examined the animals using serial magnetic resonance imaging in parallel for comparison with the bioluminescence imaging, which allows for sensitive and quantitative detection of early tumor development.
2. Material and Methods
2.1 Cell line and reagents
The mouse pheochromocytoma cell line MTT was maintained in DMEM supplemented with 10% FBS, 5% Horse Serum (Gibco), and antibiotic/antimycotic. Cells were grown until 80% confluence, then detached using 0.05% Trypsin/EDTA, incubated for 3 minutes at 37° C and resuspended and counted to obtain a concentration of 5 × 10^5 cells/200 μl before injection. D-luciferin potassium salt (Caliper LifeSciences) was diluted in PBS at a concentration of 15mg/ml, filter-sterilized using a 0.22um filter, aliquoted and stored at −20° C until use.
2.2 pLLuc construct and retroviral transduction
The EGFP gene in the retroviral vector pLEGFP-N1 (Clontech) was replaced with the firefly luciferase gene generated via PCR from the pGL3-Basic (Promega) vector and inserted between the BamH-1 and Not-1 sites resulting in the pLLuc retroviral vector. The retrovirus packaging cell line Amphopak-293 (Clontech) was transfected with the pLLuc retroviral vector to generage 293pLLuc cells. Selection with G418 enabled the generation of stably transfected 293pLLuc cells. Target cells were transduced by incubating them overnight with conditioned medium obtained from 293 pLLuc cells containing retroviral particles filtered through a 0.45 μm filter to remove any cellular debris. Transduced cells were selected with G418 to generate stable cell lines expressing luciferase.
2.3 Animal experiment and bioluminescence imaging (BLI)
All animal studies were conducted in accordance with principles and procedures outlined in the NIH Guide for the Care and use of Animals and approved by the NIH ACUC Committee. Five hundred thousand MTT-luc cells were injected into the tail vein of female athymic nude mice (Taconic, Germantown, MD). Experimental groups consisted of 10-weeks-old mice (n=6) housed in a pathogen-free facility. The animals were imaged weekly by both bioluminescence imaging (BLI) and magnetic resonance imaging (MRI) (described below). Mice were anesthetized with isofluorane for imaging, and euthanized using CO2 inhalation and cervical dislocation. Several organs from the mice were dissected and preserved in 10% formalin.
2.4 MRI
For MRI, anesthesia was induced in a chamber with 5% isoflurane in an 80%/20% medical air/oxygen mixture. Mice were then transferred to a cradle with a built in mask and anesthesia was maintained at 30–45 breaths per minute with 1–2% isoflurane. Temperature was maintained by blowing heated air through the bore of the scanner (Bair- Hugger/Arizant, Eden Prarie, MN). All scans were performed using a 7 Tesla Bruker Biospec system (Bruker-Biospin, Billerica, MA) and a 35mm linear bird cage coil. Each data set consisted of an initial locator scan, followed by a T2-weighted scan, and a proton density weighted scan. To reduce motion artifacts, the acquisition was gated so that acquisition occurred between breaths (Small Animal Instruments, Inc. Stony Brook, NY). T2-weighted images consisted of twelve 1mm slices over a 6×3cm FOV acquired using a RARE (Rapid Acquisition Relaxation Enhanced) sequence. The image matrix was 256×256 and 4 echoes were acquired per excitation. The effective echo time was 20.6ms. Proton density weighted images consisted of twelve 1.5mm slices over a 3×3cm FOV acquired using a FLASH (Fast Low Angle Snapshot) sequence. The image matrix was 256×256, TE was 3ms, and the excitation flip angle was 30 degrees.
2.5 Bioluminescence imaging
All bioluminescent data were collected and analyzed with a Xenogen IVIS system. In vitro imaging, MTT-luc bioluminescent cells were serially diluted from 4000 to 8 cell in DMEM media in a 96 well plate, and D-luciferin at a concentration of 150 ug/ml was added directly to the media 10 minutes before imaging. Imaging was performed at 20 seconds/plate.
For in vivo imaging luciferase activity was assessed in anesthetized animals (1–2% isoflurane) 15 min following i.p. administration of 150mg/kg luciferin in phosphare buffered saline. The mice were then placed inside the camera box under continous exposure to 1–2% isofluorane. The experiments were performed in the NIH Mouse Image Facility in accordance to ACUC regulations.
All imaging variables were equalized and photographic and bioluminescent images at different time points were collected for each sample. The bioluminescence data are presented visually as a color overlay on the photographic image. Using the Living Image software (Xenogen), a region of interest (ROI) was drawn around tumor sites of interest and total photons count or photons/s was quantified. For ex vivo imaging, Luciferin was injected into the animal i.p. before necropsy. Tissues of interest were then resected and placed in a culture plate with 300 ug/ml D-luciferin in PBS.
2.6 Histopathology
In order to confirm the presence of pheochromocytoma tumor cells, selected tissues were removed from the mice and preserved in 10% formalin immediately after ex vivo imaging. Tissues were paraffin embedded, sectioned, stained with hematoxylin and eosin, and examined by microscopy using a Leica microscope.
2.7 Statistical analysis
Tumor volume and mean bioluminescence was determined for each experiment together with the standard errors of the mean. To illustrate the relationship between bioluminescent signal, tumor volume and cell number a regression plot was used.
3. Results
3.1 Generation of stably transduced luciferase expressing MTT cells
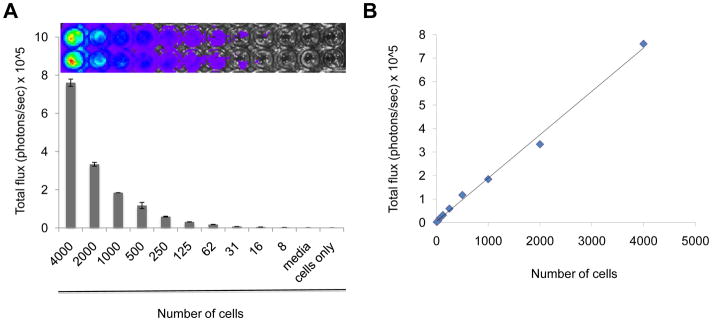
We have previously described the generation of the aggressive, rapidly growing mouse pheochromocytoma cell line MTT from liver metastasis of the slower-growing MPC cells [21; 22]. For retroviral delivery and expression of luciferase in MTT cells, we first generated the construct pLLuc via replacement of EGFP with a luciferase gene between the BamH-1 and Not-1 sites of the retroviral vector pLEGFP. This construct employs the human cytomegalovirus (CMV) immediate early promoter to drive firefly luciferase expression while the expression of the neomycin resistance gene is driven by a separate constitutively active viral promoter contained within the 5′ LTR. After transfection with the pLLuc and selection with G418 of the packaging cell line Amphopak-293, filtered conditioned medium from the stably transfected 293-LLuc cells containing retroviral particles was used to transduce MTT cells. The infected MTT cells were then selected with G418 for four weeks to obtain stably transduced MTT-Luc cells. Quantitation of firefly luciferase expression in MTT-Luc cells was done by directly adding a luciferin substrate into the culture medium of plated cells. Luminescence was imaged to obtain photon/s per cell 15 minutes after addition of the substrate. As shown in Figure 1 (panel A), serial dilutions of these cells showed a proportional decrease in mean photon emission, with an average of 200 photons/s per cell, indicating a stable and sustained intensity of the bioluminescence signal. We named this new cell line MTT-luc. Analysis of covariation between number of cells plated and light intensity (total photon flux) showed a highly significant correlation (R2 = 0.995) as illustrated in Figure 1B.
Figure 1.
(A) Bioluminescence signal of the murine pheochromocytoma MTT-luc cells in vitro. MTT-luc cells were diluted from 4,000 to 8 cells, plated in duplicate in a 96 well plate and imaged for 20 seconds after addition of luciferin to the media. Media alone (Media; luciferin added) and 4,000 cells (Cells only; no luciferin) were used as negative controls. (B) Correlation plot of photon counts vs. number of plated cells (R2 = 0.99)
3.2 Detection and non-invasive BLI monitoring of MTT-luc cells in an experimental metastasis model
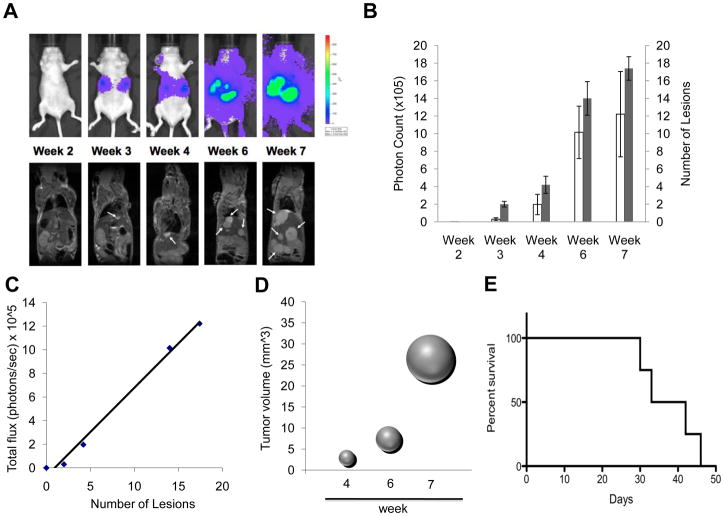
We then used a tail vein (experimental metastasis) injection of MTT-luc cells to evaluate the sensitivity of BLI to detect experimental metastasis after systemic circulation of the tumor cells. Mice were imaged immediately after injection to verify the success of the procedure (data not shown) and subsequently imaged over time by BLI over a 7-weeks period. Images of a representative nude mouse are shown in Figure 2A (upper sequence). In parallel, animals were subjected to serial MRI. Shown in Figure 2A (lower sequence) are images of the same mouse over the same time period.
Figure 2.
Kinetics of tumor cell growth by Bioluminescence and MRI signals in vivo in an experimental metastasis model. MTT-cells (5 × 10⁵) were injected via tail vein into nude mice (n= 6). Images were taken weekly for 7 weeks. (A) Representative images are shown of the same mouse by bioluminescence detection (upper row) and MRI scanning (lower row). Arrows indicate some of the tumor lesions as evidenced by MRI imaging. (B) Quantification of tumor signal over time is represented as mean photon counts (total flux) compared with quantification of number of lesions counted on the MRI images s represented as mean; error bars represent standard error of the mean. In MRI the lesions were counted and measured using OsiriX software. (C) Correlation plot of photon counts vs. number of lesions (R2 = 0.99). (D) Bubble plot representation of metastatic tumor progression as spheres calculated from averaged tumor mass diameters measured by MRI imaging. (E) Kaplan-Meier plot illustrating animal survival following intravenous injection of tumor cells.
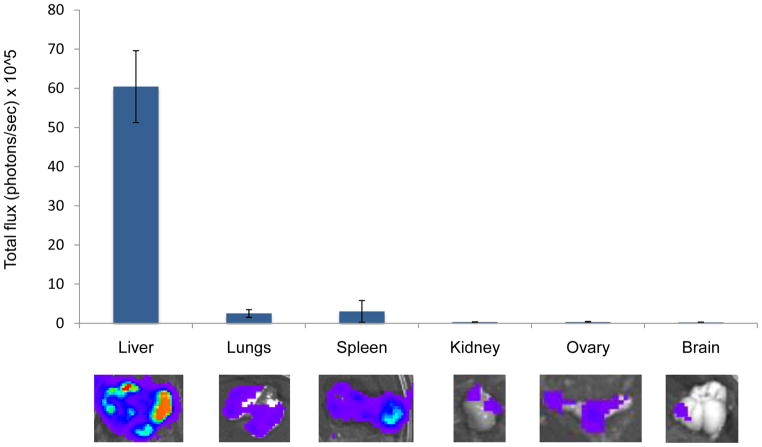
The results show that tumor signals increased significantly over the seven weeks of the study with exponential growth seen especially localized in the upper abdominal cavity. As expected, localized bioluminescent signals indicating metastasis began to appear in the area of the liver and were detectable at an early stage of development, starting at the second week post-injection. By the third week, several areas of tumor growth were evident by both BLI and MRI. Total photon flux from tumors seen in BLI was found to correlate well with the number of lesions observed by MRI (Figure 2B). An analysis of covariation between number of metastatic lesion as counted on the MRI image and bioluminescent light intensity (total photon flux) shows a highly significant correlation (R2 = 0.992) as illustrated in Figure 2C. By the 4th week the tumor masses were clearly identifiable by MRI. Figure 2D illustrates the progression of tumor size over time from the 4th week represented as a sphere from averaged tumor diameters calculated by MRI analysis. The survival curve representation for this model is shown in Figure 2E. At necropsy, several organs were excised, imaged ex vivo and preserved for histological evaluation. Ex vivo bioluminescence confirmed the presence of MTT-luc metastasis in the liver and in several other organs, including lungs, spleen, ovaries, kidney and brain (Figure 3 and Table 1). The total photons/sec of the organs were quantified for each animals (n = 6) and mean values are displayed in Figure 3.
Figure 3.
Ex vivo analysis of organ metastasis by bioluminescence in the experimental metastasis model. Fifteen minutes after luciferin injection, the animals were euthanized and internal organs analyzed for bioluminescence signals. Representative images of internal organs are shown (lower panel); photons/sec emitted by each organ were averaged and are represented in the upper panel, including standard deviations.
Table 1.
Comparison of number of metastatic lesions in the two animal models (metastatic-take).
| Experimental metastasis model (tail vein injection) | Spontaneous metastasis model (subcutaneous injection) | |
|---|---|---|
| Liver | 6/6 (100 %) | 8/8 (100 %) |
| Lungs | 6/6 (100 %) | 8/8 (100 %) |
| Brain | 4/6 (66 %) | 6/8 (75 %) |
| Spleen | 6/6 (100 %) | 2/8 (25 %) |
| Ovary | 4/6 (66 %) | 5/8 (62 %) |
| Kidney | 1/6 (16%) | 4/8 (50 %) |
3.3 Tumorigenicity and spontaneous metastasis of subcutaneously implanted MTT-luc cells
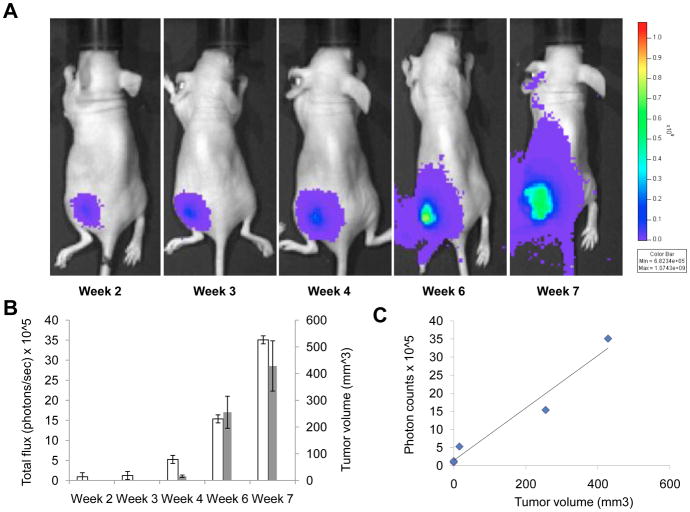
To assess the tumorigenicity and tumor growth modality of MTT-luc cells into immunocompromised animals, we injected 1×10^6 cells s.c. into the left flank of 6-week-old nude mice. The use of luciferase-reporter cells allowed for the immediate detection of tumor cells at the time of injection (data not shown) and enabled the detection of cells implanted at various sites. The growth of the MTT-luc tumors in the nude mice was monitored over time in vivo by bioluminescent imaging. Images at key time points from a representative animal are shown in Figure 4A, illustrating the progressive increase in the bioluminescence signal over time. Mean photons emitted from the tumors over time and tumor volume as assessed by caliper dimensions when the tumors became measurable (by week 4) are illustrated in Figure 4B. Notably, the tumor cells were visible by bioluminescence imaging much earlier than the tumor became measurable or palpable. Analysis of covariation between BMI light intensity (total photon flux) and measured tumor volume showed a high degree of correlation (R2 = 0.99) as shown in Figure 4C.
Figure 4.
Longitudinal subcutaneous tumor monitoring. MTT-luc (1 × 10⁶ cells) cells were injected subcutaneously in the left flank of Nude mice (n= 6). (A). Representative images from the same mouse and taken weekly after implantation, are presented. (B) Tumor growth was monitored and quantified (as photon/sec) weekly by BLI, together with tumor volume here represented as average per week; error bars indicate standard error of the mean. (C) Correlation plot of photon counts vs. tumor volume (R2 = 0.99)
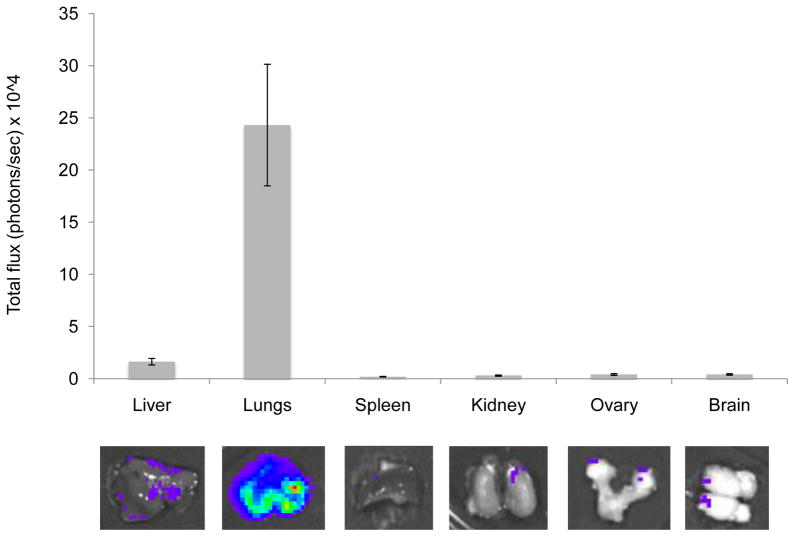
Only a few aggressive cell lines have been reported to spontaneously metastasize from subcutaneous implantation in the literature. For this reason, at the end of the 7-week experiment we wanted to verify if any metastatic MTT-luc tumor cells were detectable by bioluminescence analysis in several organs. Fifteen minutes after luciferin injections, the mice were euthanized and several internal organs, including liver, lungs, spleen, ovaries and brain, were analyzed for bioluminescence signals (Figure 5 and Table 1). Indeed, we were able to detect MTT-luc cells in several of these organs. The lungs, which represented the organ most consistently seeded by subcutaneously implanted MTT-luc cells, are also a favored site of metastasis of human pheochromocytomas [6].
Figure 5.
Ex vivo analysis of organ metastasis by bioluminescence in the spontaneous metastsis model. Fifteen minutes after luciferin injection, the animals were euthanized and internal organs analyzed for bioluminescence signals. Representative images of internal organs are shown (lower panel); photons/sec emitted by each organ were averaged and are represented in the upper panel, including standard deviations.
3.4 Bioluminescence signals correlate with metastatic lesions identified by histopathology
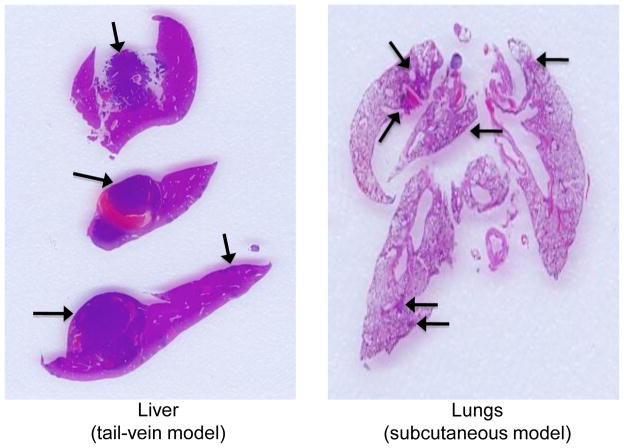
To confirm the presence of metastatic tumor cells in the main organs targeted in the two metastatic models we described, we performed histopathological examination of formalin-fixed tissues collected after ex vivo imaging. For the experimental metastasis model in which tumor cells were injected in the mouse tail vein, the most intense and reproducible signals were derived from the liver; indeed, histopathological analysis of livers from these animals revealed macro and micro metastasis (Figure 6, left panel). In the second models (subcutaneous injection of tumor cells), histopathological analyis confirmed the presence of micrometastasis in the lungs (Figure 6, right panel), consistent with the ex vivo bioluminescence signal.
Figure 6.
Histopathological analysis in metastatic sites. Representative histological sections of liver and lung metastasis from MTT-luc cells. The presence of metastatic tumor cells initially detected in vivo and ex vivo by BLI imaging was confirmed by histopathological analysis. Metastatic sites are indicated by the arrows.
4. Discussion
Bioluminescence has been used for the detection of primary tumor growth and tumor metastasis in animal models of several tumors, but, to our knowledge, this is the first report on the use of bioluminescence in animal models of pheochromocytoma. The use of this technology allows for the non-invasive and real-time assessment of tumor burden in the same group of animals over time [19]. This type of model is particularly well suited for evaluating the efficacy of novel therapy and has been developed with the intent to create a platform for pre-clinical evaluation of new targeted therapy for pheochromocytoma.
Previous studies in our group have established a metastatic model of pheochromocytoma by mouse passages of the murine pheochromocytoma cell line MPC [21]. Through disaggregation and culturing of liver tumor metastasis, we established the MTT cell line, which displays a reproducible metastatic phenotype when injected intravenously. In order to follow the localization of these cells in the intact animal longitudinally, we generated a bioluminescent MTT cell line and compared the bioluminescent signal with serial MRI imaging.
In our study we demonstrated a strong correlation between the detection of photons and the radiologic examination. BLI offers several advantages over more traditional radiologic techniques, such as MRI and CT scanning, which require long scan times and expensive instrumentation. Bioluminescence offers a signal with practically no background, as other source of significant bioluminescence are absent in mammals, and the light generated easily penetrates mammalian tissues and can be detected by sensitive charge-coupled device (CCD) cameras and quantified more precisely by the conversion of the luminescence signal into a digital value. This is in contrast with the use of fluorescent tags, that require an excitation signal (which penetrate tissue layers with difficulty), and are limited by the presence of tissue autofluorescence and photobleaching. Moreover, the luciferase gene can be stably integrated into the chromosomes of target cells, and so carries over subsequent cell divisions and is not lost over time.
Luciferase-transduced cells can be easily monitored in virtually any location in the body, including sanctuary sites, where only a few cells are sufficient to generate a detectable signal that would be undetectable by MRI or CT scanning; thus, it is by far the most sensitive of the noninvasive techniques. Consequently, among the several imaging techniques available for in vivo studies, bioluminescence is the more sensitive to detect minimal residual disease, which is one of the more daunting and elusive entities in clinical oncology.
Moreover, BLI can represent quantitatively the amount of viable tumor cells in the body, allowing comparison not only within the same experiment but also across several experiments. The ability to non-invasively track the growth of tumors and metastases in vivo also permits a better understanding of the mechanisms of cancer development and intervention. Several investigations in other types of cancers have already demonstrated the power of BLI in longitudinal therapy intervention studies for the follow-up of tumor growth after treatment with experimental drugs [23]. In these types of studies the BLI signal in the animal injected with tumor cells is determined prior to intervention with the drug of interest to establish a reference/starting measurement. Subsequent scans are then normalized relative to the reference signal in the same animal and differences are calculated between the control group (receiving vehicle alone) versus the group receiving the tested drug.
We have also established a spontaneous metastasis model of pheochromocytoma, in which cells from a subcutaneous implant send micrometastases to the lungs. These models are rare in the literature, and represent a unique opportunity to explore steps of the metastatic cascade that are not testable in an experimental metastasis model [24]. Indeed, spontaneous metastases spread following a natural mechanism of invasion of the surrounding tissue, and allow the examination of all steps of the metastatic cascade. This model could in particular be more clinically relevant, when testing for drugs that target more advanced disease stages. For example other groups using a spontaneous metastasis model of the breast cancer cell line MDA-MB-435 [25] was able to demonstrate the responsiveness of metastasis to therapies that were initially found to be ineffective in the treatment of the primary tumor. On the same line other groups have successfully used these animal models for testing novel molecular targeted therapies [26].
Besides the study of intact animals along the course of the study, ex vivo analysis at the end of experiments allows for additional important information to be collected from the same animal. Namely, ex vivo bioluminescence can help to identify very small metastatic lesions that are not easily detectable by in vivo imaging, more accurately assessing metastatic burden. For example, while it was relatively easy to detect signals from the abdominal cavity, brain lesions were undetectable by both MRI imaging and in vivo BLI. In contrast, ex vivo BLI was able to promptly detect a small number of tumor cells that crossed the blood-brain barrier causing micrometastatic brain disease.
A technical point of interest was that we were able to use G418 to exert selective pressure on transduced MTT cells. This was somewhat unexpected because the primary tumor from which MPC and MTT are derived arose in a Nf1 knockout mouse generated by insertion of a neomycin resistance gene in reverse orientation into the Nf1 gene [27] and the original MPC line was intrinsically G418-resistant (JF Powers, unpublished). The apparent loss of intrinsic resistance might have resulted from somatic recombination, a possibility that itself has implications for design of targeted cancer therapy.
In summary, these experiments demonstrate the ability of bioluminescent imaging to follow the progression of pheochromocytoma cells in live animals in order to study the course of tumor progression and to test clinically relevant antitumor treatments in a mouse model of metastatic pheochromocytoma. The sites of metastasis in this model are also favored for metastases of human pheochromocytomas [6]. No comparable human cell-based model currently exists.
Acknowledgments
This work was supported by the Intramural Research funding of the Eunice Kennedy Shriver National Institute of Child Health and Human Development of the National Institutes of Health and by grant 10665589 from the Department of Defense (to AST). This work was also funded in part with federal funds from the National Cancer Institute (NCI), National Institutes of Health (NIH), under contract N01-CO-12400 as well as by the Intramural Research Program of the NIH/NCI Center for Cancer Research.
Footnotes
Conflict-of-interest disclosure
The authors declare no competing financial interests.
Publisher's Disclaimer: This is a PDF file of an unedited manuscript that has been accepted for publication. As a service to our customers we are providing this early version of the manuscript. The manuscript will undergo copyediting, typesetting, and review of the resulting proof before it is published in its final citable form. Please note that during the production process errors may be discovered which could affect the content, and all legal disclaimers that apply to the journal pertain.
Bibliography
- 1.Jemal A, Bray F, Center MM, Ferlay J, Ward E, Forman D. Global cancer statistics. CA Cancer J Clin. 2011;61:69–90. doi: 10.3322/caac.20107. [DOI] [PubMed] [Google Scholar]
- 2.Kantorovich V, King KS, Pacak K. SDH-related pheochromocytoma and paraganglioma. Best Pract Res Clin Endocrinol Metab. 2010;24:415–424. doi: 10.1016/j.beem.2010.04.001. [DOI] [PMC free article] [PubMed] [Google Scholar]
- 3.Goldstein RE, O’Neill JA, Jr, Holcomb GW, 3rd, Morgan WM, 3rd, Neblett WW, 3rd, Oates JA, Brown N, Nadeau J, Smith B, Page DL, Abumrad NN, Scott HW., Jr Clinical experience over 48 years with pheochromocytoma. Ann Surg. 1999;229:755–764. doi: 10.1097/00000658-199906000-00001. discussion 764–756. [DOI] [PMC free article] [PubMed] [Google Scholar]
- 4.John H, Ziegler WH, Hauri D, Jaeger P. Pheochromocytomas: can malignant potential be predicted? Urology. 1999;53:679–683. doi: 10.1016/s0090-4295(98)00612-8. [DOI] [PubMed] [Google Scholar]
- 5.Lehnert H, Mundschenk J, Hahn K. Malignant pheochromocytoma. Front Horm Res. 2004;31:155–162. doi: 10.1159/000074663. [DOI] [PubMed] [Google Scholar]
- 6.Amar L, Baudin E, Burnichon N, Peyrard S, Silvera S, Bertherat J, Bertagna X, Schlumberger M, Jeunemaitre X, Gimenez-Roqueplo AP, Plouin PF. Succinate dehydrogenase B gene mutations predict survival in patients with malignant pheochromocytomas or paragangliomas. J Clin Endocrinol Metab. 2007;92:3822–3828. doi: 10.1210/jc.2007-0709. [DOI] [PubMed] [Google Scholar]
- 7.Adjalle R, Plouin PF, Pacak K, Lehnert H. Treatment of malignant pheochromocytoma. Horm Metab Res. 2009;41:687–696. doi: 10.1055/s-0029-1231025. [DOI] [PMC free article] [PubMed] [Google Scholar]
- 8.Adler JT, Meyer-Rochow GY, Chen H, Benn DE, Robinson BG, Sippel RS, Sidhu SB. Pheochromocytoma: current approaches and future directions. Oncologist. 2008;13:779–793. doi: 10.1634/theoncologist.2008-0043. [DOI] [PubMed] [Google Scholar]
- 9.Tischler AS, Powers JF, Alroy J. Animal models of pheochromocytoma. Histol Histopathol. 2004;19:883–895. doi: 10.14670/HH-19.883. [DOI] [PubMed] [Google Scholar]
- 10.Talmadge JE, Singh RK, Fidler IJ, Raz A. Murine models to evaluate novel and conventional therapeutic strategies for cancer. Am J Pathol. 2007;170:793–804. doi: 10.2353/ajpath.2007.060929. [DOI] [PMC free article] [PubMed] [Google Scholar]
- 11.Steeg PS. Tumor metastasis: mechanistic insights and clinical challenges. Nat Med. 2006;12:895–904. doi: 10.1038/nm1469. [DOI] [PubMed] [Google Scholar]
- 12.Sleeman J, Steeg PS. Cancer metastasis as a therapeutic target. Eur J Cancer. 2010;46:1177–1180. doi: 10.1016/j.ejca.2010.02.039. [DOI] [PMC free article] [PubMed] [Google Scholar]
- 13.Pantel K, Alix-Panabieres C, Riethdorf S. Cancer micrometastases. Nat Rev Clin Oncol. 2009;6:339–351. doi: 10.1038/nrclinonc.2009.44. [DOI] [PubMed] [Google Scholar]
- 14.Shibue T, Weinberg RA. Metastatic colonization: settlement, adaptation and propagation of tumor cells in a foreign tissue environment. Semin Cancer Biol. 2011;21:99–106. doi: 10.1016/j.semcancer.2010.12.003. [DOI] [PubMed] [Google Scholar]
- 15.Koo V, Hamilton PW, Williamson K. Non-invasive in vivo imaging in small animal research. Cell Oncol. 2006;28:127–139. doi: 10.1155/2006/245619. [DOI] [PMC free article] [PubMed] [Google Scholar]
- 16.O’Neill K, Lyons SK, Gallagher WM, Curran KM, Byrne AT. Bioluminescent imaging: a critical tool in pre-clinical oncology research. J Pathol. 2010;220:317–327. doi: 10.1002/path.2656. [DOI] [PubMed] [Google Scholar]
- 17.Thorne N, Inglese J, Auld DS. Illuminating insights into firefly luciferase and other bioluminescent reporters used in chemical biology. Chem Biol. 2010;17:646–657. doi: 10.1016/j.chembiol.2010.05.012. [DOI] [PMC free article] [PubMed] [Google Scholar]
- 18.Inouye S. Firefly luciferase: an adenylate-forming enzyme for multicatalytic functions. Cell Mol Life Sci. 2010;67:387–404. doi: 10.1007/s00018-009-0170-8. [DOI] [PMC free article] [PubMed] [Google Scholar]
- 19.Klerk CP, Overmeer RM, Niers TM, Versteeg HH, Richel DJ, Buckle T, Van Noorden CJ, van Tellingen O. Validity of bioluminescence measurements for noninvasive in vivo imaging of tumor load in small animals. Biotechniques. 2007;43:7–13. 30. doi: 10.2144/000112515. [DOI] [PubMed] [Google Scholar]
- 20.Gross S, Piwnica-Worms D. Spying on cancer: molecular imaging in vivo with genetically encoded reporters. Cancer Cell. 2005;7:5–15. doi: 10.1016/j.ccr.2004.12.011. [DOI] [PubMed] [Google Scholar]
- 21.Martiniova L, Lai EW, Elkahloun AG, Abu-Asab M, Wickremasinghe A, Solis DC, Perera SM, Huynh TT, Lubensky IA, Tischler AS, Kvetnansky R, Alesci S, Morris JC, Pacak K. Characterization of an animal model of aggressive metastatic pheochromocytoma linked to a specific gene signature. Clin Exp Metastasis. 2009;26:239–250. doi: 10.1007/s10585-009-9236-0. [DOI] [PMC free article] [PubMed] [Google Scholar]
- 22.Powers JF, Evinger MJ, Tsokas P, Bedri S, Alroy J, Shahsavari M, Tischler AS. Pheochromocytoma cell lines from heterozygous neurofibromatosis knockout mice. Cell Tissue Res. 2000;302:309–320. doi: 10.1007/s004410000290. [DOI] [PubMed] [Google Scholar]
- 23.Hong H, Yang Y, Zhang Y, Cai W. Non-invasive cell tracking in cancer and cancer therapy. Curr Top Med Chem. 2010;10:1237–1248. doi: 10.2174/156802610791384234. [DOI] [PMC free article] [PubMed] [Google Scholar]
- 24.Khanna C, Hunter K. Modeling metastasis in vivo. Carcinogenesis. 2005;26:513–523. doi: 10.1093/carcin/bgh261. [DOI] [PubMed] [Google Scholar]
- 25.Vantyghem SA, Wilson SM, Postenka CO, Al-Katib W, Tuck AB, Chambers AF. Dietary genistein reduces metastasis in a postsurgical orthotopic breast cancer model. Cancer Res. 2005;65:3396–3403. doi: 10.1158/0008-5472.CAN-04-4109. [DOI] [PubMed] [Google Scholar]
- 26.Francia G, Cruz-Munoz W, Man S, Xu P, Kerbel RS. Mouse models of advanced spontaneous metastasis for experimental therapeutics. Nat Rev Cancer. 2011;11:135–141. doi: 10.1038/nrc3001. [DOI] [PMC free article] [PubMed] [Google Scholar]
- 27.Jacks T, Shih TS, Schmitt EM, Bronson RT, Bernards A, Weinberg RA. Tumour predisposition in mice heterozygous for a targeted mutation in Nf1. Nat Genet. 1994;7:353–361. doi: 10.1038/ng0794-353. [DOI] [PubMed] [Google Scholar]


