

Abstract
Sensory hair cell ribbon synapses respond to graded stimulation in a linear, indefatigable manner, requiring that vesicle trafficking to synapses is rapid and non rate limiting. Real time monitoring of vesicle fusion identified two release components. The first was saturable with both release rate and magnitude varying linearly with Ca2+, however the magnitude was too small to account for sustained afferent firing rates. A second superlinear release component required recruitment, in a Ca2+-dependent manner, of vesicles not in the immediate vicinity of the synapse. The superlinear component had a constant rate with its onset varying with Ca2+ load. High-speed Ca2+ imaging revealed a nonlinear increase in internal Ca2+ correlating with the superlinear capacitance change, implicating release of stored Ca2+ in driving vesicle recruitment. These data, supported by a mass action model, suggest sustained release at hair cell afferent fiber synapse is dictated by Ca2+-dependent vesicle recruitment from a reserve pool.
Introduction
The hair cell afferent fiber synapse maintains a high level of tonic vesicle release and responds to graded input with linear changes in release across a wide range of stimulus frequencies (Furukawa et al., 1978). Information regarding frequency, intensity and phase of stimulation are transferred across this synapse with high fidelity (Rose et al., 1967; Rose et al., 1971) and mechanisms by which this occurs are the focus of much work (Eisen et al., 2004; Meyer et al., 2009; Neef et al., 2007; Nouvian et al., 2006; Parsons et al., 1994; Schnee et al., 2005). Hair cells have a presynaptic dense body (DB) or synaptic ribbon, as do other sensory cells requiring graded and tonic release (Lagnado, 2003; Parsons and Sterling, 2003; Schnee et al., 2005; von Gersdorff and Matthews, 1997). The functional significance of the DB is unclear but synapses with DBs have common features including linear release with increasing Ca2+ load, high release rates and limited fatigue. At conventional synapses, vesicle populations are classified based on location and release kinetics, with a readily releasable pool (RRP) of vesicles near the membrane, a more distal recycling pool that communicates with the RRP and a larger reserve pool whose role varies with synapse type (Rizzoli and Betz, 2005). Physiological investigations using either capacitance measurements or optical techniques find that pools do not strictly adhere to these distributions and that the ability to move between pools varies with synapse type (Rizzoli and Betz, 2004; Rizzoli and Betz, 2005).
At ribbon synapses, vesicle pools have been classified by position relative to the ribbon and plasma membrane (Nouvian et al., 2006). The locations of vesicles around the ribbons have been correlated with capacitance measurements that identify pools based on release kinetics and saturation (Gomis et al., 1999; Gray and Pease, 1971; Mennerick and Matthews, 1996; Moser and Beutner, 2000; Schnee et al., 2005). Data establishing a direct link between vesicle location and release pools are limited. Furthermore, vesicle populations are often more difficult to observe in auditory hair cells because saturation is less evident and rapid vesicle trafficking appears to create overlap between pools (Schnee et al., 2005).
The role of the DB in regulating synaptic transmission remains unclear. In hair cells lacking DBs due to knockout of the anchoring protein bassoon, sustained exocytosis is maintained but synchronous vesicle release is lost (Khimich et al., 2005). DBs may tether vesicles, clustering them near presynaptic membranes, a hypothesis supported by morphological data (Lenzi et al., 1999; Wittig and Parsons, 2008). The DB may also control release rates, acting as a conveyor belt to rapidly bring vesicles to release sites (Parsons and Sterling, 2003). Causal data to support any specific role is limited (Nouvian et al., 2006).
How vesicles reach synaptic regions is also contentious. In the visual system, vesicles may freely diffuse within the cytosol until affixing to DBs (Holt et al., 2004; LoGiudice and Matthews, 2009). Brownian motion can provide enough DB-vesicle encounters to maintain vesicle availability during long release paradigms (Beaumont et al., 2005). Data from hair cells suggest vesicles are present in a gradient; density is highest near the synapse and lower away from the synapse (Lenzi et al., 1999; Schnee et al., 2005), intimating a more structured system. Calcium dependence of vesicle trafficking has also been suggested (Spassova et al., 2004).
In this study, we assess synaptic vesicle trafficking and fusion at the hair cell afferent synapse in real time. Our approach has allowed us to separate release into a linear component that does not require recruitment of vesicles and a superlinear component dependent upon vesicle trafficking. We are able to clearly identify pools of depletable vesicles that correspond in size to those vesicles near the DB. Data presented here implicate strong intereactions between the RRP and the recycling pool, which together account for the observed linear release component and also demonstrate an ability to rapidly recruit from the reserve pool. Vesicle trafficking is calcium-dependent and release of stored calcium may be critical for recruitment of vesicles to the release site from the distant reserve pool.
Results
Ca2+ dependence of trafficking
At retinal ribbon synapses, paired pulse experiments identified a readily releasable pool (RRP) that could be depleted (Coggins and Zenisek, 2009). For experiments with turtle auditory hair cells, we designed a protocol to elicit a capacitance change roughly equivalent to release of all vesicles associated with the DB (300 ms pulse to −20 mV, based on previous estimates of vesicle distribution, Schnee et al., 2005) and the interval between pulses was varied from 1 s to 10 ms (Figure 1A). Surprisingly, we did not observe depletion or reduction of release during the second pulse at any interpulse duration (Figure 1B). Rather, as the interpulse interval was reduced, capacitance increased (Figure 1). The increase in release from the second pulse approached that equivalent to a single 600 ms pulse (data not shown). These data suggest that vesicles can be rapidly recruited to release sites faster than they are depleted. To test whether a depletable pool could be observed by altering stimulus duration, we held the interpulse interval at 30 ms and varied stimulus duration between 10 and 300 ms (Figure 1C). Depletion was never observed and again, as stimulus duration was increased, the second response was greater than the first, indicative of rapid vesicle recruitment. Assuming capacitance reflects synaptic vesicle fusion, a change of 400 fF equates to 8000 vesicles (assuming 50 aF per vesicle) or 186 vesicles per synapse (see figure 4 for synapse counts), more vesicles than previously identified to be near the synapse (Schnee et al., 2005), indicating that rapid vesicle recruitment is required.
Figure 1.

Paired pulse paradigms suggest vesicle trafficking is fast, limiting the ability to identify discrete pools. (A) Paired pulses of 300 ms duration with interpulse intervals from 1000 to 10 ms, capacitance shown above and ICa below. Red lines indicate instantaneous capacitance values, revealing a lack of depletion regardless of interpulse interval (IPI) with short duration IPIs unmasking a facilitatory effect. (B) Summary of data from protocol shown in (A) demonstrating that release from the second stimulus was greater than that observed in the first (n = 4). Bar graph represents change in capacitance for second pulse with IPI given below, ctrl is the average capacitance change for the first stimulus. (C) Summary of release data where the IPI was constant at 30 ms and the stimulus duration varied from 10 to 300 ms. Cross hatched bars indicate second pulse response, while open bars indicate initial response, n is given above each pair. Asterisks indicate statistical significance at the p<0.05 level.
Figure 4.

Low frequency cells release faster per synapse than high frequency cells. (A–C), maximal-intensity projections of confocal Z-stacks from a whole mount preparation (high frequency. Immunofluorescence portrays the presence of ribbons (Ctbp2, red) adjacent to postsynaptic densities (PSD95, green). (D) is a 3D reconstruction of a single hair cell with red being Ctbp2, green being PSD95 and blue being DAPI. (E) A three-dimensional confocal reconstruction showing the presence of ribbons (Ribeye, red) in the basolateral region of hair cells. Hair bundles can be localized with phalloidin staining (green). (F) is a maximum intensity projection using Ribeye (red) and PSD95 (green) to colocalize synapses. Insets in F represent regions outlined to better illustrate the coupling of label. Scale bars: C,E, 5 μm; D,F, 1 μm. Note that the Ribeye antiserum also labels nonspecifically the kinocilium. (G) provides a frequency histogram (blue being low frequency and red high frequency throughout figure) for the number of synapses per cell with solid lines as Gaussian fits to plots (see text for details). (H) plots the frequency distribution for peak ICa, again with Gaussian fits to data as solid lines, arrow indicates small peak corresponding to high frequency cells with twice the ICa. ICa (I,J) and capacitance measurements (K,L) in response to different voltage steps (−44, −41, −38, −35, −43 mV from −80 mV) for low (blue) and (−50, −47, −44, −41 −38 mV from −80 mV) high (red) frequency cells. Both high frequency (J,L,N)) and low frequency (I,K,M) hair cells show linear, incremental increases in release with increased Ca2+ load. Expanding the smallest capacitance response from (K,L) reveal a saturating component (inset, scale bars are 200 ms and 20 fF). Black lines indicate linearity of release for larger depolarizations. (M,N) Plots the data from (K,L) against the integral of the corresponding ICa illustrating the linear relationship between release and Ca2+ entry for the first release component. Note that the low frequency response appears nonlinear because of encroachment of the superlinear component. Encroachment is depicted by horizontal solid lines above traces derived from the point where the capacitance response diverges from linearity (L). Solid black lines in M,N point out linearity of response.
To identify discrete pools, it might be necessary to reduce calcium entry as a potential means of slowing release and possibly vesicle trafficking. Additionally, pool populations might be masked by priming of synapses, such that the second stimulation might not provide similar information as the initial one. This can be a significant issue when multiple stimulations are required to assess release across a broad time frame. Additionally, both intra- and intercellular variability may make it more difficult to identify discrete vesicle pools.
Two Sine measurements
To address these concerns and more directly investigate vesicle trafficking, we developed a method for continually monitoring cell capacitance that simultaneously tracks capacitance and conductance changes. This two sine technique requires accurate compensation of electrode capacitance and calibration of the recording system (for detailed description of technique see Santos-Sacchi, 2004 and supplemental material Figures 1–3). With this approach, we could resolve all components of release from a single cell with a single pulse. Importantly, continuous monitoring of capacitance allowed the use of protocols eliciting submaximal ICa, thereby slowing Ca2+ influx, with the goal of creating separation between individual components of trafficking and release.
Figure 2 provides an example of a cell probed with a depolarization eliciting either 75% or 35% of the maximal Ca2+ current. As predicted, strong depolarization compressed release components so that saturable pools were difficult to observe (figure 2B,C left panel). Surprisingly though, the rate of release increased during the stimulation (Figure 2). We commonly observed a slight delay in release following the stimulus onset that varied with intensity and repetition making it difficult to quantify (Figure 2C). Likely this delay relates to strong calcium clearance mechanisms at the synapse and results from nonphysiological stimulus protocols where cells are held at very hyperpolarized potentials (see Figure 5). Slowing Ca2+ entry separated release into at least two clearly identifiable components, an initial shallow component that showed depletion followed by a large rapid superlinear component (Figure 2B). These results are in contrast to those from photoreceptors where the initial release was fast, followed by longer but slower release components (Innocenti and Heidelberger, 2008). With slower Ca2+ accumulation, the depletable pool size increased from 24 ves/syn to 60 ves/syn (based on 50 aF/ves and synapse numbers presented in Figure 4). Therefore, slowing Ca2+ entry unmasked a saturable pool of vesicles whose pool size varies with Ca2+ load. Depending on stimulus intensity this additional pool could be recruited into the depletable first component (Figure 2D).
Figure 2.

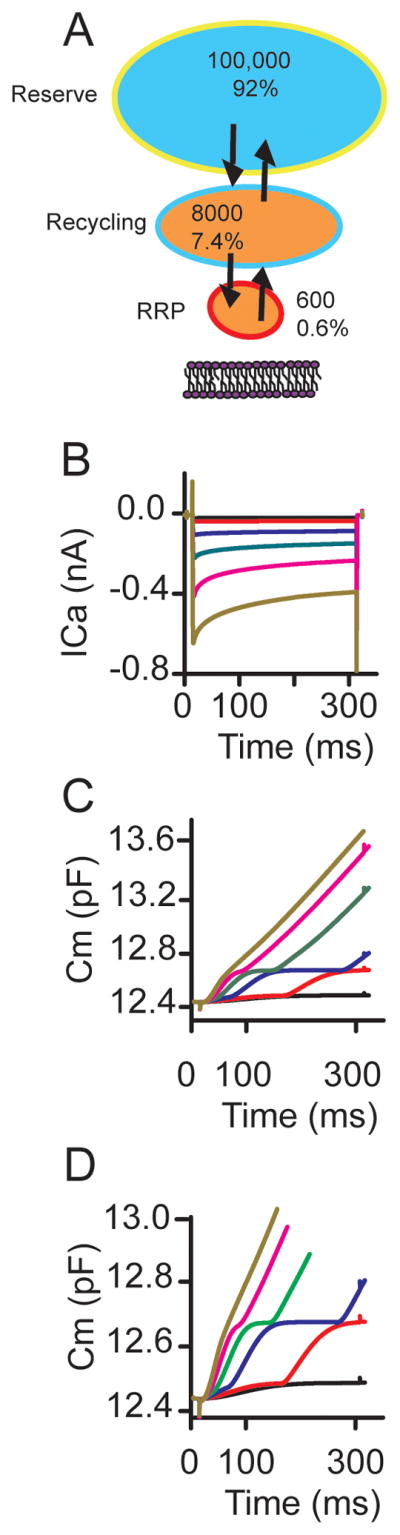
Two Ca2+-dependent components of vesicle release were observed during hair cell depolarization. (A) ICa elicited in response to membrane depolarization from −85 mV to −30 mV (75% peak, left) or −43 mV (35% of peak, right). (B) Capacitance change elicited in response to ICa in (A); arrow indicates superlinear onset. Colors demark regions where rates are different. (C) Expansion of the axis of (B). Red identifies a saturable pool of vesicles that differs in amplitude between stimulus protocols. Blue indicates intermediary component that also is saturable depending on Ca2+ load and purple represents the superlinear component. (D) Expansion of plots in (B) to illustrate the intermediate component of release where depletion has ended but superlinear response has not started. Dashed line is exponential fit showing depletion. (E) Capacitance against Ca load (integral of current in A), demonstrating both linear and nonlinear (indicated by arrow) responses. Dashed lines are fit to Hill Equation: Cm = Cm(max)*xn/(kn + xn) where n is Hill coefficient (r2 = 0.99, see text for details). (F) Plots capacitance change after stimulation from high frequency (1 mM EGTA internal) cells included in this study for varying intensities and durations of depolarization as compared to previous data obtained with single sine wave method (Schnee et al., 2005).
Figure 5.

The superlinear release component onset is Ca2+ dependent but the release rate is not. (A) ICa in response to listed voltage steps from −85 mV. (B) The capacitance responses corresponding to ICa in (A). In each panel, arrows indicate where release becomes superlinear. (C) plots the Ca2+ load against the capacitance change; responses are color coded as in (A,B). (D) Expands the axis from (C) to better exhibit the capacitance results vs Ca2+ load. (E) Upper panel shows stimulus lower panels presents the ICa in response to color coded stimuli where prepulse to −45 mV (red) or −85 mV (black) were presented. (F) Plots the capacitance response against time for the same stimuli as in (E). (F) Plots the capacitance change against Ca2+ load. Similar results were obtained in 19 cells.
Plotting the Ca2+ load against capacitance changes corroborated the superlinear nature of the second release component (Figure 2E). Interestingly, the dramatic difference in Ca2+ load required to elicit the secondary larger capacitance change depended on the rate of Ca2+ entry. Depolarizations closer to the peak elicited the superlinear component with less than 200 pC of Ca2+ entry as compared to 600 pC when Ca2+ entry was slowed. This may reflect the presence of strong Ca2+ clearance mechanisms at the synapse that were overwhelmed with rapid Ca2+ entry. Fitting the data in Figure 2E with a Hill Equation, using previously determined maximal release values (Schnee et al., 2005), yielded a Hill coefficient of 3.6 ± 0.4 for the high frequency cells (n = 14). The coefficient was not dependent upon level of depolarization as the shift in the capacitance vs Ca2+ load with depolarization was parallel (Figure 2E). This value is similar to that obtained when photolysis of caged calcium was used to stimulate release and to that observed in mouse IHCs (Beurg et al.,2010; Beutner et al., 2001). Interestingly this value is predominated by the superlinear component of release that is at least in part a reflection of vesicle trafficking and not only of release.
The nonlinearity in release differs from previous measurements (Schnee et al., 2005). However, a limitation to those experiments was the use of the single sine method, which provided no direct kinetic information; rather, kinetics were inferred from responses measured after the pulse by combining responses from multiple cells and/or multiple pulses to individual cells. A comparison of data collected using the two sine wave technique to that previously obtained using the single sine technique confirmed that variability between and within cells may have masked the superlinear behavior of individual cells (Figure 2F). These data point out the limitations of using a technique that requires multiple sampling to intuit kinetic information as compared to direct measurement of kinetics.
To determine whether the superlinear release component was an artifact of whole cell recording, we performed perforated patch experiments to maintain endogenous buffering. We observed two release components in both perforated patch recordings and whole cell recordings using 1 mM EGTA (Figure 3), indicating that the observed release properties are not due to the whole cell recording technique. To ensure that the superlinear release component is not unique to turtle, we recorded from rat and mouse inner hair cells (ages postnatal day P7-P15) and observed two components of release in these preparations (Figure 3C). Previous work in chick auditory hair cells also documented two release components (Eisen et al., 2004), suggesting multiple release components may be a ubiquitous feature of vesicle release in hair cells.
Figure 3.

Superlinear release is observed in whole cell, perforated patch and across species. (A) presents the ICa (above) and capacitance response (below) for a turtle cell recorded in whole cell mode (1mM EGTA as buffer) A saturating response as well as two superlinear responses are presented in response to different levels of depolarization. (B) Presents a perforated patch (n=4) recording in a similar manner to (A). (C) presents a whole cell recording from a rat inner hair cell (n=16) using 1 mM EGTA as the buffer. Similar responses were observed from all conditions.
Comparisons between hair cells of different frequency locations
Quantitative comparison of release properties between frequency positions requires knowing the number of synapses present. Whole mount papillae were double labeled with Ctbp2+PSD-95 or Ribeye+PSD-95 antibodies to count the number of functional ribbon synapses at the same tonotopic positions used in the electrophysiological analysis (n = 6). Examples from a high frequency position are shown in Figure 4A–F. Ribbon synapses were localized in hair cell basolateral regions (Figure 4D,E), were scarce above the nucleus and were typically present in series, likely corresponding to the fingerlike projections of the afferent fiber (4D, 4F inset). No synapses were included that did not positively label adjacent pre and post synaptic markers (Figure 4F inset). PSD-95 puncta that did not have a corresponding Ribeye component accounted for less than 5% of the observed puncta. Frequency histograms are plotted to show the distribution of synapses for both frequency positions (Figure 4G). The low frequency distribution was best fit with a normal distribution having a center values of 19.5 ± 0.4 syn/cell and a full width half max value of 9 (r2 = 0.92; n = 38 cells). The high frequency distribution was best fit by the sum of two Gaussians with center peaks of 46 ± 1 and 75 ± 4, and full width half max values of 21 and 9, respectively (r2 = 0.92;n = 90 cells). Previous morphological work suggested that at higher frequencies some hair cells are dually innervated (Sneary, 1988). Hypothesizing that dual innervations might account for the bimodal distribution in synapse number and further correlate with ICa, we plotted the frequency distribution of peak ICa (Figure 4H), revealing a bimodal distribution. The second population of cells with larger ICa (~3% of the total) and those with larger synapse number (~5% of the total) may represent dual innervations and skew the absolute mean values (Sneary, 1988). Therefore, we used the major peak value in all analyses, rather than the mean of the total population, to ensure similar cell populations were compared between high and low frequency cells. ICa (peak of fit) increased from 313 pA to 586 pA between frequency locations; similarly, synapse number increased from 20 to 46 from low to high frequency such that the Ca2+ load per synapse was 16 pA/synapse for low frequency compared to 13 pA/synapse for high frequency. Calcium channels are considered clustered at release sites based on previous measurements in turtle (Tucker and Fettiplace, 1995) and frog (Roberts et al., 1990).
First release component (pool size)
As discussed above, depolarizations elicited two distinct components of release, the first corresponding to a saturable pool whose release rate varied with Ca2+ entry and a second component where the release rate was increased relative to the first component. 64% of high frequency cells and 80% of low frequency cells had a clearly identifiable saturable vesicle pool. The smallest saturable pool observed (Figure 4K,L) had asymptotic capacitance measurements of 48 ± 20 fF (n=12) and 90 ± 35 fF (n = 9) for low and high frequency cells, respectively. This pool size agrees reasonably well with vesicle numbers under the ribbon closest to the plasma membrane and might represent the RRP (Schnee et al., 2005; Rizzoli and Betz, 2005). The largest saturable pools identified (Figure 4K,L) were 145 ± 71 (n = 11) for low and 328 ± 187 fF (n = 12) for high frequency cells. These values are not statistically different from previous morphological measurements estimating vesicles associated with the DB and the total pool may correspond to the recycling pool and the RRP (Rizzoli and Betz, 2005; Schnee et al., 2005). Movement of vesicles within this pool was dependent on the rate of Ca2+ entry, suggesting that trafficking of vesicles to release sites is fast and Ca2+ dependent, and that the ability of vesicles to move between pools is enhanced at auditory ribbon synapses.
First release component (release rates)
Release rates varied linearly with Ca2+ load (Figure 4M,N). To compare high and low frequency cells, stimuli were selected where the Ca2+ load was comparable when normalized to synapse number. Rates were estimated by fitting lines to the initial portions of the release plots prior to depletion. The release rate at low frequency synapses was significantly faster (530 ± 10 ves/s/syn, n = 14) than at high frequency synapses (191 ± 60 ves/s/syn, n = 11) (p<0.05, see Supplemental Figure 6A). We also compared the Ca2+ dependence between frequency positions (Figure 4M,N). Release varied linearly with Ca2+ for the initial release component but the relationship often appeared more exponential in low frequency cells (Figure 4M), as has been described for mammalian low frequency cells (Johnson et al., 2008). However, careful inspection reveals encroachment of the superlinear release component (Figure 4K,L). No superlinear component is seen in high frequency cells at these stimulus levels (Figure 4L). The presence of this superlinear component may account for the exponential appearance suggesting perhaps that vesicle trafficking and not intrinsic differences in Ca2+ dependence of release may be responsible for the observed results (Figure 4M). We consistently observed that the superlinear component required less Ca2+ influx in low frequency cells than high frequency cells, which could create an apparent exponential appearance to the Ca2+ dependence.
Superlinear release components
The larger superlinear release component was observed in all cells when the Ca2+ load was high (Figure 5). The superlinear nature of the response is denoted by a sharp increase in release rate during constant stimulation. As in Figures 3 and 4, capacitance traces elicited by smaller ICa showed a linear response until reaching a point where release rate dramatically increased. Additional depolarization did not further increase the release rate but rather shortened the onset time of this faster component (Figure 5B). Maximal rates, obtained by fitting a linear equation to the slope of the superlinear component, were 0.9 ± 0.5 pF/s (n = 13) and 1.0 ± 0.8 pF/s (n = 17) for low and high frequency cells, respectively, corresponding to 20,000 vesicles/s and 18,000 ves/s or 900 ves/s/syn and 434 ves/s/syn for low and high frequency cells, respectively. As with the first release component, low frequency synapses operated faster than high frequency synapses, though release rates per cell were comparable. Plotting the change in capacitance against Ca2+ load (Figure 5C) shows that the inflection point where the superlinear component began was at the same Ca2+ load for the two responses, suggesting the temporal difference in Figure 5B was due to the difference in rate of Ca2+ entry. As seen in Figure 2, this onset time for the superlinear component could be varied by altering the Ca2+ load. Further inspection of the Ca2+ load driving capacitance change (Figure 5D) shows that first component release plateaus just prior to the onset of the superlinear response. Whether initial vesicle pool depletion provides a signal for rapid vesicle recruitment to the synapse remains to be explored.
Functional Relevance of superlinear component
The superlinear capacitance changes are paradoxical in that postsynaptic recordings have indicated that release at the hair cell afferent fiber synapse is linear (Keen and Hudspeth, 2006; Li et al., 2009). No physiological experimental data exist that correspond to the superlinear release kinetics, yet large numbers of vesicles must be released continually in order to account for afferent firing properties (Taberner and Liberman, 2005). To address this question, hair cells were voltage clamped at −45 mV, near the expected resting potential (Farris et al., 2006) and then depolarized to the peak ICa. The response was compared to the conventional experimental protocol where the cell is held at −85 mV (Figure 5E–G). At the hair cell’s resting potential, where Ca2+ channel open probability is nonzero (Figure 5E), the ICa in response to the depolarization was minimally reduced yet the capacitance change was dramatically increased (Figure 5F). The capacitance response from −85 mV was small and saturating, indicating that release was depleted and the superlinear component not recruited, while the response at the resting potential was almost linear, more in line with what is expected based on afferent fiber recordings. These data suggest that vesicle release and trafficking kinetics are strongly dependent on calcium homeostasis such that altering homeostasis by hyperpolarizing the cell results in the recruitment of an apparent superlinear process, whereas under physiological conditions release could be maintained for much longer periods of time by the merging of linear and superlinear processes. The magnitude of the release observed with the prepulse requires recruitment of vesicles to release sites (ie superlinear process), suggesting that the prepulse results in the temporal merging of the two release components. Biophysically, it is possible to distinguish between release and trafficking but physiologically, the process is created to provide rapid and continual release. The linearity obtained by incorporating the superlinear component is clearly demonstrated by plotting the Ca2+ load against capacitance (Figure 5G). This is not unlike arguments made previously when investigating Ca2+ dependence of release in hair cells using caged Ca2+ (Beutner et al., 2001). These data suggest multiple sequential first order processes could account for trafficking and release in the hair cell.
Ca2+ Buffering alters the two release components differently
The effect of Ca2+ buffering on release properties was investigated with EGTA, BAPTA and perforated patch at stimulations that elicited about 60% of the maximal ICa (Figure 6A–C). First, component rates varied with stimulus intensity so rates were compared for a similar Ca2+ load (Figure 6D). BAPTA significantly slowed release as compared to EGTA or perforated patch. The perforated patch recordings suggest an endogenous buffer capacity less than 1 mM BAPTA, but more than 1 mM EGTA, similar to that suggested previously (Moser and Beutner, 2000) and consistent with a release mechanism located near the source of Ca2+ influx. A comparison of initial release rates against Ca2+ load for individual cells is presented in supplemental Figure 6B illustrating how BAPTA reduces release rates. As compared to EGTA, BAPTA also increased the duration of the plateau between the first release component and the onset of the superlinear component, represented by the Ca2+ load required for the onset of the superlinear release (Figure 6G). In this instance perforated patch responses suggest endogenous buffering was stronger than either BAPTA or EGTA. This might indicate that the site of action is further removed from the Ca2+ source where concentration rather than kinetics is more relevant (Naraghi and Neher, 1997). In contrast, changes in the rate of the superlinear component (Figure 6E), suggest the perforated patch response was less efficacious than EGTA or BAPTA, supporting the contention that endogenous buffer kinetics are slow. Finally, the difference in Ca2+ load required to initiate the superlinear component of release led to an increase in the magnitude of the first component plateau (Figure 6F), supporting the conclusion that vesicle movement to release sites was rapid and Ca2+ dependent. The delay between release components also supports this conclusion, demonstrating that despite the presence of Ca2+ to drive release, depletion persisted for longer periods of time when Ca2+ buffering was increased because trafficking was slowed.
Figure 6.

Fast Ca2+ buffers slow release rates and onset of release but pool size does not change. (A) used EGTA (tan) at 1 mM,(B) BAPTA (green) at 1 mM and (C) was perforated patch (purple) with ICa (upper panels) and capacitance (lower panels) in response to a depolarization eliciting about 60% of the maximal ICa. (D) plots the Ca2+ load (hatched bars) and the release rate for the first component under different internal Ca2+ buffering. Asterisks indicate significance at the p<0.05 level against the recording condition indicated by color. Similarly (E) plots the rate of the superlinear component, (F) plots the capacitance change for the depleted pool and (G) plots the Ca2+ load at the onset of the superlinear response. Number of cells is given in parenthesis above bars in (E). (H) ICa recorded (upper panels) with 10 mM BAPTA internally in the absence (purple) or presence (tan) of 10 μM Bay K. (K) shows the capacitance response (lower panels) increased dramatically in the presence of Bay K.
An alternative possibility is that vesicle position at the synapse is Ca2+ dependent and that greater buffer efficacy leads to diffusion of vesicles away from the synapse. We tested this hypothesis by recording cells with 10 mM BAPTA internally, blocking release at all but maximal stimulus levels and then increasing Ca2+ load using Bay K (10 μM), which prolongs Ca2+ channel open time (Figure 6H). Capacitance changes evoked by Bay K treatment included both linear and superlinear components supporting the hypothesis that vesicle movement toward the synapse is Ca2+ dependent and largely unidirectional.
Calcium imaging demonstrates multiple release components
It is possible that additional sources of Ca2+, for example Ca2+ stores, enhance release during longer stimulations (Lelli et al., 2003). We tested this hypothesis with high speed confocal Ca2+ imaging. Labelling ribbons with a rhodamine tagged ctbp2-terminal binding peptide in the patch electrode (Zenisek et al., 2003) allowed synapses to be localized during simultaneous Ca2+ imaging and capacitance measurements (Figure 7A). The capacitance changes show a typical response with both release components (Figure 7C–E). The fluorescent signal, however, is quite complex and not simply the integral of the current, as might be predicted. Rather, the initial response (Figure 7F–H) representing mostly first component release, shows a rapid increase at the synapse followed by a plateau, similar to that observed in mouse (Frank et al., 2009), indicative of strong Ca2+ clearance followed by an integrating increase in signal. Sites distal to the synapse show little change initially, consistent with the source of Ca2+ being at a distance, followed by a slow increase. The later signals, (figure 7I–K) corresponding to the onset of the superlinear response, present a different picture. Ca2+ at the synapse shows an abrupt increase in signal, followed by a plateau and decrease in signal even in the face of constant Ca2+ entry (Figure 7D,J). Ca2+ signals away from the synapse show a slower integrating signal followed by a sudden increase in signal whose rate is faster and peak greater than that observed at the synaptic region (Figure 7J). The change in kinetics at these distant sites suggests a secondary source of Ca2+. Similar results were obtained in 5 cells where the superlinear release component was observed. Smaller depolarizations revealed simple integrating responses that diminished away from the synapse while larger depolarizations yielded similar complex responses (Supplemental Figure 7). Together these data suggest Ca2+ dynamics are complex, that clearance near the synapse is strong and that a second source of Ca2+ may play a role in vesicle trafficking. Also, although the second component of release appears to be superlinear when compared to the Ca2+ integral, indicating more release per Ca2+ for the second component, when compared to the Ca2+ fluorescent signal the opposite is true. Using fluorescence changes at the synapse, the ratio (Cap/Fluor) for first component divided by second component provides an indicator of relative efficiency of release and was 1.5 ± 0.4 (n = 3), indicating that release is more efficient at lower values of Ca2+.
Figure 7.

High speed Ca2+ imaging coupled with continuous capacitance measurements reveal a nonlinear increase in Ca2+ during responses with superlinear release properties. (A) Fluorescent image of Ctbp2 binding peptide labeled DBs (scale bar 1μm) with schematic in (B) showing regions selected for Ca2+ imaging. (C) shows stimulus above, ICa response responsible for eliciting the local changes in Ca2+ (D) as well as the capacitance changes (E). Expanding the plots from (C–E) in (F–H) focuses on the initial changes in Ca2+ current (F), local Ca2+ changes (G) and first component of capacitance (H). (I–K) focuses on the onset of the superlinear component again with the Ca2+ current (I), local Ca2+ signaling (J) and capacitance (K) signals.
Discussion
Utilization of a two sine technique for real time tracking of vesicle fusion has allowed for more detailed investigation of presynaptic release components at the auditory hair cell–afferent fiber synapse. By using stimuli that did not elicit maximal ICa, saturable pools were clearly identified, whereas variability between and within cells made this impossible (in turtle) with the single sine technique (Schnee et al., 2005). A superlinear release component whose onset varied with Ca2+ load and correlated with release of an additional source of Ca2+ was also revealed. The superlinear component of release is postulated to reflect the ability of hair cells to rapidly recruit vesicles from regions distant from the synapse, which may underlie the inability to deplete vesicle pools and the ability of hair cell synapses to operate at high rates for sustained periods of time.
The first component of vesicle release had a pool size consistent with vesicles within the vicinity of the DB and thus did not require significant vesicle recruitment, though movement of vesicles to release sites on the plasma membrane would be required. The release rate and amplitude of the first component varied linearly with Ca2+ entry. Saturable vesicle pools could be observed within this first release component. The size of the saturable pool varied both with frequency position and Ca2+ load and could increase significantly if Ca2+ entry were slowed, intimating that additional vesicles could be recruited to release sites faster than the existing pool of vesicles could be released. This vesicle pool may be as small as the vesicle population associated with the plasma membrane and DB to as large as all the vesicles associated with the DB (Figure 8A). This first component of release is very similar to what has been described for ribbon synapses of hair cells and other sensory cells (Beutner et al., 2001; Eisen et al., 2004; Moser and Beutner, 2000; Neef et al., 2007; Neves and Lagnado, 1999; Parsons et al., 1994; Schnee et al., 2005; Thoreson et al., 2004; von Gersdorff and Matthews, 1997).
Figure 8.
Mass action model incorporating first order Ca2+ dependence of trafficking and release reproduces release data. (A) schematic representation of model, identifying vesicle pools, rate constants as well as Ca2+ gradients. (B) is Hodgkin Huxley model of ICa in response to increasing depolarizations from −53 in 3 mV increments. (C) Corresponding capacitance changes elicited, (D) expansion of y-axis to better visualize vesicle pools.
The second, superlinear, component represented a much larger pool of vesicles, requiring trafficking of distant vesicles to the synapse, likely equating to the reserve pool (Figure 8A). It also behaved as if there were a threshold Ca2+ load required for onset that was sensitive to factors affecting homeostasis, such as Ca2+ buffering and the rate of Ca2+ entry. Ca2+ imaging experiments suggest a correlation with release of an internal pool of Ca2+, though further studies are needed. Third, the release rate did not increase with Ca2+ load, rather the onset time decreased. These results suggest the superlinear component is more a reflection of vesicle trafficking than vesicle fusion.
One possible mechanism for the increased yet insensitive release rate for the superlinear component is that release sites are not maximally filled at stimulus onset, in a similar manner to the DB being only 50% occupied (Lenzi et al., 1999; Schnee et al., 2005), but during stimulation the percentage of occupied release sites increases such that the measured release rate increases (vesicle trafficking is faster than vesicle fusion). This would explain the variability in size of depletable vesicle pool with stimulus intensity. The assumption is that the measured release rate is a reflection of the sum of filled and unfilled release sites and the machinery controlling release is operating maximally during stimulus conditions where Ca2+ at the release site is saturating. As more sites are filled, the measured release rate increases. When all release sites are full, the release rate will be constant, the time to achieving this condition varying with Ca2+ load.
An alternative hypothesis is that additional synapses are recruited during the stimulation as the Ca2+ signal spreads. This seems unlikely, as synapses without Ca2+ channels have not been identified in mature hair cells (Frank et al., 2009; Issa and Hudspeth, 1996; Schnee et al., 2005).
Another possibility is that superlinear release does not represent synaptic vesicle fusion, but rather endosomal fusion or fusion of vesicles at some distant site (Coggins et al., 2007; Zenisek et al., 2000). Direct tests of this possibility are lacking; however the ability of afferent fibers to operate spontaneously at rates over 100 spikes/s and to sustain release in the face of stimulation at over 400 spikes/s argues for the requirement of rapid vesicle replenishment (Liberman and Brown, 1986; Taberner and Liberman, 2005). The maximal release rate reported here for mammalian inner hair cells when the superlinear component is included is about 307 ves/s/syn (assuming 15 synapses and 50 aF/ves)(Meyer et al., 2009), likely underestimating the release required to sustain these large firing rates. Prepulse experiments further illustrate that under more physiological stimulation conditions, release is linear and sustained; neither of these properties would occur without the superlinear component summing with the first release component. Finally previous experiments have imaged vesicle release in mammalian hair cells at rates higher than reported here for superlinear component of release and also suggested trafficking must be rapid (Griesinger et al., 2005).
Data suggest that low frequency cells release at faster rates per synapse than high frequency cells, though the release rate per cell was similar for both components. Given that in turtle, largely one fiber innervates one hair cell but with multiple synapses, it may be the overall release rate that is more significant than release per synapse, in contrast to the mammalian system where one fiber innervates one synapse. The underlying mechanisms responsible for differences in release per synapse remain to be determined. In contrast, work in mammalian systems (Johnson et al., 2008) has shown a difference in the Ca2+ dependence of release. In turtle there was an apparent difference in Ca2+ dependence associated with the ability of low frequency cells to recruit superlinear release with less Ca2+ than high frequency cells. Comparable experiments are needed to test this in mammalian hair cells.
Our data are consistent with the existence of multiple vesicle pools, with the first linear saturable release component including both the RRP and recycling vesicle pools and the superlinear release component corresponding to the reserve pool (Figure 8A). Based on release measurements, we estimated vesicle pool sizes of 600 vesicles in the RRP (0.6%), 8000 vesicles in the recycling pool (7.4%) and 100,000 vesicles in the reserve pool (92%) (Figure 8A). These sizes are consistent with data from other synapse types (Rizzoli and Betz, 2005), the major difference being the ability of vesicles to be recruited for release from each pool. The rate and extent of Ca2+ entry appear to finely regulate the first two pools while release of intracellular stored Ca2+ may be involved in recruitment of the reserve pool of vesicles. At other synapses recruitment of the reserve pool vesicles appears to be limited (Rizzoli and Betz, 2005).
Previous work developed a simple mass action model for vesicle release accounting for observed release properties (Schnee et al., 2005). No specific role for the DB was included and the model did not incorporate Ca2+ dependence of release or vesicle trafficking. Alone, this model cannot reproduce superlinear release. Modification of this simple model to include both first order Ca2+-dependent release and Ca2+ dependent vesicle trafficking reproduced all of the basic release properties reported (Figure 8A–D, see supplement for more detailed description). Simulations show both saturable linear release components and a superlinear release component of invariant rate (Figure 8B–D). Saturating levels correspond well with anticipated pool sizes. Models that did not include Ca2+-dependence of vesicle trafficking could not reproduce the superlinear component of release unless higher order release functions were incorporated and even here the superlinear component did not correspond well with available vesicles (data not shown). The model varied from physiological measurements in that the separation between vesicle pools was more sharply defined, likely reflecting the artificial nature of threshold Ca2+ levels to recruit vesicle pools. Perhaps vesicle trafficking is uniformly Ca2+ dependent and the recruitment depends on the location of vesicles with respect to Ca2+ influx, with the Ca2+ gradient into the cell dictating the pool size and rate of movement more than the location or specialization of the vesicle. This possibility is consistent with data demonstrating that vesicle movements are similar between different regions of the cell (Zenisek et al., 2000), but is unusual in that it suggests vesicles are tethered in some manner, whether directly associated with the ribbon or not. It is in contrast with arguments that vesicle movement is diffusion based (Holt et al., 2004; LoGiudice and Matthews, 2009), unless diffusion can be regulated via Ca2+ levels, but is consistent with recent cryoelectron tomography arguing that all vesicles are tethered by the cytoskeleton (Fernandez-Busnadiego et al., 2010). Perhaps the differences in release properties between ribbon synapses in the visual and auditory system, mainly being that release in hair cells is much less defatigable, has more to do with trafficking than with mechanisms of release. Hair cells are required to maintain continual and rapid release in order to maintain high spontaneous activity in the afferent fiber, this is much less of a requirement in the visual system.
Afferent fibers show a pronounced neural adaptation where firing rates can be reduced by more than 50% during the initial phase of stimulation (Liberman and Brown, 1986). Data presented here may provide novel insight into possible mechanisms by which this may happen. We suggest the initial decrease in firing represents the time when vesicles are being released faster than replenished, so that vesicle trafficking is not maximized. That firing rates do not adapt to zero but rather to a relatively high rate indicates that trafficking (superlinear component) is rapidly accessible under physiological conditions. Similar to the response described in Figure 5, under physiological conditions the processes tends to merge but vesicle release shows a reduction in slope initially that becomes sustained. The level of neural adaptation may in part be determined by how rapidly each synapse is capable of recruiting vesicles between pools, the faster recruitment, the less adaptation is observed. In fact, it may be argued that steady state firing requires recruitment of vesicles such that the rate of release at any given synapse may be dictated by access to the reserve pool of vesicles. Thus it may be that spontaneous firing rates are regulated by resting calcium currents and vesicles in the RRP and recycling pool, while stimulated release is more dependent upon vesicle recruitment form the reserve pool and the ability to module release of stored calcium (Guth et al., 1991).
In summary, we used real time capacitance measurements to identify saturable pools of vesicles and discovered a superlinear release component requiring recruitment of vesicles to release sites. We suggest that Ca2+ dependent vesicle trafficking is responsible for this movement, which is required for hair cell synapses to maintain high rates of sustained vesicle fusion. We postulate that the superlinear release component reflects synapses operating at maximal rates of release and trafficking and that release of an as yet undefined internal pool of Ca2+ may be required. These characteristics of synaptic vesicle recruitment and release make hair cell ribbon synapses quite unique as compared to other synapses.
Methods
Tissue preparation
The auditory papilla from red eared sliders (Trachemys scripta elegans) were prepared as previously described (Schnee et al., 2005), using methods approved by the IACUC committee at Stanford University following standards established by NIH guidelines. Tectorial membranes were removed as previously described by using a hypertonic and hypercalcemic (10 mM Ca2+) solution (Farris et al., 2006). The external recording solution contained (in mM) 125 NaCl, 0.5 KCl, 2.8 CaCl2, 2.2 MgCl2, 2 pyruvate, 2 creatine, 2 ascorbate, 6 glucose and 10 N-(2-Hydroxy-ethyl) piperazine-N′-(2-ethanesulfonic acid)(HEPES) with pH adjusted to 7.6 and osmolality maintained at 275 mosml/kg. 100 nM Apamin was included in the external solution to block SK potassium currents (Tucker and Fettiplace, 1996). Cells were imaged with a BX51 fixed stage upright microscope (Olympus) with bright field optics. Conventional epifluorescence was used for the Ca2+ imaging.
Cochlea from rat pups postnatal days 7–10 (P7-10) were dissected into an external solution containing (in mM) 135 NaCl, 5.8 KCl, 1.3 CaCl2, 0.9 MgCl2, 0.7 NaH2PO4, 10 HEPES, 5.6 glucose, 2 pyruvate, 2 creatine. Both stria and spiral ganglia were peeled from the organ of corti and the remaining epithelium was placed into a glass bottomed recording chamber. The tectorial membrane was removed and the organ of corti held in place with single strands of dental floss. Apamin was included at 100 nM to block small conductance calcium activated potassium currents.
Electrophysiology
Fire polished borosilicate patch electrodes of resistance 3–5 MΩ were used for all recordings. Unless otherwise stated, the internal solution for turtle contained (in mM) 110 CsCl, 5 MgATP, 5 creatine phosphate, 1 ethylene glycol-bis (β-amino ethyl ether)- N,N,N′nN′-tetraacetic acid (EGTA), 10 HEPES, 2 ascorbate (pH 7.2). Osmolality was maintained at 255 by adjusting CsCl levels, pH was 7.2. For perforated patch recordings the internal solution contained (in mM) 110 CsAspartate, 15 CsCl, 3 NaATP, 3 MgCl2, 1 BAPTA, 10 HEPES. Amphotericin, dissolved in dry DMSO was used as the perforating agent. In several experiments Alexa 488 was included in the recoding pipette to verify the whole cell mode was not obtained. For rat hair cells the internal solution contained (in mM) 90 Cs MethylSulfonate, 20 TEA, 1 EGTA, 5 MgATP, 5 creatine phosphate, 3 ascorbate, 3 MgCl2, 10 HEPES. Stimulus protocols were applied 10 minutes after achieving whole cell mode to allow equilibration of internal solution and run up of ICa (Schnee and Ricci, 2003). Hair cells were voltage-clamped with a lock-in amplifier (Cairn) allowing for capacitance measurements as initially described by (Neher and Marty, 1982) and later used for hair cell recordings (Johnson et al., 2002; Schnee et al., 2005). A ± 40 mV sine wave at 1.5 kHz was imposed onto the membrane holding potential, blanked during depolarization that elicit ICa, and resumed so that capacitance measurements pre and post stimulus were obtained. Capacitance data were amplified and filtered at 100 Hz offline. This amplifier was also used initially for validation of the two sine wave method (see below). The multiclamp amplifier (Axon Instruments) was also used for capacitance measurements. All data were sampled with a Daq/3000 (IOtech) driven by jClamp software (Scisoft, CT).
Two sine Method
Vesicle release was determined by measuring membrane capacitance correlates of surface area change. Capacitance was measured with a dual sinusoidal, FFT-based method, (Santos-Sacchi, 2004; Santos-Sacchi et al., 1998) relying on component solutions of a simple model of the patched cell (electrode resistance, Rs, in series with a parallel combination of membrane capacitance, Cm, and membrane resistance, Rm; see fig 1 in Santos-Sacchi 2004). In this RC analysis method, two voltage frequencies, f1 and f2 (twice the f1 frequency) are summed, and the real and imaginary components of the current response used to determine the magnitudes of the three model components. The time resolution of the Cm measurement is the period of f1, which we varied from 5.12 to 0.32 ms, corresponding to 195 to 3125 Hz. Comparisons between single sine and dual sine wave methods showed no difference for membrane responses to 100 ms depolarizations to −20 mV. Single sine values of 90 ± 15 fF (n=12) were obtained as compared to 110 ± 24 fF for dual sine wave measurements from the same cell population. The same two sine wave technique (implemented in jClamp) has been used previously, but only as a before and after measurement which gave similar results as the single sine method (Edmonds et al., 2004; Thoreson et al., 2004). Details of methods and control data are presented in supplemental figures 1–3. The time between stimuli was varied based on the previous stimulus but was never less than 2 minutes and typically varied between 5–10 minutes to ensure appropriate time for reaching equilibrium.
Calcium Imaging
Swept field confocal high speed (SFC) calcium imaging was performed as previously described (Beurg et al., 2009). The SFC (Prairie technologies, Middleton WI) was coupled to a Redshirt camera. Fluo 4ff was used as the indicator; chosen to both limit effects on release properties while serving to localize the calcium source. Images were captured at 125 fps with a 35 mm slit. A 100x dipping lens with an added 1.25 magnification giving a final pixel size of ~350 nm. Ribbons were identified using the Ctbp2 peptide tagged with rhodamine (Zenisek et al., 2003). Data was analyzed by selecting 3x3 pixel regions uniformly encompassing Ctbp2 labeled regions. Image planes were selected to help isolate individual synapses to ensure individual synapses were being investigated.
Data analysis
Data were included based on several parameters. Leak currents needed to be less than 50 pA at −85 mV and series resistance (uncompensated) needed to be stable and below 15 MΩ. As electrode capacitance compensation is critical for the accurate use of the two sine wave methodology, bath height and electrode filling were kept low to limit stray capacitance. Unless otherwise stated, data are presented as mean ± standard deviation with number of samples (n) given. Where appropriate student t-tests, two-tailed, were performed to assess significance; p values and correlation coefficients (r2) are listed with data.
Immunofluorescence and quantification of synapse number
Isolated papillae were incubated for 1 h at 4°C in external solution containing 4% formaldehyde and 0.1% Triton X-100. After washing four times for 10 min at room temperature in external solution containing 0.1% Triton X-100, papillae were incubated for 30 min in the same solution supplemented with 5% bovine serum albumin (BSA). Specimens were then incubated with primary antisera diluted at 1:250–1:500 in the same solution overnight at 4 °C. Antisera included those against Ctbp2 (rabbit polyclonal, #1869), Ribeye (rabbit polyclonal, #1846) and PSD-95 (mouse monoclonal, Abcam #2723, concentrated at 3.3 μg/μl with UPPA™- Protein Concentrate™ Kit, #662120, Calbiochem). After washing five times for 10 min at room temperature, samples were incubated with FITC/TRITC-conjugated secondary antibodies (Invitrogen, Carlsbad, CA) at a dilution of 1/500. Where mentioned, FITC-conjugated phalloidin (#77415, Sigma) was added during the incubation with the secondary antibodies. After washing five times for 10 min at room temperature, specimens were mounted between two coverslips with Vectashield (H1200, Vector Laboratories, Burlingame, CA), and images acquired with a Zeiss LSM5 Exciter confocal microscope with a 63x 1.4 NA oil-immersion objective or with a spinning disc confocal using 100x 1.4 NA oil-immersion lens. Background noise and contrast enhancement were adjusted with Volocity software (Improvision). Confocal z-stacks taken with 0.1 μm steps were analyzed using Volocity software. Ribeye- and PSD95-positive fluorescent objects with 25–100% intensity were indentified on independent channels. Intersecting objects were subsequently selected as potential synaptic ribbons (Suppl. Fig 5A) and manually confirmed using the point tool of Volocity (Suppl. Fig 5B). When two synaptic ribbons were in close proximity, objects were analyzed in the XZ-YZ planes (Suppl. Fig 5C–D) and line intensity profiles were performed (Suppl. Fig 5E) to identify individual synaptic terminals. The number of peaks, typically one, identified the number of synapses (see supplemental figure 4,5).
Supplementary Material
Highlights.
Real time capacitance measurements reveal distinct pools of vesicles
Vesicle trafficking to the ribbon synapse is Ca2+ dependent
Vesicle trafficking responsible for linear, indefatigable release at resting potential
Nonlinear Ca2+ changes drive superlinear release
Acknowledgments
We thank Drs. Uthaiah and Hudspeth for providing the Ctbp2 and Ribeye antibodies. The Ctbp2 peptide tagged with Rhodamine was generously provided by David Zenisek at Yale University. We thank Medha Pathak, Alan Cheng, the reviewers and editorial board for their help with this manuscript. This work was funded by NIDCD grant DC009913 to AJR and JSS. Also core grant P30 44992.
Footnotes
Publisher's Disclaimer: This is a PDF file of an unedited manuscript that has been accepted for publication. As a service to our customers we are providing this early version of the manuscript. The manuscript will undergo copyediting, typesetting, and review of the resulting proof before it is published in its final citable form. Please note that during the production process errors may be discovered which could affect the content, and all legal disclaimers that apply to the journal pertain.
References
- Beaumont V, Llobet A, Lagnado L. Expansion of calcium microdomains regulates fast exocytosis at a ribbon synapse. Proc Natl Acad Sci U S A. 2005;102:10700–10705. doi: 10.1073/pnas.0501961102. [DOI] [PMC free article] [PubMed] [Google Scholar]
- Beurg M, Fettiplace R, Nam JH, Ricci AJ. Localization of inner hair cell mechanotransducer channels using high-speed calcium imaging. Nat Neurosci. 2009;12:553–558. doi: 10.1038/nn.2295. [DOI] [PMC free article] [PubMed] [Google Scholar]
- Beurg M, Michalski N, Safieddine S, Bouleau Y, Schneggenburger R, Chapman ER, Petit C, Dulon D. Control of exocytosis by synaptotagmins and otoferlin in auditory hair cells. J Neurosci. 30:13281–13290. doi: 10.1523/JNEUROSCI.2528-10.2010. [DOI] [PMC free article] [PubMed] [Google Scholar]
- Beutner D, Voets T, Neher E, Moser T. Calcium dependence of exocytosis and endocytosis at the cochlear inner hair cell afferent synapse. Neuron. 2001;29:681–690. doi: 10.1016/s0896-6273(01)00243-4. [DOI] [PubMed] [Google Scholar]
- Coggins M, Zenisek D. Evidence that exocytosis is driven by calcium entry through multiple calcium channels in goldfish retinal bipolar cells. J Neurophysiol. 2009;101:2601–2619. doi: 10.1152/jn.90881.2008. [DOI] [PMC free article] [PubMed] [Google Scholar]
- Coggins MR, Grabner CP, Almers W, Zenisek D. Stimulated exocytosis of endosomes in goldfish retinal bipolar neurons. J Physiol. 2007;584:853–865. doi: 10.1113/jphysiol.2007.140848. [DOI] [PMC free article] [PubMed] [Google Scholar]
- Edmonds BW, Gregory FD, Schweizer FE. Evidence that fast exocytosis can be predominantly mediated by vesicles not docked at active zones in frog saccular hair cells. J Physiol. 2004;560:439–450. doi: 10.1113/jphysiol.2004.066035. [DOI] [PMC free article] [PubMed] [Google Scholar]
- Eisen MD, Spassova M, Parsons TD. Large releasable pool of synaptic vesicles in chick cochlear hair cells. J Neurophysiol. 2004;91:2422–2428. doi: 10.1152/jn.01130.2003. [DOI] [PubMed] [Google Scholar]
- Farris HE, Wells GB, Ricci AJ. Steady-state adaptation of mechanotransduction modulates the resting potential of auditory hair cells, providing an assay for endolymph [Ca2+] J Neurosci. 2006;26:12526–12536. doi: 10.1523/JNEUROSCI.3569-06.2006. [DOI] [PMC free article] [PubMed] [Google Scholar]
- Fernandez-Busnadiego R, Zuber B, Maurer UE, Cyrklaff M, Baumeister W, Lucic V. Quantitative analysis of the native presynaptic cytomatrix by cryoelectron tomography. J Cell Biol. 2010;188:145–156. doi: 10.1083/jcb.200908082. [DOI] [PMC free article] [PubMed] [Google Scholar]
- Frank T, Khimich D, Neef A, Moser T. Mechanisms contributing to synaptic Ca2+ signals and their heterogeneity in hair cells. Proc Natl Acad Sci U S A. 2009;106:4483–4488. doi: 10.1073/pnas.0813213106. [DOI] [PMC free article] [PubMed] [Google Scholar]
- Furukawa T, Hayashida Y, Matsuura S. Quantal analysis of the size of excitatory post-synaptic potentials at synapses between hair cells and afferent nerve fibres in goldfish. J Physiol (Lond) 1978;276:211–226. doi: 10.1113/jphysiol.1978.sp012229. [DOI] [PMC free article] [PubMed] [Google Scholar]
- Gomis A, Burrone J, Lagnado L. Two actions of calcium regulate the supply of releasable vesicles at the ribbon synapse of retinal bipolar cells. J Neurosci. 1999;19:6309–6317. doi: 10.1523/JNEUROSCI.19-15-06309.1999. [DOI] [PMC free article] [PubMed] [Google Scholar]
- Gray EG, Pease HL. On understanding the organisation of the retinal receptor synapses. Brain Res. 1971;35:1–15. doi: 10.1016/0006-8993(71)90591-9. [DOI] [PubMed] [Google Scholar]
- Griesinger CB, Richards CD, Ashmore JF. Fast vesicle replenishment allows indefatigable signalling at the first auditory synapse. Nature. 2005;435:212–215. doi: 10.1038/nature03567. [DOI] [PubMed] [Google Scholar]
- Guth PS, Aubert A, Ricci AJ, Norris CH. Differential modulation of spontaneous and evoked neurotransmitter release from hair cells: some novel hypotheses. Hear Res. 1991;56:69–78. doi: 10.1016/0378-5955(91)90155-3. [DOI] [PubMed] [Google Scholar]
- Holt M, Cooke A, Neef A, Lagnado L. High mobility of vesicles supports continuous exocytosis at a ribbon synapse. Curr Biol. 2004;14:173–183. doi: 10.1016/j.cub.2003.12.053. [DOI] [PubMed] [Google Scholar]
- Hudspeth AJ, Lewis RS. A model for electrical resonance and frequency tuning in saccular hair cells of the bull-frog, Rana catesbeiana. J Physiol (Lond) 1988;400:275–297. doi: 10.1113/jphysiol.1988.sp017120. [DOI] [PMC free article] [PubMed] [Google Scholar]
- Innocenti B, Heidelberger R. Mechanisms contributing to tonic release at the cone photoreceptor ribbon synapse. J Neurophysiol. 2008;99:25–36. doi: 10.1152/jn.00737.2007. [DOI] [PubMed] [Google Scholar]
- Issa NP, Hudspeth AJ. Characterization of fluo-3 labelling of dense bodies at the hair cell’s presynaptic active zone. J Neurocytol. 1996;25:257–266. doi: 10.1007/BF02284801. [DOI] [PubMed] [Google Scholar]
- Johnson SL, Forge A, Knipper M, Munkner S, Marcotti W. Tonotopic variation in the calcium dependence of neurotransmitter release and vesicle pool replenishment at mammalian auditory ribbon synapses. J Neurosci. 2008;28:7670–7678. doi: 10.1523/JNEUROSCI.0785-08.2008. [DOI] [PMC free article] [PubMed] [Google Scholar]
- Johnson SL, Thomas MV, Kros CJ. Membrane capacitance measurement using patch clamp with integrated self-balancing lock-in amplifier. Pflugers Arch. 2002;443:653–663. doi: 10.1007/s00424-001-0763-z. [DOI] [PubMed] [Google Scholar]
- Keen EC, Hudspeth AJ. Transfer characteristics of the hair cell’s afferent synapse. Proc Natl Acad Sci U S A. 2006;103:5537–5542. doi: 10.1073/pnas.0601103103. [DOI] [PMC free article] [PubMed] [Google Scholar]
- Khimich D, Nouvian R, Pujol R, Tom Dieck S, Egner A, Gundelfinger ED, Moser T. Hair cell synaptic ribbons are essential for synchronous auditory signalling. Nature. 2005;434:889–894. doi: 10.1038/nature03418. [DOI] [PubMed] [Google Scholar]
- Lagnado L. Ribbon synapses. Curr Biol. 2003;13:R631. doi: 10.1016/s0960-9822(03)00566-9. [DOI] [PubMed] [Google Scholar]
- Lelli A, Perin P, Martini M, Ciubotaru CD, Prigioni I, Valli P, Rossi ML, Mammano F. Presynaptic calcium stores modulate afferent release in vestibular hair cells. J Neurosci. 2003;23:6894–6903. doi: 10.1523/JNEUROSCI.23-17-06894.2003. [DOI] [PMC free article] [PubMed] [Google Scholar]
- Lenzi D, Runyeon JW, Crum J, Ellisman MH, Roberts WM. Synaptic vesicle populations in saccular hair cells reconstructed by electron tomography. J Neurosci. 1999;19:119–132. doi: 10.1523/JNEUROSCI.19-01-00119.1999. [DOI] [PMC free article] [PubMed] [Google Scholar]
- Li GL, Keen E, Andor-Ardo D, Hudspeth AJ, von Gersdorff H. The unitary event underlying multiquantal EPSCs at a hair cell’s ribbon synapse. J Neurosci. 2009;29:7558–7568. doi: 10.1523/JNEUROSCI.0514-09.2009. [DOI] [PMC free article] [PubMed] [Google Scholar]
- Liberman MC, Brown MC. Physiology and anatomy of single olivocochlear neurons in the cat. Hear Res. 1986;24:17–36. doi: 10.1016/0378-5955(86)90003-1. [DOI] [PubMed] [Google Scholar]
- LoGiudice L, Matthews G. The role of ribbons at sensory synapses. Neuroscientist. 2009;15:380–391. doi: 10.1177/1073858408331373. [DOI] [PMC free article] [PubMed] [Google Scholar]
- Mennerick S, Matthews G. Ultrafast exocytosis elicited by calcium current in synaptic terminals of retinal bipolar neurons. Neuron. 1996;17:1241–1249. doi: 10.1016/s0896-6273(00)80254-8. [DOI] [PubMed] [Google Scholar]
- Meyer AC, Frank T, Khimich D, Hoch G, Riedel D, Chapochnikov NM, Yarin YM, Harke B, Hell SW, Egner A, Moser T. Tuning of synapse number, structure and function in the cochlea. Nat Neurosci. 2009;12:444–453. doi: 10.1038/nn.2293. [DOI] [PubMed] [Google Scholar]
- Moser T, Beutner D. Kinetics of exocytosis and endocytosis at the cochlear inner hair cell afferent synapse of the mouse. Proc Natl Acad Sci U S A. 2000;97:883–888. doi: 10.1073/pnas.97.2.883. [DOI] [PMC free article] [PubMed] [Google Scholar]
- Naraghi M, Neher E. Linearized buffered Ca2+ diffusion in microdomains and its implications for calculation of [Ca2+] at the mouth of a calcium channel. J Neurosci. 1997;17:6961–6973. doi: 10.1523/JNEUROSCI.17-18-06961.1997. [DOI] [PMC free article] [PubMed] [Google Scholar]
- Neef A, Khimich D, Pirih P, Riedel D, Wolf F, Moser T. Probing the mechanism of exocytosis at the hair cell ribbon synapse. J Neurosci. 2007;27:12933–12944. doi: 10.1523/JNEUROSCI.1996-07.2007. [DOI] [PMC free article] [PubMed] [Google Scholar]
- Neher E, Marty A. Discrete changes of cell membrane capacitance observed under conditions of enhanced secretion in bovine adrenal chromaffin cells. Proc Natl Acad Sci U S A. 1982;79:6712–6716. doi: 10.1073/pnas.79.21.6712. [DOI] [PMC free article] [PubMed] [Google Scholar]
- Neves G, Lagnado L. The kinetics of exocytosis and endocytosis in the synaptic terminal of goldfish retinal bipolar cells. J Physiol. 1999;515(Pt 1):181–202. doi: 10.1111/j.1469-7793.1999.181ad.x. [DOI] [PMC free article] [PubMed] [Google Scholar]
- Nouvian R, Beutner D, Parsons TD, Moser T. Structure and function of the hair cell ribbon synapse. J Membr Biol. 2006;209:153–165. doi: 10.1007/s00232-005-0854-4. [DOI] [PMC free article] [PubMed] [Google Scholar]
- Parsons TD, Lenzi D, Almers W, Roberts WM. Calcium-triggered exocytosis and endocytosis in an isolated presynaptic cell: capacitance measurements in saccular hair cells. Neuron. 1994;13:875–883. doi: 10.1016/0896-6273(94)90253-4. [DOI] [PubMed] [Google Scholar]
- Parsons TD, Sterling P. Synaptic ribbon. Conveyor belt or safety belt? Neuron. 2003;37:379–382. doi: 10.1016/s0896-6273(03)00062-x. [DOI] [PubMed] [Google Scholar]
- Rizzoli SO, Betz WJ. The structural organization of the readily releasable pool of synaptic vesicles. Science. 2004;303:2037–2039. doi: 10.1126/science.1094682. [DOI] [PubMed] [Google Scholar]
- Rizzoli SO, Betz WJ. Synaptic vesicle pools. Nat Rev Neurosci. 2005;6:57–69. doi: 10.1038/nrn1583. [DOI] [PubMed] [Google Scholar]
- Roberts WM, Jacobs RA, Hudspeth AJ. Colocalization of ion channels involved in frequency selectivity and synaptic transmission at presynaptic active zones of hair cells. J Neurosci. 1990;10:3664–3684. doi: 10.1523/JNEUROSCI.10-11-03664.1990. [DOI] [PMC free article] [PubMed] [Google Scholar]
- Rose JE, Brugge JF, Anderson DJ, Hind JE. Phase-locked response to low-frequency tones in single auditory nerve fibers of the squirrel monkey. J Neurophysiol. 1967;30:769–793. doi: 10.1152/jn.1967.30.4.769. [DOI] [PubMed] [Google Scholar]
- Rose JE, Hind JE, Anderson DJ, Brugge JF. Some effects of stimulus intensity on response of auditory nerve fibers in the squirrel monkey. J Neurophysiol. 1971;34:685–699. doi: 10.1152/jn.1971.34.4.685. [DOI] [PubMed] [Google Scholar]
- Santos-Sacchi J. Determination of cell capacitance using the exact empirical solution of partial differential Y/partial differential Cm and its phase angle. Biophys J. 2004;87:714–727. doi: 10.1529/biophysj.103.033993. [DOI] [PMC free article] [PubMed] [Google Scholar]
- Santos-Sacchi J, Kakehata S, Takahashi S. Effects of membrane potential on the voltage dependence of motility-related charge in outer hair cells of the guinea-pig. J Physiol (Lond) 1998;510:225–235. doi: 10.1111/j.1469-7793.1998.225bz.x. [DOI] [PMC free article] [PubMed] [Google Scholar]
- Schnee ME, Lawton DM, Furness DN, Benke TA, Ricci AJ. Auditory hair cell-afferent fiber synapses are specialized to operate at their best frequencies. Neuron. 2005;47:243–254. doi: 10.1016/j.neuron.2005.06.004. [DOI] [PubMed] [Google Scholar]
- Schnee ME, Ricci AJ. Biophysical and pharmacological characterization of voltage-gated calcium currents in turtle auditory hair cells. J Physiol. 2003;549:697–717. doi: 10.1113/jphysiol.2002.037481. [DOI] [PMC free article] [PubMed] [Google Scholar]
- Sneary MG. Auditory receptor of the red-eared turtle: II. Afferent and efferent synapses and innervation patterns. J Comp Neurol. 1988;276:588–606. doi: 10.1002/cne.902760411. [DOI] [PubMed] [Google Scholar]
- Spassova MA, Avissar M, Furman AC, Crumling MA, Saunders JC, Parsons TD. Evidence that rapid vesicle replenishment of the synaptic ribbon mediates recovery from short-term adaptation at the hair cell afferent synapse. J Assoc Res Otolaryngol. 2004;5:376–390. doi: 10.1007/s10162-004-5003-8. [DOI] [PMC free article] [PubMed] [Google Scholar]
- Taberner AM, Liberman MC. Response properties of single auditory nerve fibers in the mouse. J Neurophysiol. 2005;93:557–569. doi: 10.1152/jn.00574.2004. [DOI] [PubMed] [Google Scholar]
- Thoreson WB, Rabl K, Townes-Anderson E, Heidelberger R. A highly Ca2+-sensitive pool of vesicles contributes to linearity at the rod photoreceptor ribbon synapse. Neuron. 2004;42:595–605. doi: 10.1016/s0896-6273(04)00254-5. [DOI] [PMC free article] [PubMed] [Google Scholar]
- Tucker T, Fettiplace R. Confocal imaging of calcium microdomains and calcium extrusion in turtle hair cells. Neuron. 1995;15:1323–1335. doi: 10.1016/0896-6273(95)90011-x. [DOI] [PubMed] [Google Scholar]
- Tucker TR, Fettiplace R. Monitoring calcium in turtle hair cells with a calcium-activated potassium channel. J Physiol (Lond) 1996;494:613–626. doi: 10.1113/jphysiol.1996.sp021519. [DOI] [PMC free article] [PubMed] [Google Scholar]
- von Gersdorff H, Matthews G. Depletion and replenishment of vesicle pools at a ribbon-type synaptic terminal. J Neurosci. 1997;17:1919–1927. doi: 10.1523/JNEUROSCI.17-06-01919.1997. [DOI] [PMC free article] [PubMed] [Google Scholar]
- Wittig JH, Jr, Parsons TD. Synaptic ribbon enables temporal precision of hair cell afferent synapse by increasing the number of readily releasable vesicles: a modeling study. J Neurophysiol. 2008;100:1724–1739. doi: 10.1152/jn.90322.2008. [DOI] [PMC free article] [PubMed] [Google Scholar]
- Zenisek D, Davila V, Wan L, Almers W. Imaging calcium entry sites and ribbon structures in two presynaptic cells. J Neurosci. 2003;23:2538–2548. doi: 10.1523/JNEUROSCI.23-07-02538.2003. [DOI] [PMC free article] [PubMed] [Google Scholar]
- Zenisek D, Steyer JA, Almers W. Transport, capture and exocytosis of single synaptic vesicles at active zones. Nature. 2000;406:849–854. doi: 10.1038/35022500. [DOI] [PubMed] [Google Scholar]
- Zidanic M, Fuchs PA. Kinetic analysis of barium currents in chick cochlear hair cells. Biophys J. 1995;68:1323–1336. doi: 10.1016/S0006-3495(95)80305-X. [DOI] [PMC free article] [PubMed] [Google Scholar]
Associated Data
This section collects any data citations, data availability statements, or supplementary materials included in this article.