Abstract
Hydrophilic interaction chromatography (HILIC) liquid chromatography/mass spectrometry (LC/MS) is appropriate for all native and reductively aminated glycan classes. HILIC carries the advantage that retention times (RTs) vary predictably according to oligosaccharide composition. Chromatographic conditions are compatible with sensitive and reproducible glycomics analysis of large numbers of samples. The data are extremely useful for quantitative profiling of glycans expressed in biological tissues. With these analytical developments, the rate limiting factor for widespread use of HILIC LC/MS in glycomics is the analysis of the data. In order to eliminate this problem, a Java-based open source software tool, Manatee, was developed for targeted analysis of HILIC LC/MS glycan data sets. This tool uses user-defined lists of compositions that specify the glycan chemical space in a given biological context. The program accepts high resolution LC/MS data using the public mzXML format and is capable of processing a large data file in a few minutes on a standard desktop computer. The program allows mining of HILIC LC/MS data with an output compatible with multivariate statistical analysis. It is envisaged that the Manatee tool will complement more computationally intensive LC/MS processing tools based on deconvolution and deisotoping of LC/MS data. The capabilities of the tool were demonstrated using a set of HILIC LC/MS data on organ-specific heparan sulfates.
Keywords: Glycomics, glycosaminoglycan, heparan sulfate, mass spectrometry, bioinformatics, proteoglycan
Introduction
Mass spectrometry produces information key to the understanding of gene function (functional genomics) through measurement of protein structure and expression patterns (proteomics). Most proteins are modified with carbohydrates (glycosylated), and mass spectrometry is used for determining patterns of glycan expression (glycomics). With the maturation of chromatographic and mass spectrometric methods for glycomics, researchers are capable of generating data on glycan expression in biological systems that are rich in information. Such datasets enable investigations into glycoconjugate biomarkers for cancer and other diseases. They also enable detailed understanding of the roles of glycans in biological systems through analysis of changes in glycan expression associated with gene expression and mutation studies. Glycomics LC/MS data are also crucial for the evaluation and quality control of biological drug products and therapeutics, including recombinant antibodies and other glycoproteins. The complexity and size of such glycomics LC/MS data sets increases the need for effective information processing tools in order to reach biochemical conclusions.
Hydrophilic interaction chromatography separates glycans based on size and number of acidic groups under solvent conditions appropriate for capillary scale LC/MS [1–9]. HILIC has proven extremely useful for LC/MS profiling of glycosaminoglycans (GAGs) including chondroitin sulfate (CS) and heparan sulfate (HS). Effective software tools are needed to address the primary challenges to the analysis of glycan HILIC LC/MS data sets. These are that (1) glycan liquid chromatography peaks are not as sharp as those commonly obtained for peptides in proteomics; (2) glycan elemental compositions and stable isotope envelopes differ significantly from those of peptides; and (3) effective analysis of glycan data sets is best accomplished using high resolution mass spectral data, requiring large file sizes.
Software tools designed for analysis of proteomics [10–13] and glycomics [14, 15] LC/MS data are quite powerful. Because they are based on deconvolution and deisotoping of high resolution LC/MS data sets, however, they are limited by relatively long computation times. In addition, they may ignore glycans with low abundance, which do not reach a critical threshold. In order to facilitate rapid analysis of glycomics LC/MS data using an approach complementary to the above, a new software tool is needed.
The list of all possible compositions for a given glycan class can easily be calculated. Typically, a few hundred compositions define the biological space for a given glycan class. Given this, glycomics LC/MS data may be queried effectively by extracting mass-to-charge ratio (m/z) measurements corresponding to each theoretical glycan composition. This process mirrors that used for manual extraction of glycan composition and abundance information from LC/MS data sets. Such a targeted approach for analysis of LC/MS data sets would be applicable to any compound class for which a candidate list of elemental compositions could be calculated. Such an approach would be computationally simple and would be complementary to deconvolution and deisotoping approaches because it would not involve recognition of isotopic clusters.
This manuscript describes a software tool for targeted analysis of glycomics LC/MS data sets and its application to a glycomics data set. This tool meets the need for rapid LC/MS data analysis using an algorithm that is complementary to those of more resource intensive programs [10–15]. The tool, Manatee, is a Java application that accepts LC/MS data in the public mzXML format [16] and generates an output that may be manipulated using spreadsheet and statistical analysis programs. The tool was validated using a published set of glycomics LC/MS data acquired on HS from five different organ samples that were interpreted manually [4]. Using the tool, it was possible to mine the glycomics data in greater depth to quantify compositions that were excluded due to the time consuming nature of manual interpretation. The results provide new biochemical insight into organ-specific expression of HS. It is anticipated that this open source tool will be useful to glycomics researchers for rapid analysis of HILIC LC/MS data sets using a desktop computer.
Experimental Methods
The glycomics LC/MS data analyzed in this work were described in a previous publication [4]. Briefly, bovine organ HS were digested exhaustively using heparin lyase III and analyzed using HILIC LC/MS with an Agilent 6520 quadrupole-time-of-flight mass spectrometer with a chip-based chromatographic interface. Data analysis in the previous publication was carried out as follows. Ion chromatograms were extracted using the mass spectrometer data system and integrated manually. The integrated peak list was manipulated using a spread sheet program to produce bar graphs of relative abundance of HS oligosaccharide composition. Due to the time consuming nature of this process, it was possible to analyze only a portion of the data contained in the LC/MS dataset. The data were converted to mzXML format [16] using the Trapper algorithm [17].
Manatee was written in Java for maximal compatibility across platforms, and requires no knowledge of the language to run the program using Java Web Start. Advanced users can also download a JAR file, which offers more control through the command-line interface and allows for multiple analyses to be script-run. Manatee utilizes several tools, including JFreeChart, JRAP (an mzXML parser), the Simple Logging Facade for Java (SLF4J), and the Batik SVG Java Toolkit from the Apache XML Graphics Project, adapted portions of msInspect [18] source code, and the Isotope Pattern Calculator from Pacific Northwest National Laboratory [19]. The tool and its source code may be obtained free-of-charge at: http://code.google.com/p/manatee-lc-ms/. The program is capable of processing a single large mzXML data file in less than 10 min. The graphical user interface is shown in Supplemental Figure 1.
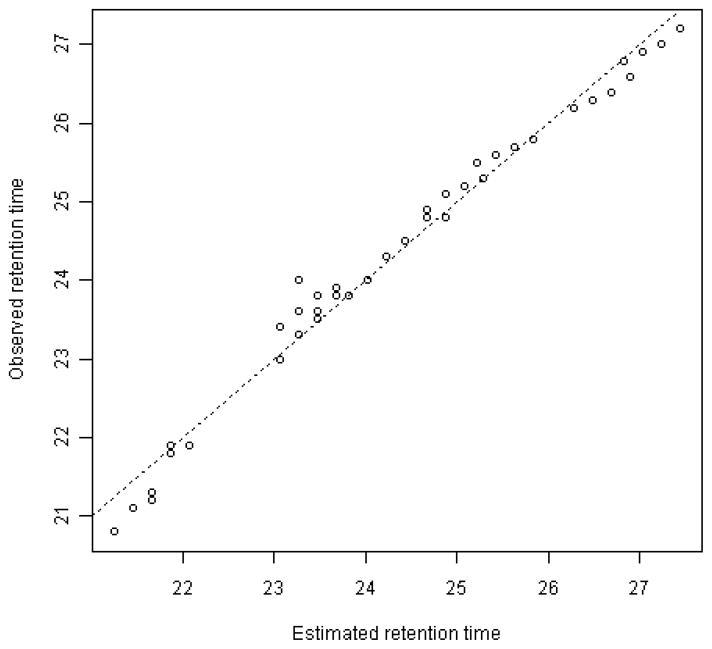
Retention time values were determined empirically for a subset of compositions for a representative HS LC/MS data file. The RT value of each target was then calculated as the weighted sum of the time contribution of its total composition (ΔHexA, HexA, HexN, acetate, sulfate). A linear regression model was used to obtain estimates of the time contribution of each component type. The estimated versus observed RTs for the target compositions are displayed in Figure 2, indicating a nearly perfect fit.
Figure 2. Scatter plot of observed HILIC RTs versus RTs estimated with a linear regression model.
The dashed line is the 45-degree line, representing observed RT = estimated RT.
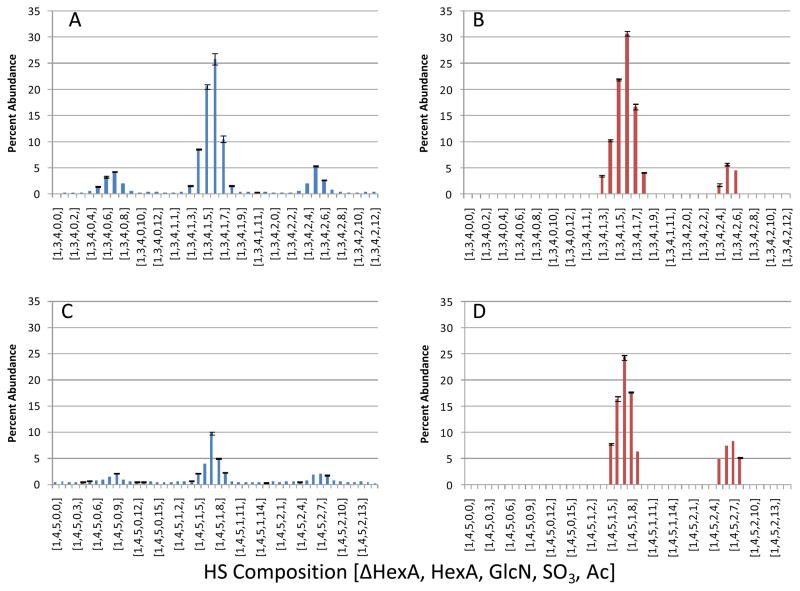
For processing of the HS LC/MS dataset, a list of target compositions was generated, which included all theoretically possible HS oligosaccharide compositions, see Supplemental Figure 2. Many of the compositions included in the targeted composition list would be expected to have insignificant intensities in the targeted analysis output. The oligosaccharide chain lengths and charge states summed were as follows: degree of polymerization (dp) 6, 2 and 3; dp8, 2–4; dp10 3–5; dp 12, 3–5. False positives occur when the m/z and RT for a given monoisotopic peak for a low abundance HS composition overlaps with that of one of the heavy isotopes of a high abundance composition with similar m/z and RT. False positives can therefore be minimized by using small RT and m/z windows in the Manatee parameters. To generate the bar graphs shown in Figures 4,5, parameters were set as follows: m/z window = 0.015 to −0.005 u, RT sum width = 45 s, and RT search width = 1 s.
Figure 4. Differences in percent abundance from integration technique.
A, Percent abundance of unsaturated dp8 oligosaccharides calculated using the Manatee approach. B, Percent abundance of select unsaturated dp8 oligosaccharides calculated manually. C, Percent abundance of unsaturated dp10 oligosaccharides calculated using the Manatee approach. D, Percent abundance of select unsaturated dp10 oligosaccharides calculated manually. A major difference in the two approaches is seen with the integration of noise in A and C. HS compositions are give as [ΔHexA, HexA, acetate, SO3].
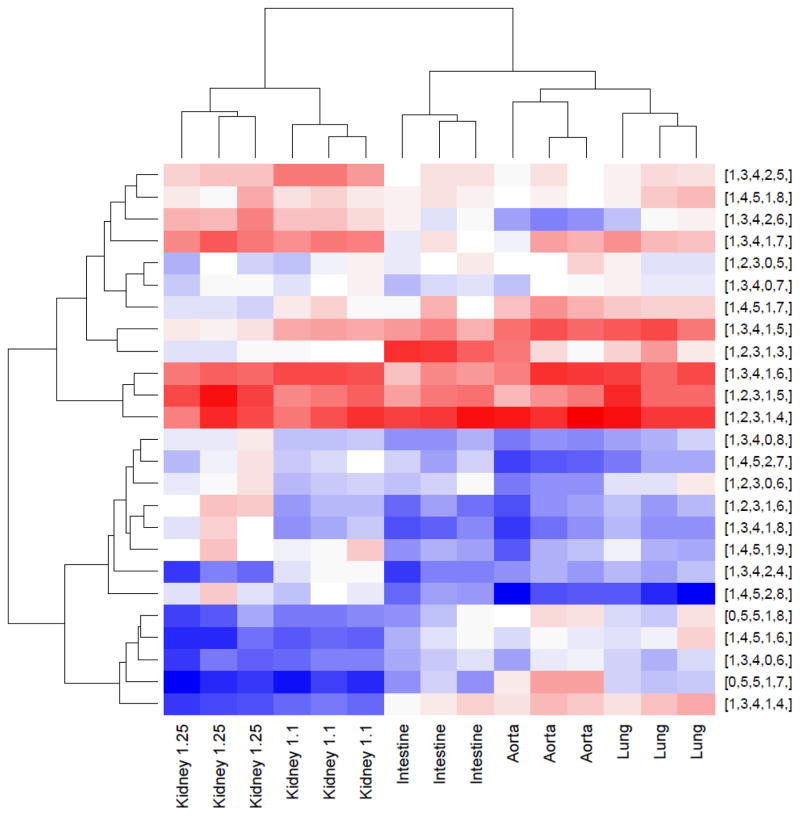
For multivariate statistical analysis (Figure 6), Manatee was run on all HS samples with the input targets file. The parameter specifications were: m/z window 0.015 to −0.005 u, RT search width = 1s, RT sum width = 30 s. The choice of m/z ranges around the theoretical m/z reflects an observed bias in the m/z profile to the left by approximately −0.01 u. The same choice of parameters was also used for with a modified target file in which each composition had one hydrogen atom removed. These parameters enabled Manatee to measure the abundance slightly left of the monoisotopic peak, and potentially identify a neighboring molecule with an overlapping isotopic distribution. The abundances from this run were treated as background, and background correction was done using a deconvolution approach [20] in the R package limma [21]. All runs were scaled to have the same median abundance, and multiple charge states of a composition were summed. Data were logarithm-transformed (using log base 10), and the heat map function with no scaling and default clustering parameters was applied to the 25 most abundant compositions. All processing was done in the R computing environment [22].
Figure 6. Unsupervised heat map of the 25 most abundant HS compositions in the five organ tissue dataset with hierarchical clustering of rows and columns.
Red indicates higher abundance, while blue represents lower abundance. Note that all replicates cluster together and that the kidney samples cluster together, as well. HS compositions are give as [ΔHexA, HexA, acetate, SO3].
Results
GAGs are polysaccharides composed of repeating disaccharide units that are modified by N-deacetylase/N-sulfotransferases, uronic acid C5 epimerase, and O-sulfotransferases to create mature structures with domains of high and low acetylation. The chains contain a high degree of heterogeneity resulting from their non-template driven biosynthesis [23, 24]. Mature HS chains contain domains of high degree of N-sulfation (abbreviated NS), high degree of N-acetylation (abbreviated NA) and mixed domains with mixed character (abbreviated NA/NS) [25]. Bacterial polysaccharide lyases are commonly used to depolymerize GAG chains [26]. Exhaustive digestion with heparin lyase III depolymerizes the NA and NA/NS domains, leaving the NS domains intact. Mass measurement defines the compositions of the resulting NS domain oligosaccharide mixtures with respect to number of HexA, GlcN, sulfate and acetate groups. It also determines whether the observed composition has been cleaved by the enzyme, by virtue of the characteristic mass of the Δ4,5-unsaturated HexA residue. Those compositions lacking such a residue are derived from the non-reducing end of the HS.
The targeted analysis approach for glycan LC/MS data is made possible by the fact that the list of possible glycan compositions that defines the chemical space for a given species and compound class is a few hundred values. Investigators may include in such lists definitions for any compositional variants hypothesized to be expressed. The list of candidate HS oligosaccharide compositions used in the analyses consists of 340 compositions and is shown in Supplemental Figure 2. This list demonstrates that the number of compositions defining the chemical space for glycan mixtures such as HS is relatively low and thus appropriate for a targeted analysis approach. In such an approach, ions corresponding to each calculated glycan mass value in the candidate table are quantified from the LC/MS datasets and tabulated.
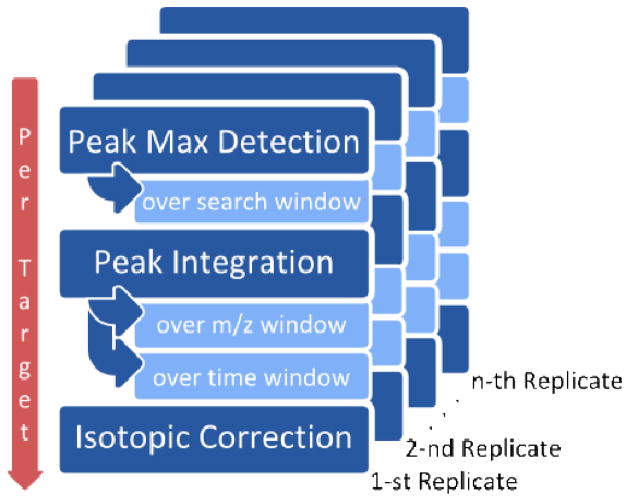
The core functionality of Manatee is to sum the intensities of targets over a window defined by a range of m/z and RT. Through the graphical interface, users: (1) select a series of replicate mzXML data files, (2) define the summation window in terms of both m/z and RT widths, and (3) select a targets text file containing a list of the molecules whose intensities are to be summed (Supplemental Figure 2). The targets file specifies the name, chemical composition, charge state, and predicted RT of each target. For each target, Manatee parses the chemical composition and calculates the theoretical isotopic distribution. It sums the intensities at the monoisotopic peak, and corrects for the abundances relative to the overall isotopic pattern. For example, if the monoisotopic peak represents 75% of the abundance of the isotopic cluster, Manatee multiplies the summed intensity by 1/0.75 = 4/3. Users may specify in step (2) the RT search width, which defines a range around the predicted RT over which Manatee searches for the true RT of each target; the maximum intensity found across this window is assigned as the true RT. The summed intensities per target are written into a simple tab-delimited text file. In addition, Manatee sums all charge states specified for the compositions entered in the target file and writes to another tab-delimited file the relative abundance of each compound in the target list. The computational process is illustrated in Figure 1.
Figure 1. Computational algorithm.
For every target composition, the program finds the local feature maximum (monoisotopic peak) and integrates the area-under-the-curve around this maximum; the user is able to provide a time window for searching, and both window time and mass-to-charge ratio window for integrating. The overall abundance measured for the target is then calculated from this measurement using its isotopic distribution. This process is repeated over any number of replicates.
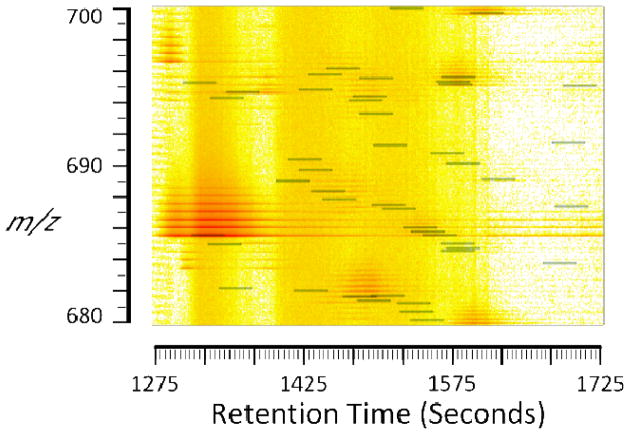
The use of HILIC separation allows facile correlation of oligosaccharide composition with RT [27–29]. For glycosaminoglycans, HILIC RTs increase with increasing number of sulfate groups for a given dp, and decrease with increasing number of acetate groups [7–9, 30]. Thus, RTs for the three most abundant Δ-unsaturated dp6, 8, 10, 12 compositions, respectively, were determined using manual inspection of one LC/MS dataset. These data were used to calculate RTs for all compositions in the target file (Supplemental Figure 2) using linear regression (Figure 2). Manatee optionally creates a heat map with summation overlays (Figure 3). The summation overlays are interactive markers that indicate the window summed for each target. This output enables facile identification of target m/z values that have overlapping m/z and retention time for which false positives are possible. The targeted areas reflect HS oligosaccharides from dp6–12 using the charge states specified in the Experimental Methods section. These charge states were determined by manual inspection of three abundant ions for each oligomer for a representative HS analysis. Oligosaccharides of dp4 and smaller were excluded because they were not fully retained under the chromatographic conditions used [4].
Figure 3. Heat map with target overlay.
Program-generated interactive heat map with horizontal bars indicating the integrated areas. Clicking on a target (green-tinted box) will display that target’s relevant information in a pop-up window.
Supplemental Figure 3 shows the HS compositions for (A) saturated dp11, (B) saturated dp12 and (C) Δ-unsaturated dp12. While unimodal distributions are observed in (B) and (C), a bimodal distribution is observed in (A). Manual inspection of the data showed that [0,5,6,1,5] and [0,5,6,1,6] had m/z and RT values that overlapped with the heavy isotopes of another composition and were thus false positives. A background correction approach was therefore used for multivariate statistical analysis.
To validate the targeted analysis approach for quantification of HS compositions from LC/MS datasets, results obtained using manual interpretation [4] were compared against those obtained using Manatee, as shown in Figure 4. The compositions and abundances obtained for HS Δdp8 (A, B) and Δdp10 (C, D) for Manatee outputs (A, C) and manual interpretation (B, D) are shown. For the manual interpretation, all peaks below a threshold value were assigned a value of zero. For the Manatee targeted analysis, the algorithm measures the intensity over specified RT and m/z windows, and thus measures non-zero values for all targeted compositions. Because all non-zero noise values are included into the calculation of percent abundances, the percent abundances are lower than obtained for manual interpretation. The overall trends in abundances, however, are very similar between the two approaches. The targeted approach quantified unacetylated compositions that were not included in the manual interpretation.
From previous work, we have observed NS domain disaccharides ranging from dp6 – dp12 in exhaustive digests [4]. The quantitative data extracted using Manatee enable more in-depth interpretation of the structural features of NS domains from different organ samples. In previous work, it was observed that the percent abundance of Δ-unsaturated NS domains decreases as the chain length increases [4]. These observations were made using a representative fraction of the total ions observed due to the time consuming nature of the manual data interpretation. The Manatee output enabled calculation of the relative abundances of all Δ-unsaturated NS domains as a function of chain length and organ, as shown in Supplemental Figure 4. The trend of decreasing NS domain abundance with increasing oligosaccharide size is the same as that previously observed.
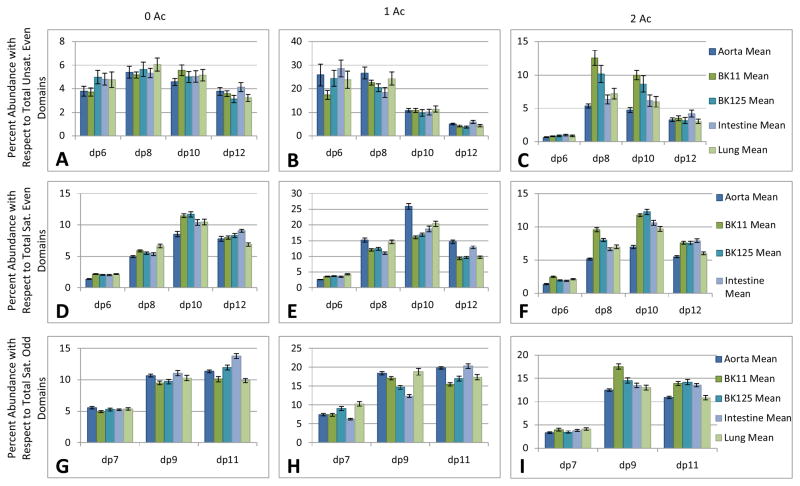
The targeted analysis output enables querying of the dataset to a greater level of detail, as shown in Figure 5. Oligosaccharides were grouped according to composition: Δ-unsaturated (A, B, C), saturated with even number of monosaccharides (D, E, F) and saturated with odd number of monosaccharides (G, H, I). The saturated compositions correspond to the non-reducing end domains of the parent HS chains. Saturated chains terminating with both HexA (even number of monosaccharides) and GlcN (odd number of monosaccharides) were present. The latter were not analyzed using the manual approach because of the laborious nature of the manual interpretation effort. With the targeted analysis of the LC/MS data, it was possible to separate the component compositions contributing to the overall trend in decreasing Δ-unsaturated abundances with increasing chain length (Supplemental Figure 4). Panels A, D and G show the abundances of unacetylated compositions as a function of dp. The abundances of mono-acetylated (B, E, H) and di-acetylated (C, F, I) compositions are also shown as a function of chain length. These data show that the trend for the highly abundant mono-acetylated Δdp10 (B) most closely mirror that of the average trend for all compositions combined (Supplemental Figure 4). Additionally, these data show low abundances for dp6 oligosaccharides that result from heparin lyase III activity. These trends were masked in the manual analysis [4] and the analysis of all compositions combined. For Δ-unsaturated oligosaccharides, the unacetylated (A), mono-acetylated (B), and di-acetylated (C) compositions show distinct trends in abundances with increasing chain length. These results indicate that extended highly sulfated NS domains exist in the interior regions of HS chains, albeit at abundances considerably lower than those of the shorter mono-acetylated NS domains. For saturated compositions, the same general trend of increasing abundance with chain length are observed for unacetylated (D, G), monoacetylated (E, H) and diacetylated (F, I) compositions. These results support the conclusion that extended NS domains are a conserved feature of non-reducing oligosaccharides in HS chains from all tissues tested.
Figure 5. Relative abundance as functions of dp and degree of acetylation.
A,B,C, relative abundances of Δ-unsaturated, even numbered domains of increasing chain length grouped by number of Ac (0, 1 or 2). D,E,F, relative abundances of saturated, even numbered domains of increasing chain length grouped by number of Ac (0, 1 or 2). G,H,I, relative abundances of saturated, odd numbered domains of increasing chain length grouped by number of Ac (0, 1 or 2). Tissue types used were as follows: aorta, 1.1 M bovine kidney, 1.25 M bovine kidney, intestine and lung.
The targeted analysis results may be used for multivariate statistical analysis to correlate glycan expression with biological variables. For this purpose a background correction approach was used to eliminate false positives as described in the Experimental Methods section. As shown in Figure 6, a group of 25 HS oligosaccharide compositions were found to segregate the five organ types analyzed in the experiment in an unsupervised clustering. The kidney HS samples cluster closely together, as expected since they were eluted from anion exchange chromatography using either low (1.1 M) or high (1.25 M) salt concentrations. These results demonstrate that high quality HILIC LC/MS data of lyase III generated HS oligosaccharides when quantified using Manatee are appropriate for multivariate clustering to segregate according to biological phenotype.
Conclusions
Prior to the development of the Manatee targeted glycomics analysis software, the time required for interpretation of HILIC LC/MS data on HS oligosaccharides was the limiting factor in wide spread use of the analytical technology. The new Manatee tool allows the abundances of user-defined lists of HS compositions to be rapidly extracted from the data. The ease of use of the Java-based tool and the short computation time needed using a desktop computer allow the user to optimize parameters and target lists without time consuming computations. The Manatee output may be manipulated with widely available spreadsheet and statistical packages. This enables determination of the abundances of HS compositions derived from the non-reducing ends of HS chains that may strongly influence the affinities of interaction with protein binding partners such as fibroblastic growth factors [31, 32]. The ability to query information-rich LC/MS datasets generated on organ-specific HS chains produced new information on the abundances of NRE domains beyond that determined by manual interpretation. Specifically, individual trends in abundances of NS domains that differ according to degree of acetylation are observed that extend the conclusions reached previously [4].
Manatee may also be used prior to multivariate statistical analyses to cluster data according to biological phenotype. Again, the ease of use of Manatee allows rapid evaluation of background selection parameters and clustering results. It is envisaged that Manatee will be useful for any compound class analyzed using LC/MS for which chromatographic RTs are known or can be calculated. Calculation of RTs is a straightforward process for HILIC separations that are widely used with glycans and glycoconjugates. The Manatee program is offered in the public domain for use as a complement to more computationally intensive approaches for analysis of LC/MS data.
Supplementary Material
Acknowledgments
Matthew Walsh tested the Manatee program and provided helpful comments on the manuscript. Funding was provided by NIH grants P41RR10888 and R01HL098950 and by an NSF Integrative Graduate Education and Research Traineeship.
This research utilized the Isotope Distribution Calculator developed by the Pacific Northwest National Laboratory, supported by the NIH National Center for Research Resources (Grant RR018522), the W.R. Wiley Environmental Molecular Science Laboratory (a national scientific user facility sponsored by the U.S. Department of Energy’s Office of Biological and Environmental Research and located at PNNL), and the National Institute of Allergy and Infectious Diseases (NIH/DHHS through interagency agreement Y1-AI-4894-01). PNNL is operated by Battelle Memorial Institute for the U.S. Department of Energy under contract DE-AC05-76RL0 1830.
References
- 1.Wuhrer M, Koeleman CA, Hokke CH, Deelder AM. Protein glycosylation analyzed by normal-phase nano-liquid chromatography--mass spectrometry of glycopeptides. Anal Chem. 2005;77:886–894. doi: 10.1021/ac048619x. [DOI] [PubMed] [Google Scholar]
- 2.Bruggink C, Wuhrer M, Koeleman CA, Barreto V, Liu Y, Pohl C, Ingendoh A, Hokke CH, Deelder AM. Oligosaccharide analysis by capillary-scale high-pH anion-exchange chromatography with on-line ion-trap mass spectrometry. J Chromatogr B Analyt Technol Biomed Life Sci. 2005;829:136–143. doi: 10.1016/j.jchromb.2005.10.006. [DOI] [PubMed] [Google Scholar]
- 3.Wuhrer M, Koeleman CAM, Deelder AM, Hokke CN. Normal-phase nanoscale liquid chromatography - Mass spectrometry of underivatized oligosaccharides at low-femtomole sensitivity. Anal Chem. 2004;76:833–838. doi: 10.1021/ac034936c. [DOI] [PubMed] [Google Scholar]
- 4.Staples GO, Shi X, Zaia J. Extended NS domains reside at the non-reducing end of heparan sulfate chains. J Biol Chem. 2010;285:18336–18343. doi: 10.1074/jbc.M110.101592. [DOI] [PMC free article] [PubMed] [Google Scholar]
- 5.Staples GO, Naimy H, Yin H, Kileen K, Kraiczek K, Costello CE, Zaia J. Improved hydrophilic interaction chromatography LC/MS of heparinoids using a chip with postcolumn makeup flow. Anal Chem. 2010;82:516–522. doi: 10.1021/ac901706f. [DOI] [PMC free article] [PubMed] [Google Scholar]
- 6.Naimy H, Leymarie N, Zaia J. Screening for anticoagulant heparan sulfate octasaccharides and fine structure characterization using tandem mass spectrometry. Biochemistry. 2010;49:3743–3752. doi: 10.1021/bi100135d. [DOI] [PMC free article] [PubMed] [Google Scholar]
- 7.Staples G, Bowman M, Costello CE, Hitchcock A, Lau J, Leymarie N, Miller C, Naimy H, Shi X, Zaia J. A Chip-based Amide-HILIC LC/MS Platform for Glycosaminoglycan Glycomics. Proteomics. 2009;9:686–695. doi: 10.1002/pmic.200701008. [DOI] [PMC free article] [PubMed] [Google Scholar]
- 8.Naimy H, Leymarie N, Bowman M, Zaia J. Characterization of heparin oligosaccharides binding specifically to antithrombin III using mass spectrometry. Biochemistry. 2008;47:3155–3161. doi: 10.1021/bi702043e. [DOI] [PMC free article] [PubMed] [Google Scholar]
- 9.Hitchcock A, Yates KE, Costello C, Zaia J. Comparative Glycomics of Connective Tissue Glycosaminoglycans. Proteomics. 2008;8:1384–1397. doi: 10.1002/pmic.200700787. [DOI] [PMC free article] [PubMed] [Google Scholar]
- 10.Horn DM, Zubarev RA, McLafferty FW. Automated reduction and interpretation of high resolution electrospray mass spectra of large molecules. J Am Soc Mass Spectrom. 2000;11:320–332. doi: 10.1016/s1044-0305(99)00157-9. [DOI] [PubMed] [Google Scholar]
- 11.Jaitly N, Mayampurath A, Littlefield K, Adkins JN, Anderson GA, Smith RD. Decon2LS: An open-source software package for automated processing and visualization of high resolution mass spectrometry data. BMC Bioinformatics. 2009;10:87. doi: 10.1186/1471-2105-10-87. [DOI] [PMC free article] [PubMed] [Google Scholar]
- 12.Mueller LN, Rinner O, Schmidt A, Letarte S, Bodenmiller B, Brusniak MY, Vitek O, Aebersold R, Muller M. SuperHirn - a novel tool for high resolution LC-MS-based peptide/protein profiling. Proteomics. 2007;7:3470–3480. doi: 10.1002/pmic.200700057. [DOI] [PubMed] [Google Scholar]
- 13.Li XJ, Yi EC, Kemp CJ, Zhang H, Aebersold R. A software suite for the generation and comparison of peptide arrays from sets of data collected by liquid chromatography-mass spectrometry. Mol Cell Proteomics. 2005;4:1328–1340. doi: 10.1074/mcp.M500141-MCP200. [DOI] [PubMed] [Google Scholar]
- 14.Vakhrushev SY, Dadimov D, Peter-Katalinic J. Software platform for high-throughput glycomics. Anal Chem. 2009;81:3252–3260. doi: 10.1021/ac802408f. [DOI] [PubMed] [Google Scholar]
- 15.Souady J, Dadimov D, Kirsch S, Bindila L, Peter-Katalinic J, Vakhrushev SY. Software utilities for the interpretation of mass spectrometric data of glycoconjugates: application to glycosphingolipids of human serum. Rapid Commun Mass Spectrom. 2010;24:1039–1048. doi: 10.1002/rcm.4479. [DOI] [PubMed] [Google Scholar]
- 16.Pedrioli PG, Eng JK, Hubley R, Vogelzang M, Deutsch EW, Raught B, Pratt B, Nilsson E, Angeletti RH, Apweiler R, Cheung K, Costello CE, Hermjakob H, Huang S, Julian RK, Kapp E, McComb ME, Oliver SG, Omenn G, Paton NW, Simpson R, Smith R, Taylor CF, Zhu W, Aebersold R. A common open representation of mass spectrometry data and its application to proteomics research. Nat Biotechnol. 2004;22:1459–1466. doi: 10.1038/nbt1031. [DOI] [PubMed] [Google Scholar]
- 17.Trans-Proteomic Pipeline, Sashimi Project. Trapper (Mass Hunter converter) 2010 URL http://sourceforge.net/projects/sashimi/files/trapper%20%28MassHunter%20converter%29/
- 18.Bellew M, Coram M, Fitzgibbon M, Igra M, Randolph T, Wang P, May D, Eng J, Fang R, Lin C, Chen J, Goodlett D, Whiteaker J, Paulovich A, McIntosh M. A suite of algorithms for the comprehensive analysis of complex protein mixtures using high-resolution LC-MS. Bioinformatics. 2006;22:1902–1909. doi: 10.1093/bioinformatics/btl276. [DOI] [PubMed] [Google Scholar]
- 19.Pacific Northwest National Laboratory. Isotope Pattern Calculator. Richland, WA: 2009. http://omics.pnl.gov/software/IPC.php. [Google Scholar]
- 20.Ritchie ME, Silver J, Oshlack A, Holmes M, Diyagama D, Holloway A, Smyth GK. A comparison of background correction methods for two-colour microarrays. Bioinformatics. 2007;23:2700–2707. doi: 10.1093/bioinformatics/btm412. [DOI] [PubMed] [Google Scholar]
- 21.Smyth GK. Limma: linear models for microarray data. In: Gentleman VC, Dudoit S, Irizarry R, Huber W, editors. Bioinformatics and Computational Biology Solutions using R and Bioconductor, R. Springer; New York: 2005. pp. 397–420. [Google Scholar]
- 22.R Development Core Team. R: A language and environment for statistical computing R Foundation for Statistical Computing. Vienna, Austria: 2009. URL http://www.R-project.org. [Google Scholar]
- 23.Esko JD, Selleck SB. Order out of chaos: assembly of ligand binding sites in heparan sulfate. Annu Rev Biochem. 2002;71:435–471. doi: 10.1146/annurev.biochem.71.110601.135458. [DOI] [PubMed] [Google Scholar]
- 24.Bulow HE, Hobert O. The Molecular Diversity of Glycosaminoglycans Shapes Animal Development. Annu Rev Cell Dev Biol. 2006;22:375–407. doi: 10.1146/annurev.cellbio.22.010605.093433. [DOI] [PubMed] [Google Scholar]
- 25.Kreuger J, Spillmann D, Li JP, Lindahl U. Interactions between heparan sulfate and proteins: the concept of specificity. The Journal of cell biology. 2006;174:323–327. doi: 10.1083/jcb.200604035. [DOI] [PMC free article] [PubMed] [Google Scholar]
- 26.Ernst S, Langer R, Cooney CL, Sasisekharan R. Enzymatic degradation of glycosaminoglycans. Crit Rev Biochem Mol Biol. 1995;30:387–444. doi: 10.3109/10409239509083490. [DOI] [PubMed] [Google Scholar]
- 27.Ahn J, Bones J, Yu YQ, Rudd PM, Gilar M. Separation of 2-aminobenzamide labeled glycans using hydrophilic interaction chromatography columns packed with 1.7 microm sorbent. J Chromatogr B Analyt Technol Biomed Life Sci. 2010;878:403–408. doi: 10.1016/j.jchromb.2009.12.013. [DOI] [PubMed] [Google Scholar]
- 28.Royle L, Campbell MP, Radcliffe CM, White DM, Harvey DJ, Abrahams JL, Kim YG, Henry GW, Shadick NA, Weinblatt ME, Lee DM, Rudd PM, Dwek RA. HPLC-based analysis of serum N-glycans on a 96-well plate platform with dedicated database software. Anal Biochem. 2008;376:1–12. doi: 10.1016/j.ab.2007.12.012. [DOI] [PubMed] [Google Scholar]
- 29.Domann PJ, Pardos-Pardos AC, Fernandes DL, Spencer DI, Radcliffe CM, Royle L, Dwek RA, Rudd PM. Separation-based Glycoprofiling Approaches using Fluorescent Labels. Proteomics. 2007;7(Suppl 1):70–76. doi: 10.1002/pmic.200700640. [DOI] [PubMed] [Google Scholar]
- 30.Hitchcock AM, Yates KE, Shortkroff S, Costello CE, Zaia J. Optimized extraction of glycosaminoglycans from normal and osteoarthritic cartilage for glycomics profiling. Glycobiology. 2006;17:25–35. doi: 10.1093/glycob/cwl046. [DOI] [PMC free article] [PubMed] [Google Scholar]
- 31.Schlessinger J, Plotnikov AN, Ibrahimi OA, Eliseenkova AV, Yeh BK, Yayon A, Linhardt RJ, Mohammadi M. Crystal structure of a ternary FGF-FGFR-heparin complex reveals a dual role for heparin in FGFR binding and dimerization. Mol Cell. 2000;6:743–750. doi: 10.1016/s1097-2765(00)00073-3. [DOI] [PubMed] [Google Scholar]
- 32.Pellegrini L, Burke DF, von Delft F, Mulloy B, Blundell TL. Crystal structure of fibroblast growth factor receptor ectodomain bound to ligand and heparin. Nature. 2000;407:1029–1034. doi: 10.1038/35039551. [DOI] [PubMed] [Google Scholar]
Associated Data
This section collects any data citations, data availability statements, or supplementary materials included in this article.


