

Abstract
Schwann cell differentiation and subsequent myelination of the peripheral nervous system require the action of several transcription factors, including Sox10, which is vital at multiple stages of development. The transition from immature to myelinating Schwann cell is also regulated posttranscriptionally and depends upon Dicer-mediated processing of microRNAs (miRNAs). Although specific miRNA targets have begun to be identified, the mechanisms establishing the dynamic regulation of miRNA expression have not been elucidated. We performed expression profiling studies and identified 225 miRNAs differentially expressed during peripheral myelination. A subset of 9 miRNAs is positively regulated by Sox10, including miR-338 which has been implicated in oligodendrocyte maturation. In vivo chromatin immunoprecipitation (ChIP) of sciatic nerve cells revealed a Sox10 binding site upstream of an alternate promoter within the Aatk gene, which hosts miR-338. Sox10 occupied this site in spinal cord ChIP experiments, suggesting a similar regulatory mechanism in oligodendrocytes. Cancer profiling studies have identified clusters of miRNAs that regulate proliferation, termed “oncomirs.” In Schwann cells, the expression of many of these proproliferative miRNAs was reduced in the absence of Sox10. Finally, Schwann cells with reduced Sox10 and oncomir expression have an increase in the CDK inhibitor p21 and a concomitant reduction in cell proliferation.
INTRODUCTION
Myelination of axons in the peripheral nervous system is performed by Schwann cells. Schwann cell precursors arise from the neural crest, and their specification is dependent on the SRY-related HMG box transcription factor Sox10 (7). Immature Schwann cells multiply and migrate out from the neural crest along axons, go through a radial sorting process, and form a 1:1 relationship with large-diameter axons. In contrast to oligodendrocytes that contact and myelinate multiple axons in the central nervous system, a Schwann cell myelinates a single large-caliber axon (>1 μm). Activation of the myelination program depends on differentiation signals from the axon which direct the Schwann cell to exit the cell cycle and begin the synthesis of myelin-specific proteins and myelin membrane (28). The transition to myelinating Schwann cells depends on the induction of the zinc finger transcription factor Egr2/Krox20 (61), which is itself dependent upon Sox10 (19, 51) and, in concert with Sox10, activates myelin genes, as well as lipid and cholesterol biosynthetic genes, at the onset of the myelination program (26, 27, 30, 31, 33). Sox10 is also necessary for the development of oligodendrocytes, making it an obligatory regulator of these two glial lineages (58).
Recent studies have implicated microRNAs (miRNAs) in the regulation of peripheral nerve myelination. In mouse models where Dicer was specifically ablated in Schwann cells, the Schwann cells remained viable and underwent the normal, albeit somewhat delayed, radial sorting process (5, 47, 71). However, Schwann cells lacking Dicer fail to produce myelin and instead continue to proliferate and express markers of immature Schwann cells such as Sox2 and c-Jun. The delayed developmental phenotype and reduced myelin gene expression observed in peripheral nerves is similar to that observed in oligodendrocytes of the central nervous system with ablated Dicer expression, indicating that both glial cell lineages require miRNAs for maturation (12, 72). However, ectopic introduction of several mature miRNAs in oligodendrocytes was able to partially rescue the phenotype and promote myelin gene expression (72).
Experiments thus far have identified a critical role for miRNAs in peripheral myelination, and some targets of specific miRNAs have begun to be identified (5, 47, 67, 71). Moreover, initial profiling of Schwann cells has identified the regulation of specific miRNAs during the course of peripheral myelination. However, the mechanisms by which specific miRNAs are regulated remain to be elucidated, particularly in relation to the known regulators of peripheral nerve myelination—Sox10 and Egr2. In the following experiments, we identify sets of coregulated miRNAs during Schwann cell development and identify a set that is regulated by Sox10, including miRNAs shown to be proproliferative. Additionally, we find that both cultured S16 Schwann cells and primary rat Schwann cells (RSCs) have reduced proliferation when transfected with multiple Sox10 small interfering RNAs (siRNAs). These experiments show for the first time that the target gene network of Sox10 in Schwann cell development includes the regulation of specific miRNAs. At least part of this miRNA regulatory network appears to be conserved in the control of oligodendrocyte development by Sox10.
MATERIALS AND METHODS
Isolation of miRNA from sciatic nerve cells.
Experiments with mice were performed with strict adherence to animal protocols approved by the Animal Care and Use Committee and the University of Wisconsin—Madison. For developmental analysis of miRNA expression, both sciatic nerves from each mouse pup were dissected and placed in lysis buffer provided by High Throughput Genomics (HTG; Tucson, AZ). Tissues were minced using a Tissue-Tearor, boiled for 5 min, and then snap-frozen. Samples were stored at −80°C and shipped to HTG on dry ice. Probe annealing, S1 nuclease treatment, and hybridization were performed by HTG.
miRNA profiling of sciatic nerve cells.
Each microarray has two elements for the measurement of each transcript (A1.1 and A1.2, for example). Each sample was tested in duplicate. Each set of data was normalized to the total signal for each microarray, and all values were averaged. Background signal was measured using the ANT gene, which is a plant gene and serves as a negative control. Nerve pairs were dissected from a minimum of three age-matched mice and separately processed for miRNA hybridization analysis, resulting in at least three biological replicates per developmental time point. A threshold of 1,000 relative units on the HTG arrays was used to determine if a miRNA was expressed. If the average expression value at any developmental time point exceeded 1,000 U, the miRNA was called as “expressed” in sciatic nerve cells. To better visualize changes in expression, the data were converted to a percent scale and values were determined relative to the maximum expression level, which was set at 100%.
siRNA treatment.
Dulbecco's modified Eagle's medium was supplemented with 5% bovine growth serum for passage of the S16 line as reported previously (33). CG4 oligodendrocyte cells were cultured as described in reference 4 but supplemented with either 5% bovine growth serum or 10% fetal bovine serum and passaged twice weekly. Primary RSCs were isolated and cultured as previously described (40) and were transfected in N2 medium (40) with 40 nmol of either Ambion control siRNA (siControl 1, catalog number AM4611) or Sox10 siRNA (siSox10 1, catalog number s131239) using Lipofectamine 2000 reagent (Invitrogen). CG4 oligodendrocytes were transfected using the Amaxa Nucleofection system and either Ambion control or Sox10 siRNA as reported previously (31). S16 Schwann cells were transfected with the following siRNAs using the Amaxa system: Ambion control siRNAs 1 (siControl, catalog number AM4611) and 2 (siControl number 2, catalog number AM4613), Ambion Sox10 siRNA (siSox10 1, catalog number s131239), Qiagen control siRNA (siControl 3, catalog number 1027280), Sox10 siRNA (siSox10 3, catalog number S101429351), and a Proligo Sox10 siRNA previously published (54). For the HTG assay, 48 h posttransfection with the Ambion siRNAs the cells were washed with phosphate-buffered saline (PBS), lysed with HTG lysis buffer, boiled for 5 min, frozen, and shipped to HTG for processing. For gene expression analysis, RNA was purified from S16 cells or RSCs 48 h after transfection using Tri Reagent (Ambion) and analyzed by quantitative reverse transcription (RT)-PCR using the StepOne Plus system (Applied Biosystems). Relative amounts of each gene were determined by the comparative CT method and normalized to 18S rRNA (36). The sequences of the primers used for quantitative RT-PCR (qRT-PCR) are as follows: 18S rRNA, 5′-CGCCGCTAGAGGTGAAATTCT-3′ and 5′-CCAACCTCCGACTTTCGTTCT-3′; AATK alt, 5′-AGCCACCTCAGAGCCTGAGA-3′ and 5′-GGCTTGAGGGCTGTCATCAA-3′; AATK full, 5′-CCCGCTCAGTGAGCTATCCT-3′ and 5′-GGACACAGCAACCACTGCAA-3′; Sox10, 5′-CGAATTGGGCAAGGTCAAGA-3′ and 5′-CACCGGGAACTTGTCATCGT-3′; p21, 5′-TCAGAGCCACAGGCACCAT-3′ and 5′-GTGGAACAGGTCGGACATCAC-3′; miR-17/92, 5′-TCTGTAGAGACGTAAGGGAAAATCAA-3′ and 5′-CGACAAATCCCAACCTGTGTAGA-3′; miR-106a/363, 5′-TCCTGCGGTTTACAGATGGAT-3′ and 5′-GATTAGAGTAATGGGAGAGAAATTGCA-3′; miR-106b/25, 5′-GGTAGGCAGTAGGGCTCAAAAA-3′ and 5′-CTCGGACACGGATCACCTTT-3′. Values with asterisks have a P value of less than 0.05 by analysis of variance. For measurement of mature miR-338, mirVana (Ambion) was used to isolate total RNA and miR-338-specific reverse transcriptase primers and TaqMan primers and probes were used in the StepOne Plus machine (Applied Biosystems). Measurement of mature miRNA levels was also performed using primer sets from Quanta Biosystems following cDNA synthesis also using Quanta kits. Values were normalized to the expression of RNU6 using the comparative CT method (36). Protein lysates from siRNA-treated cells were analyzed by immunoblotting for p21 (sc-397; Santa Cruz Biotechnology) and Sox10 as previously described (31). Immunoblot assays were quantified using ImageJ.
Proliferation assays.
S16 Schwann cells were transfected with various control and Sox10 siRNAs with Amaxa as described above and plated on coverslips in growth medium. After 48 h the medium was replaced with medium containing bromodeoxyuridine (BrdU) and incubated at 37°C for 20 min. RSCs were transfected as described above and incubated in BrdU-containing medium for 30 min. Cells were washed several times with PBS to remove apoptotic cells, fixed and permeabilized with ethanol, stained with an anti-BrdU antibody, and visualized with a fluorescein-conjugated secondary antibody in accordance with the manufacturer's instructions (Roche kit 11296736). Nuclei were visualized with a Hoechst stain. Cells were imaged with a Nikon Eclipse 80i using the 20× objective and a Q-imaging camera. Images were captured and cells were counted with the Nis-Elements software and the number of BrdU-positive cells was compared to the total number of cells (Hoechst).
Chromatin immunoprecipitation (ChIP).
ChIP assays were performed with pooled sciatic nerves from 12 rat pups or spinal cords from 4 Sprague-Dawley rat pups at postnatal day 15 (P15)as previously described (6, 11), except that herring sperm DNA was omitted from the blocking procedure. The antibodies used in this study include Sox10 (sc-17342x; Santa Cruz Biotechnology), and goat IgG (sc-2028; Santa Cruz Biotechnology) as a negative control. Following recovery of ChIP DNA, quantitative PCR was performed in duplicate to calculate the fold recovery of a given locus relative to nonspecific IgG, using the comparative CT method (36). The ChIP primers used are as follows: AATK, 5′-GAAGGGTCAGTGTGGGCAGA-3′ and 5′-TGAGTGGGTGCAGTGAGTCCT-3′; MPZ −2.3kb, 5′-AGCACCAGAGGACTCCAAATACAC-3′and 5′-TGTGCTCCACTGTTTTGCCT-3′.
Construction and sequencing of Illumina libraries.
ChIP samples and input controls were submitted to the University of Wisconsin—Madison DNA Sequencing Facility for ChIP-Seq library preparation and sequencing. A single-read, 36-bp run was performed, and reads were mapped to the Rattus norvegicus genome rn4 using Bowtie (http://bowtie-bio.sourceforge.net/index.shtml) to produce SAM files for further analysis. The analysis of two biological replicates provided 7,298,803 and 4,788,143 reads for Sox10. Inputs for the Sox10 immunoprecipitations were sequenced in parallel (a total of ∼28 million reads). Peak calling relative to the input was performed by BioInfoRx (Madison, WI) using the Quest algorithm (63). A description of the complete data set will be published elsewhere.
RESULTS
miRNA profiling during peripheral nerve myelination.
To characterize the transcriptional regulation of miRNA expression, expression patterns of miRNAs were measured at several time points in mouse peripheral nerve using miRNA microarrays. We employed technology from HTG termed quantitative nuclease protection assays. Briefly, these assays use labeled DNA probes complementary to mature miRNAs and can distinguish between closely related miRNAs. The pool of peripheral nerve RNA is hybridized to the probes, and all nonhybridized RNAs, including mRNA, rRNAs, and tRNAs, as well as nonhybridized probes, are digested with S1 nuclease. The samples are treated with base to destroy the RNA, leaving a pool of labeled DNA probes in a 1:1 stoichiometric relationship to the miRNAs in the original samples. The probes are then hybridized on a custom expression array, and their relative abundance is measured (52, 53).
In rodents, the period of active myelination is initiated perinatally and is largely completed by P20 (28). We chose to profile the expression of miRNAs in developing mouse nerve tissue at P1, P5, P10, and P20, as well as in adult tissue. Using probes for 989 human, rat, and mouse miRNAs, as well as negative and positive controls, we identified 225 miRNAs expressed in myelinating and/or adult mouse sciatic nerves (see Table S1 in the supplemental material). These expressed miRNAs fall into broad modes of developmental expression such as those repressed (Fig. 1A) or those induced during myelination (Fig. 1B). Two previously published reports compared either embryonic miRNA expression (embryonic day 17 [E17]) to that of P4 or compared P1 to P14 miRNA expression (3, 5). Our data extend the developmental analysis to more time points during myelination, as well as to adult peripheral nerve miRNA expression.
Fig 1.

Profiling of miRNA expression in developing nerves reveals unique modes of expression. Panel A shows the expression of miRNAs that are consistently reduced in expression during the period of peripheral nerve development (from P1 to P20), with expression values of the adult animal also shown. Panel B shows expression patterns of miRNAs that are consistently induced during this same developmental period. Average expression values from a minimum of 3 animals are represented as percentages of the maximum measured in the developmental set from P1 to adult.
A third of all characterized miRNAs are located within the intron of a coding gene and are presumed to be cotranscribed with the primary transcript of the host gene (35). Unless the region containing the miRNA can be differentially expressed from the host gene, the two will be transcribed at the same level but may show different stabilities due to posttranscriptional regulation. To further evaluate our data set, we compared the expression patterns of intronic miRNAs in our study with their host genes as determined in profiling studies of embryonic Schwann cell development or postnatal peripheral nerve myelination (8, 65). The Gpc1 gene that contains miR-149 is highly expressed in Schwann cells from early embryonic specification to adult tissue. Our profiling data also show strong expression of miR-149 throughout development, albeit with a small repression in the adult tissue. Smc4 is highly expressed embryonically (8), which matches our data that indicate the Smc4 cotranscript, miR-15b, is highly expressed in P1 nerve tissue but repressed at later time points (65). Lastly, the 12th intron of the human and rat Mcm7 genes contains the oncomir-1 cluster paralog, which includes miR-106b, miR-93, and miR-25 (43). Mcm7 is strongly expressed in neural crest cells, but its expression is reduced during embryonic development and further repressed during myelination. All three miRNAs contained within Mcm7 were found to be expressed most highly at birth and, similarly to Mcm7, repressed during myelination (8, 65). Overall, these data show that our miRNA profiling data are consistent with both previous miRNA nerve profiling studies and cotranscribed mRNA expression patterns previously examined.
Identification of Sox10-dependent miRNA regulation.
The Sox10 transcription factor is integral to the specification and development of Schwann cells (7). Direct binding of Sox10 to regulatory genes, as well as myelin-specific genes, is required for proper myelination in peripheral nerves (19, 26, 27, 30, 34, 45, 51). To identify miRNAs dependent upon Sox10 for expression, we transfected S16 Schwann cells with control or Sox10 siRNA and measured changes in miRNA levels using HTG RNA arrays. Cultured rat S16 Schwann cells express critical myelin genes such as Mpz and Pmp22 at levels comparable to those in in vivo myelinating peripheral nerves (21), and we have previously used siRNA technology to reduce Sox10 levels in S16 cells (31) (see Fig. 8B and 9B for knockdown efficiency). Of the miRNAs expressed at P20 in sciatic nerve cells, 62% were found to be expressed in S16 Schwann cells, making them a good model to study the regulation of miRNA biogenesis in Schwann cells.
Fig 8.
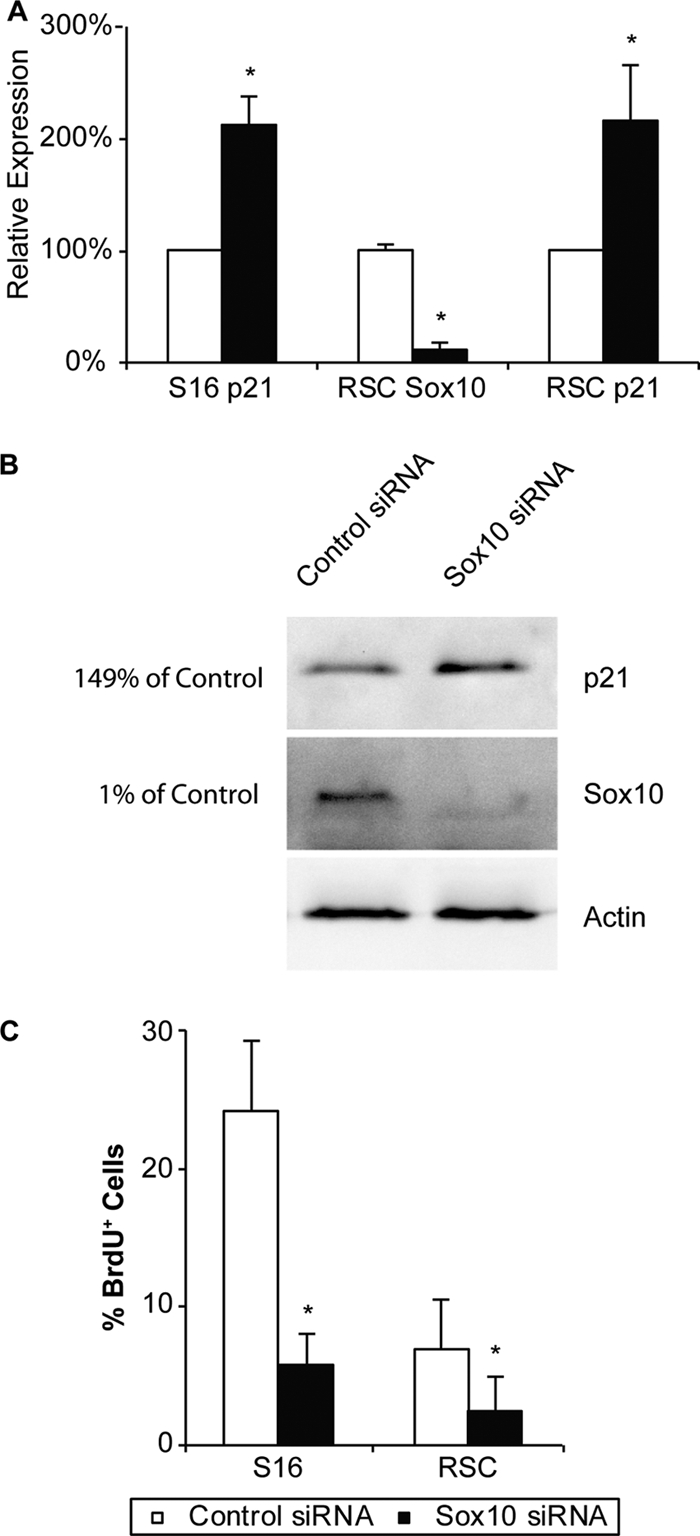
P21/CDKN1A is induced and cell proliferation is reduced in cultured Schwann cells with reduced Sox10. (A) qRT-PCR primer sets for the p21 transcript were used to measure relative changes in S16 cell and primary RSC gene expression after transfection with Sox10 siRNA. Asterisks indicate P values of <0.05 from three independent experiments, and error bars indicate standard deviations. (B) Western blot analysis of Sox10 and p21 protein levels in S16 cells transfected with Sox10 siRNA. Actin was used as a loading control, and percentage knockdown quantification values relative to the control transfection are shown to the left. (C) S16 Schwann cells or primary RSCs transfected with Sox10 or control siRNA were incubated in BrdU-containing medium, and the number of nuclei incorporating the nucleoside was compared to the total number of nuclei visualized by Hoechst staining. Cells transfected with Sox10 siRNA incorporated less BrdU label than did cells transfected with control siRNA. The results represent average values from three independent transfections of Sox10 and control siRNA. In each transfection, three unique windows of cells were counted. In all cases, asterisks indicate P values of <0.05 and error bars represent standard deviations.
Fig 9.
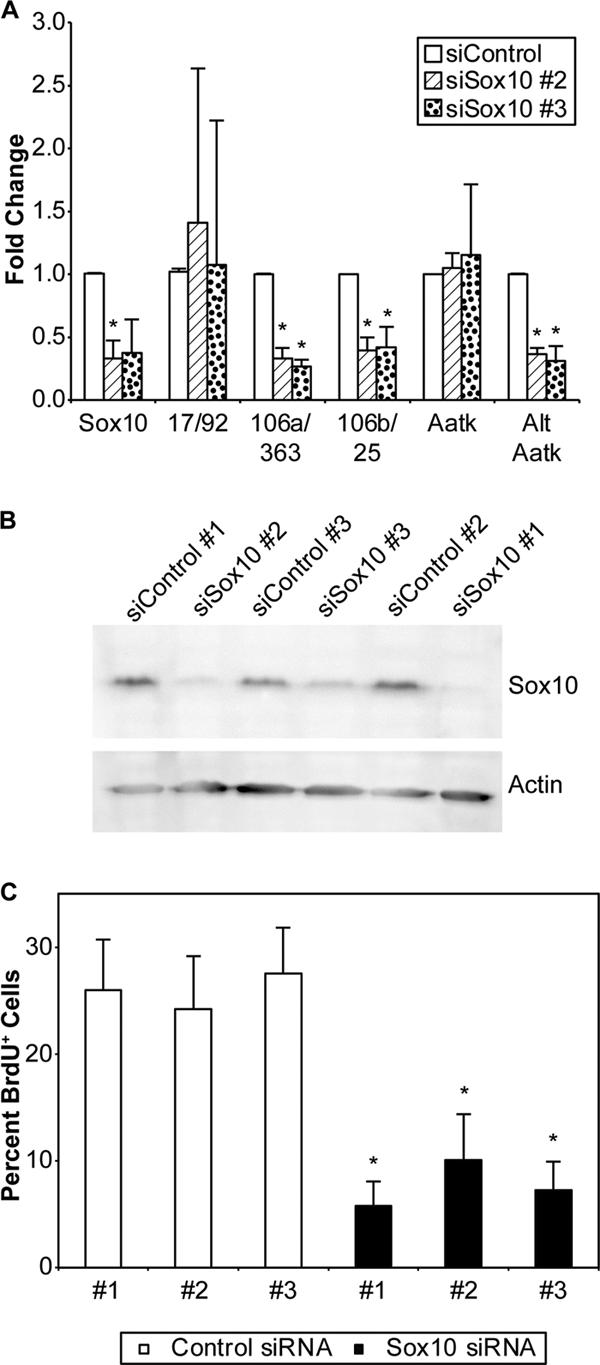
Other Sox10 siRNAs show the same effects in S16 cells. (A) Relative changes in gene expression following the transfection of different Sox10 siRNAs. In all cases, the appropriate control siRNA was used; however, no changes in gene expression between the different controls were observed. (B) Relative efficacy of knockdown of Sox10 protein by different siRNAs relative to their paired control visualized by immunoblot analysis. Actin was used as a loading control. (C) Effect on BrdU incorporation relative to total cell levels of the various Sox10 siRNAs and controls in S16 Schwann cells. The results represent average values from three technical replicates of Sox10 and control siRNAs. In all cases, asterisks indicate P values of <0.05 and error bars represent standard deviations.
The expression of 9 miRNAs was reduced greater than 50% in two independent microarray experiments when Sox10 levels were depleted in S16 cells using siRNA. These Sox10-dependent miRNAs include miR-106a, miR-20b, miR-19b, miR-363, miR-338, miR-92b, miR-350, miR-17, and miR-340 (Fig. 2). The expression of these Sox10-dependent miRNAs in developing nerves follows diverse temporal modes; however, the largest cohort becomes repressed ∼2- to 4-fold during development, including miR-17, miR-106a, miR-20b, miR-350, miR-338, and miR-19b (Table 1).
Fig 2.

Repression of miRNAs in Schwann cells transfected with Sox10 siRNA. Two independent Sox10 and control siRNA transfections were performed and hybridized to the miRNA arrays. The ratio of Sox10 miRNA expression to that of the control was calculated for each transfection. Relative expression values for the 9 miRNAs that showed a greater than 50% downregulation in independent Sox10-depleted Schwann cells are shown. White bars represent expression values from control siRNA transfections, and black bars represent expression values of Sox10 siRNA transfections. miRNAs transcribed as polycistronic clusters are bracketed.
Table 1.
Expression of Sox10-dependent miRNAs during peripheral nerve myelination
| miRNA | % expression |
||||
|---|---|---|---|---|---|
| P1 | P5 | P10 | P20 | Adult | |
| hsa-miR-17 | 100 | 66 | 50 | 28 | 10 |
| hsa-miR-106a | 100 | 65 | 55 | 32 | 9 |
| hsa-miR-20b | 100 | 56 | 16 | 8 | 9 |
| hsa-miR-19b | 100 | 89 | 66 | 11 | 17 |
| hsa-miR-363 | 98 | 63 | 59 | 83 | 100 |
| hsa-miR-338 | 94 | 68 | 74 | 43 | 100 |
| hsa-miR-92b | 45 | 38 | 90 | 100 | 60 |
| hsa-miR-340 | 20 | 75 | 100 | 58 | 2 |
| rno-miR-350 | 100 | 91 | 31 | 13 | 21 |
Sox10 directly regulates miR-338 production by regulation of the host Aatk gene.
Of the miRNAs identified as Sox10 dependent, one previously investigated for its role in glial cell maturation is miR-338, which helps drive the differentiation of oligodendrocytes by repressing the expression of Hes5 and Sox6, antagonists of oligodendrocyte maturation (72). Moreover, miR-338 has been shown to be highly expressed in Schwann cells and to have the greatest degree of downregulation in the Schwann cell-specific Dicer knockout (5, 71). In addition, miR-338 was recently identified as a biomarker of Schwann cell origin in a transmissible cancer model in Tasmanian devils (39). We observed a 5-fold downregulation of miR-338 when Schwann cells were transfected with Sox10 siRNA (Fig. 2). A specific qRT-PCR assay for mature miR-338 revealed a similar downregulation of mature miR-338 by more than 50% in Sox10 siRNA-transfected Schwann cells, validating the microarray findings (see Fig. 5A).
Fig 5.
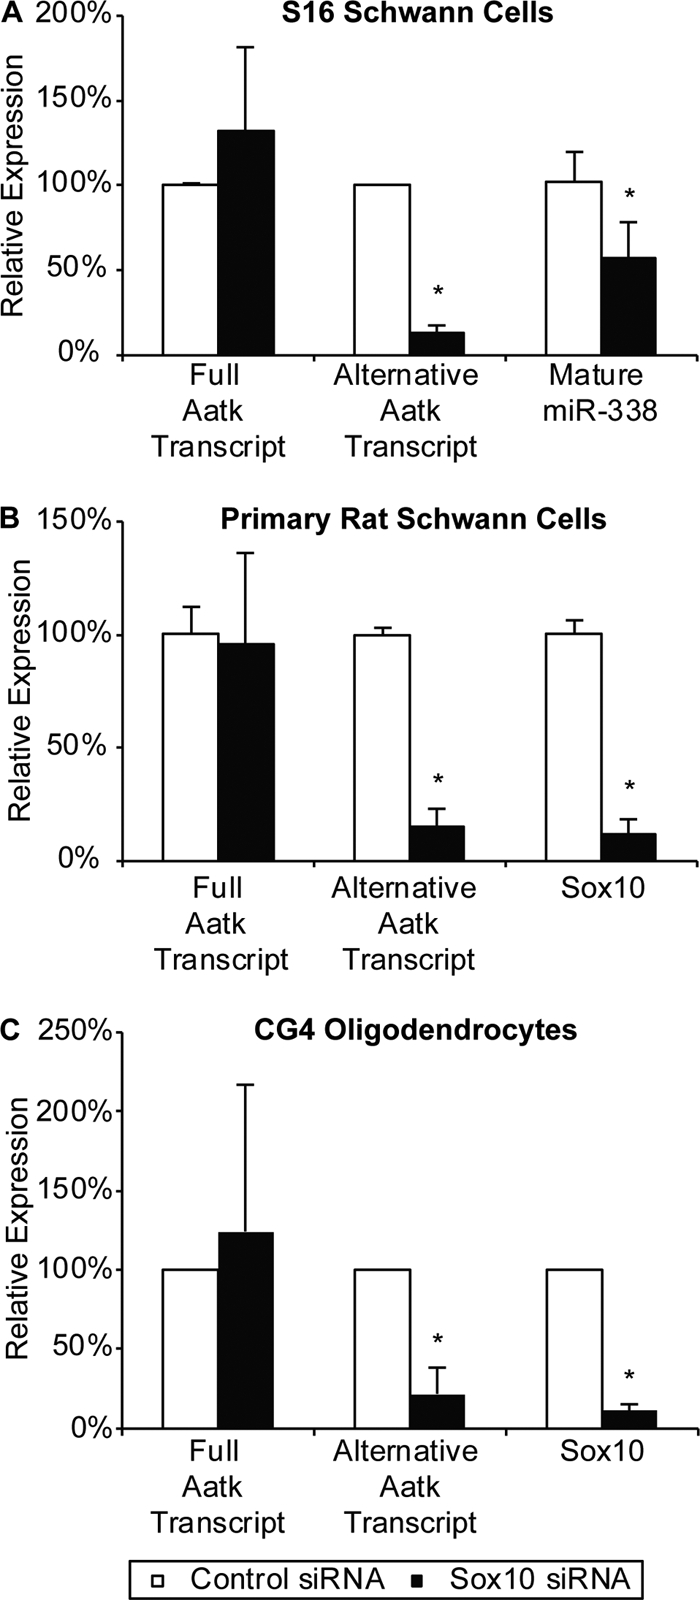
An internal Aatk transcript containing miR-338 is Sox10 dependent. (A) qRT-PCR was used to detect the expression of levels of Aatk transcripts and mature miR-338 in Sox10 siRNA-transfected S16 Schwann cells in three technical replicates. (B) Data show average transcript levels of Aatk and Sox10 from three independent transfections of Sox10 siRNA into primary RSCs. (C) Average relative expression of Sox10, the longer Aatk transcript, and the short internal Aatk transcript from three independent Sox10 siRNA transfections in CG4 oligodendrocytes. In all cases, asterisks indicate P < 0.05 and error bars indicate standard deviations.
While these data indicate that miR-338 is Sox10 dependent, it is possible that this regulation is not direct but rather relies on an intermediate regulatory factor sensitive to Sox10 levels. To demonstrate direct regulation of miR-338 by Sox10, we performed in vivo ChIP, followed by deep sequencing (ChIP-Seq), using sciatic nerves dissected from P15 rats. Sequence tags were mapped to the rat genome using Bowtie, and peaks were called by Quest and visualized using the University of California—Santa Cruz Genome Browser (17, 20). Interestingly, one of the most significant peaks in the Sox10 ChIP-Seq data resided within an intron of the Aatk gene, approximately 2.5 kb upstream of miR-338, which is also encoded by this gene (Fig. 3A). The binding site is in a highly conserved region of intron 3 and contains a consensus dimeric Sox10 binding sequence previously observed in direct targets of Sox10 regulation (30, 46) (Fig. 3C). We independently validated this binding in sciatic nerve cells by ChIP followed by qPCR with primers located within the highly conserved region identified in the ChIP-Seq data (Fig. 4). As miR-338 had been previously shown to be important in oligodendrocyte maturation (12, 72), we analyzed Sox10 ChIP samples from P15 rat spinal cords and found similar binding to this site, suggesting an analogous regulatory mechanism in oligodendrocytes (Fig. 4).
Fig 3.

Sox10 binds the internal promoter of Aatk. (A) ChIP-Seq analysis of Sox10 in pooled rat sciatic nerves at P15. Shown is the visualization of Quest peak data using the UCSC Genome Browser. A peak was observed at 109432604 to 109433117 of chromosome 10, which is in an intron of Aatk just upstream of miR-338. Aatk is located on the negative strand in the rat genome. The primer set labeled “Aatk full” detects the full-length transcript, while the primer set labeled “Aatk alt” detects the shorter internal transcript. Annotated ESTs are shown at the bottom. (B) The location of the ChIP primer set used to validate Sox10 binding is shown as a horizontal bar labeled “ChIP,” and the conservation of the region among mammals is indicated below. (C) Sequence within the highly conserved region bound by Sox10. Boxes indicate consensus dimeric Sox10 binding sites.
Fig 4.
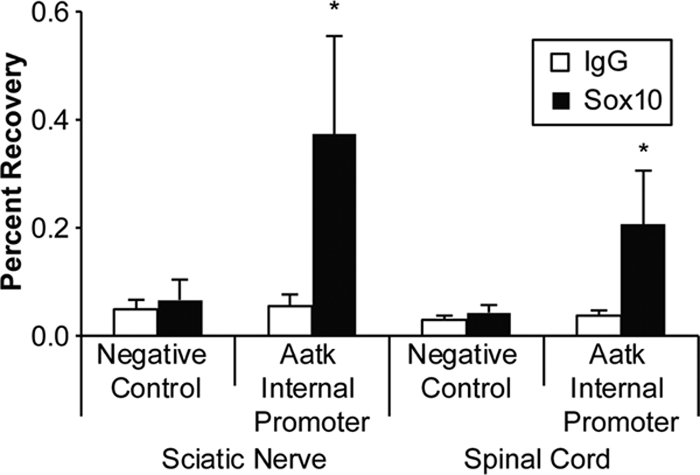
ChIP of Sox10 binding to the Aatk locus. ChIP assays of both pooled P15 rat sciatic nerve (n = 4) and pooled P15 spinal cord (n = 2) cells show that this conserved region within the Aatk gene is bound by Sox10 in both tissues. A ChIP primer set to a negative-control site within the myelin protein zero (Mpz) locus was used to measure background binding and did not detect Sox10 binding. Percent recovery was calculated relative to immunoprecipitation input. Black bars represent percent recovery of the Sox10 immunoprecipitation relative to the input from two independent experiments for each tissue type, and white bars represent percent recovery with an IgG antibody as a negative immunoprecipitation control. Error bars represent standard deviations. Primer locations are shown in Fig. 3B.
Analysis of rat expressed sequence tags (ESTs) for this locus indicated two transcriptional start sites for the Aatk gene (Fig. 3A). The first was located in the annotated promoter and included all Aatk exons. However, several ESTs began in intron 3 and included the miR-338-containing intron. Portions of intron 3 normally spliced out of the full-length message are part of the 5′ exon of the shorter transcript originating from an internal promoter. These transcripts begin immediately downstream of the major Sox10 binding peak in this locus identified using Sox10 ChIP-Seq. Interestingly, these unique transcripts were found in rat EST libraries from brain tissue (accession numbers FQ081776 and FQ078586). However, a start codon is not contained in either the new 5′ untranslated exon or in exon 4, but translation could begin in exon 5, resulting in an N-terminally truncated protein. Similar Aatk ESTs from an internal promoter have been identified in human brain tissue (e.g., accession no. DA346818). To determine if Sox10 regulates the transcription of the entire Aatk gene or only the transcription of this internal transcript, we designed two qRT-PCR primer pairs for the gene. The first is located within exon 2 and is normally spliced into the full-length transcript. The second primer pair was designed to measure the expression of a region just downstream of the Sox10 binding site and located in the third intron. The sequence of this primer pair would normally be spliced out of the mature full-length transcript but would be present in the exonic 5′ untranslated region of the annotated shorter transcript (Fig. 3A shows the locations of the primers). In this assay, changes in the more 3′ primer set without changes in the 5′ set would indicate differential regulation of the Aatk gene and the miR-338 gene within it. Interestingly, when we analyzed our cDNA from Sox10-depleted S16 Schwann cells, we did not observe a change in Aatk expression using the 5′ primer set located within exon 2 (Fig. 5A). However, expression of the alternative transcript as assayed by the more 3′ primer set was sharply reduced in S16 cells lacking Sox10 (Fig. 5A). As an independent test, primary RSCs were isolated and cultured as described previously (40) and transfected with Sox10 siRNA. We observed a significant downregulation of the internal Aatk transcript containing miR-338 with no change in the full-length transcript (Fig. 5B).
As miR-338 has been found to regulate the maturation of oligodendrocyte precursor cells (72) and the terminal differentiation of oligodendrocytes depends upon Sox10 (58), we tested whether a similar regulatory process for the expression of miR-338 exists in cultured oligodendrocytes. We transfected the CG4 oligodendrocyte cell line with Sox10 siRNA and observed a similar 90% knockdown of Sox10 mRNA, as observed in the S16 and RSC experiments. Using the qRT-PCR primer pairs described earlier, we found a downregulation of the internal Aatk transcript, whereas the full-length transcript was somewhat induced (Fig. 5C). Consistent with published reports (72), we observed a derepression of the miR-338 target gene Hes5 in CG4 cells with reduced Sox10 (data not shown). However, we could not detect expression of Hes5 in S16 Schwann cells, also consistent with microarray studies with peripheral nerves (8, 65), and therefore could not test the derepression of this gene in Schwann cells. We measured changes in mature miR-338 in CG4 cells and found the levels to be 25% lower in cells transfected with Sox10 siRNA in two independent experiments (data not shown). Based on these data, we found miR-338 to be dependent upon Sox10 regulation in both Schwann cells and oligodendrocytes.
Sox10 regulates the expression of proliferative miRNAs.
The majority of Sox10-dependent miRNAs (Fig. 2) have been characterized as clusters of miRNAs associated with cancer (22). In humans, the miR-17/92 cluster, the founding member of the oncomir-1 paralogs, is located on chromosome 13 (miR-17, miR-18a, mirR-19a, miR-20a, miR-19b-1, and miR-92a-1), paralog miR-106a/363 is located on chromosome X (miR-106a, miR-18b, miR-20b, miR-19b-2, miR-92a-2, and miR-363), and miR-106b/25 is located on chromosome 7 (miR-106b, miR-93, and miR-25). Duplication or overexpression of these clusters is associated with increased cell proliferation and poor prognosis in human cancers (11, 43, 62). These miRNAs increase cell proliferation by directly repressing cell cycle inhibitors such as Pten, Bim, and p21 (43, 64). Interestingly, when the expression of the three oncomir clusters in sciatic nerve cells is plotted with respect to developmental time point, a common mode of downregulation is observed (Fig. 6A). This decrease of proproliferative miRNA during the first days after birth is consistent with the characterized developmental time points of Schwann cells, as the Schwann cells exit the cell cycle and initiate myelination during this period. To validate the microarray findings, we measured miRNA levels in Schwann cells treated with Sox10 siRNA using qRT-PCR primer sets within the polycistronic clusters. We observed a reduction in the expression of the miR-17/92 cluster (50%) and the miR-106a/363 cluster (75%) (Fig. 6B). While the miRNAs contained in the third oncomir-1 paralog, miR-106b/25, did not meet our criteria as a Sox10-regulated transcript in the miRNA microarray, microarray analysis had shown that Mcm7 mRNA, which contains the intron encoding the miR-106b/25 miRNAs, is downregulated 5-fold in S16 Schwann cells in the presence of Sox10 siRNA (data not shown). Mcm7 encodes three miRNAs (miR-106b, miR-93, and miR-25), which we found were downregulated 33%, 30%, and 36%, respectively, using the HTG arrays. Using qRT-PCR, we found the miR-106b/25 cluster transcript to be significantly decreased (50%) in the Sox10-depleted Schwann cells (Fig. 6B). Using the Sox10 ChIP-Seq, we identified a site ∼10 kb upstream of the miR-106a/363 locus with Sox10 binding in developing sciatic nerves (Fig. 7). Little binding of Sox10 was observed within 20 kb of the Mcm7 gene or near the miR-17/92 locus in the ChIP-Seq data.
Fig 6.

Developmental expression of miR-17/92 oncomir paralogs in sciatic nerve cells. (A) The expression of the miRNAs contained in the three oncomir paralogs (miR-17/92, miR-106a/363, and miR-106b/25), as measured by microarray and transformed to a percent scale, was plotted with respect to developmental time point (P1 to adult). miRNAs reduced greater than 25% in Sox10 siRNA-transfected S16 cells are indicated by single asterisks in the key, and those reduced by more than 50% have double asterisks. miRNAs encoded in these oncomir clusters but not found to be expressed in developing nerve cells in the HTG arrays are omitted. (B) qRT-PCR primer sets were used to determine the expression levels of oncomir transcripts in S16 Schwann cells transfected with Sox10 siRNA. Data shown here are average values of three independent experiments, error bars indicate standard deviations, and asterisks indicate P values of <0.05. (C) To validate the findings of the HTG arrays and changes in the full-length oncomir transcript, primer sets for mature miRNAs were purchased. All RNA was poly(A) tailed, and cDNA was synthesized with a poly(T) primer. qRT-PCR was performed using a nonspecific reverse primer and a specific forward primer purchased from Quanta Biosystems. Control miRNAs miR-16 and miR-24 were also run and showed no response to Sox10 siRNA. The results represent average values from three independent transfections of Sox10 and control siRNA. In all cases, asterisks indicate P values of <0.05 and error bars represent standard deviations.
Fig 7.
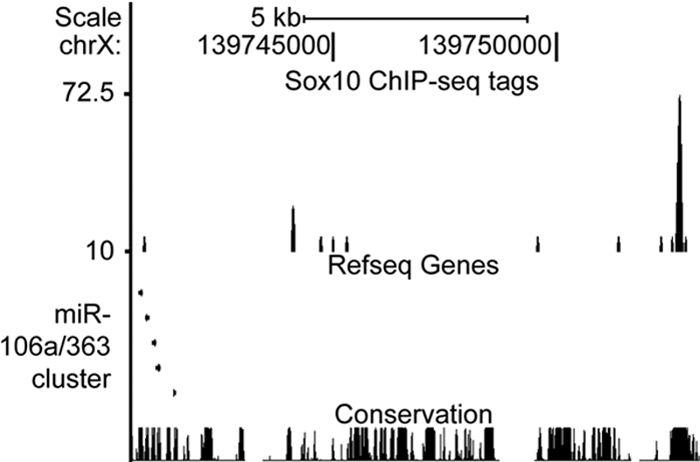
Sox10 binds to a region 10 kb upstream of the miR-106a/363 locus. (A) The UCSC Genome Browser was used to display binding of Sox10 in an in vivo ChIP-Seq experiment. A peak of was observed at 139,752,704 to 139,752,814 of chromosome X (chrX), which is 10 kb upstream of the miR-106a/363 locus, located on the negative strand. This region of binding is highly conserved in mammals and is nearly 100 kb away from the nearest annotated gene.
To validate both the HTG array findings and qRT-PCR analysis of the polycistronic oncomir messages, we assayed changes in mature miRNA levels using qRT-PCR and observed a statistically significant reduction in miR-17 and miR-20b with no change in miR-16 and miR-24, which were expressed in both developing nerve and S16 cells but were not identified as Sox10 dependent in the HTG arrays (Fig. 6C).
p21 mRNA and protein are upregulated in Schwann cells with reduced Sox10.
Members of the miR-106b family, which includes miR-17, miR-20a, miR-106a, miR-20b, miR-106b, and miR-93, have similar seed sequences and have been shown to directly target the p21/Cdkn1A mRNA and decrease the expression of p21 through destabilization of the mRNA and/or translational repression (25, 48). Several of these p21-targeting miRNAs were identified in this study as Sox10 dependent. To test if p21 was derepressed in Schwann cells with reduced Sox10 expression, we measured the expression of p21 mRNA and found it to be derepressed 2-fold in Schwann cells transfected with Sox10 siRNA (Fig. 8A), consistent with previous reports of p21 mRNA regulation (69). We then measured protein levels and found p21 protein to be similarly derepressed in Schwann cells with reduced Sox10 expression (Fig. 8B). These data indicate that Sox10 indirectly regulates the levels of p21 protein in Schwann cells by modulating the miRNA repressors of p21.
Sox10 deficient Schwann cells have reduced proliferation.
Based upon the reduction of proliferative miRNA in cells with a targeted reduction of Sox10, the concomitant increase in the CDK inhibitor p21, and the reduction of expression in genes related to proliferation (e.g., Mcm7), we measured the proliferation rate of cells transfected with Sox10 siRNA. After recovery from transfection, cells were incubated in BrdU-containing medium, washed, fixed, and immunostained with an anti-BrdU antibody. The total number of BrdU-positive cells was compared to the total number of cells. We observed a greater-than-4-fold reduction in the number of BrdU-positive nuclei in S16 cells transfected with Sox10 siRNA (Fig. 8C). Primary RSCs were examined similarly but were incubated in BrdU-containing medium for a longer period of time due to their reduced proliferation rates in culture compared to that of S16 cells. RSCs transfected with Sox10 siRNA were also found to have a 2.8-fold reduction in proliferation in independent transfections (Fig. 8C). No measurable effect on cell division was observed when cells were transfected with different control siRNAs. Therefore, the Sox10 regulation of oncomirs is consistent with the regulation of Schwann cell proliferation, as observed in S16 and primary Schwann cell cultures.
To independently verify Sox10 regulation of the shorter Aatk transcript, we tested two other Sox10 siRNAs and controls and obtained similar results (Fig. 9). The oncomir-1-related miRNA polycistrons were similarly reduced by treatment with independent siRNAs (Fig. 9A). Again, other Sox10 siRNAs and controls were tested in the BrdU proliferation assay and found to reduce S16 Schwann cell proliferation (Fig. 9C). These results are proportional to the efficacy of knockdown observed when Sox10 expression was measured by qRT-PCR, and immunoblot analysis indicating a dose-dependent effect on proliferation relative to Sox10 levels (Fig. 9B).
DISCUSSION
Substantial progress has been made in characterizing the requirement of miRNAs in both central and peripheral nerve myelination (23). These studies have elucidated several mechanisms of miRNA control of premyelinating development, as well as initiation of myelination by Schwann cells or their central nervous system counterpart oligodendrocytes (5, 13, 47, 66, 67, 71). While some of the important targets of miRNA action are beginning to be identified, the developmental regulation of miRNAs remains to be characterized. To address this question, we used microarray profiling to identify a set of miRNAs expressed in mouse peripheral nerves during development. These data provide an extensive profile of miRNA expression at multiple stages of Schwann cell development and delineate miRNA subsets that are either activated or repressed during myelination. Moreover, as additional regulators of Schwann cell development are identified, these miRNA profiling data may help elucidate dynamic control of miRNA regulation.
Our results are similar to the findings of other groups who utilized alternative profiling platforms. One study identified miR-29a as induced from birth to P14, which we also identified as induced in peripheral nerves during development (71). The same study identified miR-138 as highly expressed in myelinating peripheral nerves and a direct repressor of Ccnd1, Jun, and Sox2 (71), all negative regulators of Schwann cell maturation (60). We found miR-138 to be highly expressed throughout development and especially high in the P20 and adult samples, consistent with a role in repressing negative regulators of myelination. A second study similarly identified miR-138 as induced from E17 to P4, consistent with our findings that miR-138 shows an increase in expression during development (5). Other dynamically expressed miRNAs identified in our study were previously reported to show a similar temporal expression pattern, such as the repression of miR-134 and miR-1224 or the induction of miR-150 and miR-195 during myelination (5, 71).
In this study, we have characterized the regulation of miRNA expression by transcription factor Sox10, which is required for several stages of Schwann cell differentiation and controls the expression of individual myelin proteins (6, 7, 16, 26, 28, 30, 31, 34, 68). The results identify 9 miRNAs strongly downregulated in Schwann cells with reduced Sox10. One such Sox10-dependent miRNA was miR-338, located in the intron of the Aatk gene. Interestingly, the Aatk gene had been identified in a parallel microarray analysis of Sox10-regulated genes (data not shown). Aatk contains a highly conserved intronic element with canonical Sox10 binding sites, and ChIP assays revealed strong binding of Sox10 at this site in both peripheral and central nervous systems. Further database analysis of ESTs indicated an alternative promoter within the Aatk gene just downstream of this Sox10 binding site. We found that levels of a shorter transcript containing the miR-338-associated intron are Sox10 dependent, whereas the full-length transcript of Aatk is not, indicating that the expression of this miRNA is regulated by an alternate promoter. These data are consistent with a whole-genome study of human brain samples identifying histone marks typical of promoters (38). Both the characterized promoter and our identified internal promoter were associated with CpG islands and regions of histone 3 lysine 4 trimethylation in this study, two chromatin marks which commonly denote an active promoter, which we observed in Schwann cells. The production of a miRNA from an alternative transcript could be of broad interest, as nearly a third of all miRNAs are housed within another gene and the two are often assumed to be cotranscribed (35).
Sox10 expression is also critical for the differentiation of oligodendrocytes, as cells lacking Sox10 fail to express myelin proteins critical in the central nervous system (e.g., Plp, Mag, or Mbp) (58). Interestingly, our data suggest that miR-338 expression is regulated by Sox10 in oligodendrocytes. A recent publication indicated that miR-338 regulates oligodendrocyte development, promoting the transition from precursor cell to myelin-producing cell (72). Identified miR-338 targets include oligodendrocyte maturation inhibitors Sox6 and Hes5 and ectopic introduction of miR-338 in immature oligodendrocytes lacking Dicer promoted oligodendrocyte precursor maturation (72). The strong miR-338 expression in peripheral nerves observed by us and others (5, 71) and its dependence on Sox10 indicate that miR-338's role may be conserved in peripheral nerve myelination. However, there are likely other targets of miR-338, as we did not observe the expression of Sox6 and Hes5 in Schwann cells, consistent with microarray analysis (8, 65).
The related members of the SoxE class of transcription factors, including Sox10, have been implicated in regulating differentiation, survival, and proliferation (59). The SoxE protein Sox9 was shown to regulate proliferation of neural stem cells (56). Additionally, loss of Sox10 in Xenopus caused impaired proliferation of neural crest precursors (24), while overexpression of Sox10 was shown to inhibit transforming growth factor β-induced cell cycle arrest in rat neural crest stem cells (32). One mechanism by which Sox10 affects the survival/proliferation of Schwann cells is by regulating the expression of the ErbB3 gene (7, 41). ErbB3 dimerizes with ErbB2 and serves as a receptor for axonal neuregulin, a necessary ligand for Schwann cell development (41). Sox10 binds a monomeric site within the ErbB3 intron to activate the locus during peripheral nerve development (31). In addition, Sox10 is also required for Notch1 expression in Schwann cells (7), which also stimulates proliferation (70).
Since Sox10 expression is correlated with both proliferating and nonproliferating stages of Schwann cell development, the effect of Sox10 on the cell cycle is dependent upon interaction with other coexpressed factors. For example, impaired Sox10 expression leads to a lack of Schwann cell precursors (7, 57). However, when the Sox10 gene was ablated just after Schwann cell specification (using Dhh-Cre, with complete loss by E18.5), there was no apparent change in the overall cell number at birth and a transient increased proliferation at P16 (when Schwann cells are normally quiescent) (15). It is important to note that Sox10 also indirectly inhibits proliferation through its induction (together with Oct6/Pou3f1) of Egr2/Krox20 (19, 51) (beginning at E15.5), which is required for cell cycle exit in myelinating Schwann cells (44, 73, 74).
Tumor profiling studies have also implicated Sox10 in regulation of proliferation. Overexpression of Sox10 and its target ErbB3 in astrocytes has been associated with cancer, but no causative role has been observed (1). However, in a screen for candidate brain tumor genes, Sox10 was identified in five different tumors as potentially contributing to oncogenesis (29). A follow-up investigation with forced Sox10 expression in glial progenitor cells in mice found a synergy between Sox10 and PDGF-B in the formation of brain tumors and also found Sox10 to be overexpressed in human gliomas and melanomas (14).
Another mechanism by which Sox10 could regulate proliferation is presented by our miRNA studies. Most of the Sox10-dependent miRNAs are constituents of miRNA clusters known as oncomirs (22) for their close association with human cancers and their characterized regulation of the cell cycle to promote proliferation (18, 43). The best-studied locus (containing miR-17/92) has been termed oncomir-1 for its association with many different types of cancer (22). This oncomir has been duplicated in the mammalian genome to form two paralogs; miR-106a/363 and miR-106b/25 (64). These miRNAs have been independently linked to tumorigenesis in different tissues, indicating a role in cell cycle regulation (25, 48, 62). While they have been extensively characterized in cancer studies, much less is known regarding the regulation of oncomir expression in normal development (49), but they have been shown to be critical for oligodendrocyte proliferation (9). Mice deficient in miR-17/92 die shortly after birth due to incorrect lung and heart development. However, while knockouts of either miR-106a/363 or miR-106b/25 miRNA did not have an overt phenotype, the loss of both the miR-17/92 and miR-106b/25 miRNAs was embryonic lethal, suggesting some functional interaction between the loci (64).
Interestingly, these miRNAs are highly expressed in perinatal peripheral nerve cells, when Schwann cells are still proliferating, and their levels decline with development. Cdkn1a/p21, a target of these Sox10-dependent miRNAs, regulates the proliferation of Schwann cells during development, as nerve cells lacking p21 fail to exit the cell cycle and hyperproliferate without an increase in apoptosis (2). While the p21 transcript is highly expressed at birth (top 15% of all genes [8]) and is induced throughout myelination (65), p21 protein cannot be detected in peripheral nerves until after P7, when most proliferation has ceased (2). In our study, the highest oncomir expression is at P1 and declines approximately 2- to 4-fold as the cells exit the cell cycle and myelination proceeds. The mechanism of this decline in oncomir expression is not yet clear, but a number of factors may be responsible. One likely explanation is the observed reduction in the Sox10 transcript around birth (10). Since Sox10 is induced early in Schwann cell specification, our data suggest that Sox10 supports the proliferation of Schwann cell precursors and immature Schwann cells by stimulating the production of oncomirs. Oncomir downregulation may also reflect decreased activation by established regulators (e.g., myc) (42, 55), as myc levels decline during peripheral nerve myelination (65). Alternatively, it is possible that transcription factors directing differentiation (e.g., Egr2) may be involved in repression (37). In macrophages, it was recently shown that Egr2 represses the expression of miR-17/92 (50).
Overall, our studies have elucidated a novel pathway by which Sox10 regulates glial development, by showing that it regulates the expression of key miRNA regulators and also oncomir-associated miRNAs involved in the regulation of proliferation. These data therefore help elucidate an integrated transcriptional and epigenetic network of factors that control various aspects of Schwann cell and oligodendrocyte development.
Supplementary Material
ACKNOWLEDGMENTS
We thank Marie Adams and Eric Cabot at the UW Biotechnology Center for Illumina library preparation and data analysis. We also thank Yuerong Zhu for performing peak analysis of ChIP-Seq data. We thank Holly Hung for her assistance with sciatic nerve dissections and Erin Jones and Sung-Wook Jang for contributing Sox10 siRNA Affymetrix data. We thank Richard Quarles for providing the S16 cell line and Ian Duncan for providing the CG4 cell line. We also thank John Luecke for his assistance with the HTG miRNA microarrays.
This work was supported by a grant from the National Institutes of Health (RO1HD41590) and its ARRA supplement (HD041590-09S1) to J.S. and by a core grant to the Waisman Center from the National Institute of Child Health and Human Development (P30 HD03352).
Footnotes
Published ahead of print 7 November 2011
Supplemental material for this article may be found at http://mcb.asm.org/.
REFERENCES
- 1. Addo-Yobo SO, et al. 2006. Paired overexpression of ErbB3 and Sox10 in pilocytic astrocytoma. J. Neuropathol Exp. Neurol. 65: 769–775 [DOI] [PubMed] [Google Scholar]
- 2. Atanasoski S, et al. 2006. Cell cycle inhibitors p21 and p16 are required for the regulation of Schwann cell proliferation. Glia 53: 147–157 [DOI] [PubMed] [Google Scholar]
- 3. Awatramani R, Shumas S, Kamholz J, Scherer SS. 2002. TGFbeta1 modulates the phenotype of Schwann cells at the transcriptional level. Mol. Cell. Neurosci. 19: 307–319 [DOI] [PubMed] [Google Scholar]
- 4. Bourikas D, Mir A, Walmsley AR. 2010. LINGO-1-mediated inhibition of oligodendrocyte differentiation does not require the leucine-rich repeats and is reversed by p75(NTR) antagonists. Mol. Cell. Neurosci. 45: 363–369 [DOI] [PubMed] [Google Scholar]
- 5. Bremer J, et al. 2010. Ablation of Dicer from murine Schwann cells increases their proliferation while blocking myelination. PLoS One 5: e12450. [DOI] [PMC free article] [PubMed] [Google Scholar]
- 6. Bremer M, et al. 2011. Sox10 is required for Schwann-cell homeostasis and myelin maintenance in the adult peripheral nerve. Glia 59: 1022–1032 [DOI] [PubMed] [Google Scholar]
- 7. Britsch S, et al. 2001. The transcription factor Sox10 is a key regulator of peripheral glial development. Genes Dev. 15: 66–78 [DOI] [PMC free article] [PubMed] [Google Scholar]
- 8. Buchstaller J, et al. 2004. Efficient isolation and gene expression profiling of small numbers of neural crest stem cells and developing Schwann cells. J. Neurosci. 24: 2357–2365 [DOI] [PMC free article] [PubMed] [Google Scholar]
- 9. Budde H, et al. 2010. Control of oligodendroglial cell number by the miR-17-2 cluster. Development 137: 2127–2132 [DOI] [PubMed] [Google Scholar]
- 10. D'Antonio M, et al. 2006. Gene profiling and bioinformatic analysis of Schwann cell embryonic development and myelination. Glia 53: 501–515 [DOI] [PubMed] [Google Scholar]
- 11. Diosdado B, et al. 2009. MiR-17-92 cluster is associated with 13q gain and c-myc expression during colorectal adenoma to adenocarcinoma progression. Br. J. Cancer 101: 707–714 [DOI] [PMC free article] [PubMed] [Google Scholar]
- 12. Dugas JC, et al. 2010. Dicer1 and miR-219 are required for normal oligodendrocyte differentiation and myelination. Neuron 65: 597–611 [DOI] [PMC free article] [PubMed] [Google Scholar]
- 13. Dugas JC, Notterpek L. 2011. MicroRNAs in oligodendrocyte and Schwann cell differentiation. Dev. Neurosci. 33: 14–20 [DOI] [PMC free article] [PubMed] [Google Scholar]
- 14. Ferletta M, Uhrbom L, Olofsson T, Pontén F, Westermark B. 2007. Sox10 has a broad expression pattern in gliomas and enhances platelet-derived growth factor-B-induced gliomagenesis. Mol. Cancer Res. 5: 891–897 [DOI] [PubMed] [Google Scholar]
- 15. Finzsch M, et al. 2010. Sox10 is required for Schwann cell identity and progression beyond the immature Schwann cell stage. J. Cell Biol. 189: 701–712 [DOI] [PMC free article] [PubMed] [Google Scholar]
- 16. Finzsch M, Stolt CC, Lommes P, Wegner M. 2008. Sox9 and Sox10 influence survival and migration of oligodendrocyte precursors in the spinal cord by regulating PDGF receptor alpha expression. Development 135: 637–646 [DOI] [PubMed] [Google Scholar]
- 17. Fujita PA, et al. 2011. The UCSC Genome Browser database: update 2011. Nucleic Acids Res. 39: D876–D882 [DOI] [PMC free article] [PubMed] [Google Scholar]
- 18. Garzon R, Calin GA, Croce CM. 2009. MicroRNAs in cancer. Annu. Rev. Med. 60: 167–179 [DOI] [PubMed] [Google Scholar]
- 19. Ghislain J, Charnay P. 2006. Control of myelination in Schwann cells: a Krox20 cis-regulatory element integrates Oct6, Brn2 and Sox10 activities. EMBO Rep. 7: 52–58 [DOI] [PMC free article] [PubMed] [Google Scholar]
- 20. Gibbs RA, et al. 2004. Genome sequence of the brown Norway rat yields insights into mammalian evolution. Nature 428: 493–521 [DOI] [PubMed] [Google Scholar]
- 21. Hai M, Muja N, DeVries GH, Quarles RH, Patel PI. 2002. Comparative analysis of Schwann cell lines as model systems for myelin gene transcription studies. J. Neurosci. Res. 69: 497–508 [DOI] [PubMed] [Google Scholar]
- 22. He L, et al. 2005. A microRNA polycistron as a potential human oncogene. Nature 435: 828–833 [DOI] [PMC free article] [PubMed] [Google Scholar]
- 23. He X, Yu Y, Awatramani R, Lu QR. 2 May 2011, posting date Unwrapping myelination by microRNAs. Neuroscientist [Epub ahead of print.] doi:10.1177/1073858410392382 [DOI] [PMC free article] [PubMed] [Google Scholar]
- 24. Honoré SM, Aybar MJ, Mayor R. 2003. Sox10 is required for the early development of the prospective neural crest in Xenopus embryos. Dev. Biol. 260: 79–96 [DOI] [PubMed] [Google Scholar]
- 25. Ivanovska I, et al. 2008. MicroRNAs in the miR-106b family regulate p21/CDKN1A and promote cell cycle progression. Mol. Cell. Biol. 28: 2167–2174 [DOI] [PMC free article] [PubMed] [Google Scholar]
- 26. Jang SW, et al. 2010. Locus-wide identification of Egr2/Krox20 regulatory targets in myelin genes. J. Neurochem. 115: 1409–1420 [DOI] [PMC free article] [PubMed] [Google Scholar]
- 27. Jang SW, Svaren J. 2009. Induction of myelin protein zero by early growth response 2 through upstream and intragenic elements. J. Biol. Chem. 284: 20111–20120 [DOI] [PMC free article] [PubMed] [Google Scholar]
- 28. Jessen KR, Mirsky R. 2005. The origin and development of glial cells in peripheral nerves. Nat. Rev. Neurosci. 6: 671–682 [DOI] [PubMed] [Google Scholar]
- 29. Johansson FK, et al. 2004. Identification of candidate cancer-causing genes in mouse brain tumors by retroviral tagging. Proc. Natl. Acad. Sci. U. S. A. 101: 11334–11337 [DOI] [PMC free article] [PubMed] [Google Scholar]
- 30. Jones EA, et al. 2007. Interactions of Sox10 and Egr2 in myelin gene regulation. Neuron Glia Biol. 3: 377–387 [DOI] [PMC free article] [PubMed] [Google Scholar]
- 31. Jones EA, et al. 2011. Regulation of the PMP22 gene through an intronic enhancer. J. Neurosci. 31: 4242–4250 [DOI] [PMC free article] [PubMed] [Google Scholar]
- 32. Kim J, Lo L, Dormand E, Anderson DJ. 2003. SOX10 maintains multipotency and inhibits neuronal differentiation of neural crest stem cells. Neuron 38: 17–31 [DOI] [PubMed] [Google Scholar]
- 33. Leblanc SE, et al. 2005. Regulation of cholesterol/lipid biosynthetic genes by Egr2/Krox20 during peripheral nerve myelination. J. Neurochem. 93: 737–748 [DOI] [PubMed] [Google Scholar]
- 34. LeBlanc SE, Ward RM, Svaren J. 2007. Neuropathy-associated Egr2 mutants disrupt cooperative activation of myelin protein zero by Egr2 and Sox10. Mol. Cell. Biol. 27: 3521–3529 [DOI] [PMC free article] [PubMed] [Google Scholar]
- 35. Liang Y, Ridzon D, Wong L, Chen C. 2007. Characterization of microRNA expression profiles in normal human tissues. BMC Genomics 8: 166. [DOI] [PMC free article] [PubMed] [Google Scholar]
- 36. Livak KJ, Schmittgen TD. 2001. Analysis of relative gene expression data using real-time quantitative PCR and the 2(− Delta Delta C(T)) method. Methods 25: 402–408 [DOI] [PubMed] [Google Scholar]
- 37. Mager GM, et al. 2008. Active gene repression by the EGR2/NAB complex during peripheral nerve myelination. J. Biol. Chem. 283: 18187–18197 [DOI] [PMC free article] [PubMed] [Google Scholar]
- 38. Maunakea AK, et al. 2010. Conserved role of intragenic DNA methylation in regulating alternative promoters. Nature 466: 253–257 [DOI] [PMC free article] [PubMed] [Google Scholar]
- 39. Murchison EP, et al. 2010. The Tasmanian devil transcriptome reveals Schwann cell origins of a clonally transmissible cancer. Science 327: 84–87 [DOI] [PMC free article] [PubMed] [Google Scholar]
- 40. Nagarajan R, et al. 2001. EGR2 mutations in inherited neuropathies dominant-negatively inhibit myelin gene expression. Neuron 30: 355–368 [DOI] [PubMed] [Google Scholar]
- 41. Nave KA, Salzer JL. 2006. Axonal regulation of myelination by neuregulin 1. Curr. Opin. Neurobiol. 16: 492–500 [DOI] [PubMed] [Google Scholar]
- 42. O'Donnell KA, Wentzel EA, Zeller KI, Dang CV, Mendell JT. 2005. c-Myc-regulated microRNAs modulate E2F1 expression. Nature 435: 839–843 [DOI] [PubMed] [Google Scholar]
- 43. Olive V, Jiang I, He L. 2010. mir-17-92, a cluster of miRNAs in the midst of the cancer network. Int. J. Biochem. Cell Biol. 42: 1348–1354 [DOI] [PMC free article] [PubMed] [Google Scholar]
- 44. Parkinson DB, et al. 2004. Krox-20 inhibits Jun-NH2-terminal kinase/c-Jun to control Schwann cell proliferation and death. J. Cell Biol. 164: 385–394 [DOI] [PMC free article] [PubMed] [Google Scholar]
- 45. Peirano RI, Goerich DE, Riethmacher D, Wegner M. 2000. Protein zero gene expression is regulated by the glial transcription factor Sox10. Mol. Cell. Biol. 20: 3198–3209 [DOI] [PMC free article] [PubMed] [Google Scholar]
- 46. Peirano RI, Wegner M. 2000. The glial transcription factor Sox10 binds to DNA both as monomer and dimer with different functional consequences. Nucleic Acids Res. 28: 3047–3055 [DOI] [PMC free article] [PubMed] [Google Scholar]
- 47. Pereira JA, et al. 2010. Dicer in Schwann cells is required for myelination and axonal integrity. J. Neurosci. 30: 6763–6775 [DOI] [PMC free article] [PubMed] [Google Scholar]
- 48. Petrocca F, et al. 2008. E2F1-regulated microRNAs impair TGFbeta-dependent cell-cycle arrest and apoptosis in gastric cancer. Cancer Cell 13: 272–286 [DOI] [PubMed] [Google Scholar]
- 49. Plasterk RH. 2006. Micro RNAs in animal development. Cell 124: 877–881 [DOI] [PubMed] [Google Scholar]
- 50. Pospisil V, et al. 2011. Epigenetic silencing of the oncogenic miR-17-92 cluster during PU. 1-directed macrophage differentiation. EMBO J. 30: 4450–4464 [DOI] [PMC free article] [PubMed] [Google Scholar]
- 51. Reiprich S, Kriesch J, Schreiner S, Wegner M. 2010. Activation of Krox20 gene expression by Sox10 in myelinating Schwann cells. J. Neurochem. 112: 744–754 [DOI] [PubMed] [Google Scholar]
- 52. Rimsza LM, et al. 2008. Gene expression predicts overall survival in paraffin-embedded tissues of diffuse large B-cell lymphoma treated with R-CHOP. Blood 112: 3425–3433 [DOI] [PMC free article] [PubMed] [Google Scholar]
- 53. Roberts RA, et al. 2007. Quantitative nuclease protection assay in paraffin-embedded tissue replicates prognostic microarray gene expression in diffuse large-B-cell lymphoma. Lab Invest. 87: 979–997 [DOI] [PubMed] [Google Scholar]
- 54. Roh J, et al. 2006. Down-regulation of Sox10 with specific small interfering RNA promotes transdifferentiation of Schwannoma cells into myofibroblasts. Differentiation 74: 542–551 [DOI] [PubMed] [Google Scholar]
- 55. Schulte JH, et al. 2008. MYCN regulates oncogenic MicroRNAs in neuroblastoma. Int. J. Cancer 122: 699–704 [DOI] [PubMed] [Google Scholar]
- 56. Scott CE, et al. 2010. SOX9 induces and maintains neural stem cells. Nat. Neurosci. 13: 1181–1189 [DOI] [PubMed] [Google Scholar]
- 57. Sonnenberg-Riethmacher E, et al. 2001. Development and degeneration of dorsal root ganglia in the absence of the HMG-domain transcription factor Sox10. Mech. Dev. 109: 253–265 [DOI] [PubMed] [Google Scholar]
- 58. Stolt CC, et al. 2002. Terminal differentiation of myelin-forming oligodendrocytes depends on the transcription factor Sox10. Genes Dev. 16: 165–170 [DOI] [PMC free article] [PubMed] [Google Scholar]
- 59. Stolt CC, Wegner M. 2010. SoxE function in vertebrate nervous system development. Int. J. Biochem. Cell Biol. 42: 437–440 [DOI] [PubMed] [Google Scholar]
- 60. Tay Y, Zhang J, Thomson AM, Lim B, Rigoutsos I. 2008. MicroRNAs to Nanog, Oct4 and Sox2 coding regions modulate embryonic stem cell differentiation. Nature 455: 1124–1128 [DOI] [PubMed] [Google Scholar]
- 61. Topilko P, et al. 1994. Krox-20 controls myelination in the peripheral nervous system. Nature 371: 796–799 [DOI] [PubMed] [Google Scholar]
- 62. Uren AG, et al. 2008. Large-scale mutagenesis in p19(ARF)- and p53-deficient mice identifies cancer genes and their collaborative networks. Cell 133: 727–741 [DOI] [PMC free article] [PubMed] [Google Scholar]
- 63. Valouev A, et al. 2008. Genome-wide analysis of transcription factor binding sites based on ChIP-Seq data. Nat. Methods 5: 829–834 [DOI] [PMC free article] [PubMed] [Google Scholar]
- 64. Ventura A, et al. 2008. Targeted deletion reveals essential and overlapping functions of the miR-17 through 92 family of miRNA clusters. Cell 132: 875–886 [DOI] [PMC free article] [PubMed] [Google Scholar]
- 65. Verheijen MH, Chrast R, Burrola P, Lemke G. 2003. Local regulation of fat metabolism in peripheral nerves. Genes Dev. 17: 2450–2464 [DOI] [PMC free article] [PubMed] [Google Scholar]
- 66. Verrier JD, et al. 2009. Peripheral myelin protein 22 is regulated post-transcriptionally by miRNA-29a. Glia 57: 1265–1279 [DOI] [PMC free article] [PubMed] [Google Scholar]
- 67. Verrier JD, Semple-Rowland S, Madorsky I, Papin JE, Notterpek L. 2010. Reduction of Dicer impairs Schwann cell differentiation and myelination. J. Neurosci. Res. 88: 2558–2568 [DOI] [PMC free article] [PubMed] [Google Scholar]
- 68. Wegner M, Stolt CC. 2005. From stem cells to neurons and glia: a Soxist's view of neural development. Trends Neurosci. 28: 583–588 [DOI] [PubMed] [Google Scholar]
- 69. Wong P, et al. 2010. The miR-17-92 microRNA polycistron regulates MLL leukemia stem cell potential by modulating p21 expression. Cancer Res. 70: 3833–3842 [DOI] [PMC free article] [PubMed] [Google Scholar]
- 70. Woodhoo A, et al. 2009. Notch controls embryonic Schwann cell differentiation, postnatal myelination and adult plasticity. Nat. Neurosci. 12: 839–847 [DOI] [PMC free article] [PubMed] [Google Scholar]
- 71. Yun B, et al. 2010. MicroRNA-deficient Schwann cells display congenital hypomyelination. J. Neurosci. 30: 7722–7728 [DOI] [PMC free article] [PubMed] [Google Scholar]
- 72. Zhao X, et al. 2010. MicroRNA-mediated control of oligodendrocyte differentiation. Neuron 65: 612–626 [DOI] [PMC free article] [PubMed] [Google Scholar]
- 73. Zorick TS, Syroid DE, Arroyo E, Scherer SS, Lemke G. 1996. The transcription factors SCIP and Krox-20 mark distinct stages and cell fates in Schwann cell differentiation. Mol. Cell. Neurosci. 8(23): 129–145 [DOI] [PubMed] [Google Scholar]
- 74. Zorick TS, Syroid DE, Brown A, Gridley T, Lemke G. 1999. Krox-20 controls SCIP expression, cell cycle exit and susceptibility to apoptosis in developing myelinating Schwann cells. Development 126: 1397–1406 [DOI] [PubMed] [Google Scholar]
Associated Data
This section collects any data citations, data availability statements, or supplementary materials included in this article.