Abstract
In this study, we show that a chemical dye, malachite green (MG), which is commonly used in the fish industry as an antifungal, antiparasitic, and antibacterial agent, could effectively kill Candida albicans and non-C. albicans species. We have demonstrated that Candida cells are susceptible to MG at a very low concentration (MIC that reduces growth by 50% [MIC50], 100 ng ml−1) and that the effect of MG is independent of known antifungal targets, such as ergosterol metabolism and major drug efflux pump proteins. Transcriptional profiling in response to MG treatment of C. albicans cells revealed that of a total of 207 responsive genes, 167 genes involved in oxidative stress, virulence, carbohydrate metabolism, heat shock, amino acid metabolism, etc., were upregulated, while 37 genes involved in iron acquisition, filamentous growth, mitochondrial respiration, etc., were downregulated. We confirmed experimentally that Candida cells exposed to MG resort to a fermentative mode of metabolism, perhaps due to defective respiration. In addition, we showed that MG triggers depletion of intracellular iron pools and enhances reactive oxygen species (ROS) levels. These effects could be reversed by the addition of iron or antioxidants, respectively. We provided evidence that the antifungal effect of MG is exerted through the transcription regulators UPC2 (regulating ergosterol biosynthesis and azole resistance) and STP2 (regulating amino acid permease genes). Taken together, our transcriptome, genetic, and biochemical results allowed us to decipher the multiple mechanisms by which MG exerts its anti-Candida effects, leading to a metabolic shift toward fermentation, increased generation of ROS, labile iron deprivation, and cell necrosis.
INTRODUCTION
Candida albicans, which is part of the normal commensal flora of the body, is a common opportunistic microorganism known to cause cutaneous, mucosal, subcutaneous (candidiasis), and systemic (candidemia) infections (30). The widespread and prolonged usage of antifungals in recent years has led to the emergence of azole-resistant (AR) strains of Candida, which display multidrug resistance (MDR) (35). Various mechanisms that contribute to the development of azole resistance have been reported. They include overexpression or point mutations in ERG11, encoding the target enzyme of azoles, i.e., lanosterol 14α-demethylase (48), and overexpression of the drug efflux pump-encoding genes C. albicans CDR1 (CaCDR1), CaCDR2, and CaMDR1, which belong to the ATP-binding cassette (ABC) superfamily and the major facilitator superfamily (MFS) of transporters, respectively (36).
Considering the limited availability of safe antifungal drugs and the emergence of MDR, there is a need to explore unconventional and new mechanisms to combat multidrug resistance. Many naturally occurring compounds, such as curcumin, berberine, and tetrandrine, show promising antifungal activity (27, 41, 47, 52). However, these compounds are active at high concentrations, in contrast to established antifungal agents, such as azoles, allylamine, and polyenes. Some chemical dyes are also known to possess antifungal activities, though their activities against Candida have not been explored extensively. For example, gentian violet and methylene blue, which are also effective against fluconazole (FLC)-resistant C. albicans strains, are widely used as antifungal agents (43, 51). Our present study focuses on the chemical dye malachite green (MG), which is reported to have antifungal, antiparasitic, and antibacterial activities (5). It has been shown that MG at 1 ppm is able to reduce the growth of different fungal species, such as Aspergillus parasiticus, Aspergillus flavus, Penicillium verrucosum, and Fusarium oxysporum (5). MG also is used in the fish industry to treat fungal and ectoparasitic diseases in eggs (22, 44). We show here that MG has an advantage over conventional antifungal drugs in that it effectively inhibits the growth of C. albicans and non-C. albicans species at lower concentrations than those of triazoles, imidazoles, and allylamine. Transcriptional profiling of C. albicans and validation by quantitative PCR (Q-PCR), along with biochemical analyses, showed that MG employs multiple mechanisms to kill Candida cells and thus could be used against candidiasis.
MATERIALS AND METHODS
Materials.
All the medium components were obtained from HiMedia (Mumbai, India), while glycerol was obtained from Qualigens (Mumbai, India). Malachite green (MG), rhodamine 6G (R6G), 2′,7′-dichlorofluorescein diacetate (DCFDA), bathophenanthroline disulfonate (BPS), 2-deoxy-d-glucose (DOG), dinitrophenol (DNP), amphotericin B (AMB), nystatin, (NYS), and itraconazole (ITC) were purchased from Sigma Chemical Co. (St. Louis, MO). Calcein-acetoxymethyl (CAM) was bought from Fluka Chemicals, Mumbai, India. Ferric chloride (FeCl3) was obtained from Qualigens (Mumbai, India) and cupric sulfate (CuSO4) from Glaxo. Ascorbic acid (AA) was purchased from SRL (Mumbai, India). Ranbaxy, India generously provided FLC. Cy3- and Cy5-labeled UTP was obtained from GE Healthcare, United Kingdom, and the SuperScript II reverse transcriptase enzyme, the oligo(dT)18 primer, and the random primer were obtained from Invitrogen. dATP, dGTP, dTTP, and dCTP were bought from Sigma.
Yeast strains.
All the yeast strains used in this study were grown in yeast extract-peptone-dextrose (YPD) agar and were incubated at 30°C. Fifteen percent glycerol stocks of these strains were maintained in storage at −80°C, and the strains were freshly revived on YPD before use. The bacterial strain Escherichia coli DH5α was used as a host for the construction and propagation of the plasmid for cloning. See Table S1 in the supplemental material for the complete list of strains used in this study.
Growth conditions and time course analyses of MG responses.
Cells were grown at 30°C in YPD medium with 1% (wt/vol) Bacto yeast extract, 2% (wt/vol) Bacto peptone, and 2% (vol/wt) glucose) to an optical density at 600 nm (OD600) of 0.5 and were then split into two cultures. Malachite green (50, 100, or 200 ng ml−1 was added to one of the cultures, and the second culture was subjected to an equivalent mock treatment (water). After 10, 20, 40, or 80 min, the cells were flash-frozen in cold ethanol for RNA extraction.
RNA extractions.
Fifteen milliliters of cell cultures was flash-frozen in 30 ml of absolute ethanol at −80°C. The cells were harvested by centrifugation (4 min at 3,000 rpm). The cell pellets were stored at −80°C. Total RNAs were extracted as described previously (15).
Transcriptome analyses.
The C. albicans microarrays were homemade from an oligonucleotide (60-mer) collection designed by Eurogentec to span the complete open reading frame (ORF) set from assembly 21 (www.candidagenome.org) of the C. albicans genome. Each probe was deposited in duplicate on Corning UltraGAPS slides. Ten micrograms of total RNAs was used for cDNA synthesis and labeling. The microarray experiments were conducted as described previously (15). Raw data were normalized using the global lowess method followed by the print-tip median method, with background removal, as implemented in Goulphar (26). Experiments were reproduced four times using dye swap normalization. The statistical significance of the expression differences measured was addressed by using the TIGR MultiExperiment Viewer (TMeV) version of SAM (significance analysis of microarrays) with a false discovery rate (FDR) of 5% and the exact number of permutations (38, 39, 46). Only genes with a minimum of one dye-swapped measurement were considered for the SAM analyses. The remaining missing values were imputed by the k-nearest neighbor (KNN) input method directly in the TMeV application (38, 39, 46). Hierarchical clustering was performed using TMeV, with Euclidian distances and average linkages (38, 39).
Data mining.
Functional analyses of the genomewide data were conducted using the Candida Genome Database (CGD) Gene Ontology (GO) term finder (4) with default parameters.
Real-time PCR and quantitative reverse transcriptase PCR (RT-PCR).
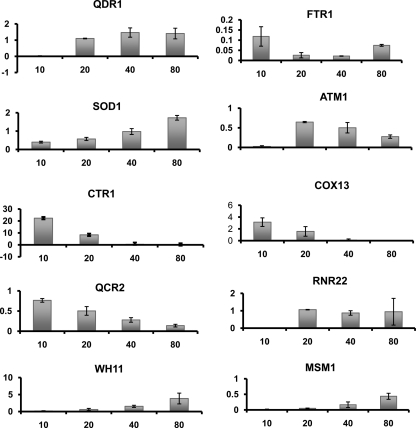
For validation of the microarray results presented in Fig. 3, 500 ng of total RNAs was used for Q-PCR, which was performed using a LightCycler LC480 machine (Roche) and the analysis protocol described in reference 12. The oligonucleotides used are described in Table S2 in the supplemental material. The results were normalized according to the threshold cycle (CT) value obtained for the ACT1 gene. Therefore, the Q-PCR data presented in Fig. 3 represent arbitrary mRNA amounts relative to the amount of ACT1.
Fig 3.
Validation by Q-PCR of genes that were differentially expressed in the presence of MG. Details are given in Materials and Methods. The y axis shows amounts of mRNA in arbitrary units relative to ACT1 expression. Time in minutes is shown along the x axis.
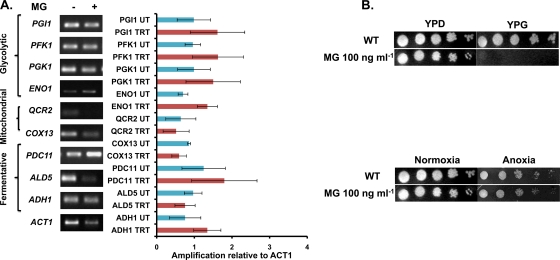
The data presented in Fig. 5 were obtained by semiquantitative endpoint RT-PCR using the RevertAid H Minus kit (MBI Fermentas). Briefly, 1 μg isolated RNA was primed with oligo(dT)18 for cDNA synthesis at 42°C for 60 min. The reverse transcription reaction was terminated by heating at 70°C for 5 min. The synthesized cDNA product (2 μl) was used directly for PCR amplification (50 μl) using gene-specific forward and reverse primers. The amplified products were subjected to gel electrophoresis and were quantitated by using Quantity One software with the Bio-Rad gel documentation system. The densities of bands (for genes of interest) were measured and normalized to that of the endogenous gene.
Fig 5.
Glycolytic genes and fermentation genes are upregulated, while mitochondrial genes are downregulated, in the presence of MG. (A) RT-PCR results showing the amplification of genes involved in glycolysis, mitochondrial respiration, and fermentation relative to the amplification of ACT1, used as a control. TRT, treated with MG; UT, untreated. (B) (Top) Wild-type cells grown at a sublethal concentration of MG (100 ng ml−1) with glucose or glycerol as the carbon source. (Bottom) Wild-type cells grown at a sublethal concentration of MG (100 ng ml−1) on YPD under normoxia or anoxia, induced by using an anaerobiosis-creating system from Oxoid, Germany.
Drug susceptibility assays and time-kill assay.
Susceptibility to drugs was tested by broth microdilution assays according to Clinical and Laboratory Standards Institute (CLSI) guidelines and by serial dilution assays essentially as described previously (8, 32). For time-kill assays, 104 cells ml−1 of the C. albicans wild-type (WT) strain were inoculated into RPMI 1640 medium. The concentrations of MG used are multiples of MIC50 values (no MG, 100 ng ml−1, 200 ng ml−1, and 400 ng ml−1). The cultures were incubated at 30°C with agitation at 200 rpm. At various predetermined time points (0, 4, 8, 12, and 16 h), a 100-μl aliquot was removed, serially diluted (10-fold) in 0.9% saline, and spread on Sabouraud dextrose agar plates. Colony counts were determined after incubation at 30°C for 24 h. The experiment was performed in duplicate (41). The MG stock was prepared as 1 mg ml−1 by diluting a 10-mg ml−1 concentration in ethanol. BPS (100 mM), FeCl3 (100 mM), and AA (1 M) stocks were prepared in autoclaved MilliQ water. For serial dilution assays under anoxia, an anaerobiosis-creating system was used, and the cells were grown in an air-tight chamber according to the manufacturer's instructions (Oxoid, Germany),
LIP determination.
The labile iron pool (LIP) is measured by using calcein, a fluorescent probe that binds to both Fe2+ and Fe3+ (14). The binding of Fe quenches the fluorescence of calcein, which can be measured using a fluorescence spectrophotometer. Once CAM ester is inside the cell, it is converted to a fluorescent acid form by cellular esterases (6). YPD was inoculated to an OD600 of 0.1 with a primary culture of the wild-type C. albicans strain CAI4, and the culture was allowed to grow until the OD600 reached 0.8. One hundred nanograms of MG per milliliter was added to the cells, and the same amount of dimethyl sulfoxide (DMSO) was added to the control; then the cells were allowed to grow further for 80 min. Cells were harvested, and spheroplasts were prepared as described previously (23). Spheroplasts were washed with SOE (1 M sorbitol, 0.1 M EDTA), and a 2% suspension was made in SOE. CAM ester was added to a final concentration of 2 μM in the suspension described above, which was then incubated for 2 h at 30°C. Spheroplasts were then washed with phosphate-buffered saline (PBS), and fluorescence was measured (excitation and emission at 485 nm and 530 nm, respectively) with a Cary Eclipse fluorescence spectrophotometer (Varian). Fluorescence was also observed under a Carl Zeiss Axiovert 40 CFL fluorescence microscope.
Measurement of ROS generation.
DCFDA, an oxidant-sensitive fluorescent probe, was employed to measure the generation of endogenous reactive oxygen species (ROS) (29). YPD was inoculated to an OD600 of 0.1 with a primary culture of wild-type C. albicans strain CAI4, and the culture was allowed to grow until the OD600 reached 0.8. MG (final concentration, 100 ng ml−1) was added to the cells, and the same volume of DMSO was added to the control; then the cells were allowed to grow further for 80 min. For the reversal of ROS generation by an antioxidant, cells were pretreated with 5 mM AA for 60 to 90 min and were then treated with MG. Equal numbers of cells were pelleted down (1 OD600 in 1 ml), resuspended in 1 ml YPD broth, and incubated at 30°C for 1 h. Cells were washed with YPD broth and were resuspended in 250 μl to which 10 μM (final concentration) DCFDA was added. The cells were then incubated at 30°C for 30 min. Fluorescence was measured (excitation and emission at 488 nm and 540 nm, respectively) and quantified as described above. Cell necrosis was determined by the externalization of phosphatidylserine (PS), an apoptotic marker, by using a fluorescein isothiocyanate (FITC)-labeled annexin V kit (FITC Annexin V apoptosis detection kit I; BD Biosciences). After MG treatment (at the MIC50, 100 ng ml−1) and labeling with dyes, cells were tracked for FITC and propidium iodide (PI) signals using a FACSCalibur flow cytometer (Becton Dickinson Immunocytometry Systems, San Jose, CA). We used excitation at 488 nm, a 515-nm band-pass filter for FITC detection, and a >560-nm filter for PI detection. A total of 10,000 events were counted at the flow rate. Data were analyzed using CellQuest software. It is known that FITC labeling of cells indicates the onset of apoptosis, while PI labeling indicates predominantly the presence of necrotic cells (13).
Cloning of CaQDR1 into strain AD1-8u−.
CaQDR1 was cloned into the PDR5 locus of Saccharomyces cerevisiae strain AD1-8u−, in which seven major drug transporters are deleted, reducing the background activity (12). The pABC3 vector was used for this purpose, and the strategy undertaken was the same as that described previously (24). Briefly, CaQDR1 was PCR amplified with primers containing PacI and NotI enzyme sites and was subsequently ligated with the vector, which had also been digested with these enzymes. A cassette consisting of the PDR5 promoter, a multiple cloning site enabling ligation with the insert of choice (CaQDR1), the PGK1 terminator, the URA3 marker, and 277 bp of the 3′ end of the PDR5 open reading frame was removed from the plasmid (24). This cassette was used to transform AD1-8u− by integration using the lithium acetate method (42). The integrants were selected on SD/-ura (synthetic defined medium without uracil) plates and were confirmed by Southern hybridization followed by sequencing.
Strategy for knocking out QDR1, QDR2, and QDR3.
We deleted QDR1, QDR2, and QDR3 from the wild-type strain SC5314 by using the SAT1 flipper cassette (from pSFS2) as described previously by Reuss et al. (37).
Construction of transcription factor (TF) deletion strains.
There are 273 distinct putative genes encoding proteins with a DNA binding domain (DBD) signature, as described in Table S3 in the supplemental material. Four different methods were employed to obtain 240 homozygous mutants. Most of them (182/240; ∼75%) were obtained by UAU transposition (11); the rest were obtained by the URA-blaster method (16) or by PCR product recombination either from plasmid pFA (20) or from a UAU disruption cassette (7). Two different parental strains were used to create these mutants: CAF4-2 (16) for URA-blaster-based mutants and BWP17 (49) for the rest. Two hundred twenty-two mutants of this collection have already been deposited in a public repository, the Fungal Genetics Stock Center (http://www.fgsc.net/) (28).
Microarray data accession number.
The microarrays used in this work and the complete transcriptome data obtained are available at the Array Express database (accession number E-TABM-893).
RESULTS
Antifungal effects of MG.
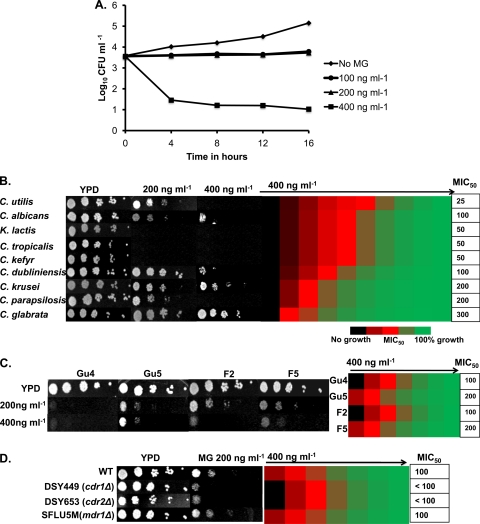
We tested the fungicidal activity of MG on C. albicans cells (CAI4) by calculating log10 CFU ml−1, using a time-kill assay as described in Materials and Methods (41), in the presence of increasing concentrations of the dye (no MG, 100 ng ml−1, 200 ng ml−1, and 400 ng ml−1). There was very little growth of cells in the presence of 400 ng ml−1 of the dye (Fig. 1A), suggesting that MG is fungicidal only at concentrations above 200 ng ml−1. In addition, drug susceptibility tests were conducted both on solid cultures (serial dilution assay) and by broth microdilution methods (8). It was observed that MG inhibited the growth of C. albicans on a solid medium as well as in a liquid medium, with a MIC50 (MIC that reduces growth by 50%) of 100 ng ml−1 (Fig. 1B). We also analyzed the sensitivity of various non-C. albicans species, spanning the phylum Hemiascomycetes. As with C. albicans, MG was effective against all the non-C. albicans species tested (Fig. 1B). However, Candida tropicalis, Kluyveromyces lactis, and Candida kefyr strains were particularly susceptible to MG, while C. glabrata appeared to be the least sensitive to the dye.
Fig 1.
Malachite green is a potent antifungal. (A) Time-kill plot of C. albicans with increasing concentrations of MG to show fungicidal activity. (B) (Left) Serial dilution assays showing the antifungal activity of MG at concentrations of 200 ng ml−1 and 400 ng ml−1 against C. albicans and non-C. albicans species. (Right) MIC50 values of MG for C. albicans and non-C. albicans species, obtained by use of a broth microdilution assay starting with 400 ng ml−1 of MG in the first well, as described in Materials and Methods. (C) (Left) Serial dilution assays for Gu4/Gu5 (sensitive/resistant clinical isolates overexpressing CDR1 and CDR2) and F2/F5 (sensitive/resistant clinical isolates overexpressing CaMDR1) at 200 ng ml−1 and 400 ng ml−1 of MG. (Right) MIC50 values for these isolates, obtained by use of a broth microdilution assay starting with 400 ng ml−1 of MG in the first well. (D) (Left) Susceptibilities of CDR1 CDR2 and CaMDR1 deletion mutants to MG at 200 ng ml−1. (Right) MIC50 values of these deletion mutants, obtained by use of a broth microdilution assay starting with 400 ng ml−1 of MG in the first well.
The antifungal effect of MG is independent of major efflux pump activities.
We assessed whether the levels of ABC and MFS transporters, which are among the major contributors to antifungal resistance, could influence the susceptibility of Candida cells to MG. For this purpose, we used two matched pairs of isogenic clinical azole-sensitive (AS) and azole-resistant (AR) isolates overexpressing the transporter-encoding gene CDR1 (Gu4/Gu5) or MDR1 (F2/F5). Due to the overexpression of CDR1 and CDR2, the AR isolate Gu5 shows lower susceptibility to FLC than Gu4 (18). The MIC50 values of MG for these strains were checked, and it was found that the MIC50 for Gu5 was 200 ng ml−1, only 2-fold higher than that for Gu4 (100 ng ml−1). The serial dilution assays also confirmed the MIC results (Fig. 1C). The 2-fold difference in the MIC50 and the marginal resistance of Gu5 to MG observed in spot assays reflect some genetic differences between Gu4 and Gu5. Similarly, we used another isogenic pair overexpressing MDR1 (17). The AR clinical isolate F5 is derived from the AS isolate F2 and is reported to have higher MDR1 transcript levels than strain F2. We observed that F5 isolates were as susceptible to MG as F2 cells (Fig. 1C).
The CDR1- and MDR1-null mutants confirmed the AS/AR results. For example, C. albicans strains in which CDR1 or CDR2 was deleted (cdr1Δ and cdr2Δ mutants, respectively) and which were highly susceptible to FLC (45) showed only minor sensitivity to MG, almost similar to that of their WT parent (Fig. 1D). Notably, the MIC50 of MG for SFLU5M, a strain in which the MDR1 gene had been deleted (31), was also 100 ng ml−1, again similar to that for its WT parent. These results show that MDR1 plays no role in the susceptibility of C. albicans to MG, while an involvement of CDR1 and CDR2 in resistance to MG cannot be ruled out.
Genomewide response of the C. albicans transcriptome to MG.
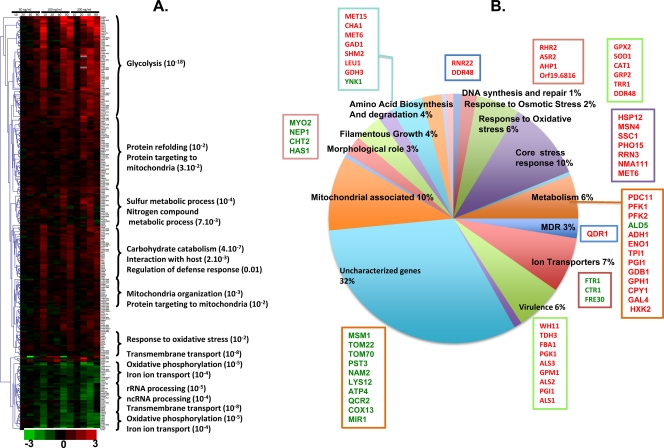
To obtain insight into the mechanism of the anti-Candida activity of MG, we used DNA microarrays of the C. albicans genome. To increase the accuracy of our study, we analyzed the transcriptome responses of cells exposed to different doses of MG, including the MIC50 (100 ng ml−1), the MIC80 (200 ng ml−1), and a dose below the MIC50 (50 ng ml−1). Considering that the stress response in yeast is generally fast, the cells were exposed to MG for 10, 20, 40, or 80 min (19) (Fig. 2A). The corresponding RNAs from different time points and doses were reverse transcribed into Cy3- or Cy5-labeled cDNAs, which were competitively hybridized against labeled cDNAs obtained from mock-treated cells to microarrays containing oligonucleotide probes for most of the ORF of C. albicans. All the experiments were performed in quadruplicate using the dye swap method.
Fig 2.
Transcriptional profiling of C. albicans in the presence of MG. (A) Transcriptional profiling at the MIC80 (200 ng ml−1), the MIC50 (100 ng ml−1), and a concentration lower than the MIC50 (50 ng ml−1) and at 10, 20, 40, and 80 min. The Gene Ontology category enriched in each group was searched for using the GO term finder, available at the CGD database (www.candidagenome.org). The corrected P values of the statistical enrichment test performed by the GO term finder are given in parentheses after the functions on the right. ncRNA, noncoding RNA. (B) Categories of genes that were differentially expressed upon treatment with MG at 100 ng ml−1 for 40 min. Gene names in red indicate upregulation in response to MG treatment, while those in green indicate downregulation.
Differential analyses (see Materials and Methods) identified 167 genes that were significantly induced and 37 that were repressed at at least one dose and one time point (see Table S4 in the supplemental material). These genes were categorized according to their functional annotations (Fig. 2B). Additionally, clustering analyses identified groups of genes that were analyzed for GO term enrichment (Fig. 2A). These analyses showed that genes involved in carbon metabolism and glycolysis (e.g., PFK1, PFK2, ENO1, TPI1), virulence (e.g., WH11, ALS1), and redox homeostasis (e.g., SOD1, GPX2, CAT1) were highly induced (≥2-fold). The groups with moderate induction (≤2-fold) comprised mostly genes involved in sulfur metabolism (e.g., orf19.2583.1), mitochondrial organization and mitochondrial protein import (e.g., TOM22, TOM70, ILV5, YHM1), and protein folding (e.g., HSP70, HSP104, ABP1). Among the genes repressed ≥2-fold were those involved in iron transport (e.g., FTR1, FET3, CTR1), protein import (ATM1, MSM1), and oxidative phosphorylation (e.g., QCR2, COX13).
In order to validate the microarray results experimentally, 10 genes were chosen from different differentially regulated GO categories, including virulence (WH11), redox homeostasis (SOD1), DNA repair (RNR22), MFS transporters (QDR1 [putative]), iron transporters (FTR1, CTR1), and mitochondrial organization and protein import (QCR2, ATM1, MSM1, COX13) (Fig. 3). The expression profiles of these genes in response to 200 ng ml−1 of MG were measured by using the same four RNA samples that were used in transcriptome analyses. For all these genes, we found a very good correlation between the microarray and Q-PCR results, although the range of the ratios measured by Q-PCR was always larger than the microarray measurements (Fig. 3).
QDR1 is not involved in MG resistance.
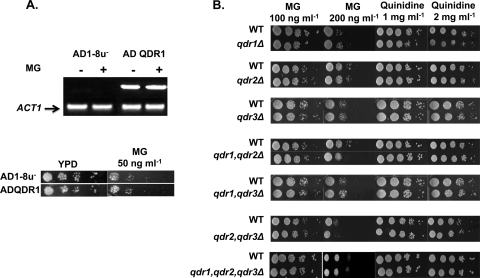
We have identified QDR1 by homology to S. cerevisiae QDR1, which encodes an MFS transporter. QDR1 was among the genes highly induced by MG treatment (∼3-fold), a finding confirmed by Q-PCR (Fig. 3). To further explore the role of this transporter in imparting sensitivity to MG, we made a C. albicans strain lacking QDR1 (PVY95) and also stably overexpressed QDR1 from a genomic PDR5 locus in the S. cerevisiae mutant AD1-8u−, in which seven ABC transporters are deleted (12, 33). We confirmed the susceptibilities of the QDR1-null strain and the QDR1-overexpressing strain (ADQDR1) to MG by RT-PCR (Fig. 4A, top) and by serial dilution assays on solid and liquid media (Fig. 4A, bottom). Our results show that neither homozygous deletion (in C. albicans) nor overexpression of QDR1 (in S. cerevisiae) could influence susceptibility to MG, which remained similar to that of the respective WT parents (Fig. 4A and B). The Candida genome reveals the presence of three QDR genes (QDR1, QDR2, and QDR3). To rule out any involvement of other QDR genes that might compensate for the deletion of QDR1 in sensitivity to MG, we tested strains lacking QDR2 (qdr2Δ/qdr2Δ) and QDR3 (qdr3Δ/qdr3Δ). We observed that the null mutants for individual genes and their combinations could not affect sensitivity to MG or susceptibility to quinidine, as evidenced by drug susceptibility assays on both solid (Fig. 4B) and liquid (data not shown) media. Quinidine is a well-known substrate of Qdr1p in S. cerevisiae (ScQdr1p) (34). Apparently, CaQdr1p and its paralogues (CaQdr2p and CaQdr3p) do not act in quinidine export (Fig. 4B). We screened several compounds, including known substrates of QDRs, but did not find any phenotype. Thus, the physiological role of QDR1 in C. albicans is not apparent; also, no transcriptional regulator of QDR genes has been identified so far.
Fig 4.
QDR1 is not involved in imparting resistance to MG. (A) (Top) Expression of QDR1 in strains AD1-8u− and ADQDR1, either left untreated or treated with MG, as determined by RT-PCR. Amplification is shown relative to that of the ACT1 control. (Bottom) Serial dilution assays in the presence of MG at 50 ng ml−1 for the wild-type strain and ADQDR1 (constitutively overexpressing QDR1). (B) Serial dilution assays for qdr1Δ, qdr2Δ, qdr3Δ, qdr1 qdr2Δ, qdr1 qdr3Δ, qdr2 qdr3Δ, and qdr1 qdr2 qdr3Δ strains in the presence of MG at 100 ng ml−1 or 200 ng ml−1 or in the presence of quinidine at 1 mg ml−1 or 2 mg ml−1.
MG treatment leads to a metabolic shift.
Transcriptional profiling (Fig. 2) and real-time Q-PCR confirmed that MG treatment of Candida cells significantly downregulated QCR2 (log2 ratio, −1.316) and COX13 (log2 ratio, −1.272), suggesting a negative correlation between MG activity and mitochondrial respiration (Fig. 3). Notably, genes involved in alternative energy generation pathways, such as the glycolytic and fermentation pathways, were upregulated (Fig. 2A and B and 5A; see also Table S4 in the supplemental material). This is the case for PGI1, PFK1, PFK2, ENO1, PDC11, and ADH1, which were upregulated in MG-treated cells. This shifting of the metabolic preference following MG exposure was further investigated by the growth of cells in different carbon sources. For this purpose, cells with or without MG were grown in a medium with glycerol (yeast extract-peptone-glycerol [YPG]; nonfermentative conditions) or glucose (YPD; fermentative conditions). Notably, cells grown under conditions in which respiration is mandatory (YPG) were highly sensitive to MG, which is nonlethal to cells grown in glucose (YPD) (Fig. 5B, top). This strong functional link between MG and fermentation was further evidenced by another experiment in which Candida cells were grown under anoxia (by use of an anaerobiosis-creating system from Oxoid, Germany). In contrast to cells grown in a nonfermenting carbon source, anoxic cells treated with MG (at the MIC50, 100 ng ml−1) could grow well, though more slowly than normoxic cells (Fig. 5B, bottom).
MG interferes with redox homeostasis.
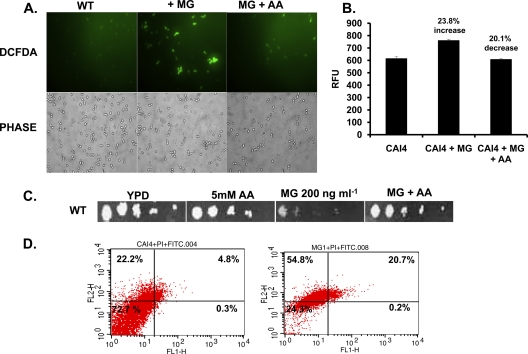
Since genes involved in redox homeostasis (SOD1, GPX2, CAT1, TRR1) were among those most highly induced (>3-fold) by MG treatment (Fig. 3; see also Table S4 in the supplemental material), levels of ROS were measured. For this purpose, we employed DCFDA, an oxidant-sensitive probe, to quantitate ROS generation (29). Candida cells were first grown in the presence of MG (at the MIC50, 100 ng ml−1), and then DCFDA was incubated with the cells for 30 min to allow the dye to equilibrate with the cells. Fluorescence was then visualized under a fluorescence microscope (Carl Zeiss Axiovert 40 CFL). Concomitantly with ROS accumulation, MG-treated cells distinctly displayed enhanced fluorescence compared with that of untreated cells. Both the ROS accumulation and the increased fluorescence of MG-treated cells could be reverted to the untreated wild-type levels if an antioxidant, such as AA, was included in the growth medium at a final concentration of 5 mM (Fig. 6A). The level of fluorescence in MG-treated cells was 23.8% higher than that in untreated cells, and this increase could be reversed by an antioxidant (Fig. 6B). The correlation between ROS generation and MG sensitivity was further demonstrated when cells were grown in the presence of the antioxidant AA (5 mM) and were tested for MG sensitivity. In the presence of AA, the cells not only restored ROS levels but also tolerated otherwise lethal concentrations of MG (MIC80 [200 ng ml−1]) (Fig. 6C).
Fig 6.
ROS levels following MG treatment. (A) Measurement of ROS generation using DCFDA in a wild-type C. albicans strain either left untreated or treated with MG (100 ng ml−1) with or without pretreatment with AA. (B) Quantitation of fluorescence in a wild-type C. albicans strain that was either left untreated, treated with MG, or treated first with AA and then with MG. RFU, relative fluorescence units. (C) Serial dilution assay showing that sensitivity to MG (at 200 ng ml−1) is reversed in the presence of AA. (D) Measurement of apoptosis or necrosis in wild-type cells by tracking for FITC or PI labels in the absence (left) or presence (right) of MG (100 ng ml−1).
It has been reported that ROS accumulation is associated with the necrosis of yeast cells (13). We explored the question of whether ROS accumulation following MG treatment would lead to apoptosis or necrosis of Candida cells. To determine this, we examined the externalization of phosphatidylserine (PS), an apoptotic marker, by using an FITC-labeled annexin V kit (FITC Annexin V apoptosis detection kit I; BD Biosciences). Cells were tracked for FITC and propidium iodide (PI) labeling by flow cytometry after MG treatment (at the MIC50, 100 ng ml−1). It is known that FITC labeling of cells indicates the onset of apoptosis, while PI labeling predominantly shows the presence of necrotic cells (13). The flow cytometry analysis revealed that a significant population of the cells had undergone necrosis following MG treatment (Fig. 6D).
MG affects iron homeostasis.
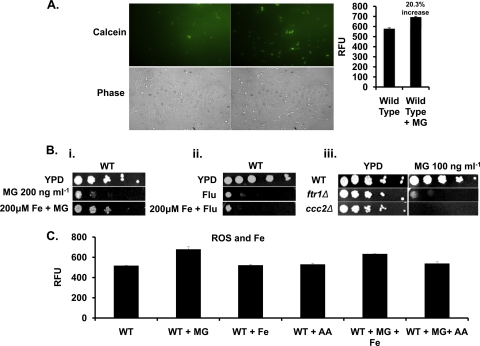
In the next set of experiments, we investigated whether the downregulation of iron transporter-encoding genes, e.g., FTR1, FET3, and CTR1, following MG treatment resulted in a decrease in the LIP of the cells (Fig. 2B and 3). To quantify the LIP, CAM ester was used (see Materials and Methods). Once inside the cell, CAM esters are converted, by the action of cellular esterases, into a fluorescent acid form of calcein, which readily binds with free iron (Fe) (14). The binding of the fluorescent acid form of calcein with iron results in the quenching of its fluorescence. Therefore, an increase in fluorescence corresponds to low levels of intracellular iron (6). Candida cells treated with MG (at the MIC50, 100 ng ml−1) showed a 20.3% increase in CAM fluorescence over that in untreated cells, which reflected a decrease in the intracellular LIP (Fig. 7A).
Fig 7.
Treatment with MG depletes LIP in C. albicans cells. (A) (Left) Measurement of LIP by using calcein in wild-type cells either left untreated or treated with MG (100 ng ml−1). (Right) Quantitation of fluorescence in wild-type cells either left untreated or treated with MG (100 ng ml−1). (B) (i) Serial dilution assays showing partial growth reversal upon supplementation with Fe (200 μM) in the presence of MG (200 ng ml−1). (ii) Serial dilution assays showing no growth reversal upon supplementation with Fe (200 μM) in the presence of FLC (2 μg ml−1). (iii) Serial dilution assay for the ftr1Δ and ccc2Δ iron transporter mutant strains in the presence of MG (100 ng ml−1). (C) Quantitation of fluorescence in the wild-type strain alone or in the presence of MG (100 ng ml−1), Fe (200 μM), AA (5 mM), MG plus Fe, or MG plus AA.
To confirm the involvement of iron in MG toxicity, we also analyzed the susceptibility of WT C. albicans cells to a lethal concentration of MG (MIC80 [200 ng ml−1]) in the presence of ferric chloride. Interestingly, the presence of ferric chloride (200 mM) in the medium partially protected the cells from MG toxicity, as evidenced by the partial restoration of growth (Fig. 7B). Notably, in contrast to the reversal of MG toxicity, the lethality of antifungals, such as FLC, could not be reversed by iron supplementation (Fig. 7B). Supplementation with other metal salts, such as MnCl2 or MgCl2, failed to influence the susceptibility of cells to MG (see Fig. S1 in the supplemental material). The role of iron in sensitivity to MG became more apparent when we tested the effect of MG on strains with null mutations of either FTR1, which encodes a high-affinity iron permease, or CCC2, which encodes a copper permease required for iron assimilation. Both the null mutants were highly susceptible to MG at a concentration that was nonlethal for the wild-type strain (MIC50 [100 ng ml−1]) (Fig. 7B).
We investigated whether the accumulation of ROS in MG-treated cells, which was also accompanied by depletion of the LIP, could be reversed by iron supplementation. For this purpose, we measured ROS levels in MG-treated cells supplemented with ferric chloride. In contrast to the reversal of increased ROS levels by an antioxidant (Fig. 6B), iron supplementation was not able to prevent ROS accumulation following MG treatment (Fig. 7C).
MG targets global regulator UPC2 (uptake control 2) and STP2 (species-specific tRNA processing 2).
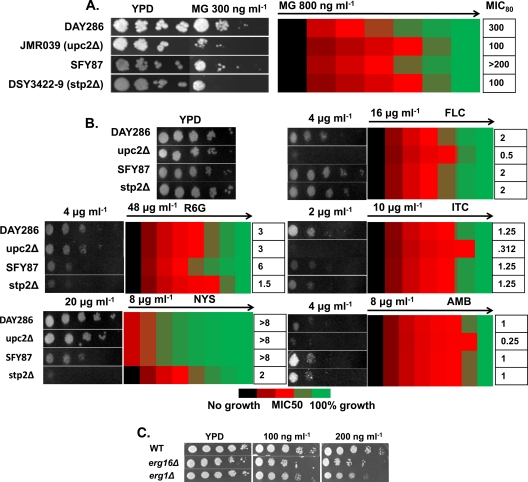
To explore the regulatory aspects of the MG-dependent drug susceptibility of Candida cells, we screened transcription factors (TFs) in a deletion library consisting of 240 strains obtained either by UAU transposition (182/240; ∼75%) (11), by the URA-blaster method (16), or by PCR product recombination either from plasmid pFA (20) or from a UAU disruption cassette (11) (see Materials and Methods). These TF mutant strains were grown in the presence of MG at 300 ng ml−1 (MIC80) and were screened for susceptibility. The screening was performed in three independent batches so as to identify only reproducibly sensitive strains (Fig. 8A; see also Fig. S2 in the supplemental material). Our screening results revealed that the two mutant strains JMR039 and DSY3422-9 (with null mutations of UPC2, which regulates ergosterol biosynthesis, and of STP2, involved in the regulation of amino acid transporter genes) were highly susceptible to MG treatment, with MIC80s less than half those of their respective parental strains (Fig. 8A). Notably, the upc2Δ and stp2Δ null mutants were also sensitive to some selected drugs. For example, the upc2Δ knockout strain was susceptible to FLC, ITC, and AMB, while the stp2Δ null mutant was sensitive to R6G and NYS (Fig. 8B). When C. albicans erg mutants (erg2Δ and erg16Δ strains) were examined for MG susceptibility, it was observed that the imbalance in ergosterol levels did not affect susceptibility (Fig. 8C).
Fig 8.
Screening of a library of transcription factor mutants. (A) (Left) Serial dilution assays showing that the upc2Δ and stp2Δ strains are more sensitive to MG (300 ng ml−1) than their respective wild-type strains. (Right) Measurement of MIC50 values of MG for DAY286, the upc2Δ mutant, SFY87, and the stp2Δ mutant by using a broth microdilution assay starting with 800 ng ml−1 of MG in the first well. (B) Serial dilution assays for DAY286, the upc2Δ strain, SFY87, and the stp2Δ strain in the presence of FLC (2 μg ml−1), R6G (12 μg ml−1), ITC (1.5 μg ml−1), NYS (4 μg ml−1), or AMB (2 μg ml−1), and measurement of the MIC50 using a broth microdilution assay. The starting concentration of each drug is indicated above the respective heat map. (C) Serial dilution assays showing the effects of MG at 100 ng ml−1 and 200 ng ml−1 on the erg16Δ and erg1Δ ERG mutants.
DISCUSSION
In this study, we have explored the antifungal potential of MG against C. albicans. MG is known to display antifungal activity against selected fungi and has been used extensively in fisheries (44). A few studies on the toxicity of MG have been carried out with mice. For example, leucomalachite green, a reduced form of MG, has been shown to cause increases in liver-to-body weight ratios and urinary bladder apoptosis, which were not observed with MG at a concentration of 1,200 ppm (1,200 μg ml−1) (9). In another study with male and female Wistar rats, acute effects were seen that reduced motor activity and led to hyperemia and atonia of the intestinal walls (50% lethal dose [LD50], 275 mg kg of body weight−1) (7). All these studies suggest that MG causes limited toxicity and that, although it has not been proven to establish liver cancer in mice, it should be tested for long-term carcinogenic effects (10). Notably, the concentration of MG used in the present study is more than a thousand times less (200 ng ml−1 [0.2 ppm]) than that used in the toxicity studies described above.
We demonstrate that MG at extremely low concentrations (MIC80 [200 ng ml−1]) is fungicidal to both C. albicans and non-C. albicans species. Notably, unlike that of commonly used azoles, which target ergosterol metabolism, the fungicidal activity of MG affects neither the ERG pathway nor sterol homeostasis (see Fig. S3 in the supplemental material). Additionally, genes encoding multidrug transporters (CDR1, CDR2, CaMDR1), which are among the major attributes of azole resistance, do not contribute to MG sensitivity. Interestingly, our transcriptome data revealed that one of the MFS transporters (QDR1) is upregulated as much as 3-fold by MG treatment. However, overexpression of QDR1 in a heterologous background did not result in resistance to MG. The fact that the level of QDR1 does not affect sensitivity to MG became further apparent from the results obtained with the QDR1-null mutant, whose sensitivity to MG was not enhanced over that of the WT. As judged by the analysis of QDR2- and QDR3-null mutants, none of the other homologues of QDR influenced the susceptibility of C. albicans to MG.
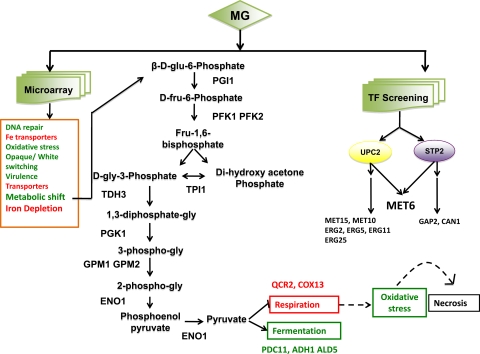
Transcriptional profiling of MG-treated C. albicans cells, and its validation by RT-PCR, revealed categories of genes that were differentially regulated. We observed overexpression of several genes involved in the glycolytic pathway and fermentation, including PGI1, PFK1, PDC11, GPM1, TDH3, PFK2, TPI1, PGK1, ENO1, ADH1, and ALD5. In contrast, some of the mitochondrial respiratory genes, such as COX13 (encoding ubiquinol cytochrome c reductase) and QCR2 (encoding cytochrome c oxidase), were repressed (Fig. 2 and 9). The overexpression of glycolytic and fermentative genes in response to the repression of mitochondrial respiratory genes following MG treatment is an example of metabolic shift (1, 40). Such a situation is well known in the case of cancer cells, where an increase in glycolysis due to mitochondrial injury is reported (50). That Candida cells are capable of displaying a metabolic shift has already been documented (1). For example, we observed previously that iron deprivation compels Candida cells to adapt to a fermentative metabolism (21). Recently, upregulation of glycolytic genes was reported as implicated in biofilm formation in a hypoxic environment; this process was regulated by Tye7p, a transcriptional activator of glycolytic genes helping cells to adapt to hypoxia (3). Our biochemical experiments reaffirmed the metabolic shift undergone by MG-treated Candida cells. We could show that Candida cells are highly susceptible to MG if grown in the presence of a nonfermentable carbon source, while cells grown under anoxia displayed enhanced tolerance to the dye.
Fig 9.
Summary of events following MG treatment of Candida cells, as evidenced by microarray profiling and TF screening. Categories of genes or processes that are upregulated are shown in green, while those downregulated are shown in red. MG treatment leads to a depletion of the LIP, a metabolic shift toward fermentation, and the downregulation of respiratory genes, which might cause the observed increase in ROS levels (indicated by dashed arrows), probably leading to cell necrosis. TF screening revealed that UPC2 and STP2 are MG responsive, showing convergence at MET6. Apart from these, other genes that are affected are involved in DNA repair, opaque/white switching, virulence, drug transport, etc.
Mitochondrial respiration leads to the generation of free radicals, which, beyond a threshold, are scavenged to maintain redox homeostasis. The absence of scavengers could result in the accumulation of ROS (25). As mentioned above, two genes, QCR2 and COX13, belonging to complexes III and IV, respectively, of the mitochondrial electron transport chain (ETC), were particularly downregulated following MG treatment, indicating the possibility of dysfunction of the mitochondrial ETC, leading to ROS generation. Since ROS accumulation is perceived as a stress by an organism, MG-treated cells, as expected, display induced expression of redox homeostasis genes, such as SOD1, CAT1, and GPX2. Supplementation with an antioxidant not only reversed the ROS accumulation generated by MG treatment but could also rescue cells from MG toxicity. There are also instances suggesting that excessive ROS accumulation leads to necrosis of the cells. For example, H2O2 or acetic acid triggers apoptosis in yeast cells at low doses and induces a necrotic phenotype when used at higher concentrations (13). The present study shows that treatment of C. albicans with MG at a lethal concentration (MIC80 [200 ng ml−1]) promotes necrosis of cells (Fig. 6D).
Iron is essential for the proper functioning of metabolic processes in a cell, and its depletion could be deleterious. The exposure of Candida cells to MG also repressed genes involved in iron acquisition, such as FTR1 and CTR1, resulting in depletion of the LIP. Notably, exogenous replenishment of the LIP with ferric chloride partly reversed the susceptibility of Candida cells to MG. It should be noted that either replenishment of the LIP or reversal of ROS accumulation by an antioxidant in MG-treated Candida cells led to reduced susceptibility to the dye; however, these effects are mediated through independent mechanisms. For example, the restoration of LIP levels in MG-treated cells does not reverse ROS accumulation, which can be restored to near-normal levels only in the presence of an antioxidant (Fig. 7C).
UPC2 is a global regulator that plays a major role in ergosterol biosynthesis and the maintenance of sterol homeostasis, but our transcriptome data, supported by lipidome analysis of MG-treated cells (see Fig. S3 in the supplemental material), confirmed that the ERG pathway is not affected by the exposure of cells to the dye. Our finding that the susceptibility of C. albicans to MG remained unaffected in ERG (erg2Δ and erg16Δ) mutants strengthens our argument that the high susceptibility of UPC2-null (upc2Δ) mutants to MG is attributable to still unknown targets (Fig. 8C) (53). In this context, the downregulation of MET6 and other genes involved in methionine metabolism in UPC2-null (upc2Δ) mutants is noteworthy (53). The downregulation of MET6 in UPC2-null (upc2Δ) mutants as well as in STP2-null (stp2Δ) mutants suggests cross talk between the two regulators, which hitherto was not known (Fig. 9; see also Fig. S4 in the supplemental material). It is interesting that MG treatment led not only to the detection of the convergence of the UPC2 and STP2 regulatory pathways but also to the identification of new targets. While analyzing the transcriptional response to progesterone as the best inducer of MDR in C. albicans, we could identify new TAC1-regulated targets, which were not detected by fluphenazine, one of the best inducers of MDR (2). Thus, the fungicidal activity of MG against C. albicans not only provides an opportunity for its application as a potential antifungal but can also aid in the identification of new regulatory circuits regulating MDR.
Supplementary Material
ACKNOWLEDGMENTS
The work presented in this paper has been supported in part by grants to R.P. from the Indo-French Center for the Promotion of Advanced Scientific Research (IFC-3403-2/2006) and by DST INT/SWISS/P-31/2009. S.D. is thankful to the Council of Scientific and Industrial Research, Government of India, for awarding a Senior Research Fellowship.
Footnotes
Published ahead of print 17 October 2011
Supplemental material for this article may be found at http://aac.asm.org/.
REFERENCES
- 1. Askew C, et al. 2009. Transcriptional regulation of carbohydrate metabolism in the human pathogen Candida albicans. PLoS Pathog. 5:e1000612. [DOI] [PMC free article] [PubMed] [Google Scholar]
- 2. Banerjee D, et al. 2008. Responses of pathogenic and nonpathogenic yeast species to steroids reveal the functioning and evolution of multidrug resistance transcriptional networks. Eukaryot. Cell 7:68–77 [DOI] [PMC free article] [PubMed] [Google Scholar]
- 3. Bonhomme J, et al. 2011. Contribution of the glycolytic flux and hypoxia adaptation to efficient biofilm formation by Candida albicans. Mol. Microbiol. 80:995–1013 [DOI] [PubMed] [Google Scholar]
- 4. Boyle EI, et al. 2004. GO::TermFinder—open source software for accessing Gene Ontology information and finding significantly enriched Gene Ontology terms associated with a list of genes. Bioinformatics 20:3710–3715 [DOI] [PMC free article] [PubMed] [Google Scholar]
- 5. Bragulat MR, Abarca ML, Castella G, Cabanes FJ. 1995. Dyes as fungal inhibitors: effect on colony enumeration. J. Appl. Bacteriol. 79:578–582 [DOI] [PubMed] [Google Scholar]
- 6. Cabiscol E, et al. 2002. Mitochondrial Hsp60, resistance to oxidative stress, and the labile iron pool are closely connected in Saccharomyces cerevisiae. J. Biol. Chem. 277:44531–44538 [DOI] [PubMed] [Google Scholar]
- 7. Clemmensen S, et al. 1984. Toxicological studies on malachite green: a triphenylmethane dye. Arch. Toxicol. 56:43–45 [DOI] [PubMed] [Google Scholar]
- 8. Clinical and Laboratory Standards Institute (CLSI) 2008. Reference method for broth dilution antifungal susceptibility testing of yeasts; approved standard—3rd ed. CLSI document M27–A3. Clinical and Laboratory Standards Institute, Wayne, PA [Google Scholar]
- 9. Culp SJ, et al. 1999. Toxicity and metabolism of malachite green and leucomalachite green during short-term feeding to Fischer 344 rats and B6C3F1 mice. Chem. Biol. Interact. 122:153–170 [DOI] [PubMed] [Google Scholar]
- 10. Culp SJ, et al. 2002. Mutagenicity and carcinogenicity in relation to DNA adduct formation in rats fed leucomalachite green. Mutat. Res. 506–507:55–63 [DOI] [PubMed] [Google Scholar]
- 11. Davis DA, Bruno VM, Loza L, Filler SG, Mitchell AP. 2002. Candida albicans Mds3p, a conserved regulator of pH responses and virulence identified through insertional mutagenesis. Genetics 162:1573–1581 [DOI] [PMC free article] [PubMed] [Google Scholar]
- 12. Decottignies A, et al. 1998. ATPase and multidrug transport activities of the overexpressed yeast ABC protein Yor1p. J. Biol. Chem. 273:12612–12622 [DOI] [PubMed] [Google Scholar]
- 13. Eisenberg T, Carmona-Gutierrez D, Buttner S, Tavernarakis N, Madeo F. 2010. Necrosis in yeast. Apoptosis 15:257–268 [DOI] [PubMed] [Google Scholar]
- 14. Epsztejn S, Kakhlon O, Glickstein H, Breuer W, Cabantchik I. 1997. Fluorescence analysis of the labile iron pool of mammalian cells. Anal. Biochem. 248:31–40 [DOI] [PubMed] [Google Scholar]
- 15. Fardeau V, et al. 2007. The central role of PDR1 in the foundation of yeast drug resistance. J. Biol. Chem. 282:5063–5074 [DOI] [PubMed] [Google Scholar]
- 16. Fonzi WA, Irwin MY. 1993. Isogenic strain construction and gene mapping in Candida albicans. Genetics 134:717–728 [DOI] [PMC free article] [PubMed] [Google Scholar]
- 17. Franz R, et al. 1998. Multiple molecular mechanisms contribute to a stepwise development of fluconazole resistance in clinical Candida albicans strains. Antimicrob. Agents Chemother. 42:3065–3072 [DOI] [PMC free article] [PubMed] [Google Scholar]
- 18. Franz R, Ruhnke M, Morschhauser J. 1999. Molecular aspects of fluconazole resistance development in Candida albicans. Mycoses 42:453–458 [DOI] [PubMed] [Google Scholar]
- 19. Gasch AP, et al. 2001. Genomic expression responses to DNA-damaging agents and the regulatory role of the yeast ATR homolog Mec1p. Mol. Biol. Cell 12:2987–3003 [DOI] [PMC free article] [PubMed] [Google Scholar]
- 20. Gola S, Martin R, Walther A, Dunkler A, Wendland J. 2003. New modules for PCR-based gene targeting in Candida albicans: rapid and efficient gene targeting using 100 bp of flanking homology region. Yeast 20:1339–1347 [DOI] [PubMed] [Google Scholar]
- 21. Hameed S, Dhamgaye S, Singh A, Goswami SK, Prasad R. 2011. Calcineurin signaling and membrane lipid homeostasis regulates iron mediated multidrug resistance mechanisms in Candida albicans. Plos One. 6:e18684 doi:10.1371/journal.pone.0018684 [DOI] [PMC free article] [PubMed] [Google Scholar]
- 22. Jiao B, Yeung EK, Chan CB, Cheng CH. 2008. Establishment of a transgenic yeast screening system for estrogenicity and identification of the anti-estrogenic activity of malachite green. J. Cell. Biochem. 105:1399–1409 [DOI] [PubMed] [Google Scholar]
- 23. Kohli A, Smriti Mukhopadhyay K, Rattan A, Prasad R. 2002. In vitro low-level resistance to azoles in Candida albicans is associated with changes in membrane lipid fluidity and asymmetry. Antimicrob. Agents Chemother. 46:1046–1052 [DOI] [PMC free article] [PubMed] [Google Scholar]
- 24. Lamping E, et al. 2007. Characterization of three classes of membrane proteins involved in fungal azole resistance by functional hyperexpression in Saccharomyces cerevisiae. Eukaryot. Cell 6:1150–1165 [DOI] [PMC free article] [PubMed] [Google Scholar]
- 25. Landolfo S, Politi H, Angelozzi D, Mannazzu I. 2008. ROS accumulation and oxidative damage to cell structures in Saccharomyces cerevisiae wine strains during fermentation of high-sugar-containing medium. Biochim. Biophys. Acta 1780:892–898 [DOI] [PubMed] [Google Scholar]
- 26. Lemoine S, Combes F, Servant N, Le Crom S. 2006. Goulphar: rapid access and expertise for standard two-color microarray normalization methods. BMC Bioinformatics 7:467. [DOI] [PMC free article] [PubMed] [Google Scholar]
- 27. Martins CV, et al. 2009. Curcumin as a promising antifungal of clinical interest. J. Antimicrob. Chemother. 63:337–339 [DOI] [PubMed] [Google Scholar]
- 28. McCluskey K, Wiest A, Plamann M. 2010. The Fungal Genetics Stock Center: a repository for 50 years of fungal genetics research. J. Biosci. 35:119–126 [DOI] [PubMed] [Google Scholar]
- 29. Menezes RA, et al. 2008. Contribution of Yap1 towards Saccharomyces cerevisiae adaptation to arsenic-mediated oxidative stress. Biochem. J. 414:301–311 [DOI] [PubMed] [Google Scholar]
- 30. Morschhauser J. 2010. Regulation of white-opaque switching in Candida albicans. Med. Microbiol. Immunol. 199:165–172 [DOI] [PubMed] [Google Scholar]
- 31. Morschhauser J, Michel S, Staib P. 1999. Sequential gene disruption in Candida albicans by FLP-mediated site-specific recombination. Mol. Microbiol. 32:547–556 [DOI] [PubMed] [Google Scholar]
- 32. Mukhopadhyay K, Kohli AK, Prasad R. 2002. Drug susceptibilities of yeast cells are affected by membrane lipid composition. Antimicrob. Agents Chemother. 46:3695–3705 [DOI] [PMC free article] [PubMed] [Google Scholar]
- 33. Mukhopadhyay K, et al. 2004. Membrane sphingolipid-ergosterol interactions are important determinants of multidrug resistance in Candida albicans. Antimicrob. Agents Chemother. 48:1778–1787 [DOI] [PMC free article] [PubMed] [Google Scholar]
- 34. Nunes PA, Tenreiro S, Sa-Correia I. 2001. Resistance and adaptation to quinidine in Saccharomyces cerevisiae: role of QDR1 (YIL120w), encoding a plasma membrane transporter of the major facilitator superfamily required for multidrug resistance. Antimicrob. Agents Chemother. 45:1528–1534 [DOI] [PMC free article] [PubMed] [Google Scholar]
- 35. Odds FC, Brown AJ, Gow NA. 2003. Antifungal agents: mechanisms of action. Trends Microbiol. 11:272–279 [DOI] [PubMed] [Google Scholar]
- 36. Prasad R, Kapoor K. 2005. Multidrug resistance in yeast Candida. Int. Rev. Cytol. 242:215–248 [DOI] [PubMed] [Google Scholar]
- 37. Reuss O, Vik A, Kolter R, Morschhauser J. 2004. The SAT1 flipper, an optimized tool for gene disruption in Candida albicans. Gene 341:119–127 [DOI] [PubMed] [Google Scholar]
- 38. Saeed AI, et al. 2006. TM4 microarray software suite. Methods Enzymol. 411:134–193 [DOI] [PubMed] [Google Scholar]
- 39. Saeed AI, et al. 2003. TM4: a free, open-source system for microarray data management and analysis. Biotechniques 34:374–378 [DOI] [PubMed] [Google Scholar]
- 40. Serra A, Strehaiano P, Taillandier P. 2003. Characterization of the metabolic shift of Saccharomyces bayanus var. uvarum by continuous aerobic culture. Appl. Microbiol. Biotechnol. 62:564–568 [DOI] [PubMed] [Google Scholar]
- 41. Sharma M, Manoharlal R, Puri N, Prasad R. 2010. Antifungal curcumin induces reactive oxygen species and triggers an early apoptosis but prevents hyphae development by targeting the global repressor TUP1 in Candida albicans. Biosci. Rep. 30:391–404 [DOI] [PubMed] [Google Scholar]
- 42. Shukla S, Saini P, Smriti Jha S, Ambudkar SV, Prasad R. 2003. Functional characterization of Candida albicans ABC transporter Cdr1p. Eukaryot. Cell 2:1361–1375 [DOI] [PMC free article] [PubMed] [Google Scholar]
- 43. Souza RC, et al. 2010. Comparison of the photodynamic fungicidal efficacy of methylene blue, toluidine blue, malachite green and low-power laser irradiation alone against Candida albicans. Lasers Med. Sci. 25:385–389 [DOI] [PubMed] [Google Scholar]
- 44. Srivastava S, Sinha R, Roy D. 2004. Toxicological effects of malachite green. Aquat. Toxicol. 66:319–329 [DOI] [PubMed] [Google Scholar]
- 45. Tsao S, Rahkhoodaee F, Raymond M. 2009. Relative contributions of the Candida albicans ABC transporters Cdr1p and Cdr2p to clinical azole resistance. Antimicrob. Agents Chemother. 53:1344–1352 [DOI] [PMC free article] [PubMed] [Google Scholar]
- 46. Tusher VG, Tibshirani R, Chu G. 2001. Significance analysis of microarrays applied to the ionizing radiation response. Proc. Natl. Acad. Sci. U. S. A. 98:5116–5121 [DOI] [PMC free article] [PubMed] [Google Scholar]
- 47. Wang X, et al. 2009. Effect of berberine on Staphylococcus epidermidis biofilm formation. Int. J. Antimicrob. Agents 34:60–66 [DOI] [PubMed] [Google Scholar]
- 48. White TC, Holleman S, Dy F, Mirels LF, Stevens DA. 2002. Resistance mechanisms in clinical isolates of Candida albicans. Antimicrob. Agents Chemother. 46:1704–1713 [DOI] [PMC free article] [PubMed] [Google Scholar]
- 49. Wilson RB, Davis D, Mitchell AP. 1999. Rapid hypothesis testing with Candida albicans through gene disruption with short homology regions. J. Bacteriol. 181:1868–1874 [DOI] [PMC free article] [PubMed] [Google Scholar]
- 50. Xu RH, et al. 2005. Inhibition of glycolysis in cancer cells: a novel strategy to overcome drug resistance associated with mitochondrial respiratory defect and hypoxia. Cancer Res. 65:613–621 [PubMed] [Google Scholar]
- 51. Ying S, Qing S, Chunyang L. 2010. The effect of gentian violet on virulent properties of Candida albicans. Mycopathologia 169:279–285 [DOI] [PubMed] [Google Scholar]
- 52. Zhang H, et al. 2009. Mechanism of action of tetrandrine, a natural inhibitor of Candida albicans drug efflux pumps. Yakugaku Zasshi 129:623–630 [DOI] [PubMed] [Google Scholar]
- 53. Znaidi S, et al. 2008. Genome-wide location analysis of Candida albicans Upc2p, a regulator of sterol metabolism and azole drug resistance. Eukaryot. Cell 7:836–847 [DOI] [PMC free article] [PubMed] [Google Scholar]
Associated Data
This section collects any data citations, data availability statements, or supplementary materials included in this article.


