


Abstract
We propose and study a class-expansion/innovation/loss model of genome evolution taking into account biological roles of genes and their constituent domains. In our model, numbers of genes in different functional categories are coupled to each other. For example, an increase in the number of metabolic enzymes in a genome is usually accompanied by addition of new transcription factors regulating these enzymes. Such coupling can be thought of as a proportional ‘recipe’ for genome composition of the type ‘a spoonful of sugar for each egg yolk’. The model jointly reproduces two known empirical laws: the distribution of family sizes and the non-linear scaling of the number of genes in certain functional categories (e.g. transcription factors) with genome size. In addition, it allows us to derive a novel relation between the exponents characterizing these two scaling laws, establishing a direct quantitative connection between evolutionary and functional categories. It predicts that functional categories that grow faster-than-linearly with genome size to be characterized by flatter-than-average family size distributions. This relation is confirmed by our bioinformatics analysis of prokaryotic genomes. This proves that the joint quantitative trends of functional and evolutionary classes can be understood in terms of evolutionary growth with proportional recipes.
INTRODUCTION
Protein-coding genes in genomes can be classified in both functional categories (e.g. transcription factors or metabolic enzymes) as well as ‘evolutionary categories’ or families of homologous genes (to avoid confusion, in the following we will reserve the term ‘category’ to functional annotations, and we will use the term ‘family’ as a generic indication of homology classes, or domain families/superfamilies in domain data, see ‘Materials and Methods’ section). Functional categories are routinely composed of a large number of evolutionary ones. This distinction is illustrated in Figure 1, where genes are characterized by both shape (functional category) and color (homology class) with each shape represented by multiple colors. Understanding the principles connecting these separate classifications of genomic material is an important step in order to disentangle the organization of the content of whole genomes.
Figure 1.

Scaling laws in joint functional/evolutionary partitioning of genomes. Genomes are partitioned into families of homologous genes (colors) and functional categories (shapes). (A) The number of unique evolutionary categories (domain families) (y-axis) scales sub-linearly with the genome size (x-axis.) (B) Cumulative histograms of domain family size (Figure 4). (C) The number of transcriptional regulators (red), metabolic enzymes (blue) and housekeeping genes responsible for translation (green) plotted as a function of the genome size measured by the total number of domains. Symbols in all the plots are empirical data for protein domains in 753 fully sequenced bacterial genomes.
More specifically, studies of fully sequenced genomes revealed that their functional and evolutionary composition is governed by simple quantitative laws (1,2). In particular, for prokaryotes the number of genes in individual functional categories was shown to scale as a power law of the total number of genes in the genome (2). Depending on the functional category the exponent of this scaling law varies from 0 (for fixed sets of housekeeping genes) to 1 (for metabolic enzymes) and all the way up to 2 (for transcription factors and kinases) (2,3). Furthermore, the distribution of sizes of gene families (called ‘evolutionary categories’ in our title) has a scale-free distribution with the exponent inversely correlated with the genome size (1,4,5). The overall number of gene (or domain) families represented by at least one member exhibits a slower-than-linear scaling with the total number of genes in a genome (6,7). Biologically, the growth of evolutionary families derives from combined processes of horizontal gene transfer, gene duplication, gene genesis and gene loss (8). For prokaryotes, horizontal transfer appears to dominate gene family expansion (9), and the same process is presumably very important for the introduction of a new evolutionary family into an extant genome.
The comprehension of these empirical laws requires to construct quantitative models that explore different design principles, or more prosaically the recipes by which genomes are built from elementary functional and evolutionary ingredients. In this study we introduce the first model to jointly explain observed scaling laws for evolutionary families and functional categories.
Several theoretical models have been previously proposed to explain the observed power-law distribution of family sizes (5,10–13). Most of these models are of class-expansion/innovation/loss type, abstractly mimicking basic evolutionary moves such as horizontal transfer, duplication, loss. We recently formulated a related model that in addition to family size distribution also explains and successfully fits the scaling of the number of distinct gene families represented in a genome as a function of genome size (6,14).
On another front, the ‘toolbox model’ of evolution of metabolic networks and their regulation recently proposed by one of us (15) offered an explanation for the quadratic scaling between the number of transcription factors and the total number of genes in prokaryotes. In this model, metabolic and regulatory networks of prokaryotes are shaped by addition of co-regulated metabolic pathways. The number of added enzymes systematically decreases with the proportion to which the organism has already explored the universe of available metabolic reactions, and thus, indirectly, with the size of its genome. For the purposes of the present study, a key ingredient of the toolbox model is that events adding or deleting genes in multiple functional categories (in this case metabolic enzymes and transcription factors regulating metabolic pathways) are tightly correlated with each other. The concept of coordinated expansion or contraction of functional categories can in principle be extended beyond enzymes and their regulators.
One should note that this explanation of scaling of functional categories is conceptually different from that based on ‘evolutionary potentials’ proposed in Ref. (3). Evolutionary potentials quantify the intrinsic growth rates of individual categories. This means that in this model the growth of one functional category is represented as uncoupled from growth or decline in other functional categories. However, evolutionary potentials could also be the effective result of the coordinated expansion of multiple functional categories linked by interactions of biological and evolutionary origin (e.g. linking membrane proteins with signal transduction, etc.) On the other hand, it is clear that models with evolutionary potentials represent quite well the empirical data on the growth of functional categories, and thus it appears that this must be (at least) a very good effective description, that any more detailed model needs to reproduce.
This study brings together the basic ingredients of class-expansion/innovation/loss models (6,14) and coordinated growth of functional categories (15). The resulting combination allows us to study the interplay between the scaling of evolutionary and functional categories. In particular, we mathematically derive a relation between the exponents characterizing these two scaling laws. It predicts that functional categories that grow faster-than-linearly with genome size are characterized by flatter-than-average family size distributions. This prediction of our model is subsequently verified by our analysis of functional and evolutionary scaling in empirical data on sequenced prokaryotic genomes. Finally, we analyze and discuss the alternative combination of a class-expansion/innovation/loss model with growth of functional categories dictated by evolutionary potentials.
MATERIALS AND METHODS
Models
The model represents a genome as a list of genes, which is partitioned in homology families and functional categories. Genome evolution is modeled as a stochastic process where the elementary moves can be any of two types: (i) a ‘family expansion’ or ‘duplication’ move in which a new domain is placed in an evolutionary category (family of homologous domains) already present in the genome or (ii) an ‘innovation’ move in which a new family with just one domain appears in a genome (e.g. by the virtue of horizontal gene transfer).
We would like to emphasize that in the tradition established in ‘duplication-innovation-loss’ models, which we follow, the family expansion move is customarily labeled as duplication. In reality this move can come either by the virtue of gene duplication or by horizontal gene transfer, which appears to be the dominant class-expansion mechanism in bacteria (9). The overall family size in all genomes might be generating an effective ‘preferential attachment’ for HGT events [see Refs. (3,16) and open comments by referees therein].
Although genes are natural objects of this kind of description, it is not simple to use genes as central units in the analysis of empirical data, mainly due to the fact that gene dynamics is complex and may contain events of gene fusion, splitting and internal rearrangements. Thus, as in some previous analyses, we will compare the models with data on protein domains (3,6), which have the important property that they cannot be split into smaller units (17). Domains are modular building blocks of proteins and it has been argued that they effectively work as the natural atomic elements in genome evolution (4). Concerning the scaling laws, domains appear to have the same qualitative behaviour as genes. Throughout the article, we will be comparing the models with data on 753 bacteria from the SUPERFAMILY database (18). The models will be formulated for abstract atomic elements that could be genes or domains, and possible relevant issues when dealing empirically with genes will be addressed in the discussion. In describing the models we will generally refer to these units as genes.
Technically, in order to compare with the protein domain data we rely on simplifying assumptions on the domain composition of proteins. Obviously the situation is more complex than this. We have verified in the data that the number of TF domains is linear in the number of TF genes (Supplementary Figure S5), with slope 1.09 (average number of TF domains in a TF gene). A second assumption is that the number of families belonging to a functional category is linear in the total number of families. This assumption is in accordance with data (Figure 2 and Supplementary Figure S1). In particular, we observed this trend for the number of transcription factor superfamilies (Supplementary Figure S2).
Figure 2.

The number of evolutionary (domain) families belonging to a functional category follows a linear law in empirical data, denoting a possible invariant of genome composition. The left panel plots the data for the number of families fc in the 10 largest functional categories on all genomes, following the trend fc = Ac + χc f, where f is the total number of families on the genome. Symbols are empirical data for 753 fully sequenced bacterial genomes. The offset Ac is large only for the ‘translation’ category. The right panel is a plot of the coefficients χc obtained from the same data (subtracting the offset Ac obtained from a linear fit), as a function of genome size in domains, n. See also Supplementary Table S1.
Standard Chinese restaurant process
The starting point is a class-expansion/innovation process for the homology families that reproduces qualitatively the empirical scaling laws (6). This process [known in mathematical literature as ‘Chinese Restaurant Process’ or CRP (19)] defines a growth dynamics for the partitioning of a set of elements (genes or domains) based on two basic growth moves. Traditionally the CRP model is defined by two parameters α and θ constrained by 0 ≤ α ≤ 1 and θ > −α. The moves are quantified and defined by two probabilities pO and pN of duplication and innovation respectively.
The class-expansion probability
 of a domain family i is proportional to the number of family members ni currently in the genome offset by α:
 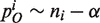 (Table 1).
The innovation probability pN is the probability of adding a new domain family with one member. It corresponds to a new domain family appearing in a genome by de novo evolution or horizontal gene transfer. The CRP model assumes pN ∼ αf + θ, where f is the total number of domain families present in the genome.
The normalization condition 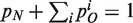 determines the pre-factor in both equations to be 1/(n + θ). A gene loss move does not seem to be essential for the basic qualitative results. Indeed, if stochastic (uniform) gene loss is incorporated into the model it results only in renormalization of parameters pO and pN (14).
Table 1.
Basic model quantities and notations
| Quantity | Meaning |
|---|---|
| α, θ | CRP model parameters |
| n | Genome size quantified by its total number of domains |
| ni | Number of domains in the family i |
| nc | Number of domains in the functional category c |
| f(n) | Number of families in a genome of size n |
| fc(n) | Number of families in a genome of size n belonging to the functional category c |
| f(d, n) | Number of families with exactly d members in a genome of size n |
| fc(d, n) | Number of families belonging to the functional category c with exactly d members in a genome of size n |
| β | Exponent of the family-population histogram |
| βc | Exponent of the family-population histogram restricted to category c |
| χc | Probability to introduce a new family of the category c (empirically quantified by the slope of fc versus f) |
| ζc | Exponent of the scaling of the size of functional category c versus genome size n |
We explore the model by direct simulation and by solving continuous ‘mean-field’ equations (6,14) that describe the mean behaviour of the number of homology families and functional categories, and the statistics of the population of families and categories.
CRP model incorporating functional categories
In order to introduce functional categories into the CRP, one has to specify pO and pN for different categories. We first assume that the probability of introducing a gene of a specific functional category by the innovation move is independent of genome size. This assumption implies that the number of homology families of a given category scales linearly in the total number of families, and is justified empirically for some functional categories by domain data (Figure 2 and Supplementary Figures S1 and S2). Equivalently,  , where χc is the probability of introducing a new family of the category c. In other words, it is assumed here that every time a new family is added, the probability that it will belong to category c is χc.
Under this assumption, the mean-field equation describing the growth of a family of homologous domains (evolutionary category) is
 |
(1) |
Here the genome size n is used instead of time and averages over multiple realizations of a process are implied. The novel ingredient of the model—coordinated growth of functional categories—is encoded in the coefficients aij responsible for correlated duplications between evolutionary families i and j. We assume aij to depend only on functional roles of families i and j. The equation describing the growth of f—the number of distinct families in a genome is the same as in a standard CRP model.
| (2) |
The function C(n), which sets a natural time scale for the process, is determined by the normalization condition ∂nn = 1, i.e. ∑i ∂n ni + ∂n f = 1.
For the specific case of categories of transcription factors (TFs) regulating metabolic processes and their metabolic target enzymes, the necessity of a correlated move can be argued along the lines of ref. (15). A set of new targets has to be added to incorporate a new metabolic function. This entails the addition of a new metabolic pathway that is long enough to connect a new nutrient to a previously existing pathway, that further converts it to a central metabolic ‘core network’. Supposing that each newly added branch is controlled by only one added TF, since the length of the branch becomes smaller with increasing size of the organismal metabolic network (compared to a metabolic ‘universe’), on average, increasingly more TFs per target will be needed in order to control newly incorporated branches.
More generally, functional, genetic and epistatic interactions can create the correlated growth of different functional categories of genes. In the ‘Discussion’ section we provide the empirical evidence of statistically significant correlations between various functional categories.
Following the recipe outlined in ref. (15) we consider a simplified version of the model involving only two functional categories: (1) TF—transcription factors controlling metabolic processes; (2) met—metabolic enzymes they regulated. As in the toolbox model, changes in nTF and nmet are coordinated with correlation coefficients aij given by
Here U is the size of the metabolic universe, i denotes any gene family from functional category TF, and j—from the functional category met. In this variant, addition of transcription factors can only occur conditionally to the addition of metabolic enzymes. In the following, we will refer to this model variant as Model Ia. We define a second variant of the correlated model (Model Ib), which is a more direct extension of the standard CRP model, and thus can exploit previous mean field theory analytical results. In this case
(where i again denotes any gene family from functional category TF and j—from the functional category met). In this model variant, all families (and hence also TFs families) have an equal intrinsic growth rate on top of the correlation. If aij = 0, i ≠ j the model is equivalent to the standard CRP. Finally, we also considered a model (Model II) where correlations between functional categories are absent, but instead members of a given functional category are added at a category-dependent intrinsic rate as prescribed by ‘evolutionary potentials’ of Molina and van Nimwegen (in this case, aij = 0 for i ≠ j, and aii = ρc(i), where c(i) is the functional category to which family i belongs, and ρc(i) is the evolutionary potential of class c). These results are discussed later on in the manuscript and compared to the two ‘correlated duplication’ models above (see ‘Discussion’ section and Supplementary Data).
To resume, two kinds of models are considered here: ‘correlated recipes’, where the scaling exponents can only result from interactions between categories (Model Ia and Ib, the main focus of our study), and ‘absolute recipes’ (Model II), leading to different intrinsic growth rates for different categories. Correlated models might contain an specific intrinsic growth rate of the classes, equal for all classes (Model Ib), or not (Model Ia). We will see that the important distinction between Model I (a and b) and Model II is that the different scaling exponents for functional categories are a result of correlations and not absolute class expansion rates.
Data
Data on superfamily domain assignments and superfamily functional annotations for the 753 Bacteria were obtained from the SUPERFAMILY (v1.73) database (18). The database contains 1291 different domain superfamilies grouped into 47 different functional categories (60 families do not belong to a specific category). These categories are divided into 6 larger groups (Metabolism, General, Regulation, Information, Initiation Complex Processes and Elongation Complex Processes, see also http://supfam.cs.bris.ac.uk/SUPERFAMILY_1.73/function).
Evaluation of exponents in empirical data
We considered the normalized cumulative histograms (families with more than d members) and non-cumulative histograms (families with exactly d members) of the populations for all evolutionary families (related to exponent β, see ‘Results’ section), and those restricted to the families belonging to each of the main functional categories indexed by c (related to the exponent βc, see ‘Results’ section). Exponents were estimated by fitting the data with a power-law, restricting to a window where the x axis value was less than a cutoff value, as in ref. (14). The cutoff was chosen for each fit, by minimizing the chi-square residuals with varying window size. This procedure was implemented with a custom CINT (C++) script using the ROOT software. Figure 6 is obtained considering the fitted exponents for the histograms of the five largest genomes [where the ‘finite-size correction’ is smallest, see Figure 5 and ref. (14).]
Figure 6.

Linear relation between ζc and 1/βc. Our theory predicts ζc ∼ β/βc (solid line). The empirical value of β = .74 is calculated from the family-population histograms of the five most populated genomes. Symbols (circles and triangles) are empirical data for 38 functional categories (see also Supplementary Table S2). Triangles represent the 10 most populated categories, where the estimated exponents are most accurate. The outlier is the ‘small molecule binding’ category known to follow peculiar evolutionary mechanisms (20).
Figure 5.

Exponent of evolutionary families and genome size. Fitted exponent of domain family-population cumulative histograms versus genome size, for the 753 bacteria in the SUPERFAMILY database for TF families (red circles) and all families (black triangles), obtained by a fitting method giving a lower weight to the tail in order to keep into account the cutoffs [used in ref. (14)].
Empirical correlations among functional categories
Correlation between families (or categories) populations were calculated from the deviations from the average trend. We obtained the frequency of a family/category in every genome, defined as the ratio between the population of a family in domains and the total number of domains assigned on that genome. Subsequently for every family/category, we extracted an average trend as a function of genome size n using a sliding-window histogram (with window size of 280 domains and resolution of 28 domains), and we considered the deviation of each genome from the average trend at its value of n. The Pearson correlation of these deviations over all the genomes was considered between each pair of families/categories (Figure 7 and Supplementary Tables S3 and S4).
Figure 7.

Correlation between the populations of 24 different metabolic functional categories from the SUPERFAMILY database for 753 bacteria. The correlation matrix is calculated from fluctuations of categories from the average trend (see ‘Materials and Methods’ section). Both correlation and anticorrelation are present between categories. Different metabolism categories are highly (anti-)correlated.
Models and simulations
The quantitative duplication–innovation evolutionary models were explored by a mean field analytical approach and direct numerical simulations. The mean field approach considers equations for the means of the observed quantities in the large-n approximation. In parallel with the mean field analysis, we performed simulations of the main model and its variants. The realizations depend on the following parameters. (i) The parameters of a standard CRP, α and θ. (ii) The parameter χc, i.e. the probability that a new family belongs to a given functional category. This parameter can be inferred from data (see ‘Results’ section and Figure 2). For example, for the case of TFs and targets, we defined χTF from the slope extrapolated from Supplementary Figure S2, giving χTF ≃ 0.035 (see also Supplementary Figure S6). (iii) Initial conditions, represented by initial configuration (number of leaves, number of TFs and number of families in both categories). We have used the configuration of the smallest bacterium in the data set (Candidatus Carsonella ruddii). An alternative choice could be the minimal intersection of all genomes in the database. (iv) Variant-specific parameters, that amount to the evolutionary potentials ρc for the first variant of the model, and the correlation matrix between functional categories, aij for the second variant. Simulation results are typically visualized in boxplots in order to compare the means with the probability distributions. In these plots bars correspond to (in order) the smallest observation, lower quartile, median, upper quartile and largest observation.
RESULTS
A new invariant of genome composition
We found (Figure 2 and also Supplementary Table S1) that the number of evolutionary domain families forming a functional category follows a linear law in empirical data, denoting a possible invariant of genome composition. This also implies that the mean law ∂n fc = χc ∂n f assumed in the model is justified by the data. This does not mean exactly that the fraction of all families belonging to a certain functional category is constant. Rather, the observed law can be fc = Ac + χc f, with an offset Ac representing a minimal amount of evolutionary families required to build a given functional category. In empirical data, this offset appears to be large only for the ‘translation’ functional category.
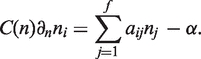
The model captures the combined scaling laws
Numerical simulation and mean field analytical solutions of the correlated growth model (Model I) reproduce very well both the empirical behavior of the TFs scaling law and the statistics for evolutionary domain families (Figure 3 and Supplementary Figure S4). We found no significant qualitative difference between Models Ia and Ib regarding these observables. Furthermore, the joint scaling laws can be reproduced also with an uncorrelated model (Model II), with minor technical difficulties (see ‘Discussion’ section). The correct asymptotic quadratic scaling can be obtained from mean field arguments for both Model I and II. These arguments are presented in the Supplementary Text. In order to illustrate this point we consider for example Model Ib. Starting from Equations 1 one has to sum over all domain families from functional categories TF and met. Since nTF = ∑i∈TF ni, depends on the number of TF classes, one must have for its derivative ∂nnTF = ∑i∈TF∂n ni + ∂nfTF. Combined, these two equations give dnTF/dnmet = 2(nTF − α)/(nmet − α) ≃ 2nTF/nmet, or finally the quadratic scaling  .
.
Figure 3.

Comparison between 1000 realizations of the correlated duplication model Ib at α = 0.3 and θ = 140 (blue boxplot) and empirical data (red circles). The left panel is a plot of the number of distinct domain families versus genome size. The fact that the number of families does not saturate is a property of the standard duplication-innovation model (see (6) for a complete discussion). The right panel plots the number of TF domains versus the total number of domains, showing that the scaling of the transcription functional category is well reproduced (exponent ≃ 1.6.). See Supplementary Figure S4 for model Ia.
Altogether, the agreement between data and model is universal, in the sense that the same three parameters are sufficient to predict family/category numbers and populations for all genomes in the data set. Moreover, the comparison does not rely on the adjustment of any hidden parameter. It is also worthwhile noting that, while the input of model I (a and b) is built to give an asymptotic power-law scaling exponent of two for TFs (which is reproduced by the mean field approach), at the relevant genome sizes the model automatically reproduces the correct empirical exponent (about 1.6 in the SUPERFAMILY data) as an effect of the finite system size. Note that in Model Ib TFs can duplicate both spontaneously (uncorrelated move) and following spontaneous duplication of targets (correlated move), corresponding to the terms aii and aij in Equation 1, while in Model Ia this does not happen.
The extension of the model to more than two categories requires to know the laws through which families of different categories are correlated with each other. Supplementary Figure S3 compares the results obtained by a correlated duplication model formulated with three categories (TFs, met, others).
Prediction of the exponents of the family-population histogram restricted to single functional categories
While the agreement between model and data shows that the scaling of functional and evolutionary categories can be understood jointly, it does not provide by itself any substantially new information about how the two partitionings interact. Further insight can be obtained considering the distributions of the number of domains per family for different evolutionary families belonging to the same functional category. In general, the population of domain families of a genome follows a near power law distribution whose slope depends on genome size (Figure 4). The mean number f(d, n) of domain families having d members at large genome size n is well described by the slope 1/d1+β (Figure 4), and thus the cumulative histogram by Q(d, n) ∼1/dβ, where the fitted exponent β typically lies between 0 and 1. The standard CRP predicts this behavior (6,14). The model described here allows to consider the same histograms restricted to specific functional categories (Figures 4 and 6).
Figure 4.

Empirical data and simulations for the normalized domain family-population cumulative histograms. The histograms are defined as the fraction f(d, n)/f(n) of families with more than d domains. (A) Empirical data for the 753 bacteria in the SUPERFAMILY database (each color is a set of genomes with similar sizes). Left panel: domain family-population cumulative normalized histograms. Right panel: normalized cumulative histograms restricted to domain families belonging to the TF functional categories. Note that the histograms slopes are different. (B) Simulations of Model Ib for domain family-population cumulative histograms of CRP with correlated duplications run at α = 0.3 and θ = 140. The plots in the two panels are defined as in (A). (C) Comparison between simulations of the correlated duplication model variant run at α = 0.3 and θ = 140 (black lines) with empirical data (orange lines) for the largest genome sizes (5000 < n < 8500). Left panel: global normalized cumulative histograms of domain family population. Right panel: normalized cumulative histograms restricted to TF domain families.
A mean field calculation (see Supplementary Data) based on the model variant with correlated duplication predicts that the different trend of domain population histograms for TF families scales as 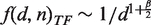 (Figure 5). Thus, the ratio between the exponent of the cumulative histogram of all families and the exponent of the cumulative histogram restricted to families belonging to the TF category is predicted to be equal to the mean field exponent for the scaling of the functional category. Specifically, Q(d, n) scales as 1/dβ whereas QTF(d, n) scales as d−β/2 and thus the ratio of exponents is β/(β/2) = 2, and this matches the asymptotic scaling of the number of TFs. More in general, the model indicates that each time the per-family duplication probability for a functional category takes the form
  , where nc is the total population of the functional category c, the coefficient ζc will appear in the equation for P(d)c, the (cumulative) distribution of families belonging category c. This causes the relationship βc = β/ζc and appears to be robust with respect to the choice of a specific model (see Supplementary Data). In other words, a precise quantitative relationship must exist between the scaling exponent of a category and the slope of the family-population histogram restricted to the same category. Functional categories that grow faster-than-linearly with genome size will have flatter-than-average domain family size distributions. Conversely categories growing slower-than-linearly will follow a steeper-than-average slope.
Accordingly, a strongly visible trend should be expected in empirical data from families belonging to the TF category, which scales with exponent 2. Indeed, the empirical population histograms for the TF functional category for all the genomes in the data set have a slope that is spectacularly different from the global one (Figure 5 and Supplementary Figure S13). Quantitatively, this observation is in excellent agreement with predictions (Table 2). Direct simulations of the correlated model reproduce well both the behavior of the histograms at given size and the dependency on genome size (Figure 4).
Table 2.
Prediction of the exponent of the family-population histograms restricted to singular functional category
| Genome | β/βTF | ζTF |
|---|---|---|
| Sorangium cellulosum | 1.72±0.1 | 1.6 |
| Burkholderia xenovorans | 1.63±0.08 | 1.6 |
| Burkholderia | 1.54±0.13 | 1.6 |
| Solibacter usitatus | 1.46±0.05 | 1.6 |
| Bradyrhizobium japonicum | 1.59±0.11 | 1.6 |
Comparison between expected and observed ratio of the exponent of the cumulative histogram of all families and the exponent of the cumulative histogram of TF families (Figure 6), for the five largest bacteria in the SUPERFAMILY database. The ratio can be compared with the mean field prediction of 2, or directly with the empirical exponent of the TF functional category (1.6).
More generally, one can test the prediction ζc = β/βc with an empirical evaluation of many functional categories (Figure 6). The agreement of empirical data with the predicted behavior is reasonably good, keeping in mind that many functional categories are composed by few or poorly populated families, and in these cases the data might not follow a scaling law that is as clearly defined as the metabolism or the TF categories.
DISCUSSION
Population of evolutionary families of a given functional category
We have presented the first combined quantitative description of the partitioning of genomes in both evolutionary families and functional categories. The results show that a theoretical framework that correctly reproduces both the scaling laws for functional categories of genes/domains and the scaling laws for gene/domain families (numbers and histograms) is possible. Biologically, this finding can help us understand the large-scale architecture of a genome in terms of its functional content.
Analyzing the data in order to formulate the model, we found that the number of evolutionary domain families forming a functional category is linear in the total number of domain families (Figure 2). Thus, the genomic subdivision of evolutionary classes in functional categories appears to be arguably the simplest possible, if one disregards the class population. This ingredient was taken as an assumption for all the models considered here, which the data fully justify.
The model leads to the non-trivial prediction that connects the growth exponent of a functional category to the slope of the family-population histogram restricted to the same category. In other words, the populations functional categories and evolutionary families of genes are connected by a simple quantitative law. Specifically, the ratio between the exponent of the cumulative histogram of all families and the exponent of the cumulative histogram restricted to families belonging to a functional category is predicted to be equal to the exponent for the scaling of the functional category.
To generate this prediction, we have analyzed in detail the case of TFs, where the exponent of the population histogram is halved due to the quadratic scaling using mean field calculations and simulations, and verified that it holds in general by simulations of both model variants. Empirical data on TFs follow this behavior remarkably well, showing population cumulative histograms of TF superfamilies decaying with halved exponents compared to the global populations. The fatter tails of the TF histograms might also be related to the fact that only a few highly populated DNA-binding domain superfamilies dominate the population of TF DNA-binding domains and determine the scaling laws (Supplementary Data and Supplementary Figures S10 and S11). More in general, we have also compared the behavior of domain family population histograms for all the empirical functional categories with the prediction, obtaining results that are in good agreement (Figure 6), in particular for the highly populated categories, where the fitting procedure gives the highest confidence. The only highly populated category that significantly violates this general trend is small molecule binding, a category composed of very few highly populated domain families. This category is known to follow peculiar evolutionary laws, with high mobility of domains across the metabolic network, resulting in members of the same family being scattered across different pathways and producing lineage-specific domain families, with frequent re-invention of the same function by different families (20,21). Thus, the exception makes biological sense, and can be understood in terms of members of evolutionary classes ‘jumping’ to different functional categories with high rate during evolution.
Correlated and absolute recipes
The central ingredient of our main model (Model I) is the coupling between addition/removal of genes in different functional categories. From a biological standpoint, it is reasonable that gene repertoires of functional categories related to each other via shared tasks, pathways or processes should follow coordinated rules (8). In order to further justify this assumption, we probed directly the empirical domain data for correlation between number of domains in different functional categories,. To this end, for each genome g we calculated the deviation δnc(g) between the functional category size nc(g) and its average size in genomes of comparable size (see ‘Materials and Methods’ section). We then calculated the matrix of correlations between values of δnc for different functional categories c. The results are reported in Figure 7 and Supplementary Tables S3 and S4. We also tested that this procedure for evaluating the correlation was not dependent on genome size (Supplementary Figure S9.) The metabolism categories appear to be highly (anti-)correlated with each other, probably because of the role they play in different pathways of a common metabolic network (15). The observed correlations between metabolic families might also be relevant for reproducing the correct tail of the family-population histogram restricted to the metabolism category (Supplementary Figure S3).
An alternative approach is a description where the growth of each category is governed by intrinsic ‘evolutionary potentials’ (3). We have also analyzed such a description in some detail (see Supplementary Data and Supplementary Figure S3). Despite of minor differences, a model combining class-expansion/duplication/loss with uncorrelated moves for the functional categories, Model II, can also perform well in reproducing the joint scaling law and in predicting a relationship between the scaling exponents and the functional categories. In particular, this means that the latter result should not by itself be considered a piece of evidence in favor of a correlated recipe. Figure 8 illustrates the basic differences between the two descriptions. The evolutionary potentials approach generically requires a lower number of parameters, but suffers from the tedious technical problem that the values of the growth coefficients cannot be controlled directly, because of the scaling of the normalization constant with genome size (see Supplementary Data and Supplementary Figure S7). The correlated model is technically more under control, since its behavior does not rely on any unknown normalization constant. For this reason, it also performs better with functional categories that grow faster than linear with genome size, such as TFs. On the other hand, such a model can be formulated with very few parameters only when a synthetic description for the correlations, such as the toolbox model, is provided.
Figure 8.

Models with correlated versus absolute moves. Top: CRP acts on the homology families (colors) with a duplication and an innovation move. It is extended here to include functional categories (shapes) Middle: model with evolutionary potentials. Functional categories are assigned differential duplication rates as in ref (3). Bottom: model with correlated moves. Members of the functional categories are added proportionally between correlated pairs of functions (e.g. TFs and metabolic targets) as in ref. (15).
Here, we have considered mainly a model with three categories (TFs, metabolic and others) and one non-zero correlation between metabolic domains and TFs. In general, specific biological details of how categories are correlated with each other determine the scaling exponents relating their genome fractions to each other and genome size. Note that the task of formulating a correlated model for many categories requires a knowledge of how the different functional categories are ‘slaved’ to each other. This structure is largely unknown quantitatively, and can in principle define an arbitrarily complex network of interactions, since many categories may correlate with many others in potentially complicated ways. Should the importance of correlated recipes be confirmed by further analysis, it seems likely that the full formulation of such a description would still require to solve this problem. In order to show explicitly that the model can in principle be successfully extended to many categories (and still give scaling laws) we have analyzed the case of a simple hierarchical structure where many categories are slaved to a main one (see Supplementary Figure S8).
Overall, since functional categories scaling laws effectively emerge from the correlated approach, a good reconciliation of the two approaches could be to interpret the evolutionary potential model as an emergent description (which can be very useful in concrete empirical applications). In other words, evolutionary potentials would describe emergent effective growth of functional categories of a genome, averaging over more ‘microscopic’ evolutionary processes where addition of genes belonging to specific functional categories needs to comply to constraints combining different functions to perform specific cell tasks. These kind of interactions between functions are better described by correlated growth of functional categories. In this view, genome growth would be governed by a relative recipe, where the proportions are more important than the exact amounts, rather than an absolute recipe, where only the detailed amounts of each ingredient play a role.
SUPPLEMENTARY DATA
Supplementary Data are available at NAR Online.
FUNDING
Human Frontior Science Program Organization (Grant RGY0069/2009-C); Work at the Brookhaven National Laboratory was carried out under Contract (DE-AC02-98CH10886), Division of Material Science, US Department of Energy; DOE Systems Biology Knowledgebase project ‘Tools and Models for Integrating Multiple Cellular Networks’; National Science Foundation (Grant NSF PHY05-51164). Funding for open access charge: Human Frontier Science Program Organization (Grant RGY0069/2009-C).
Conflict of interest statement. None declared.
Supplementary Material
ACKNOWLEDGEMENT
S.M and M.C.L. would like to Eugene Koonin and Erik van Nimwegen for valuable discussions of our results at Kavli Institute for Theoretical Physics, University of California at Santa Barbara (KITP, UCSB) during the visit where part of this research has been accomplished.
REFERENCES
- 1.Huynen MA, van Nimwegen E. The frequency distribution of gene family sizes in complete genomes. Mol. Biol. Evol. 1998;15:583–589. doi: 10.1093/oxfordjournals.molbev.a025959. [DOI] [PubMed] [Google Scholar]
- 2.van Nimwegen E. Scaling laws in the functional content of genomes. Trends Genet. 2003;19:479–484. doi: 10.1016/S0168-9525(03)00203-8. [DOI] [PubMed] [Google Scholar]
- 3.Molina N, van Nimwegen E. The evolution of domain-content in bacterial genomes. Biol. Direct. 2008;3:51. doi: 10.1186/1745-6150-3-51. [DOI] [PMC free article] [PubMed] [Google Scholar]
- 4.Koonin EV, Wolf YI, Karev GP. The structure of the protein universe and genome evolution. Nature. 2002;420:218–232. doi: 10.1038/nature01256. [DOI] [PubMed] [Google Scholar]
- 5.Dokholyan NV, Shakhnovich B, Shakhnovich EI. Expanding protein universe and its origin from the biological Big Bang. Proc. Natl Acad. Sci. USA. 2002;99:14132–14136. doi: 10.1073/pnas.202497999. [DOI] [PMC free article] [PubMed] [Google Scholar]
- 6.Cosentino Lagomarsino M, Sellerio A, Heijning P, Bassetti B. Universal features in the genome-level evolution of protein domains. Genome Biol. 2009;10:R12. doi: 10.1186/gb-2009-10-1-r12. [DOI] [PMC free article] [PubMed] [Google Scholar]
- 7.Perez-Rueda E, Janga S, Martinez-Antonio A. Scaling relationship in the gene content of transcriptional machinery in bacteria. Mol. Biosyst. 2009;5:1494–1501. doi: 10.1039/b907384a. [DOI] [PubMed] [Google Scholar]
- 8.Koonin EV, Wolf YI. Genomics of bacteria and archaea: the emerging dynamic view of the prokaryotic world. Nucleic Acids Res. 2008;36:6688–6719. doi: 10.1093/nar/gkn668. [DOI] [PMC free article] [PubMed] [Google Scholar]
- 9.Treangen TJ, Rocha EPC. Horizontal transfer, not duplication, drives the expansion of protein families in prokaryotes. PLoS Genet. 2011:e1001284. doi: 10.1371/journal.pgen.1001284. [DOI] [PMC free article] [PubMed] [Google Scholar]
- 10.Karev GP, Wolf YI, Rzhetsky AY, Berezovskaya FS, Koonin EV. Birth and death of protein domains: a simple model of evolution explains power law behavior. BMC Evol. Biol. 2002;2:18. doi: 10.1186/1471-2148-2-18. [DOI] [PMC free article] [PubMed] [Google Scholar]
- 11.Qian J, Luscombe NM, Gerstein M. Protein family and fold occurrence in genomes: power-law behaviour and evolutionary model. J. Mol. Biol. 2001;313:673–681. doi: 10.1006/jmbi.2001.5079. [DOI] [PubMed] [Google Scholar]
- 12.Kamal M, Luscombe N, Qian J, Gerstein M. Analytical evolutionary model for protein fold occurrence in genomes, accounting for the effects of gene duplication, deletion, acquisition and selective pressure. In: Koonin E, Wolf Y, Karev G, editors. Power Laws, Scale-Free Networks and Genome Biology. New York: Spinger; 2006. pp. 165–193. [Google Scholar]
- 13.Durrett R, Schweinsberg J. Power laws for family sizes in a duplication model. Ann. Probab. 2005;33:2094–2126. [Google Scholar]
- 14.Angelini A, Amato A, Bianconi G, Bassetti B, Cosentino Lagomarsino M. Mean-field methods in evolutionary duplication-innovation-loss models for the genome-level repertoire of protein domains. Phys. Rev. E. 2010;81:021919. doi: 10.1103/PhysRevE.81.021919. [DOI] [PubMed] [Google Scholar]
- 15.Maslov S, Krishna S, Pang T, Sneppen K. Toolbox model of evolution of prokaryotic metabolic networks and their regulation. Proc. Natl Acad. Sci. USA. 2009;106:9743–9748. doi: 10.1073/pnas.0903206106. [DOI] [PMC free article] [PubMed] [Google Scholar]
- 16.Isambert H, Stein R. On the need for widespread horizontal gene transfers under genome size constraint. Biol. Direct. 2009;4:28. doi: 10.1186/1745-6150-4-28. [DOI] [PMC free article] [PubMed] [Google Scholar]
- 17.Bornberg-Bauer E, Beaussart F, Kummerfeld SK, Teichmann SA, Weiner J., 3rd The evolution of domain arrangements in proteins and interaction networks. Cell Mol. Life Sci. 2005;62:435–45. doi: 10.1007/s00018-004-4416-1. [DOI] [PubMed] [Google Scholar]
- 18.Wilson D, Madera M, Vogel C, Chothia C, Gough J. The SUPERFAMILY database in 2007: families and function. Nucleic Acids Res. 2007;35:D308–D313. doi: 10.1093/nar/gkl910. [DOI] [PMC free article] [PubMed] [Google Scholar]
- 19.Pitman J. Combinatorial Stochastic Process. Berlin: Notes for St. Flour Summer School. Springer; 2006. [Google Scholar]
- 20.Anantharaman V, Koonin EV, Aravind L. Regulatory potential, phyletic distribution and evolution of ancient, intracellular small-molecule-binding domains. J. Mol. Biol. 2001;307:1271–1292. doi: 10.1006/jmbi.2001.4508. [DOI] [PubMed] [Google Scholar]
- 21.Chothia C, Gough J, Vogel C, Teichmann SA. Evolution of the protein repertoire. Science. 2003;300:1701–1703. doi: 10.1126/science.1085371. [DOI] [PubMed] [Google Scholar]
- 22.Charoensawan V, Wilson D, Teichmann SA. Genomic repertoires of DNA-binding transcription factors across the tree of life. Nucleic Acids Res. 2010;31:7364–7377. doi: 10.1093/nar/gkq617. [DOI] [PMC free article] [PubMed] [Google Scholar]
Associated Data
This section collects any data citations, data availability statements, or supplementary materials included in this article.