Double deletion of actin-binding proteins cortexillin I and II alters the actin cytoskeleton (bundled actin filaments accumulate in the cell cortex) of Dictyostelium, substantially inhibits all molecular responses to extracellular cAMP, and completely blocks cell streaming and development of cells into mature fruiting bodies.
Abstract
Starvation induces Dictyostelium amoebae to secrete cAMP, toward which other amoebae stream, forming multicellular mounds that differentiate and develop into fruiting bodies containing spores. We find that the double deletion of cortexillin (ctx) I and II alters the actin cytoskeleton and substantially inhibits all molecular responses to extracellular cAMP. Synthesis of cAMP receptor and adenylyl cyclase A (ACA) is inhibited, and activation of ACA, RasC, and RasG, phosphorylation of extracellular signal regulated kinase 2, activation of TORC2, and stimulation of actin polymerization and myosin assembly are greatly reduced. As a consequence, cell streaming and development are completely blocked. Expression of ACA–yellow fluorescent protein in the ctxI/ctxII–null cells significantly rescues the wild-type phenotype, indicating that the primary chemotaxis and development defect is the inhibition of ACA synthesis and cAMP production. These results demonstrate the critical importance of a properly organized actin cytoskeleton for cAMP-signaling pathways, chemotaxis, and development in Dictyostelium.
INTRODUCTION
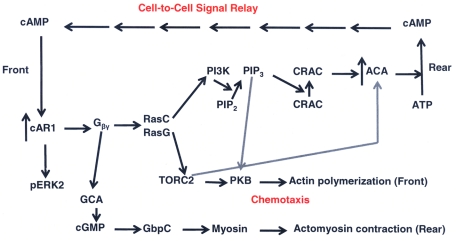
For a number of reasons, including ease of cell culture, genetic manipulation, and experimental design, the social amoeba Dictyostelium discoideum has long been a model system for investigating the morphological and molecular events of chemotaxis and development. Starvation of Dictyostelium initiates a ∼24-h developmental process that begins with the pulsed secretion of cAMP by a fraction of the amoebae, toward which neighboring amoebae chemotax (Chisholm and Firtel, 2004). Interaction of the secreted cAMP with the G protein–coupled cAMP receptor 1 (cAR1) on the plasma membranes of neighboring cells initiates a series of molecular and morphological events (Swaney et al., 2010), including enhanced expression of cAR1 and adenylyl cyclase A (ACA; Figure 1, ↑cAR1, ↑ACA), cell elongation and polarization (Johnson et al., 1992; Pitt et al., 1992; Insall et al., 1994), and chemotaxis. Release of Gβγ from the heterotrimeric G- protein coupled to cAR1 activates myosin II, mediated by guanylyl cyclase A (GCA) and cGMP; Bosgraff et al., 2002; Figure 1). Gβγ also activates two synergistic and partially redundant RasC- and RasG-signaling pathways (Lim et al., 2001; Kae et al., 2004; Sasaki et al., 2004; Bolourani et al., 2006). One pathway activates target of rapamycin complex 2 (TORC2) and protein kinase B (PKB), initiating polymerization of actin at the front of the cell (Cai et al., 2010; Figure 1), which, together with contraction of actomyosin II at the rear, supports chemotaxis toward the aggregation centers (Kimmel and Parent, 2003).
FIGURE 1:
Schematic depiction of cAMP signaling pathways in D. discoideum. cAMP binding to G protein–coupled cAR1 increases the expression of cAR1 and ACA and the release of Gβγ, which activate RasC and RasG pathways. Activation of PI3K leads to phosphorylation of PIP2, and PIP3 brings CRAC to the plasma membrane, activating ACA, which converts ATP to cAMP, which is secreted at the rear and binds to cAR1 of neighboring cells. Activation of TORC2 activates PKB, which initiates actin polymerization at the front of the cell. TORC2 also contributes to the activation of ACA, and PIP3 contributes to PKB activation. Gβγ also activates GCA, which synthesizes cGMP, which, acting through GbpC, contributes to myosin activation and actomyosin contraction at the rear of the cell. cAMP-bound cAR1 also phosphorylates and activates ERK2, which contributes to ACA activation. Not all of the intermediates in these pathways are shown.
A second Ras pathway activates phosphatidylinositol 3-kinase (PI3K) at the cell's leading edge, which catalyzes the conversion of phosphatidylinositol 4,5-bisphosphate (PIP2) to phosphatidylinositol 3,4,5-trisphosphate (PIP3), to which cytoplasmic regulator of adenylyl cyclase (CRAC) binds and activates membrane-associated ACA (Comer et al., 2005; Figure 1). PIP3 also contributes to the TORC2 pathway, which induces actin polymerization (Tang et al., 2011; Figure 1). TORC2 contributes to activation of ACA (Lee et al., 2005; Figure 1), and, independent of Gβγ, binding of cAMP to cAR1 leads to phosphorylation and activation of extracellular signal regulated kinase 2 (ERK2), which increases cAMP concentration (Segall et al., 1995) by inhibiting its hydrolysis by a phosphodiesterase (Maeda et al., 2004). ACA-containing vesicles translocate to the rear of chemotaxing cells (Kriebel et al., 2008), where secretion of cAMP creates a cell-to-cell cAMP signal relay (Kimmel and Parent, 2003; Figure 1), resulting in head-to-tail streams of cells that aggregate into tight mounds of 100,000 or more cells in ∼12 h. Over the next 12 h, the multicellular mounds differentiate through several morphological stages, developing into mature fruiting bodies comprising a spore head supported by a stalk. In an appropriate nutritional environment, spores germinate into amoebae, and the life cycle begins anew.
Recently we made the serendipitous observation that ectopic expression of Y53A-actin inhibits cell steaming during cAMP-induced aggregation (although individual cells chemotax normally) and blocks development beyond the mound stage (Liu et al., 2010; Shu et al., 2010). The developmental phenotype of Y53A-actin cells correlates with an inhibition of intracellular and intercellular cAMP-signaling pathways (Shu et al., 2010), including the trafficking of ACA vesicles to, and secretion of cAMP at, the rear of chemotaxing cells. It is highly likely that the underlying cause of these phenomena is the disorganized actin cytoskeleton of amoebae expressing Y53A-actin. Whereas wild-type-cell cytoskeletons comprise a mostly homogeneous array of filaments, cytoskeletons of Y53A-actin cells contain many shorter filaments and numerous bundles and aggregates of short and long filaments (Shu et al., 2010), similar to the structures formed by copolymerization of Y53A-actin and WT actin in vitro (Liu et al., 2010).
Of interest, a developmental phenotype similar to that of Dictyostelium amoebae expressing Y53A-actin, that is, inhibition of both aggregation streams and development of mounds to mature fruiting bodies, had been described for Polysphondylium (a close relative of Dictyostelium) upon deletion of the actin cross-linking protein cortexillin I (Fey and Cox, 1999). The molecular events underlying this phenotype and a similar phenotype of Dictyostelium lacking both α-actinin and filamin (gelation factor, ABP-120), two other actin cross-linking proteins (Rivero et al., 1996), were not explored, as we now do for Dictyostelium cortexillin (ctx)-null cells.
Dictyostelium ctxI and ctxII—444 and 441 amino acids, respectively—are parallel dimers with a coiled-coil domain and two globular heads that contain actin-binding sites (Faix et al., 1996). Cortexillin I also has a putative PIP2-binding site at its C-terminus (Faix et al., 1996) and a second, and stronger, actin-bundling domain in the C-terminal region that is inhibited by PIP2 (Stock et al., 1999). Of importance, ctxI and ctxII occur in quaternary complexes with Rac1 and either one of the Dictyostelium IQGAP proteins DGAP1 and GAPA (Faix et al., 2001; Lee et al., 2010; Mondal et al., 2010). Both cortexillins accumulate in the cortex of vegetative cells and the cortical region of spreading cells (Faix et al., 1996), where, together with myosin II, they bundle and cross-link actin filaments in an antiparallel manner (Schroth-Diez et al., 2009). In motile cells, both cortexillins are enriched at the leading edge and, to a lesser extent, at the rear (Faix et al., 1996). Cortexillins also localize to the cleavage furrow of dividing cells (Faix et al., 1996), independent of myosin II (Weber et al., 1999), where, together with myosin II, they increase cleavage furrow stiffness (Girard et al., 2004; Reichl et al., 2008).
Here we report that both head-to-tail cell streaming of Dictyostelium amoebae into multicellular mounds and development of the mounds to mature fruiting bodies are partially inhibited in ctxA− and ctxB− cells (ctxA and ctxB are the genes coding for proteins ctxI and ctxII, respectively) and completely inhibited in ctxA−/B− cells, as they are in cells expressing Y53A-actin. We found that intracellular and extracellular cAMP signaling is also impaired in cortexillin-null cells but in a different way than in Y53A-actin cells. In particular, expression of both cAR1 and ACA are severely diminished in ctxA−/B− cells but not in Y53A cells, and translocation of ACA-containing vesicles to the rear of chemotaxing cells is not impaired in ctxA−/B− cells but is in Y53A cells. Expression of ACA-yellow fluorescent protein (YFP), but not expression of cAR1-YFP, in ctxA−/B− cells significantly rescues the phenotype of WT cells. Thus, whereas impairment of cell streaming and development of Y53A-actin cells may be caused primarily by inhibition of ACA vesicle translocation to, and secretion of cAMP at, the rear of the cell (Shu et al., 2010), inhibition of cell streaming and development of ctxA−/B− cells probably result principally from decreased secretion of cAMP due to inhibition of ACA synthesis. The phenotypes of Y53A cells and ctxA−/B− cells demonstrate the critical importance of a properly organized actin cytoskeleton for cAMP-induced signaling pathways.
RESULTS
First, we confirmed by Western blots that ctxA− cells expressed ctxII and not ctxI, that ctxB− cells expressed ctxI and not ctxII, and that ctxA−/B− cells expressed neither ctxI nor ctxII (Supplemental Figure S1A). Furthermore, we observed that ctxI and ctxII were enriched in the cortex of vegetative ctxB− and ctxA− cells, respectively, with actin at the front of motile amoebae and with myosin II in the cleavage furrow of dividing cells (Supplemental Figure S1, D and E), as were both cortexillins in WT cells (Supplemental Figure S1, B and C; Faix et al., 1996; Weber et al., 1999).
Morphological and developmental phenotype of cortexillin-null cells
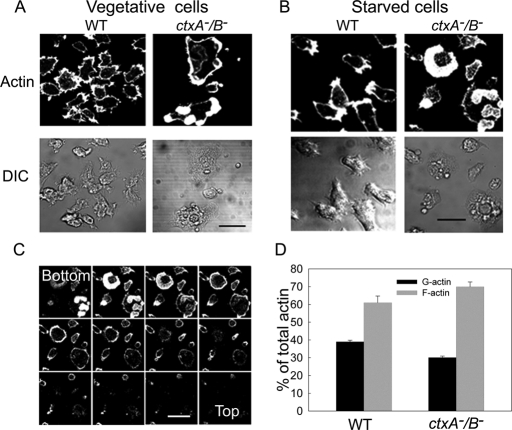
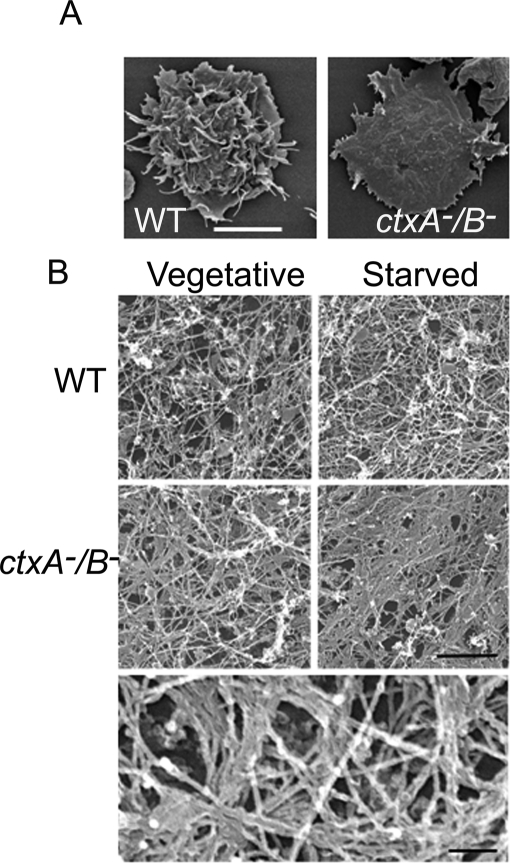
The F-actin in ctxA−/B− cells, as revealed by rhodamine–phalloidin staining of both vegetative and starved polarized fixed cells, forms a thick ring around the cell cortex and patches (Figures 2, A and B) at the bottom of the cell (Figure 2C). As seen most clearly by scanning electron microscopy, a typical ctxA−/B− cell (Figure 3A) and, to a lesser extent, ctxA− and ctxB− cells (data not shown) is flatter than a typical WT cell, with fewer filopodia and many short spikes protruding from the periphery. Electron microscopy of the extracted cytoskeleton shows that the cortical actin rings and patches contain many bundles of actin filaments, whereas WT cells have a relatively homogeneous array of single filaments (Figure 3B), and there is more Triton-insoluble F-actin in the ctxA−/B− cells than in WT cells (Figure 2D).
FIGURE 2:
Confocal microscopic images of rhodamine-phalloidin–stained F-actin. F-Actin (top) and differential interference contrast images (bottom) of vegetative (A) and starved (B) WT and ctxA−/B− cells. (C) Confocal slices of fixed cells stained with rhodamine–phalloidin show that the thick cortical ring and patches of F-actin are closer to the bottom. Slice interval, 0.5 μm. Scale bars, 10 μm. (D) Comparison of F- and G-actin in WT and ctxA−/B− cells. Cells were lysed in the presence of 0.6% Triton and centrifuged. The total actin was from samples before centrifugation, and F-actin and G-actin are from pellets and supernatants after centrifugation, respectively, analyzed by SDS–PAGE and quantified by LI-COR Odyssey infrared imaging software.
FIGURE 3:
Effects of cortexillin I and II double knockout on cell shape and the actin cytoskeleton. (A) Scanning electron micrographs of vegetative WT and ctxA−/B− cells. Cells were prepared and observed as described in Materials and Methods. Whereas WT cells have a ruffled surface and long filopodia, ctxA−/B− cells have a flat surface and many short spikes at the periphery. Scale bar, 10 μm. (B) Representative transmission electron micrographs showing the actin cytoskeleton organization of vegetative and polarized WT and ctxA−/B− cells that were prepared as described in Materials and Methods. The cytoskeletons of WT cells consist of a largely homogeneous array of actin filaments (top), whereas the cytoskeletons of ctxA−/B− cells contain many bundled actin filament (middle); scale bar, 500 nm. Bottom, enlargement of the vegetative ctxA−/B− cell image showing the F-actin bundles at higher magnification. Scale bar, 100 nm.
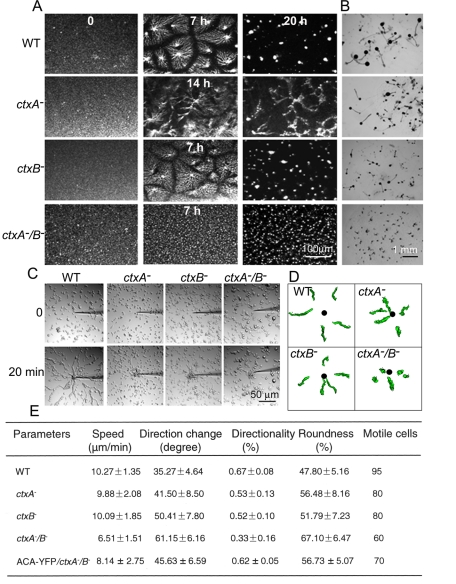
As summarized in the Introduction, upon starvation Dictyostelium amoebae chemotax in streams, forming mounds that continue to develop into mature fruiting bodies. Mound formation is most easily visualized by placing cells in nonnutrient buffer in a Petri dish (Figure 4A and Supplemental Movies S1–S4). Under these conditions, WT cells formed streams by 6–7 h and mounds by 20 h. Streaming of ctxA− cells was delayed, with streams forming at ∼14 h, and the streams broke up to form mounds that were smaller than mounds of WT cells. ctxB− cells formed slightly defective streams by 6–7 h and mounds that were not very different from WT mounds. ctxA−/B− cells, however, never formed discernible streams and formed many more and much smaller mounds than WT cells. When a similar experiment was performed with cells washed and placed on agar in developmental buffer (see Materials and Methods), WT cells developed fully to mature fruiting bodies (Figure 4B); ctxA− and ctxB− cells formed fewer and somewhat smaller fruiting bodies, and ctxA−/B−cells developed only slightly beyond the mound stage, forming very small projections but no fruiting bodies (Figure 4B). In agreement with previous reports (Rivero et al., 1996; Pikzack et al., 2005), single deletion of actin cross-linking proteins fimbrin (Fim− cells), α-actinin (abpA− cells), or filamin (abpC− cells) had no significant effect on cell streaming or development to mature fruiting bodies (Supplemental Figure S2), but the double knockout of α-actinin and filamin (AGHR2 cells; Rivero et al., 1996) prevented stable streams and blocked development (Supplemental Figure S2).
FIGURE 4:
Inhibition of cAMP-induced cell streaming and development in cortexillin-null cells. (A) cAMP-induced self-streaming assay. Cells were prepared and observed as described in Materials and Methods. Cell streaming and aggregation were recorded for up to 24 h by a video camera (see Supplemental Movies S1–S4). WT and ctxB− cells formed streams in 6–7 h and tight mounds in 20 h, whereas streaming of ctxA− cells was delayed until 14 h and formed only loose mounds in 20 h. ctxA−/B− cells never streamed, had no apparent chemotaxis center, and formed many very small mounds. (B) Development of ctxA−/B− cells is completely blocked. Cells were placed on Petri dishes containing 1.5% agarose in starvation buffer. WT, ctxA−, and ctxB− cells developed similar to mature fruiting bodies in 24 h. However, ctxA−B− cells developed just a little beyond the mound stage, forming short projections, and did not develop to fruiting bodies even after 72 h. (C) Cortexillins inhibit individual cell streaming. Cells were prepared and observed as described in Materials and Methods. Cells were imaged every 10 s for ∼20 min (see Supplemental Movies S5–S8). WT cells formed chemotaxing streams at the source of cAMP, whereas ctxA−, ctxB−, and ctxA−/B− cells migrated individually (no streams) and aggregated at the micropipette. (D) Cell shape and path analysis of WT and cortexillin-knockout cells by stacked images obtained by DIAS software. Black dots indicate the positions of the micropipette. (E) Quantification of chemotaxis behavior. Individual cells were traced and quantification of chemotaxing parameters processed with DIAS software. Measurements were made on at least 15 cells of each cell line from three independent experiments. The data represent mean ± SD (standard errors).
The inability of ctxA− and ctxB− cells to form stable streams and the inability of ctxA−/B− cells to form any streams at all are best illustrated by observing chemotaxis of aggregation-competent cells toward a micropipette containing 10 μM cAMP (Figure 4C and Supplemental Movies S5–S8). The motility of individual cells was not as severely affected in the ctx− cells as was streaming (Figure 4, A, C, and D). The speed of ctxA− and ctxB−cells was the same as that of WT cells, and ctxA−/B− cells were ∼30% slower (Figure 4E). Similarly, the directional change, directionality, and roundness of ctxA− and ctxB− cells were not very different from those of WT cells, but ctxA−/B− cells had about twice the directional change and half the directionality and were rounder than WT cells (Figure 4E). It should be noted that although all of the cells in these experiments were alive, only 80% of ctxA− and ctxB− cells and 60% of ctxA−/B− cells were motile, compared with 95% of WT cells. However, the concentration of motile cells always exceeded the minimum number required for WT cells to form streams (McCann et al., 2010).
Some of our results are similar to the results of Lee et al. (2010), but others are not. The two laboratories agree that individually chemotaxing ctxA−/B− cells show more directional change and less directionality than WT cells. Lee et al. (2010) found the speed of WT cells and double-knockout cells to be the same, but we find that ctxA−/B− cells move significantly more slowly than WT cells. We find that ctxA−/B− cells are rounder than WT cells; Lee et al. (2010) reported no difference in cell shape. Lee et al. (2010) reported no difference in Ras or PKB activation; we find (using a different assay for the latter) that activation of RasC, RasG, and PKB is substantially reduced in ctxA−/B− cells compared with WT cells. The different results from the two laboratories might be due to the different assays used and/or differences in the parental cell strains. Cha and Jeon (2011) also observed that ctxA−/B− cells are flatter and rounder and chemotax more slowly than WT cells and that aggregation is inhibited and development does not proceed to completion in ctxA−/B− cells.
Biochemical phenotype of cortexillin-null cells
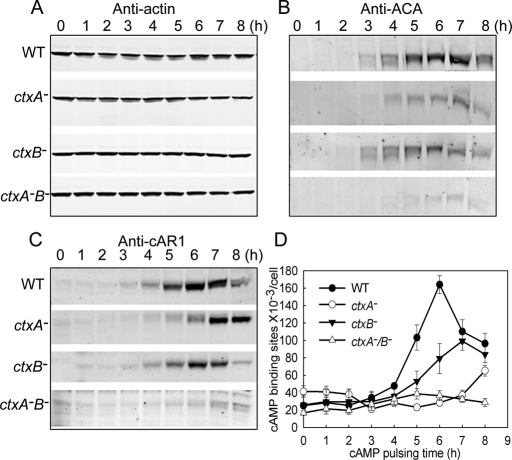
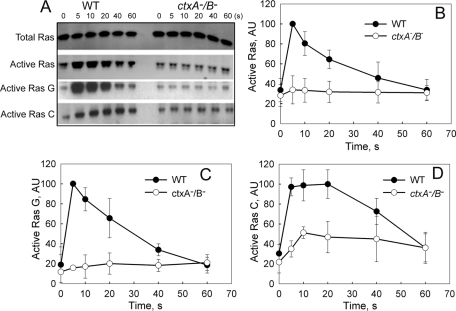
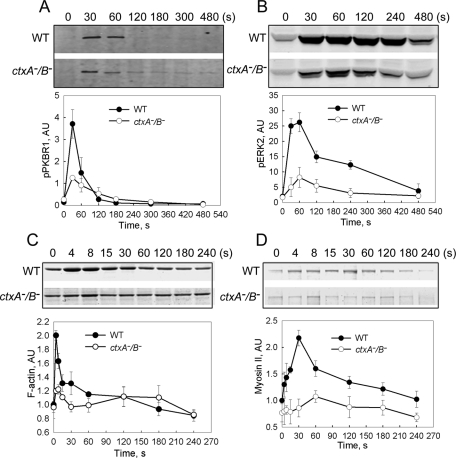
As summarized in the Introduction and schematically in Figure 1, one of the first things to happen when starved cells are pulsed with cAMP is an increase in expression of both cAR1 and ACA. We found that the increased expression of ACA-, cAR1-, and cAMP-binding sites on the cell surface was delayed and/or significantly inhibited in ctxA− and ctxB− cells and almost completely blocked in ctxA−/B− cells (Figure 5, B–D), whereas actin concentration was unaffected (Figure 5A). Normally, the interaction of cAMP with G protein–coupled cAR1 in WT cells leads to a sequence of events beginning with the release of Gβγ and the activation of RasG and RasC (Figure 1). As a consequence of either the reduced level of cAR1 or other effects of the abnormal actin cytoskeleton, activation of both RasG and RasC was substantially inhibited in ctxA−/B− cells (Figure 6), as was activation of TORC2, as measured by phosphorylation of PKBR1 (Figure 7A), phosphorylation of ERK2 (Figure 7B), and the “instant” actin polymerization (Figure 7C) and assembly of the actomyosin complex (Figure 7D) that normally follow a pulse of cAMP.
FIGURE 5:
Cortexillin-null cells have delayed and diminished expression of cAR1 and ACA. Suspensions of WT and cortexillin-null cells in starvation buffer were pulsed with cAMP every 6 min for 8 h and aliquots taken every hour for protein analysis by Western blots: In WT cells, cAMP induced expression of both ACA (B) and cAR1 (C) with peaks at 6-7 h. ctxA− and ctxB− cells had delayed and reduced expression of ACA and cAR1, and ctxA−/B− cells had almost no expression of either ACA or cAR1. The apparent doublets in the blots with anti-ACA are due to impurities in the polyclonal antibody. Actin expression was unaffected in the cortexillin-null cells (A). (D) Increase of cAMP-binding sites during cAMP pulsing of WT and cortexillin-null cells. Cell surface binding of [3H]cAMP to cell-surface receptors was determined as described under Materials and Methods. Cortexillin-null cells had a delayed and greatly reduced increase in cAMP-binding compared with WT cells. Data are representative of three independent experiments.
FIGURE 6:
Inhibition of cAMP-activation of Ras in ctxA−/B− cells. (A) cAMP activation of RasC and G. Aggregation-competent WT and ctxA−/B− cells were stimulated with 200 nM cAMP, and aliquots were taken for lysis at the indicated times. Total Ras in the lysate was determined by Western blots with anti–pan Ras (first row). Total active Ras was pulled down by RBD-Byr2 beads, and total active Ras (second row and B), active RasG (third row and C), and active RasC (fourth row and D) were determined by Western blots with anti–pan Ras, anti-RasG, and anti-RasC, respectively. Quantifications of Ras activation in the line graphs show the average of separate experiments normalized to 100 for WT cells.
FIGURE 7:
Inhibition of cAMP activation of TORC2 and ERK2 in ctxA−/B− cells. (A) The time course of increase in TORC2 activation and (B) ERK2 phosphorylation in aggregation-competent cells stimulated with cAMP were determined by Western blots of samples taken at the indicated times. TORC2 activation was indirectly detected by measuring phosphorylated PKBR1, and phosphorylated ERK2 was determined by anti-pERK2. (C) Instant actin polymerization and (D) myosin II assembly were determined by SDS–PAGE of the Triton-insoluble cytoskeleton fraction at the indicated times. All quantitative data represent the mean ±SD of at least three independent experiments. AU, arbitrary units.
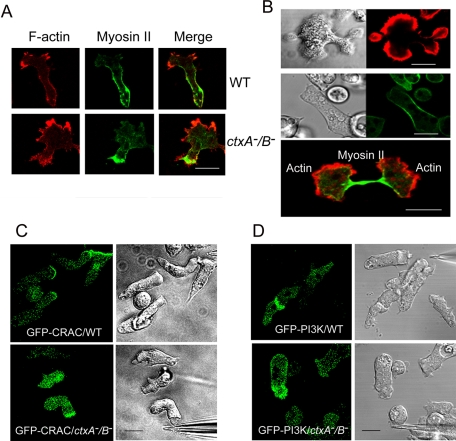
Although, as shown in Figures 2 and 3, the structure of the actin cytoskeleton was altered in ctxA−/B− cells, actin still localized properly at the leading edge and myosin II at the rear of motile cells (Figure 8A). In cortexillin double-mutant cells, cytokinesis is severely impaired. About 40% of the ctxA−/B− cells were unable to complete cytokinesis, and, therefore, these cells were of many sizes and often multinucleate (Figures 2A and 8B). However, myosin II accumulated at the contractile ring and cleavage furrow of ctxA−/B− cells undergoing normal cytokinesis and actin localized at the polar regions of dividing cells (Figure 8B and Supplemental Movie S9). Similarly, both CRAC and PI3K localized at the front of motile ctxA−/B− cells, as they do in WT cells (Figure 8, C and D). Thus, despite the substantial reduction in the intracellular cAMP signaling pathways, the ctxA−/B− cells remained capable of polarizing and chemotaxing toward cAMP, albeit less efficiently than WT cells. The inability of ctxA−/B− cells to form head-to-tail streams, whereas individual cells chemotax relatively normally, is indicative of a defect in the cell-to-cell cAMP signal relay. This defect could be due to either or both too little cAMP secretion by the “leading” cell or a lack of sensitivity in the response of cAR1 receptors of “following” cells. The latter seems less likely, as ctxA−/B− cells chemotax equally well in response to 0.5 and 10 μM cAMP in the micropipette assay (Figure 4E and Supplemental Figure S3A), although they lack the force to chemotax through agar (Supplemental Figure S3B). To investigate these possibilities further, we expressed cAR1-YFP and ACA-YFP in ctxA−/B− cells.
FIGURE 8:
Localization of proteins in chemotaxing and dividing cortexillin-null cells. (A) Expressed GFP-myosin II and rhodamine-phalloidin–stained F-actin localize to the rear and front of chemotaxing ctxA−/B− cells as in WT cells. (B) Rhodamine-phalloidin–stained F-actin illustrates the asymmetric division typical of many ctxA−B− cells (top). Live imaging of GFP-myosin II expressed in ctxA−/B− cells showing myosin II accumulates at the contractile ring in normal cytokinesis (middle; also see Supplemental Movie S9). F-Actin localizes in the two polar regions, and expressed GFP-myosin II concentrates at the cleavage furrow in ctxA−/B− cells preceding cytokinesis completion (bottom). (C) Expressed GFP-CRAC and (D) expressed GFP-PI3K move to the front of WT and ctxA−/B− cells, chemotaxing toward a cAMP-filled micropipette. Images recorded by time-lapse confocal microcopy. Scale bars, 5 μm.
Expression of cAR1-YFP or ACA-YFP in ctxA−/B− cells
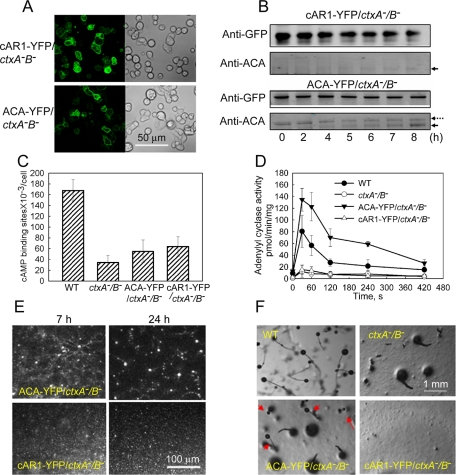
cAR1-YFP and ACA-YFP were expressed in ∼60% of the ctxA−/B− cells (Figure 9A), although to various levels in different cells, but, as might be expected, the level of expression of the ectopically expressed proteins did not change when cells were pulsed for 8 h with 75 nM cAMP (Figure 9B, anti–GFP antibody and upper band with anti–ACA antibody), but endogenous ACA did increase (Figure 9B, lower band with anti–ACA antibody). However, there was no increase in endogenous cAR1 during cAMP pulsing (data not shown). cAMP-pulsed cAR1-YFP/ctxA−/B− cells and ACA-YFP/ctxA−/B− cells did bind somewhat more cAMP than nontransfected ctxA−/B−-cells although substantially less than WT cells (Figure 9C). On the other hand, ACA-YFP/ctxA−/B− cells had substantially higher ACA activity than WT cells when stimulated with cAMP, whereas cAR1-YFP/ctxA−/B− cells had the same low activity as ctxA−/B− cells (Figure 9D). Thus, expressed cAR1-YFP found its way to the cell surface, and expressed cAR1-YFP and ACA-YFP were functional in their respective assays.
FIGURE 9:
Expression of ACA-YFP in ctxA−/B− cells, but not cAR1-YFP, significantly rescues WT phenotype. About 60% of ctxA−/B− cells expressed cAR1-YFP and ACA-YFP as viewed by confocal microscopy (A). Western blot analysis with anti-GFP antibody confirmed that both proteins were expressed in ctxA−/B− cells (B, top). Expression of ACA-YFP in ctxA−/B− cells increased the expression of endogenous ACA during cAMP pulsing (the solid arrows indicate endogenous ACA, and the dotted arrow indicates ACA-YFP), but expression of cAR1-YFP did not, as detected by anti-ACA antibody (B, bottom). (C) cAMP binding to the cell surface was slightly increased by expression of cAR1-YFP and ACA-YFP in ctxA−/B− cells but was still much less than in WT cells. (D) Adenylyl cyclase A activity was dramatically increased in ACA-YFP/ctxA−/B− cells but not in cAR1-YFP/ctxA−/B− cells. ACA activities were assayed in cells that had been pulsed with cAMP for 7 h, the peak of ACA expression (Figure 5B). (E) ACA-YFP expression in ctxA−/B− cells significantly rescued self-streaming and formation of normal-size mounds but expression of cAR1-YFP did not (see 24-h Supplemental Movies S10 and S11). (F) Development was partially rescued in ACA-YFP/ctxA−B− cells with some complete, although small, fruiting bodies with stem and spore heads (arrows). Development of cAR1-YFP/ctxA−B− cells was not rescued.
In the developmental assays, expression of ACA-YFP substantially rescued the ctxA−/B− cells. ACA-YFP/ctxA−/B− cells formed streams and normal-size mounds (Supplemental Movie S10) and some small complete fruiting bodies (Figure 9, E and F). The fact that 40% of the ctxA−/B− cells did not express ACA-YFP (Figure 9A) may have limited the number and size of the fruiting bodies in the ACA-YFP/ctxA−/B− cells. On the other hand, cAR1-YFP/ctxA−/B− cells were indistinguishable from ctxA−/B− cells, forming neither streams nor fruiting bodies and very small mounds (Figure 9, E and F, and Supplemental Movie S11).
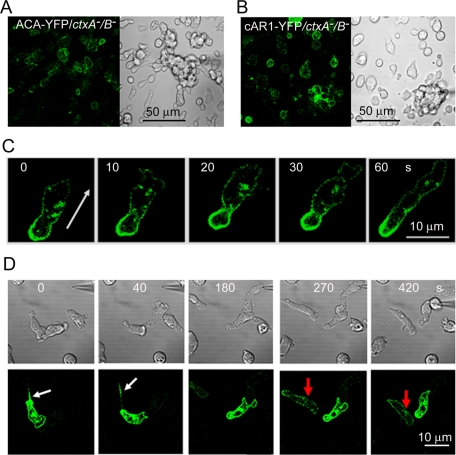
Expression of ACA-YFP also largely rescued the chemotactic behavior (speed, persistence, and shape) of ctxA−/B− cells in the micropipette assay (Figure 4E). In addition, ACA-YFP/ctxA−/B− cells formed short streams in the micropipette assay; at least five cells were able to form streams before cells not expressing ACA-YFP interrupted the stream (Figure 10A and Supplemental Movie S12), but cAR1-YFP/ctxA−/B− cells did not form streams (Figure 10B and Supplemental Movie S13). As expected from these results, vesicles containing ACA-YFP accumulated at the rear of chemotaxing ACA-YFP/ctxA−/B− cells (Figure 10C) and were released into the medium from ctxB− cells expressing ACA-YFP (Figure 10D and Supplemental Movie S14); the level of expression of ACA-YFP in ctxA−/B− cells was too low to detect individual, secreted vesicles. These results support the interpretation that the inability of ctxA−/B− cells to form streams and mounds that develop into mature fruiting bodies is due primarily to their low level of expression of ACA being insufficient to support the cAMP relay signal.
FIGURE 10:
Localization of ACA in chemotaxing ctxA−/B− cells. Micropipette assay of ACA-YFP/ctxA−/B− cells (A) and cAR1-YFP/ctxA−/B− cells (B). ACA-YFP/ctxA−/B− cells form short streams (see Supplemental Movie S12), whereas cAR1-YFP/ctxA−B− cells show only individual, less-polarized cells migrating to the micropipette (see Supplemental Movie S13). (C) ACA-YFP localized at the rear of motile ACA-YFP/ctxA−/B− cells (live images recorded by time-lapse confocal microscopy). The arrow indicates the direction of cell movement. (D) ACA-YFP expressed in chemotaxing ctxB− cells (cAMP micropipette assay) translocated to the rear, where ACA-containing vesicles were released, forming a trail (white arrows) that attracted a nearby cell (red arrows and Supplemental Movie S14). Similar trails of ACA-containing vesicles were observed in three other cells in which the expression of ACA-YFP was sufficiently high to detect the vesicles.
DISCUSSION
We showed that deletion of both cortexillin I and II completely blocks streaming of Dictyostelium amoebae, whereas chemotaxis of individual cells is much less affected. The inhibition of streaming results in formation of smaller mounds that do not develop further. The single deletion of either cortexillin I or II has similar but less extensive consequences. In the double-knockout cells, the normal responses to cAMP at the molecular level, namely increased expression of cAR1 and ACA, binding of external cAMP to the cell surface, activation of ACA activity, activation of RasC and RasG, phosphorylation of ERK2, activation of TORC2, and stimulation of actin polymerization and myosin II assembly, are all greatly diminished. Ectopic expression of cAR1 increases binding of cAMP but not to the level of WT cells and does not rescue cell streaming or development (possibly the YFP tag on the cytosolic side of cAR1 interferes with function), whereas ectopic expression of ACA increases cAMP-activated ACA activity beyond the level of WT cells and significantly rescues streaming and development.
Our results raise a number of interesting questions that are beyond the scope of this article. Does the inhibition of cAMP stimulation of cAR1 and ACA synthesis result from inhibition of transcription or translation? It seems counterintuitive that the double knockout of two actin cross-linking proteins should result in increased bundling of actin filaments. Does this relate to the proposal (Ren et al., 2009; Lee et al. 2010) that myosin II pulling on actin filaments is resisted by cross-linkers, in this case cortexillin? In the absence of cortexillins does myosin II pull the actin filaments together? Does the increased F-actin in ctx-null cells contribute to the increased filament bundling?
It is not unusual that pairs of actin cross-linkers must be deleted to obtain a morphological phenotype—for example, α-actinin and fascin in fibroblasts (Tseng et al., 2005) and α-actinin and gelation factor (filamin) in Dictyostelium (Rivero et al., 1996). Indeed, we do not know whether other permutations and combinations of the multiple Dictyostelium actin-binding proteins might have similar effects. However, why are the cortexillins, which are so similar in sequence, structure, and properties, not redundant? Does it relate to the fact that cortexillin I, but not cortexillin II, has both a putative PIP2-binding site at its C-terminus (Faix et al., 1996) and a dominant actin-bundling domain in the C-terminal region that is inhibited by PIP2 (Stock et al., 1999)? Is this why ctxA− cells have a stronger phenotype than ctxB− cells?
There is some evidence that ctxI and ctxII exist as heterodimers in vivo (Faix et al., 2001) and the existence of quaternary complexes containing Rac1, equal amounts of ctxI and ctxII, and either DGAP1 or GAPA (Lee et al., 2010) is consistent with, but does not prove, this idea. However, ctxII (presumably as a homodimer) has been shown to interact with DGAP1 (Faix et al., 2001), and our data showing that neither ctxA− cells or ctxB− cells are as severely impaired as ctxA−/B− cells are consistent with both cortexillins being able to function as homodimers complexed with either or both IQGAP proteins. The colocalization of DGAP1 and GAPA with the cortexillins and the similar defects in cytokinesis of IQGAP-null cells and cortexillin-null cells (Faix et al., 2001) are consistent with the quaternary complex of active Rac1, ctxI, and ctxII and either one of the two IQGAP proteins being the functional agent for cytokinesis. It remains to be seen whether this is also true for the requirement for cortexillins for functioning cAMP-signaling pathways.
In conclusion, the results in this and our previous article (Shu et al., 2010) demonstrate the critical importance of the proper organization of the actin cytoskeleton for intracellular and extracellular cAMP signaling during chemotaxis and development of Dictyostelium, which has long proved to be a useful model system for similar events in mammalian cells. Inhibition of the translocation of ACA-containing vesicles along microtubules in cells expressing Y53A-actin reported previously (Shu et al. 2010) might be explained simply by physical obstruction of vesicle movement by the disrupted actin cytoskeleton. However, the inhibition of all of the molecular events subsequent to binding of cAMP to the cell surface receptors of ctxA−/B− cells, including expression of cAR1 and ACA, and activation of Ras pathways that lead to actin polymerization and activation of ACA suggest the presence of a mechanosensing component in intracellular and extracellular cAMP signaling events.
MATERIALS AND METHHODS
Cell lines, culture, transformation, and differentiation
Dictyostelium wild-type strain AX2, ctxA− cells, ctxB− cells, and ctxA−B− cells (Faix et al., 1996) were grown in Petri dishes at 21°C in liquid HL5 medium (LG0101; Formedium, Hunstanton, United Kingdom) containing 60 μg/ml each of penicillin and streptomycin. Expression plasmids green fluorescent protein (GFP)–myosin II (Moores et al., 1996), GFP-PI3K, GFP-CRAC (Parent et al., 1998; Huang et al., 2003), cAR1-YFP, and ACA-YFP (Kriebel et al., 2008) were introduced into ctxA−/B− or ctxB− cells using a gene pulser electroporator (Bio-Rad, Hercules, CA; Egelhoff et al., 1991). Cells transformed with cDNAs were selected and maintained in the same medium containing 16 μg/ml G418.
Cells were differentiated to the chemotaxis-competent stage as described (Kriebel et al., 2003; Liu et al., 2010). Briefly, log-phase cells were harvested by low-speed centrifugation, washed, and resuspended in developmental buffer (5 mM Na2HPO4, 5 mM KH2PO4, pH 6.2, 2 mM Mg2SO4, and 0.2 mM CaCl2) at 2 × 10⁷ cells/ml and developed in suspension at 100 rpm for 5–6 h with cAMP pulses. Differentiated cells were processed according to the assay to be performed.
Electrophoresis and immunoblotting
SDS–PAGE was performed by standard procedures (Laemmli, 1970). For detecting actin, cAR1, ACA, and YFP, cells were taken at the indicated time during cAMP pulsing. Cell lysates were subjected to SDS–PAGE analysis on Tris glycine gels and transferred to membranes by iBlot gel transfer stack (Invitrogen, Carlsbad, CA). The membrane was blotted with rabbit anti-actin (Sigma-Aldrich, St. Louis, MO; Liu et al., 2010) and/or mouse anti-GFP (Covance, Berkeley, CA), anti-cAR1, and anti-ACA polyclonal antibodies (Parent and Devreotes, 1995; Kriebel et al., 2008). ctxI and ctxII monoclonal antibodies (hybridoma supernatants) were purchased from the Developmental Studies Hybridoma Bank (University of Iowa, Iowa City, IA) and used with 1:10 dilution. Secondary antibodies, goat IRDye800, anti–rabbit immunoglobulin G (IgG; Rockland Immunochemicals, Gilbertsville, PA) and Alexa Fluor 680 goat anti–mouse IgG (Molecular Probes, Invitrogen) were diluted 1:7000. Proteins were quantified with the Odyssey infrared imaging system (LI-COR Biosciences, Lincoln, NE).
Fluorescence microscopy
Fluorescence microscopy was performed as described (Shu et al., 2003). Cells were fixed with 1% formaldehyde, 0.1% glutaraldehyde, and 0.01% Triton X-100 in PB (5 mM sodium phosphate buffer, pH 6.2) at room temperature for 15 min, then washed and incubated for 60 min at 37°C with 100-fold diluted rabbit anti-actin and monoclonal mouse anti-ctxI or anti-ctxII in PB supplemented with 1% bovine serum albumin and 0.2% saponin. Secondary antibodies, fluorescein isothiocyanate–conjugated goat anti–mouse IgG and Texas red–goat anti–rabbit IgG (Molecular Probes), were diluted 750-fold. F-Actin was stained with rhodamine–phalloidin (Molecular Probes). Images were acquired with an LSM-510 laser scanning fluorescence microscope (Carl Zeiss, Jena, Germany).
Chemotaxis assays
The micropipette assay of cAMP-induced Dictyostelium chemotaxis was performed as described (Parent et al., 1998). Aggregation-competent cells were resuspended in PB on a chambered coverslip. A chemoattractant gradient was generated with a microinjector (Eppendorf, Hauppauge, NY) attached to a micropipette filled with 10 μM cAMP. Chemotactic migration was continuously recorded at intervals of 10 s using an Axiovert 200 inverted microscope and AxioVision software (Carl Zeiss) and processed with MetaMorph software (Molecular Devices, Sunnyvale, CA). To analyze cell speed, motility, and shape changes during chemotaxis, two-dimensional dynamic image analysis system (2D-DIAS) software was used (Wessels et al., 2007). At least 15 cells of each cell line in three independent experiments were analyzed. Velocities were determined by dividing cell displacements by the time interval. The index of migration (directionality) is calculated in DIAS as the net path length divided by the total path length.
Cell streaming and development
To examine self-streaming, 1.5 × 10⁷ cells were harvested, resuspended at 5 × 10⁶/ml, and plated on 60-mm Petri dishes and allowed to adhere for 30 min (Shu et al., 2010). The cells were carefully washed twice with starvation buffer (20 mM 2-(N-morpholino)ethanesulfonic acid, pH 6.8, 0.2 mM CaCl2, 2 mM MgSO4), and 2 ml of the same buffer were carefully applied to the plates. Aggregation and streaming were visualized 6–8 h after plating. Images of self-streaming cells were taken every minute with a Discovery V12 stereo microscope (Carl Zeiss) equipped with a PlanApos ×1.0 objective and an AxioCam camera automated by AxioVision 4 software.
Development was monitored 24 or 72 h after cells were spotted on 1.5% agarose plates in developmental buffer. The under-agarose assay was done as described (Comer et al., 2005). Results were recorded with the same stereomicroscope that was used to visualize self-streaming.
Glutathione S-transferase (GST)–Ras–binding domain preparation and activated ras pull-down assay
The glutathione S-transferase (GST)–Ras–binding domain (RBD) beads were prepared as described (Sasaki and Firtel, 2009) with some modifications. The RBD of Byr 2 was expressed in Escherichia coli cultured in LB and induced at cell density OD of 0.5–0.6 with 0.2 mM isopropyl β-d-1-thioglactopyranoside for 4 h at 30°C. Cells were treated with 0.1 mg/ml lysozyme and sonicated on ice 30 times with 10-s intervals. The lysate was centrifuged, and the supernatant was mixed with GST-Sepharose 4B beads (Amersham, GE Healthcare Bio-Sciences, Piscataway, NJ), which were rotated for 1 h at 4°C. The beads were centrifuged, washed, and resuspended in 40% glycerol/phosphate-buffered saline and stored at −20°C until use. Total Ras and activated Ras assays were performed as described previously (Kae et al., 2004). Briefly, differentiated cells were first treated with 2 mM caffeine and stimulated with 200 nM cAMP. Cell lysates were mixed with GST-RBD beads at 4°C for 1 h, washed twice, and eluted by SDS sample buffer. The pulled-down proteins were analyzed with Western blots and detected by pan anti-Ras (Pierce, Thermo Fisher Scientific, Rockford, IL), anti-RasC, and anti-RasG (Kae et al., 2004) antibodies. Image analysis was carried out using ImageJ software (National Institutes of Health, Bethesda, MD). All assays were repeated at least three times.
cAMP stimulation of ERK2 phosphorylation and TORC2 activity and cAMP-binding assays
ERK2 phosphorylation was assayed as described (Maeda et al., 2004; Brzostowski and Kimmel, 2006; Shu et al., 2010). Briefly, aggregation-competent cells were stimulated by 100 nM cAMP, and aliquots of 100 μl were removed at the indicated times and lysed by addition of 5× SDS–PAGE sample buffer. The resultant samples were analyzed by SDS–PAGE and blotted with 1000-fold diluted polyclonal anti–phospho-p44/p42 MAP kinase (pERK2) antibody (Cell Signaling Technology, Beverly, MA).
cAMP stimulation of TORC2 activity was determined by assaying phosphorylation of PKBR1 as described (Kamimua et al. 2009). Cells were prepared as described for the ERK2 phosphorylation assay and stimulated with 1 μM cAMP, and SDS–PAGE gels were blotted with 1000-fold diluted rabbit anti–phospho-PKC (pan) antibody (Cell Signaling Technology).
Binding of [3H]cAMP to the cell surface was assayed using the (NH4)2SO4 stabilization method (Van Haastert and Kien, 1983; Liao and Kimmel, 2009) with the modifications described in Shu et al. (2010). All experiments were performed at least three times.
Actin polymerization and myosin II assembly and ACA activity assays
The time courses of actin polymerization and myosin II assembly were determined as described (Cai et al., 2010). Briefly, aggregation competent cells were pretreated with 3 mM caffeine, washed with PB plus 2 mM MgSO4 (PM), and resuspended (3 × 10⁷ cells/ml) in PM plus 2 mM caffeine. Cells were stimulated with 1 μM cAMP. At specific time points after cAMP stimulation, 200-μl aliquots were taken and added into assay buffer (Cai et al., 2010). The Triton-insoluble cytoskeleton was dissolved in 1× SDS sample buffer and subjected to SDS–PAGE. The amounts of actin and myosin II were quantified by the Odyssey (LI-COR) protein density analysis method.
ACA activity was assayed as described (Parent and Devreotes, 1995). Briefly, differentiated cells were treated with 2 mM caffeine in PB for 30 min, then washed twice with PM, resuspended in PM at 8 × 10⁷ cells/ml, and shaken on ice for 10 min. ACA activity was assayed at room temperature before and after the addition of 10 μM cAMP. All experiments were performed at least three times.
Electron microscopy
For scanning electron microscopy, attached cells on coverslips were fixed with 2.5% glutaraldehyde and 1% paraformaldehyde, ethanol dehydrated, critical point dried, sputter coated with 10 nm gold, and examined with a Hitachi S-3400N scanning electron microscope (Tokyo, Japan). Platinum–carbon replicas of detergent-extracted cytoskeletons of amoebae on glass coverslips were prepared essentially as described (Svitkina et al., 2003; Shu et al., 2010). Live cells were extracted for 4 min with 1% Triton X-100 in a “cytoplasmic” buffer containing 2 μM phalloidin. The cytoskeletons were fixed with glutaraldehyde and further stabilized with tannic acid and uranyl acetate before ethanol dehydration and critical point drying. Platinum–carbon replicas of the dried cytoskeletons were viewed with a JEOL JEM-1400 electron microscope (Peabody, MA) equipped with an AMT XR-111 digital camera.
Supplementary Material
Acknowledgments
We thank the Dictyostelium Stock Center for the ctxA−B−, ctxB−, abpA−, abpC−, and fim− cells and GFP-PI3K plasmids; Parvin Bolourani and Gerald Weeks for performing the Western blots for RasC and RasG; Patricia S. Connelly for scanning electron microscopy; Carole A. Parent for ACA and cAR1 antibodies and GFP-CRAC and ACA-YFP plasmids; Alan R. Kimmel for RBD-Byr bacteria and assistance in preparation of the RBD beads; Douglas N. Robinson for ctxA− cells; Angelica A. Noegel for AGHR2 cells; and Tian Jin for cAR1-YFP plasmids. This work was supported by the Intramural Research Programs of the National, Heart, Lung, and Blood Institute, and the National Cancer Institute, National Institutes of Health.
Abbreviations used:
- ACA
adenylyl cyclase
- cAR1
cAMP receptor 1
- CRAC
cytoplasmic regulator of ACA
- ctx
cortexillin
Footnotes
This article was published online ahead of print in MBoC in Press (http://www.molbiolcell.org/cgi/doi/10.1091/mbc.E11-09-0764) on November 23, 2011.
REFERENCES
- Bolourani P, Spiegelman GB, Weeks G. Delineation of the roles played by RasG and RasC in cAMP-dependent signal transduction during the early development of Dictyostelium discoideum. Mol Biol Cell. 2006;17:4543–4550. doi: 10.1091/mbc.E05-11-1019. [DOI] [PMC free article] [PubMed] [Google Scholar]
- Bosgraaf L, Russcher H, Smith JL, Wessels D, Soll DR, Van Haastert PJ. A novel cGMP signaling pathway mediating myosin phosphorylation and chemotaxis in Dictyostelium. EMBO J. 2002;21:4560–4570. doi: 10.1093/emboj/cdf438. [DOI] [PMC free article] [PubMed] [Google Scholar]
- Brzostowski JA, Kimmel AR. Nonadaptive regulation of ERK2 in Dictyostelium: implications for mechanisms of cAMP relay. Mol Biol Cell. 2006;17:4220–4227. doi: 10.1091/mbc.E06-05-0376. [DOI] [PMC free article] [PubMed] [Google Scholar]
- Cai H, Ras S, Kamimura Y, Parent CA, Devreotes PN. Ras-mediated activation of the TORC2-PKB pathway is critical for chemotaxis. J Cell Biol. 2010;190:4233–4245. doi: 10.1083/jcb.201001129. [DOI] [PMC free article] [PubMed] [Google Scholar]
- Cha I, Jeon TJ. Dynamic localization of the actin-bundling protein cortexillin I during cell migration. Mol Cells. 2011;32:281–287. doi: 10.1007/s10059-011-0072-0. [DOI] [PMC free article] [PubMed] [Google Scholar]
- Chisholm R, Firtel RA. Insights into morphogenesis from a simple developmental system. Nat Rev Mol Cell Biol. 2004;5:5310–541. doi: 10.1038/nrm1427. [DOI] [PubMed] [Google Scholar]
- Comer FI, Lippincott CK, Masbad JJ, Parent CA. The PI3K-mediated activation of CRAC independently regulates adenylyl cyclase activation and chemotaxis. Curr Biol. 2005;15:134–139. doi: 10.1016/j.cub.2005.01.007. [DOI] [PubMed] [Google Scholar]
- Egelhoff TT, Brown SS, Spudich JA. Spatial and temporal control of nonmuscle myosin localization: identification of a domain that is necessary for myosin filament disassembly in vivo. J Cell Biol. 1991;112:677–688. doi: 10.1083/jcb.112.4.677. [DOI] [PMC free article] [PubMed] [Google Scholar]
- Faix J, Steinmetz M, Boves H, Kammerer RA, Lottspeich F, Mintert U, Murphy J, Stock A, Aebi U, Gerisch G. Cortexillins, major determinants of cell shape and size, are actin-bundling proteins with a parallel coiled-coil tail. Cell. 1996;86:631–642. doi: 10.1016/s0092-8674(00)80136-1. [DOI] [PubMed] [Google Scholar]
- Faix J, Weber I, Mintert U, Köhler J, Lottspeich F, Marriott G. Recruitment of cortexillin into the cleavage furrow is controlled by Rac1 and IQGAP-related proteins. EMBO J. 2001;20:3705–3715. doi: 10.1093/emboj/20.14.3705. [DOI] [PMC free article] [PubMed] [Google Scholar]
- Fey P, Cox EC. Cortexillin I is required for development in Polysphondylium. Dev Biol. 1999;212:414–424. doi: 10.1006/dbio.1999.9353. [DOI] [PubMed] [Google Scholar]
- Girard KD, Chaney C, Delannoy M, Kuo SC, Robinson DN. Dynacortin contributes to cortical elasticity and helps define the shape change of cytokines. EMBO J. 2004;23:1536–1546. doi: 10.1038/sj.emboj.7600167. [DOI] [PMC free article] [PubMed] [Google Scholar]
- Huang YE, Iijima M, Parent CA, Funamoto S, Firtel RA, Devreotes P. Receptor-mediated regulation of PI3Ks confines PI(3,4,5)P3 to the leading edge of chemotaxing cells. Mol Biol Cell. 2003;14:1913–1922. doi: 10.1091/mbc.E02-10-0703. [DOI] [PMC free article] [PubMed] [Google Scholar]
- Insall RH, Soede RD, Schaap P, Devreotes PN. Two cAMP receptors activate common signaling pathways in Dictyostelium. Mol Biol Cell. 1994;5:703–711. doi: 10.1091/mbc.5.6.703. [DOI] [PMC free article] [PubMed] [Google Scholar]
- Johnson RL, Van Haastert PJ, Kimmel AR, Saxe CL 3rd, Jastorff B, Devreotes PN. The cyclic nucleotide specificity of three cAMP receptors in Dictyostelium. J Biol Chem. 1992;267:4600–4607. [PubMed] [Google Scholar]
- Kae H, Lim CJ, Spiegelman GB, Weeks G. Chemoattractant-induced Ras activation during Dictyostelium development. EMBO Rep. 2004;5:602–606. doi: 10.1038/sj.embor.7400151. [DOI] [PMC free article] [PubMed] [Google Scholar]
- Kamimura Y, Tang M, Devreotes PN. Assays for chemotaxis and chemoattractant-stimulated TorC2 activation and PKB substrate phosphorylation in Dictyostelium. Meth Mol Biol. 2009;571:255–270. doi: 10.1007/978-1-60761-198-1_17. [DOI] [PMC free article] [PubMed] [Google Scholar]
- Kimmel AR, Parent CA. The signal to move: D. discoideum of orienteering. Science. 2003;300:1525–1527. doi: 10.1126/science.1085439. [DOI] [PubMed] [Google Scholar]
- Kriebel PW, Barr VA, Parent CA. Adenylyl cyclase localization regulates streaming during chemotaxis. Cell. 2003;112:549–560. doi: 10.1016/s0092-8674(03)00081-3. [DOI] [PubMed] [Google Scholar]
- Kriebel PW, Barr VA, Rericha EC, Parent CA. Collective cell migration requires vesicular trafficking for chemoattractant delivery at the trailing edge. J Cell Biol. 2008;183:949–961. doi: 10.1083/jcb.200808105. [DOI] [PMC free article] [PubMed] [Google Scholar]
- Laemmli UK. Cleavage of structural proteins during the assembly of the head of bacteriophage T4. Nature. 1970;227:680–685. doi: 10.1038/227680a0. [DOI] [PubMed] [Google Scholar]
- Lee S, Comer FI, Sasaki A, McLeod IX, Duong Y, Okumura K, Yates JR, III, Parent CA, Firtel RA. TOR complex 2 integrates cell movement during chemotaxis and signal relay in Dictyostelium. Mol Biol Cell. 2005;16:4572–4583. doi: 10.1091/mbc.E05-04-0342. [DOI] [PMC free article] [PubMed] [Google Scholar]
- Lee S, Shen Z, Robinson D, Briggs S, Firtel R. Involvement of the cytoskeleton in controlling leading-edge function during chemotaxis. Mol Biol Cell. 2010;21:1810–1824. doi: 10.1091/mbc.E10-01-0009. [DOI] [PMC free article] [PubMed] [Google Scholar]
- Liao XH, Kimmel AR. Biochemical responses to chemoattractants in Dictyostelium: ligand-receptor interactions and downstream kinase activation. Meth Mol Biol. 2009;571:271–281. doi: 10.1007/978-1-60761-198-1_18. [DOI] [PubMed] [Google Scholar]
- Lim CJ, Spiegelman GB, Weeks G. RasC is required for optimal activation of adenylyl cyclase and Akt/PKB during aggregation. EMBO J. 2001;20:4490–4499. doi: 10.1093/emboj/20.16.4490. [DOI] [PMC free article] [PubMed] [Google Scholar]
- Liu X, Shu S, Hong MS, Yu B, Korn ED. Mutation of actin Tyr-53 alters the conformations of the DNase I-binding loop and the nucleotide-binding cleft. J Biol Chem. 2010;285:9729–9739. doi: 10.1074/jbc.M109.073452. [DOI] [PMC free article] [PubMed] [Google Scholar]
- Maeda M, Lu S, Shaulsky G, Miyazaki Y, Kuwayama H, Tanaka Y, Kuspa A, Loomis WF. Periodic signaling controlled by an oscillatory circuit that includes protein kinases ERK2 and PKA. Science. 2004;304:875–878. doi: 10.1126/science.1094647. [DOI] [PubMed] [Google Scholar]
- McCann CP, Kriebel PW, Parent CA, Losert W. Cell speed, persistence and information transmission during signal relay and collective migration. J Cell Sci. 2010;123:1724–1731. doi: 10.1242/jcs.060137. [DOI] [PMC free article] [PubMed] [Google Scholar]
- Mondal S, Burgute B, Rieger D, Müller R, Rivero F, Faix J, Schleicher M, Noegel AA. Regulation of the actin cytoskeleton by an interaction of IQGAP related protein GAPA with filamin and cortexillin I. PloS ONE. 2010;5:e15440. doi: 10.1371/journal.pone.0015440. [DOI] [PMC free article] [PubMed] [Google Scholar]
- Moores SL, Sabry JH, Spudich JA. Myosin dynamics in live Dictyostelium cells. Proc Natl Acad Sci USA. 1996;93:443–446. doi: 10.1073/pnas.93.1.443. [DOI] [PMC free article] [PubMed] [Google Scholar]
- Parent CA, Blacklock BJ, Froehlich WM, Murphy DB, Devreotes PN. G protein signaling events are activated at the leading edge of chemotactic cells. Cell. 1998;95:81–91. doi: 10.1016/s0092-8674(00)81784-5. [DOI] [PubMed] [Google Scholar]
- Parent CA, Devreotes PN. Isolation of inactive and G protein-resistant adenylyl cyclase mutants using random mutagenesis. J Biol Chem. 1995;270:22693–22696. doi: 10.1074/jbc.270.39.22693. [DOI] [PubMed] [Google Scholar]
- Pikzack C, Prassler J, Furukawa R, Fechheimer M, Rivero F. Role of calcium-dependent actin-bundling proteins: characterization of Dictyostelium mutants lacking fimbrin and the 34-kilodalton protein. Cell Motil Cytoskeleton. 2005;62:210–231. doi: 10.1002/cm.20098. [DOI] [PubMed] [Google Scholar]
- Pitt GS, Milona N, Borleis J, Lin KC, Reed RR, Devreotes PN. Structurally distinct and stage-specific adenylyl cyclase genes play different roles in Dictyostelium development. Cell. 1992;69:305–315. doi: 10.1016/0092-8674(92)90411-5. [DOI] [PubMed] [Google Scholar]
- Reichl EM, Ren Y, Morphew MK, Delannoy M, Effler JC, Girard KD, Divi S, Iglesias PA, Kuo SC, Robinson DN. Interactions between myosin and actin crosslinkers control cytokinesis contractility dynamics and mechanics. Curr Biol. 2008;18:471–480. doi: 10.1016/j.cub.2008.02.056. [DOI] [PMC free article] [PubMed] [Google Scholar]
- Ren Y, Effler JC, Norstrom M, Luo T, Firtel RA, Iglesias PA, Rock RS, Robinson DN. Mechanosensing through cooperative interactions between myosin II and the actin crosslinker cortexillin I. Curr Biol. 2009;19:1421–1428. doi: 10.1016/j.cub.2009.07.018. [DOI] [PMC free article] [PubMed] [Google Scholar]
- Rivero F, Koppel B, Peracino B, Bozzaro S, Seigert F, Weijer CJ, Schleicher M, Albrecht, Noegel AA. The role of the cortical cytoskeleton: F-actin crosslinking proteins protect against osmotic stress, ensure cell size, cell shape and motility, and contribute to phagocytosis and development. J Cell Sci. 1996;109:2679–2691. doi: 10.1242/jcs.109.11.2679. [DOI] [PubMed] [Google Scholar]
- Sasaki AT, Chun C, Takeda K, Firtel RA. Localized Ras signaling at the leading edge regulates PI3K, cell polarity, and directional movement. J Cell Biol. 2004;167:505–518. doi: 10.1083/jcb.200406177. [DOI] [PMC free article] [PubMed] [Google Scholar]
- Sasaki AT, Firtel RA. Spatiotemporal regulation of Ras-GTPase during chemotaxis. Meth Mol Biol. 2009;571:333–348. doi: 10.1007/978-1-60761-198-1_23. [DOI] [PubMed] [Google Scholar]
- Schroth-Diez B, Gerwig S, Ecke M, Hegerl R, Diez S, Gerisch G. Propagating waves separate two states of actin organization in living cells. HSFP J. 2009;3:412–427. doi: 10.2976/1.3239407. [DOI] [PMC free article] [PubMed] [Google Scholar]
- Segall J, Kuspa A, Shaulsky G, Ecke M, Maeda M, Gaskins C, Firtel RA, Loomis WF. A MAP kinase necessary for receptor mediated activation of adenylyl cyclase in Dictyostelium. J Cell Biol. 1995;128:405–413. doi: 10.1083/jcb.128.3.405. [DOI] [PMC free article] [PubMed] [Google Scholar]
- Shu S, Liu X, Korn ED. Blebbistatin and blebbistatin-inactivated myosin II inhibit myosin II-independent processes. Proc Natl Acad Sci USA. 2003;100:6499–6504. doi: 10.1073/pnas.0409528102. [DOI] [PMC free article] [PubMed] [Google Scholar]
- Shu S, Liu X, Kriebel PW, Hong MS, Daniels MP, Parent CA, Korn ED. Expression of Y53A-actin in Dictyostelium disrupts the cytoskeleton and inhibits intracellular and extracellular chemotactic signaling. J Biol Chem. 2010;285:27713–27725. doi: 10.1074/jbc.M110.116277. [DOI] [PMC free article] [PubMed] [Google Scholar]
- Stock A, Steinmetz MO, Janmey PA, Aebi U, Gerisch G, Kammerer RA, Weber I, Faix J. Domain analysis of cortexillin I: actin-bundling, PIP2-binding and the rescue of cytokinesis. EMBO J. 1999;18:5274–5284. doi: 10.1093/emboj/18.19.5274. [DOI] [PMC free article] [PubMed] [Google Scholar]
- Svitkina TM, Bulanova EA, Chaga OY, Vignjevic DM, Kojima S, Vasiliev JM, Borisy GG. Mechanism of filopodia initiation by reorganization of a dendritic network. J Cell Biol. 2003;160:409–421. doi: 10.1083/jcb.200210174. [DOI] [PMC free article] [PubMed] [Google Scholar]
- Swaney KF, Huang C-H, Devreotes PN. Eukaryotic chemotaxis: a network of signaling pathways controls motility, directional sending, and polarity. Annu Rev Biophys. 2010;39:265–289. doi: 10.1146/annurev.biophys.093008.131228. [DOI] [PMC free article] [PubMed] [Google Scholar]
- Tang M, Iijima M, Kamimua Y, Chen L, Long Y, Devreotes PN. Disruption of PKB signaling restores polarity to cells lacking tumor suppressor PTEN. Mol Biol Cell. 2011;22:437–447. doi: 10.1091/mbc.E10-06-0522. [DOI] [PMC free article] [PubMed] [Google Scholar]
- Tseng Y, Kole TP, Lee JS, Fedorov E, Almo SC, Schafer BW, Wirtz D. How actin crosslinking and bundling proteins cooperate to generate an enhanced cell mechanical response. Biochem Biophys Res Commun. 2005;334:183–92. doi: 10.1016/j.bbrc.2005.05.205. [DOI] [PubMed] [Google Scholar]
- Van Haastert PJ, Kien E. Binding of cAMP derivatives to Dictyostelium discoideum cellsActivation mechanism of the cell surface cAMP receptor. J Biol Chem. 1983;258:9636–9642. [PubMed] [Google Scholar]
- Weber I, Gerisch G, Heizer C, Murphy J, Badelt K, Stock A, Schwartz JM, Faix J. Cytokinesis mediated through the recruitment of cortexillins into the cleavage furrow. EMBO J. 1999;18:586–594. doi: 10.1093/emboj/18.3.586. [DOI] [PMC free article] [PubMed] [Google Scholar]
- Wessels D, Lusche DF, Kuhl S, Heid P, Soll DR. PTEN plays a role in the suppression of lateral pseudopod formation during Dictyostelium motility and chemotaxis. J Cell Sci. 2007;120:2517–2531. doi: 10.1242/jcs.010876. [DOI] [PubMed] [Google Scholar]
Associated Data
This section collects any data citations, data availability statements, or supplementary materials included in this article.


