

Abstract
Phosphorus is one of the essential mineral nutrients required by all living cells. Plants assimilate phosphate (Pi) from the soil, and their root systems encounter tremendous variation in Pi concentration, both temporally and spatially. Genome sequence data indicate that plant genomes contain large numbers of genes predicted to encode Pi transporters, the functions of which are largely unexplored. Here we present a comparative analysis of four very closely related Pi transporters of the PHT1 family of Medicago truncatula. Based on their sequence similarity and locations in the genome, these four genes probably arose via recent gene duplication events, and they form a small subfamily within the PHT1 family. The four genes are expressed in roots with partially overlapping but distinct spatial expression patterns, responses to Pi and expression during arbuscular mycorrhizal symbiosis. The proteins are located in the plasma membrane. Three members of the subfamily, MtPT1, MtPT2, and MtPT3, show low affinities for Pi. MtPT5 shares 84% amino acid identity with MtPT1, MtPT2, and MtPT3 but shows a high affinity for Pi with an apparent Km in yeast of 13 μm. Sequence comparisons and protein modeling suggest that amino acid residues that differ substantially between MtPT5 and the other three transporters are clustered in two regions of the protein. The data provide the first clues as to amino acid residues that impact transport activity of plant Pi transporter proteins.
Phosphorus (P) is required by all organisms and is an essential component of cellular macromolecules, energy transfer reactions, and cellular metabolism (1). Plants acquire P as phosphate (Pi) from the soil and uptake into the roots occurs either directly through the root epidermal cells, or indirectly through arbuscular mycorrhizal (AM)3 fungi with which most plants form symbiotic associations (2–5). Both the initial uptake and subsequent distribution of Pi to cells throughout the plant require the activity of membrane transport proteins, and a combination of experimental evidence and genome sequence analyses indicate that plants contain a wide variety of Pi transporter genes. Furthermore, the different Pi transporter gene families are themselves composed of multiple members (2, 6). Current data suggest that members of the PHT1 Pi transporter family mediate transfer of Pi into cells, whereas members of the PHT2, PHT3, PHT4, and pPT families are involved in Pi transfer across internal cellular membranes and organelle membranes (7–10).
Members of the PHT1 Pi transporter gene family have been identified from a wide range of plant species including Arabidopsis, rice, Medicago truncatula, and tomato (11–20). Many of these transporters are expressed in roots and show elevated transcript levels during growth in low Pi conditions. From the Arabidopsis and rice whole genome sequences, the full extent of the PHT1 transporter families is revealed and these species contain 9 and 13 members, respectively. Eight of the nine Arabidopsis transporters are expressed in roots and 4 of these are expressed in epidermal cells. In contrast, there is less redundancy in the aerial tissues (21). In rice, at least 10 of the PHT1 transporters are expressed in roots (16). Overlapping expression patterns have been reported for the PHT1 Pi transporters in other plant species also (14, 19, 20, 22–26). The biochemical activities of only a few PHT1 Pi transporters have been analyzed, either by expression in yeast Pi transport mutants, or in plant cells (11, 13, 15, 24, 27, 28). The transporters show a range of affinities for Pi with apparent Km values between 9 and 668 μm. In Arabidopsis two Pi transporters, Pht1;1 and Pht1;4, mediate 75% of the Pi uptake capacity of the roots system and consistent with their expression patterns, they appear to function in a wide range of Pi environments (29).
To understand how Pi transport is coordinated within the plant, it is necessary to determine the biochemical activities, cellular and membrane locations of each transporter, and then to obtain mutants with which to analyze the contributions of each individual transporter to the Pi transport process. Although significant expression data are available for the rice and Arabidopsis PHT1 gene families, a complete analysis of the whole PHT1 transporter family is not yet available in any species. Currently, a small number of Pi transporter genes, generally those that are most highly expressed, have been analyzed in a wide range of plant species (as reviewed in Refs. 2 and 30). This focus on orthologs has provided insights into the similarities and differences that occur between plants species. However, within a single plant species, the range of Pi transport activities encoded by the PHT1 transporters, their individual roles, and the way that they operate to mediate Pi acquisition and transport through the plant, is still largely unknown.
M. truncatula is a legume that forms symbioses with both AM fungi and nitrogen-fixing bacteria and is therefore a useful plant model in which to study plant mineral nutrient transport in non-symbiotic and symbiotic situations. In the context of Pi transport, the AM symbiosis is of relevance and a PHT1 family member, MtPT4 (MEDtr;Pht1;4) mediates symbiotic Pi transport (5, 27, 31). Previously, we identified two members of the PHT1 family, MtPT1 (MEDtr;Pht1;1) and MtPT2 (MEDtr; Pht1;2), which are expressed at high levels in Pi-deprived M. truncatula roots (15, 32). Here we extend our analyses of Pi transport in roots with analyses of two additional members of the PHT1 family, MtPT3 (MEDtr;Pht1;3) and MtPT5 (MEDtr; Pht1;5). The four genes show partially overlapping expression patterns, but are regulated differently in response to changes in Pi concentration in the environment and during an AM symbiosis. Furthermore, the Pi transport activity of MtPT5 differs substantially from that of MtPT1, MtTP2, and MtPT3.
EXPERIMENTAL PROCEDURES
Plant Materials and Growth Conditions—M. truncatula cv. Jemalong, line A17 was used throughout the experiment. Plants were grown in growth rooms under a 16-h light (25 °C)/8-h (22 °C) dark regime.
For the Pi re-supply experiment, M. truncatula plants were grown aeroponically in ½ strength Hoagland solution containing 1 μm K2HPO4 for 28 days. The nutrient solution was changed every week. At 29 days, the nutrient solution was replaced with either ½ strength Hoagland solution containing 1 mm K2HPO4 (Pi re-supply) or ½ strength Hoagland solution containing 1 μm K2HPO4 (control) with 1 mm K2SO4 to equalize the potassium level in the two treatments. Roots were sampled at 0, 24, and 54 h after changing the nutrient solution. The Pi content of plant tissues was determined using a phosphomolybdate colorimetric assay as described previously (33). The Pi concentrations in the shoots of the control plants were 21.6, 13.6, and 13.1 nmol/mg fresh weight at 0, 24, and 54 h, respectively. The Pi concentrations in the shoots of the Pi re-supplied plants were 16.9, 125.8, and 361.1 nmol/mg fresh weight at 0, 24, and 54 h, respectively.
Mycorrhizal root samples were the same as those reported previously (34). Colonization levels were 8.7, 11, 39, 55, and 61% root length colonized, respectively (34, 35).
Isolation of the MtPT3 and MtPT5 cDNA Clones—Full-length cDNA clones of MtPT3 and MtPT5 were obtained by screening a M. truncatula root cDNA library. MtPT3 and MtPT5 cDNA clones were identified by hybridization with a small region of the respective genes identified initially as ESTs in the M. truncatula gene index (compbio.dfci.harvard.edu/tgi/). Sequences were deposited in GenBank™ under accession numbers EF016358 (MtPT3) and EF016359 (MtPT5).
Southern Blot and Northern Blot Analyses—Southern and Northern blot analyses were carried out according to standard procedures. The unique 3′-UTR fragments of MtPT3 (288bp) and MtPT5 (335bp), and MtPT1 full-length cDNA clone were used as probes. The blots were sequentially stripped and rehybridized with the probes as indicated. The 18 S RNA hybridization signals or gel pictures of the loaded samples were shown for loading comparison. The hybridized blots were scanned and analyzed with a Storm820 PhosphorImager (GE Healthcare). Representative experiments are shown. The same patterns of gene expression in response to changes in Pi conditions or to mycorrhizal symbiosis were seen in a minimum of 3 independent experiments.
Reverse Transcriptase-PCR Analyses—Total RNA was isolated using TRIzol reagent (Invitrogen) and 5 μg of RNA were treated with 1 unit of Turbo DNase (Ambion Inc., Austin, TX) twice. After an incubation of 20 min at 37 °C each time, samples were purified using phenol (pH 6.6): chloroform and chloroform followed by isopropyl alcohol precipitation. 2 μg of DNase-treated RNA were reverse-transcribed using SuperScript III enzyme (Invitrogen) following the manufacturer's protocol. Each 20- or 40-μl cDNA synthesis reaction was diluted with water to 60 μl prior to PCR. Primers and annealing temperatures that enable discrimination between MtPT5, MtPT3, and MtPT1/MtPT2 genes were developed (supplemental Fig. S2). It was not possible to develop primers that distinguish between MtPT1 and MtPT2.
MtPT3 and MtPT5 Promoter-UidA Gene Fusions—The MtPT3 gene resides on M. truncatula BAC clone mth2-11l3 (AC122161). Two transcriptional fusions to the UidA gene were prepared. In the first fusion, 1705 bp of DNA directly upstream of the intron in the 5′-UTR was inserted between the PstI-NcoI sites in the pCAMBIA 3301 vector (CAMBIA, Canberra, Australia) upstream of the UidA gene. The primers used for the amplification region were 5′-GTGATCTGCAGGTGCAGCTTGACAACCG-3′ (forward) and 5′-GTGGCCATGGCTCCTTGCAAGAAACCAAGTTGAT-3′ (reverse). This gene fusion does not contain the intron. For the second gene fusion, a 3652-bp fragment of the MtPT3 5′ proximal region including the intron and the 5′-UTR (72 bp) was also inserted between the PstI-NcoI sites in the pCAMBIA 3301 vector upstream of the UidA gene. Primers used for the amplification of the region were 5′-CGACTGCAGCAGGGTGGATTCGAATCCTAACC-3′ (forward), and 5′-CAGCCATGGACTGAATTTGTTACCTAGTTCCC-3′ (reverse). The MtPT5 gene resides on M. truncatula BAC clone mth2071c1 (AC152186). A 3710-bp fragment representing the region 5′ proximal to the MtPT5 open reading frame, and therefore including the intron in the 5′-UTR, was fused upstream of the UidA gene. A forward primer, 5′-GAGAGTCGACCCTTAAAGGGGTCATTCT-3′, which adds a 5′ SalI site was used in combination with a reverse primer, 5′-GAGAAAGCTTCACCAACTTTGTTACCTGATTACA-3′, which adds a 3′ HindIII site. The resulting fragment was ligated into the SalI and HindIII sites of a modified version of pCAMBIA 2301 lacking the CaMV 35S-promoter. The modified version was created by amplifying the UidA coding sequence from pCAMBIA 2301 (CAMBIA) using primers 5′-GAGAAAGCTTATGGTAGATCTGAGGGTAAATTTC-3′ and 5′-GGTCACCTGTAATTCACACG-3′. The 5′ primer adds a HindIII site directly upstream of the UidA ATG and the 3′ primer includes an endogenous BstEII site. The PCR product was digested with HindIII and BstEII restriction enzymes and ligated into the HindIII and BstEII sites of pCAMBIA 2301. The resulting vector contains the pCAMBIA 2301 multiple cloning site directly upstream of the UidA coding sequence.
Preparation and Analysis of M. truncatula Plants Containing Transgenic Roots—M. truncatula composite plants carrying transformed roots were generated as described previously (36). Expression of the UidA gene was evaluated by histochemical staining for β-glucuronidase (GUS) activity, as described previously (34).
Construction of MtPT3:GFP and MtPT5:GFP Gene Fusions and Subcellular Localization of the Proteins in Plant Cells—The green fluorescence protein (GFP) gene was fused to the C-terminal ends of the MtPT3 and MtPT5 genes. When expressed in plant cells, these gene fusions give rise to phosphate transporter:GFP fusion proteins. A PCR-generated NcoI-NcoI fragment containing the full-length coding region of MtPT3 and a SalI-NcoI fragment containing the full-length coding region of MtPT5 were cloned in-frame upstream of the GFP gene in the plasmid CaMV35S-sGFP(S65T)-Nos (37). The forward and reverse primers for MtPT3 are: 5′-CGGTCAGCCATGGTCATGTCTGGAGAATTAGGAG-3′ and 5′-TCGCGACCATGGAAACCCCCGATCCTTCTTGCCG-3′, respectively, and those for MtPT5 are: 5′-GCGTCAGGTCGACATGGCAGGACAACTAGGAG-3′ and 5′-TCGCGACCATGGAAACAGGTACTGTCCTAGCAG-3′, respectively. Expression of the gene fusions was controlled by the 35S-promoter.
Plasmid DNA (∼5 μg) was mixed with 1.0-μm gold particles (Bio-Rad), and bombarded into M. sativa leaves (650 p.s.i. pressure rupture disks) or onion inner epidermal cells (900 p.s.i. pressure rupture disks) using the Biolostic PDS-1000/He particle delivery system (Bio-Rad). Bombarded samples were maintained in the dark at room temperature for 24–48 h and then examined by confocal microscopy. GFP fluorescence was excited using the 488-nm line of the krypton-argon laser and emission detected at 522 nm. Images shown are single optical sections.
Yeast Growth and Phosphate Uptake Assays—The open reading frames of MtPT3 or MtPT5 were subcloned into EcoRI- and XhoI-digested yeast expression vector pWV3 to create MtPT3/pWV3 or MtPT5/pWV3, where expression of the MtPT3 or MtPT5 genes was driven by the yeast alcohol dehydrogenase promoter (38). These constructs were transformed into a yeast mutant PAM2, which lacks two high affinity Pi transporter genes, PHO84 and PHO89 (39). For yeast growth rate comparisons, PAM2 cells expressing the pWV3 control or MtPT3/pWV3 or MtPT5/pWV3 constructs were grown to the mid-logarithmic phase (A600 ≈ 1) in synthetic dextrose medium containing 0.22 mm Pi and 25 mm sodium citrate buffer at pH 4.5. The cells were then resuspended to an A600 0.2 in fresh medium and incubated at 30 °C with agitation (150 rpm). The growth rate of the cells was monitored by measuring the A600. To determine the pH optimum for MtPT3 and MtPT5, yeast cells harboring the pWV3, MtPT3/pWV3, and MtPT5/pWV3 constructs were grown to an A600 value of ∼1.0 in minimal medium (SD-Leu medium containing 0.22 mm Pi, 2% glucose, and 25 mm sodium citrate buffer, pH 4.5). The cells were harvested by centrifugation (3000 × g for 10 min) and washed with 1 volume of minimal medium lacking glucose and Pi and then resuspended in the same minimal medium at 200 mg/ml of cells. Thirty μl of this cell suspension was added to 570 μl of Pi-free minimum medium containing 25 mm sodium citrate buffer at the desired pH values (pH 3, 4, 5, and 6) and preincubated at 30 °C for 6 min. Six μl of 50 mm 33Pi (0.5 mm final Pi) was added, mixed, and cells were incubated with shaking at 30 °C. Aliquots (0.2 ml) were removed at 2-, 4-, and 6-min intervals and immediately added to 4 ml of ice-cold stop solution (25 mm sodium citrate buffer, pH 4.5) and the cells harvested immediately onto glass fiber filters by vacuum filtration. The filters were washed with an additional 4 ml of stop solution and transferred to scintillation vials and radioactivity counted by scintillation spectroscopy. To determine the Pi transport kinetics for MtPT3 and MtPT5 in yeast cells, the 33Pi uptake assay procedures were basically the same as described above.
Construction of MtPT3:GFP and MtPT5:GFP Gene Fusions and Subcellular Localization of the Proteins in Yeast Cells—The MtPT3:GFP and MtPT5:GFP gene fusions were amplified by PCR from the plant expression constructs and ligated to EcoRI- and XhoI-digested pWV3 to create MtPT3:GFP/pWV3 and MtPT5:GFP/pWV3. The transporter:GFP gene fusions are under the control of the alcohol dehydrogenase promoter. For each amplification the following GFP reverse primer (5′-TCTCTCGAGCTGCAGCCCGGGCGGCCGCTTTAC-3′) was used in combination with either MtPT3 forward (5′-ACAGAATTCATGTCTGGAGAATTAGGAGTTC-3′) or MtPT5 forward (5′-ACAGAATTCATGGCAGGACAACTAGGAGTGC-3′) primers. The constructs were introduced into PAM2 and transformants were grown using media and growth conditions used previously for the phosphate uptake assays. Yeast cells were examined by brightfield and laser scanning confocal microscopy as described previously (38, 40).
RESULTS
Previously, we showed that two members of the PHT1 gene family, MtPT1 and MtPT2, are expressed at high levels in M. truncatula roots particularly during Pi deprivation. The coding regions of these two genes share 98% nucleotide identity (15, 32, 41). High stringency hybridization of a M. truncatula genomic Southern blot with a full-length MtPT1 cDNA probe revealed 4 cross-hybridizing bands. This suggested the presence of two additional genes that share high sequence similarity with MtPT1 and MtPT2 (Fig. 1A). Full-length cDNAs of these two additional genes were obtained and named MtPT3 and MtPT5. The coding regions of MtPT3 and MtPT5 share 96 and 80% nucleotide identity with MtPT1, respectively. Southern blots hybridized with MtPT3 and MtPT5 gene-specific probes confirmed that MtPT3 and MtPT5 represented the two additional genes identified on the original Southern blot (Fig. 1A). The M. truncatula genome is being sequenced and current data indicate that MtPT1, MtPT2, MtPT3, and MtPT5 are all located on chromosome 1. The four genes share a similar and slightly unusual structure with a relatively large intron in the 5′-UTR (Fig. 1B and supplemental materials Fig. S1). By contrast, another member of the PHT1 family, MtPT4, has a small intron in the coding sequence but no intron in the 5′-UTR (27).
FIGURE 1.

Four members of the M. truncatula PHT1 gene family. A, Southern blot of M. truncatula genomic DNA digested with EcoRI and hybridized at high stringency with an MtPT3 gene-specific probe (lane 1), an MtPT1 full-length cDNA probe (lane 2), and an MtPT5 gene-specific probe (lane 3). Size markers (kb) are shown to the right of the blot. B, diagram of the structure of the MtPT genes indicating the 5′-UTR (open bars), coding sequence (dark gray bars), and 3′-UTR (light gray bars). Introns in the 5′-UTR are indicated by triangles and the size of each intron is indicated above the triangle. Total transcript sizes are indicated in brackets.
The gene expression patterns of MtPT1 and MtPT2 have been described previously. They show root-specific expression and transcript levels are highest in Pi-deprived roots (15, 32). Similarly MtPT3 and MtPT5 transcripts are present in roots of plants grown in low Pi nutrient solution; however, following the addition of high Pi, MtPT5 transcripts declined rapidly, whereas MtPT3 transcripts declined more slowly (Fig. 2A and supplemental materials Fig. S2). Under these conditions, MtPT1 and MtPT2 transcripts did not decrease significantly in the first 54 h following the addition of high Pi (supplemental Fig. S2). It should be noted that the primers detect transcripts arising from both MtPT1 and MtPT2 genes.
FIGURE 2.

Expression of MtPT3 and MtPT5 in M. truncatula roots. A, RNA gel blot analysis with 10 μg of total RNA from M. truncatula roots. Plants were grown for 28 days in nutrient solution containing 1 μm K2HPO4. On day 29, the nutrient solution was replaced with solution containing either 1 μm Pi (control) or 1 mm Pi (re-supplied) and plants were harvested at 0, 24, and 54 h after changing the solution. The blot was probed, stripped, and re-probed sequentially with MtPT5 and MtPT3 gene-specific probes, and an 18 S RNA probe.B, RNA gel blot with total RNA (10 μg) from mock-inoculated M. truncatula roots and M. truncatula roots colonized with Glomus versiforme at 8, 15, 22, 31, and 36 days post-inoculation (dpi) was probed with MtPT3 and MtPT5 gene-specific probes, and an 18 S RNA probe. The lower panel shows the ethidium bromide-stained RNA gel. The sample indicated by an asterisk (*) on the MtPT5 gel is slightly degraded and the apparent reduction in transcript level is not considered significant.
MtPT1, MtPT2, MtPT3, and MtPT5 expression differ during AM symbiosis also. MtPT3 transcript levels gradually decreased in mycorrhizal roots, a pattern observed previously for MtPT1/MtPT2. Expression is inversely correlated with the degree of colonization of the root system. In contrast, MtPT5 transcripts did not decrease in mycorrhizal roots and transcript levels remained relatively constant over the 30-day period of the experiment (Fig. 2B). Finally, MtPT1/MtPT2 transcripts were detected only in roots, whereas MtPT3 and MtPT5 transcripts were detected in roots and also aerial tissues of the plant (supplemental materials Fig. S2).
Previous studies indicated that MtPT1 and MtPT2 have partially overlapping spatial expression patterns. Both genes are expressed in the root epidermis and cortical cells, whereas MtPT2 is also expressed in the vascular tissue (41). To determine the spatial expression patterns of MtPT3 and MtPT5, transcriptional fusions between the putative promoter regions and the UidA gene were created. The constructs were introduced into M. truncatula roots and GUS activity was monitored via histochemical staining. Roots expressing an MtPT3 promoter-UidA fusion that included the 5′-UTR and intron, and therefore retained the native context of the MtPT3 gene, showed no detectable GUS staining. A second construct was prepared that lacked the intron and part of the 5′-UTR. This construct showed strong GUS expression exclusively in the vascular tissue (Fig. 3, A and B). At 2048 bp, the MtPT3 intron is the largest of the phosphate transporter 5′-UTR introns and it is possible that it contains negative regulatory sequences.
FIGURE 3.

Spatial expression patterns of MtPT3 and MtPT5 in M. truncatula roots. Histochemical staining revealing GUS activity in transgenic M. truncatula roots expressing the UidA gene under the control of the MtPT3 (A and B) and MtPT5 promoters (C–I). A, longitudinal view, and B, a transverse section showing positive GUS staining in the vascular tissue. C, positive GUS staining root hairs (arrows indicate root hairs). D and E, transverse sections showing positive GUS staining of the cortical cells and epidermis, and no staining in the vascular tissue. F, positive GUS staining in the root tips. G and H, epifluorescence and corresponding brightfield images of a transgenic root (MtPT5 promoter-UidA) colonized by a mycorrhizal fungus, G. versiforme. Arrowheads point to fungal arbuscules in the root cortex. G, wheat germ agglutinin-Alexa Fluor 488 staining reveals the fungus in the root cortex. H, positive GUS staining of the root hairs and cortex of the mycorrhizal root. I, overlay image. v, vascular parenchyma; e, epidermis; c, cortex. Bars: D, 75 μm; E, 25 μm; and G, 250 μm.
Roots expressing the MtPT5 promoter-UidA construct including the intron and 5′-UTR in the native context showed strong GUS staining in the epidermis and root hairs, as well as the cortical cell throughout the root (Fig. 3, C and D). GUS staining was observed in the developing vascular tissue and endodermis in the regions close to the root tip but was not observed in the vascular tissues in the mature regions of the root (Fig. 3E). In general, root tips, including emerging lateral root tips, showed strong staining in cells throughout the tip (Fig. 3F). In roots colonized by AM fungi, staining was visible both in the root hairs, epidermis, and cortex of both colonized and non-colonized regions of the root system (Fig. 3, G–I).
The MtPT1 protein is located in the plasma membrane where it is predicted to mediate Pi transport into the cell (32). To examine the location of MtPT3 and MtPT5 proteins, GFP fusion constructs were created and expressed transiently in Medicago sativa and onion epidermal cells. The green fluorescent signals were monitored by confocal microscopy. Cells expressing free GFP were used as controls. Onion epidermal cells are widely used as a heterologous system in which to evaluate the subcellular location of proteins. They are particularly useful for analysis of plasma membrane proteins because environmental conditions can be manipulated to cause partial plasmolysis and partial separation of the plasma membrane from the cell wall (42). Fig. 4, A–D, show partially plasmolyzed onion cells expressing free GFP or MtPT3:GFP. In the brightfield images (Fig. 4, A and C) the shrinking protoplast is visible and has separated from the cell wall. In a cell expressing free GFP (Fig. 4B), the green fluorescence associated with the cytoplasm is visible as a wide band. These cells contain a large central vacuole and peripheral cytoplasm. Fig. 4D shows a cell expressing MtPT3:GFP. Here the fluorescence of the plasma membrane is visible and in addition, fluorescent green strands connecting the wall and plasma membrane are visible (Fig. 4D). These so called “Hechtian strands” are connections between the plasma membrane and wall (43, 44) and indicate that the fluorescent signal from the MtPT3:GFP is associated with the plasma membrane (45). The same pattern of fluorescence was observed for MtPT5: GFP (data not shown). Fluorescent Hechtian strands were not visible in cells expressing free GFP (Fig. 4B).
FIGURE 4.
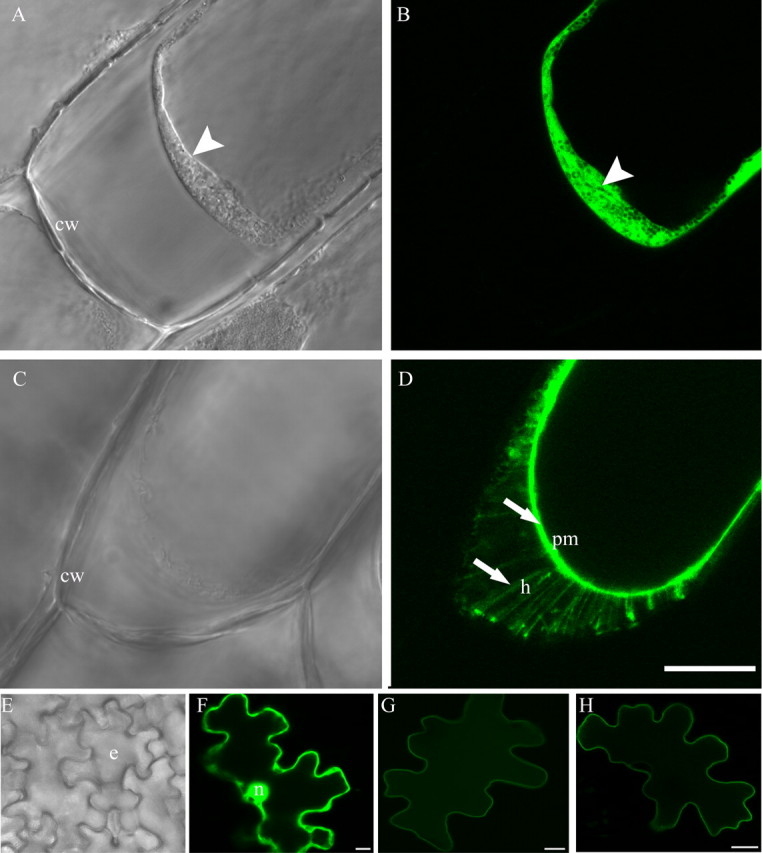
Subcellular locations of MtPT3 and MtPT5. Onion epidermal cells and M. sativa leaf epidermal cells expressing GFP and phosphate transporter:GFP fusion proteins. A and B, brightfield and corresponding fluorescence image of a partially plasmolyzed onion epidermal cell expressing free GFP. Arrowhead indicates the cytoplasm and free GFP in the cytoplasm; C and D, brightfield and corresponding fluorescence image of a partially plasmolyzed onion epidermal cell expressing MtPT3:GFP. Arrow indicates GFP fluorescence in the plasma membrane (pm) and Hechtian strands (h). E, brightfield image of M. sativa leaf epidermis showing epidermal cells (e). F–H, fluorescence images of single M. sativa epidermal cells expressing free GFP and fusion proteins. F, M. sativa epidermal cell expressing free GFP; G, M. sativa epidermal cell expressing MtPT3:GFP; H, M. sativa epidermal cell expressing MtPT5:GFP. Nucleus (n), cell wall (cw), and plasma membrane (pm) are indicated. Bar: D = 50 μm and is representative of A–D. Bars in F–H = 10 μm.
In addition, expression of the fusion proteins was evaluated in M. sativa epidermal cells. In Fig. 4E, a brightfield image of the epidermis reveals the characteristic irregular shapes of the epidermal cells. A cell expressing free GFP (Fig. 4F) shows green fluorescence characteristic of cytosolic GFP. The width of the fluorescent zone is uneven and the nucleus shows fluorescence. This is typical of cells expressing free GFP as the small GFP protein diffuses through the nuclear pore (32). In contrast, epidermal cells expressing MtPT3:GFP and MtPT5:GFP fusion proteins (Fig. 4, G and H) show a very narrow band of fluorescence around the periphery of the cell, typical of proteins associated with the plasma membrane. Based on expression observed in these two cell types, it is concluded that MtPT3 and MtPT5 are located in the plasma membrane of the cell.
To determine the Pi transport activities of MtPT3 and MtPT5 and to compare the activities of all four Pi transporter proteins, the coding sequences were cloned into a yeast expression vector, under the control of the yeast alcohol dehydrogenase promoter. The constructs were introduced into a yeast Pi transport mutant PAM2, which lacks two high affinity Pi transporter genes, PHO84 and PHO89 (39). Cells expressing MtPT3 and MtPT5 grew faster than cells harboring the empty vector (Fig. 5A). Pi uptake into yeast cells expressing the various transporters was monitored using 33Pi. As observed previously for MtPT1, yeast cells expressing the transporters show Pi uptake that follows Michaelis-Menten kinetics (Fig. 5B and supplemental materials Fig. S3). The transport activities of MtPT1, MtPT2, and MtPT3 were similar with apparent Km values for 587 ± 60, 641 ± 64, and 858 ± 91 μm, respectively. In contrast, MtPT5 exhibited a very low apparent Km of 13 ± 2 μm, a value similar to that of the high affinity transporters of yeast and Neurospora crassa. MtPT3 Pi transport activity was highest at pH 3–4, whereas Pi transport mediated by MtPT5 was optimal at pH 4–6 (Fig. 5C). It might be argued that the difference in transport activity of MtPT5 relative to the other 3 transporters is the result of a difference in the localization of the proteins in yeast, rather than an intrinsic difference in the transport activity of the proteins. To examine the locations of MtPT5 and MtPT3 in yeast, MtPT3:GFP and MtPT5:GFP gene fusions were transferred to the yeast expression vector and introduced into the yeast PAM2 strain. Yeast cells expressing the MtPT3: GFP and MtPT5:GFP showed an increase in growth rate relative to yeast cells expressing the empty vector. Moreover, the growth rates were similar to the yeast cells expressing the non-tagged versions of the proteins. Consequently, it was concluded that the tagged proteins were functional in yeast (supplemental materials Fig. S4). Yeast cells expressing the MtPT3:GFP and MtPT5:GFP showed green fluorescence around the periphery of the cell indicating that the proteins are targeted to the plasma membrane in yeast (supplemental materials Fig. S5). In addition, in both cases, yeast cells also showed fluorescent signals in an endomembrane compartment, most likely the endoplasmic reticulum. Previous studies of tagged membrane transporters overexpressed in yeast have noted retention of some protein molecules in the endoplasmic reticulum and this occurs to a greater or lesser extent depending on the transporter proteins involved (46). In our case, both MtPT5 and MtPT3 proteins were detected in the plasma membrane suggesting that the differences observed in phosphate transport activities are a consequence of inherent differences in the proteins and not the result of differences in their locations in yeast.
FIGURE 5.
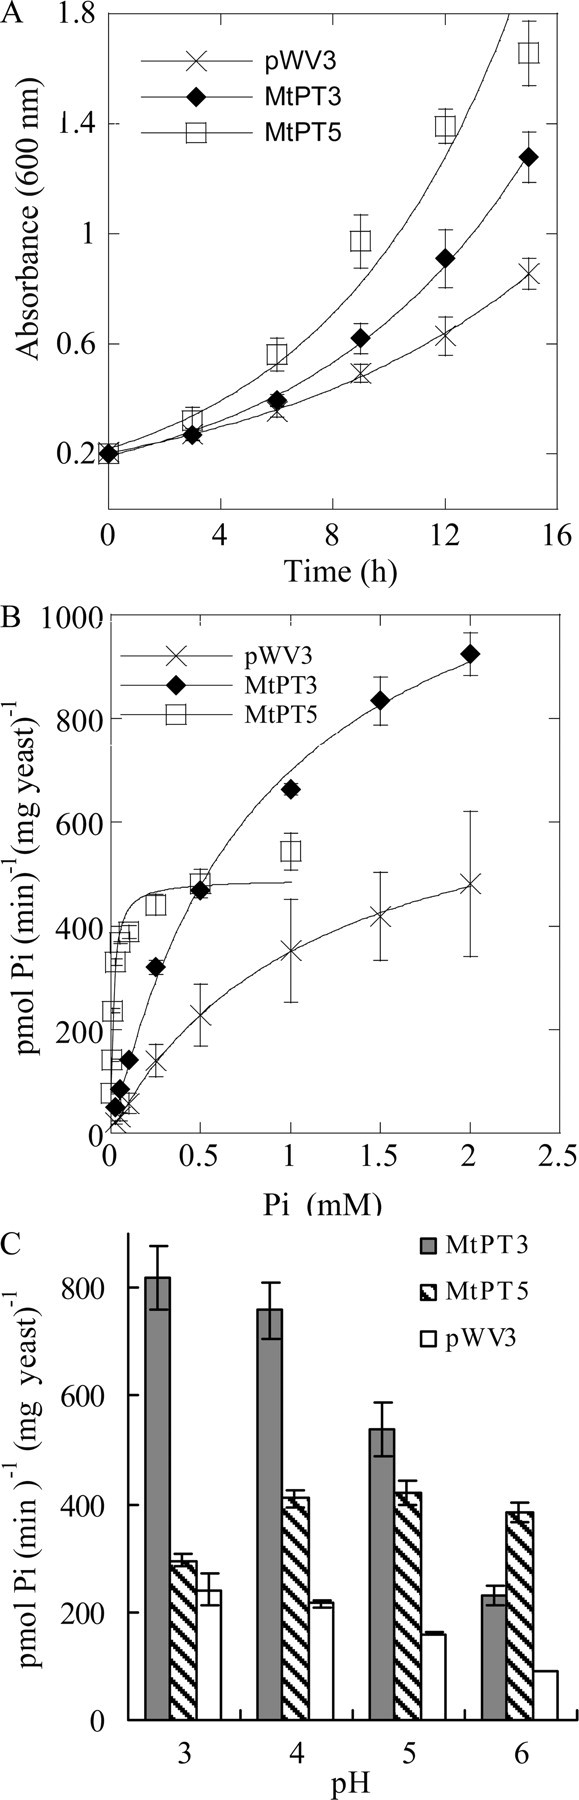
Phosphate transport properties of MtPT3 and MtPT5 in yeast. A, comparison of yeast growth rate. Yeast PAM2 cells expressing MtPT3, MtPT5, or the pWV3 vector control were grown in synthetic dextrose medium containing 0.22 mm Pi and 25 mm sodium citrate buffer at pH 4.5. A600 value was monitored as a measurement of growth. Values shown are the mean ± S.D. for three independent experiments. B, phosphate uptake rate as a function of external phosphate concentration. Phosphate uptake rates of yeast PAM2 cells carrying MtPT3, MtPT5, or the pWV3 vector control were measured at pH 4.0 with different external phosphate concentrations. Values are the means from two independent experiments ± S.D., each with duplicate samples. Lines are derived from nonlinear regression analysis. C, phosphate uptake rate as a function of external pH value. The phosphate uptake rate of yeast PAM2 cells expressing MtPT3 (gray bars), MtPT5 (cross-hatched bars), or carrying the pWV3 vector control (open bars) was determined at the indicated pH values. Values from one of three independent experiments are shown, mean ± S.D. for three time point replicates.
DISCUSSION
In the M. truncatula genome, MtPT1, MtPT2, and MtPT3 are located within a 260-kb region on chromosome 1, whereas MtPT5 is located ∼7600 kb to the south of this region. The high level of sequence identity shared by MtPT1, MtPT2, MtPT3, and MtPT5, the conservation of intron positions and genome locations support the suggestion that they arose through gene duplication events. Consistent with the gene duplication and subfunctionalization model (47), the four genes show partially overlapping but distinct tissue-specific expression patterns and/or different activities. MtPT2 is expressed in epidermis, cortex, and vascular tissue, whereas MtPT1 shows the same expression pattern but lacks expression in the vascular tissue, and MtPT3 shows expression only in the vascular tissue. MtPT5 is expressed in the epidermis and cortex but shows functional specialization. Each of these four M. truncatula genes has an intron in the 5′-UTR but no introns in the coding region of the genes. In the case of MtPT1, the intron is relatively small, only 327 bp, whereas in MtPT2, MtPT3, and MtPT5, the introns are large 1156, 2048, and 1740 bp, respectively. Reciprocal BLAST analysis indicates that Arabidopsis Pht1;1, Pht1;4, and Pht1;7 share the greatest sequence identity with the M. truncatula transporters (21). It is difficult to determine orthology, as duplication events have led to differential expansion of the families in each species (supplemental materials Fig. S1); however, both Pht1;1 and Pht1;4 also contain large introns in the 5′-UTR. A general analysis of the size, abundance, and distribution of introns in the 5′-UTRs of genes in Arabidopsis, indicate a median intron size of 268 bp (48). Consequently, the very large introns in the Pi transporter gene 5′-UTRs are quite unusual and their conservation raises the possibility that they have a regulatory function. The expression patterns of the MtPT3 promoter-UidA fusion constructs further supports this idea and suggest that negative regulatory elements reside in the MtPT3 2048-bp intron and/or 5′-UTR. In Arabidopsis, Pi starvation-regulated gene expression is controlled partially through the action of microRNAs. For example, PHO2, aPi starvation-regulated gene, has two introns in the 5′-UTR, and transcript levels are regulated in part by a microRNA whose target sites are in the 5′-UTR (49, 50).
In addition to their differing spatial expression patterns, the MtPT genes respond differently to changes in Pi levels in the environment. MtPT5 transcript levels decrease rapidly in response to high Pi levels, whereas MtPT3 transcript levels decline more slowly, as do MtPT1/MtPT2 transcript levels. Similar to MtPT1/MtPT2, MtPT3 expression is down-regulated in mycorrhizal roots. Previously, it was assumed that the decrease in MtPT1 and MtPT2 transcript levels in mycorrhizal roots was a consequence of an increase in the Pi level, which occurs as Pi is delivered to the roots by the AM fungal symbiont (15, 32). The MtPT5 expression patterns reported here suggest that this simple explanation may not be correct. As shown in the Pi experiment (Fig. 2), MtPT5 expression is very sensitive to increases in Pi, yet in mycorrhizal roots, MtPT5 transcript levels do not show a significant change, and strong MtPT5 promoter activity was apparent in the cortex and root hairs of highly colonized mycorrhizal roots. Clearly, the signal, or down-regulatory mechanism that results in a decrease in MtPT1, MtPT2, and MtPT3 expression does not act on MtPT5.
The MtPT5 expression pattern is also important in light of discussions about Pi transport in the AM symbiosis. Previous data indicate that during an AM symbiosis, plants activate symbiosis-associated Pi transporters to obtain Pi delivered by the AM fungal symbiont, and gradually down-regulate expression of their root Pi transporter genes (2, 15, 16, 27, 32, 51). Whereas this pattern of gene expression has been reported for a number of plant species, it may not be universal (22). The data presented here reveal that in M. truncatula not all of the root epidermal/cortical cell transporters are down-regulated during an AM symbiosis. Thus expression of a high affinity Pi transporter is maintained at the root-soil interface during the AM symbiosis, even in highly colonized mycorrhizal roots.
Yeast Pi transport mutants impaired in their ability to acquire Pi have provided a useful system in which to analyze the Pi transport activity of plant Pi transporters. The transport activities of the Pi transporters from M. truncatula, Arabidopsis, potato, and tomato analyzed in this system showed apparent Km values between 31 and 668 μm (11, 13, 15, 27, 30). Initially, these results triggered debate of the validity of the yeast system because it had been assumed that the plant Pi transporter genes would encode high affinity transporters and it was expected that they would show Km values similar to the high affinity transporters of yeast and N. crassa (52, 53). As shown by the data presented here, M. truncatula has at least one Pi transporter, MtPT5, that shows a high affinity for Pi when expressed in yeast. The apparent Km of 13 μm is similar to that of the PHO84 transporter of yeast, which shows a Km for Pi of 8 μm, and to Km values of Pi transporters from Arabidopsis and barley as assessed in plant cell cultures (24, 28). In contrast, the MtPT1, MtPT2, and MtPT3 transporters show a moderate to low affinity for Pi with apparent Km values in the 500–800 μm range. Given the relatively high level of sequence identity between MtPT5 and the other three transporters, the striking difference in transport activity is particularly interesting.
The PHT1 family transporters are members of the major facilitator superfamily and each protein has 12 transmembrane α helices and a large cytosolic loop region between transmembrane helices 6 and 7 (54). In MtPT5, transmembrane domains 8, 11, 4, and 1 are identical in sequence to those of MtPT1, MtPT2, and MtPT3 (supplemental materials Fig. S6). MtPT5 transmembrane domains 3, 12, and the beginning of transmembrane domain 7 differ the most from those of MtPT1, MtPT2, and MtPT3, although the changes are all conservative changes.
Apart from the extreme C-terminal tail of the proteins, which differs slightly in all four Pi transporter proteins, there are only 7 positions in which the amino acid residues in MtPT5 differ substantially (a non-conservative change) from those in MtPT1, MtPT2, and MtPT3 (supplemental materials Fig. S6). When examined on a model, of MtPT5, the variable residues are predicted to cluster in two regions of the protein. One region is predicted to be on the extracellular face of the plasma membrane and the other is predicted to be located in the membrane (supplemental materials Fig. S7). Currently, we can only speculate that these two regions influence the affinity of the protein for Pi; however, the information provides a useful guide for future studies.
In summary, these analyses have revealed differences in the spatial expression patterns, regulation, and biochemical activities of four closely related M. truncatula Pi transporters of the PHT1 family. The data indicate that gene duplication and specialization has resulted in Pi transporter gene expression in a wide array of cell types and during growth in a variety of Pi conditions. In addition, functional specialization has provided the plant with both high and low affinity transport activities and thus maximizes the transport capacity in different environments. The sequence differences between MtPT5 and MtPT1, MtPT2 and MtPT3 provide the first insights into residues and regions of the protein that may influence Pi transport activity.
Supplementary Material
Acknowledgments
We thank Jie Huang for technical assistance with the identification of the MtPT5 cDNA and Dr. D. Ripoll, Computational Biology Service Unit, Cornell University, for development of the MtPT5 model.
The work was supported by United States National Science Foundation Grant IBN-0343975 and The Samuel Roberts Noble Foundation. Microscopy analyses were carried out in the BTI Plant Cell Imaging Center using instrumentation purchased with an award from National Science Foundation Grant DBI-0618969. The costs of publication of this article were defrayed in part by the payment of page charges. This article must therefore be hereby marked “advertisement” in accordance with 18 U.S.C. Section 1734 solely to indicate this fact.
The on-line version of this article (available at http://www.jbc.org) contains supplemental Figs. S1–S7 and Table S1.
Footnotes
The abbreviations used are: AM, arbuscular mycorrhizal; UTR, untranslated region; GUS, β-glucuronidase; GFP, green fluorescent protein.
References
- 1.Schachtman, D. P., Reid, R. J., and Ayling, S. M. (1998) Plant Physiol. 116 447-453 [DOI] [PMC free article] [PubMed] [Google Scholar]
- 2.Bucher, M. (2007) New Phytol. 173 11-26 [DOI] [PubMed] [Google Scholar]
- 3.Raghothama, K. (1999) Annu. Rev. Plant Physiol. Mol. Biol. 50 665-693 [DOI] [PubMed] [Google Scholar]
- 4.Smith, S. E., and Read, D. J. (eds) (1997) Mycorrhizal Symbiosis, Academic Press, Inc., San Diego, CA
- 5.Harrison, M. J. (2005) Annu. Rev. Microbiol. 59 19-42 [DOI] [PubMed] [Google Scholar]
- 6.Karandashov, V., and Bucher, M. (2005) Trends Plant Sci. 10 22-29 [DOI] [PubMed] [Google Scholar]
- 7.Rausch, C., and Bucher, M. (2002) Planta 216 23-37 [DOI] [PubMed] [Google Scholar]
- 8.Picault, N., Hodges, M., Paimieri, L., and Palmieri, F. (2004) Trends Plant Sci. 9 138-146 [DOI] [PubMed] [Google Scholar]
- 9.Knappe, S., Flugge, U. I., and Fischer, K. (2003) Plant Physiol. 131 1178-1190 [DOI] [PMC free article] [PubMed] [Google Scholar]
- 10.Guo, B., Jin, Y., Wussler, C., Blancaflor, E. B., Motes, C. M., and Versaw, W. K. (2008) New Phytol. 177 889-898 [DOI] [PubMed] [Google Scholar]
- 11.Leggewie, G., Willmitzer, L., and Riesmeier, J. W. (1997) Plant Cell 9 381-392 [DOI] [PMC free article] [PubMed] [Google Scholar]
- 12.Muchhal, U. S., Pardo, J. M., and Raghathama, K. G. (1996) Proc. Natl. Acad. Sci. U. S. A. 93 101519-110523 [DOI] [PMC free article] [PubMed] [Google Scholar]
- 13.Daram, P., Brunner, S., Persson, B. L., Amrhein, N., and Bucher, M. (1998) Planta 206 225-233 [DOI] [PubMed] [Google Scholar]
- 14.Liu, C., Muchhal, U. S., Uthappa, M., Kononowicz, A. K., and Raghothama, K. G. (1998) Plant Physiol. 116 91-99 [DOI] [PMC free article] [PubMed] [Google Scholar]
- 15.Liu, H., Trieu, A. T., Blaylock, L. A., and Harrison, M. J. (1998) Mol. Plant-Microbe Interact. 11 14-22 [DOI] [PubMed] [Google Scholar]
- 16.Paszkowski, U., Kroken, S., Roux, C., and Briggs, S. P. (2002) Proc. Natl. Acad. Sci. U. S. A. 99 13324-13329 [DOI] [PMC free article] [PubMed] [Google Scholar]
- 17.Okumura, S., Mitsukawa, N., Shirano, Y., and Shibata, D. (1998) DNA Res. 5 261-269 [DOI] [PubMed] [Google Scholar]
- 18.Smith, F. W., Ealing, P. M., Dong, B., and Delhaize, E. (1997) Plant J. 11 83-92 [DOI] [PubMed] [Google Scholar]
- 19.Nagy, R., Vasconcelos, M. J. V., Zhao, S., McElver, J., Bruce, W., Amrhein, N., Raghothama, K. G., and Bucher, M. (2006) Plant Biol. 8 186-197 [DOI] [PubMed] [Google Scholar]
- 20.Chen, A. Q., Hu, J., Sun, S. B., and Xu, G. H. (2007) New Phytol. 173 817-831 [DOI] [PubMed] [Google Scholar]
- 21.Mudge, S. R., Rae, A. L., Diatloff, E., and Smith, F. W. (2002) Plant J. 31 341-353 [DOI] [PubMed] [Google Scholar]
- 22.Balestrini, R., Gomez-Ariza, J., Lanfranco, L., and Bonfante, P. (2007) Mol. Plant-Microbe Interact. 20 1055-1062 [DOI] [PubMed] [Google Scholar]
- 23.Nagy, F., Karandashov, V., Chague, W., Kalinkevich, K., Tamasloukht, M., Xu, G. H., Jakobsen, I., Levy, A. A., Amrhein, N., and Bucher, M. (2005) Plant J. 42 236-250 [DOI] [PubMed] [Google Scholar]
- 24.Rae, A. L., Cybinski, D. H., Jarmey, J. M., and Smith, F. W. (2003) Plant Mol. Biol. 53 27-36 [DOI] [PubMed] [Google Scholar]
- 25.Glassop, D., Smith, S. E., and Smith, F. W. (2005) Planta 222 688-698 [DOI] [PubMed] [Google Scholar]
- 26.Kai, M., Takazumi, K., Adachi, H., Wasaki, J., Shinano, T., and Osaki, M. (2002) Plant Sci. 163 837-846 [Google Scholar]
- 27.Harrison, M. J., Dewbre, G. R., and Liu, J. (2002) Plant Cell 14 2413-2429 [DOI] [PMC free article] [PubMed] [Google Scholar]
- 28.Mitsukawa, N., Okumura, S., Shirano, Y., Sato, S., Kato, T., Harashima, S., and Shibata, D. (1997) Proc. Natl. Acad. Sci. U. S. A. 94 7098-7102 [DOI] [PMC free article] [PubMed] [Google Scholar]
- 29.Shin, H., Shin, H. S., Dewbre, G. R., and Harrison, M. J. (2004) Plant J. 39 629-642 [DOI] [PubMed] [Google Scholar]
- 30.Javot, H., Pumplin, N., and Harrison, M. J. (2007) Plant Cell Environ. 30 310-322 [DOI] [PubMed] [Google Scholar]
- 31.Javot, H., Penmetsa, R. V., Terzaghi, N., Cook, D. R., and Harrison, M. J. (2007) Proc. Natl. Acad. Sci. U. S. A. 104 1720-1725 [DOI] [PMC free article] [PubMed] [Google Scholar]
- 32.Chiou, T. J., Liu, H., and Harrison, M. J. (2001) Plant J. 25 1-15 [DOI] [PubMed] [Google Scholar]
- 33.Ames, B. N. (1966) Methods Enzymol. 8 115-118 [Google Scholar]
- 34.Liu, J., Blaylock, L., Endre, G., Cho, J., Town, C. D., VandenBosch, K., and Harrison, M. J. (2003) Plant Cell 15 2106-2123 [DOI] [PMC free article] [PubMed] [Google Scholar]
- 35.Liu, J., Blaylock, L., and Harrison, M. J. (2004) Can. J. Bot. 82 1177-1185 [Google Scholar]
- 36.Boisson-Dernier, A., Chabaud, M., Garcia, F., Becard, G., Rosenberg, C., and Barker, D. G. (2001) Mol. Plant-Microbe Interact. 14 695-700 [DOI] [PubMed] [Google Scholar]
- 37.Chiu, W.-l., Niwa, Y., Zeng, W., Hirano, T., Kobayashi, H., and Sheen, J. (1996) Curr. Biol. 6 325-330 [DOI] [PubMed] [Google Scholar]
- 38.Versaw, W. K., and Harrison, M. J. (2002) Plant Cell 14 1751-1766 [DOI] [PMC free article] [PubMed] [Google Scholar]
- 39.Martinez, P., and Persson, B. L. (1998) Mol. Gen. Genet. 258 628-638 [DOI] [PubMed] [Google Scholar]
- 40.Zhao, L., Versaw, W. K., Liu, J., and Harrison, M. J. (2003) New Phytol. 157 291-302 [DOI] [PubMed] [Google Scholar]
- 41.Xiao, K., Liu, J., Dewbre, G., Harrison, M., and Wang, Z.-Y. (2006) Plant Biol. 439-449 [DOI] [PubMed]
- 42.Scott, A., Wyatt, S., Tsou, P. L., Robertson, D., and Allen, N. S. (1999) BioTechniques 26 1125. [DOI] [PubMed] [Google Scholar]
- 43.Lang-Pauluzzi, I. (2000) J. Microsc. (Oxf.) 198 188-198 [DOI] [PubMed] [Google Scholar]
- 44.Lang, I., Barton, D. A., and Overall, R. L. (2004) Protoplasma 224 231-243 [DOI] [PubMed] [Google Scholar]
- 45.Yang, J., and Showalter, A. M. (2007) Planta 226 169-179 [DOI] [PubMed] [Google Scholar]
- 46.Froissard, M., Belgareh-Touze, N., Buisson, N., Desimone, M., Frommer, W. B., and Haguenauer-Tsapis, R. (2006) Biotechnol. J. 1 308-320 [DOI] [PubMed] [Google Scholar]
- 47.Lynch, M., and Force, A. (2000) Genetics 154 459-473 [DOI] [PMC free article] [PubMed] [Google Scholar]
- 48.Hong, X., Scofield, D. G., and Lynch, M. (2006) Mol. Biol. Evol. 23 2392-2404 [DOI] [PubMed] [Google Scholar]
- 49.Bari, R., Pant, B. D., Stitt, M., and Scheible, W. R. (2006) Plant Physiol. 141 988-999 [DOI] [PMC free article] [PubMed] [Google Scholar]
- 50.Aung, K., Lin, S. I., Wu, C. C., Huang, Y. T., Su, C. L., and Chiou, T. J. (2006) Plant Physiol. 141 1000-1011 [DOI] [PMC free article] [PubMed] [Google Scholar]
- 51.Rausch, C., Daram, P., Brunner, S., Jansa, J., Laloi, M., Leggewie, G., Amrhein, N., and Bucher, M. (2001) Nature 414 462-466 [DOI] [PubMed] [Google Scholar]
- 52.Bun-ya, M., Nishimura, M., Harashima, S., and Oshima, Y. (1991) Mol. Cell. Biol. 11 3229-3238 [DOI] [PMC free article] [PubMed] [Google Scholar]
- 53.Versaw, W. K. (1995) Gene (Amst.) 153 135-139 [DOI] [PubMed] [Google Scholar]
- 54.Saier, M. H., Jr., Beatty, J. T., Goffeau, A., Harley, K. T., Heijne, W. H., Huang, S. C., Jack, D. L., Jahn, P. S., Lew, K., Liu, J., Pao, S. S., Paulsen, I. T., Tseng, T. T., and Virk, P. S. (1999) J. Mol. Microbiol. Biotechnol. 1 257-279 [PubMed] [Google Scholar]
Associated Data
This section collects any data citations, data availability statements, or supplementary materials included in this article.