

Abstract
Among peripheral regulatory T cells, CD8+ T cells also play an important role in the maintenance of immune homeostasis. A subset of CD8+ Treg that express αβTCR and CD8αα homodimers can recognize TCR-derived peptides in the context of the class Ib MHC molecule Qa-1. To gain a better understanding of the nature and phenotype of CD8αα+TCRαβ+ Treg, a global gene expression profiling using microarray, real-time quantitative PCR, and flowcytometry analysis was performed using functional Treg clones and lines. Our data show that CD8+ Treg shared gene profile expressed by innate-like lymphocytes, including murine intraepithelial lymphocytes and thymic CD8αα+TCRαβ+ T cell populations. Additionally, this subset displays differential expression of several key regulatory molecules, including CD200. CD8αα+ Treg expressed higher levels of a number of NK cell related receptors and molecules belonging to the TNF superfamily. Collectively, peripheral class Ib-reactive CD8αα+TCRαβ+ T cells represent a unique regulatory population different from class Ia MHC-restricted conventional T cells. These studies have important implications for the regulatory mechanisms mediated by the CD8+ Treg population in general.
Keywords: CD8+ Treg, EAE, Microarray, Innate cells, Qa-1/HLA-E
Introduction
Among peripheral immune regulatory mechanisms, regulatory T cells (Treg) play a crucial role in the control of self-reactive, potentially pathogenic mature T cells (1, 2). Treg populations can be generally divided into several subgroups depending on the expression of different molecules, including co-receptors, CD4, or CD8, and can control immune responses in either an antigen-specific or -non-specific manner. In addition to naturally occurring Treg populations, including CD4+CD25+FoxP3+ T cells and NKT cells, CD8+ Tregs have also been described both in rodents and in humans (3, 4) and Human Immunology 2008, Vol. 69, issue 11). A detailed understanding of phenotypes and biology of different CD8+ Tregs is not well-understood.
MHC class Ib molecules, including Qa-1, Qa-2, H2-M3, and CD1d in rodents and HLA-E, HLA-G, and CD1 in humans, differ from MHC class Ia molecules in that they have limited polymorphism (5). MHC class Ib molecules have been shown to present both self-antigens as well as foreign antigens derived from a number of pathogens (6, 7). Class Ib-restricted CD8+ T cells have been shown to be involved in host defense, antitumor immunity (8-10) and in immune regulation mechanisms (11-14). MHC class Ib-restricted T cells appear to differ from MHC class Ia-restricted T cells in the following ways: 1) they generally have an activated phenotype and are CD44high; 2) they are selected by hematopoietic cells (15), 3) they can be activated in the periphery by their thymic selecting ligand/agonist; 4) they rapidly produce cytokines upon activation (16); and 5) their gene expression phenotype has special features differing from that of adaptive T cells (17, 18).
Although, regulatory CD8+ T cells restricted by MHC class 1b molecules, Qa-1 in mouse and HLA-E in humans have recently been described (12, 19, 20), details of the cell surface phenotype and regulatory mechanisms have not been well characterized. We have identified a subset of Qa-1-restricted CD8αα+TCRαβ+ Treg population (referred to as CD8αα+ Treg) that recognizes an antigenic determinant in the conserved CDR2 region of the TCR Vβ8.2 chain (4, 14, 21-23) and control experimental autoimmune encephalomyelitis (EAE), a prototype for multiple sclerosis (14, 23). We have demonstrated that CD8αα+ Treg control disease by inducing apoptosis in activated, pathogenic CD4+ T cells following recognition of the TCR-peptide/Qa-1 complex on their cell surface (4, 14, 22, 23). Furthermore, mechanism of killing by CD8αα+ Treg was dependent upon IFN-γ and perforin pathway (24).
To better understand the phenotype and regulatory mechanisms involved in the immune regulation mediated by CD8αα+ Treg, we have recently generated and characterized several CD8αα+TCRαβ+ T cell clones and lines that are physiologically primed by an antigenic determinant in the conserved CDR2 region of the TCR Vβ8.2 chain and are involved in recovery and protection from EAE (4, 14, 21-23). Here we have compared global gene expression patterns in cloned populations of CD8αα+TCRαβ+ Treg versus conventional CD8αβ+TCRαβ+ T cells (Tconv). The results of microarray data analysis were further confirmed by real-time PCR and flow cytometric analysis. Our study reveals a unique gene expression signature in the CD8αα+ Treg characterized by an enhanced expression of several inhibitory molecules associated with the maintenance of peripheral T cell regulation and homeostasis, as well as molecules typical of innate-like lymphocytes. These data have important implications for the identification as well as further characterization of the regulatory T cell repertoire with special emphasis on role of inhibitory pathways in immune regulation.
Materials and Methods
Animals
B10.PL and PL/J mice (H-2u) were purchased from The Jackson Laboratory and bred under specific pathogen-free conditions in our own colony at Torrey Pines Institute for Molecular Studies (San Diego, CA). Ova-reactive OT-1 TCR transgenic and MBP-reactive Vβ8.2 TCR transgenic mice were kindly provided by Drs. S.P. Schoenberger (LIAI, San Diego) and Juan Lafaille (NYU, New York), respectively. Aged-matched female mice from 6 to 14 wk of age were used in all experiments. Experiments involving animals were performed in compliance with federal and institutional guidelines and have been approved by the Institutional Animal Care and Use Committee of the Torrey Pines Institute for Molecular Studies.
Generation of regulatory CD8αα+TCRαβ+ T cell lines and clones
Regulatory CD8αα+TCRαβ+ T cell lines (XT-14, PL-1) and clones (2D11, 1C9) have been generated and characterized as described earlier (4, 14, 21-23). Briefly, groups of mice were immunized subcutaneously with the peptide p42–50 (20 μg/mouse) of the Vβ8 TCR chain, and draining lymph node cells were cultured with p42-50-pulsed irradiated splenocytes in complete DMEM medium containing 20% FBS. The resulting cultures were then cloned at 100 or 1000 cells/well in the presence of 10 IU of IL-2 and p42–50 pulsed irradiated syngenic splenocytes. To generate CD8αα+ Treg lines, the re-stimulated draining lymph node cells were expanded using and 2% conditioned-medium in 24-well plates. Conditioned medium contained IL-2 (50 IU/ml), IL-15 (2 IU/ml) and Con A/MLR supernatant (4%). The lines were supplemented with fresh medium every 3 to 4 days and re-stimulated with p42–50-pulsed irradiated splenocytes every two weeks. To generate SIINFEKL (OVAp257-264)-specific CTL clones, splenocytes from OT-1 transgenic mice (25) were stimulated with an engineered fibroblast cell line, MEC.B7.SigOVA. Clonality was confirmed by staining with specific antibodies and by flow cytometry using anti-CD8α, anti-CD8β, anti-TCR-β and anti-Vβ6 (for Treg) and anti-Vβ5/Vα2 (for OVA) mAbs. MBPAc1-9-reactive T cells (3C10) were generated following peptide immunization from wild-type B10.PL (H-2u) animals or following in vitro challenge of splenocytes derived from a Vβ8.2-TCR-transgenic B10.PL mice, essentially as described before (14, 26, 27). Both OVA- and MBP-reactive cloned T cells were cultured under identical conditions.
Microarray Gene Expression Analysis
Total RNA was isolated from T cell lines and clones generated from different mice using RNAqueous reagents (Ambion). Briefly, following lysis of frozen cell pellets with lysis regent, equal volume of 64% ETOH buffer was added, mixed by pipetting and transferred to columns and centrifuged @ 14,000 RPM for 30 seconds. After washing, RNA was eluted twice with warm elution buffer, EB, (75°C) by centrifugation and concentration estimated in UV-spectrophotometer and the quality was evaluated using formaldehyde/agarose RNA gels. RNA was used to generate biotinylated cRNA for hybridization to mouse GeneChip Genome 430 2.0 Array (Affymetrix, Santa Clara, CA) using GeneChip one-cycle target labeling and control reagents (Affymetrix, Santa Clara, CA) in accordance with the manufacturer’s protocol.
GCRMA was used for background correction, quantile normalization and summarization [1]. This method uses probe sequence information to estimate probe affinity to non-specific binding. One way ANOVA statistical analysis of the microarray data was performed. Benjamini-Hochberg false discovery rate (FDR) method with a specified p-value cutoff (or error rate) of 0.05 and a fold change >2 was used to obtain differentially expressed probe sets, as described earlier (28).
Real-time PCR Analysis
Total mRNA was extracted from cells using RNeasy mini kit (Qiagen), and subjected to cDNA synthesis using oligo(dT)12-18 primer. Real-time PCR was performed to detect enrichment of genes using the Brilliant SYBR Green quantitative PCR kit (Stratagene) on a Stratagene Mx3000p machine. Each PCR contained 2 μl of cDNA, 25 μl of 2X Brilliant SYBR Green QPCR Master Mix (Stratagene), 1 μl of forward and reverse primers (10 μM), 0.75 μl of ROX Reference Dye (Stratagene), and 20.25 μl of sterile water. A typical cycle was as follows: denatured at 95°C for 11 min, 40 × 2.25-min cycles (45 s at 95°C, 45 s at 60°C, and 45 s at 72°C), and 10 min of incubation at 72°C. The calculation of comparative mRNA expression was designated as relative quantity after normalization against an internal control gene (L32) and after consideration of the amplification efficiency of individual genes.
All gene-specific primers were designed using Primer3 software of Rozen and Skaletsky. Each primer pair is picked using standard Primer3 parameters to be 18bp-22bp in length and have melting temperature between 59°C and 61°C. Major primers used in the above studies include: L32 sense (5′-GAAACTGGCGGAAACCCA-3′) and L32 antisense (5′-GGATCTGGCCCTTGAACCTT-3′); TCR-Vβ6 sense (5′-CTCTCACTGTGACATCTGCCC-3′); and Cβ145 antisense (5′-ACTGATGTTCTGTGTGACA-3′)
Flow cytometry analysis
Briefly, 1–4 × 10⁵ cells per 100 μl were incubated with relevant Abs at 4°C for 30 min. Cells were then washed twice with FACS buffer containing 1% FCS and 0.05% sodium azide and analyzed on a BD Biosciences FACSCalibur. Abs were purchased from BD Pharmingen include 145-2C11 (anti-CD3), 53-6-7 (anti-CD8α), 53-5.8 (anti-CD8β.2), H1.2F3 (anti-CD69), and RR4-7 (anti-TCR Vβ6). Rat anti-mouse CD200:FITC. Clone OX-90 Ab (anti-CD200) was purchased from Serotec. Other antibodies were acquired from e-Bioscinces. Staining and flowcytometry analysis was essentially carried out as described earlier (14, 23).
Results
Microarray gene analysis of the regulatory CD8αα+TCRαβ+ vs. non-regulatory CDαβ+TCRαβ+T cells
A detailed phenotype and gene expression profile of CD8+ Treg is not known. To determine specific cell surface markers on Treg, microarray gene analysis of long-term functional CD8αα+ Treg clones was undertaken and compared to non-regulatory “conventional” T cells. Suppressor activity of CD8+ Treg clones and lines used in the present study has already been reported earlier and showed their ability to kill only activated target T cells in in vitro as well as in vivo studies. Furthermore, upon adoptive transfer, CD8αα+ Treg lines and clones significantly suppress EAE (14, 23, 29). Usage of clonal populations enabled us to avoid potential contamination from non-regulatory cells. Additionally, to ensure that the phenotype was not unique to these functional clones, we analyzed additional short-term CD8αα+ Treg cell lines for the expression of selected RNA transcripts using realtime quantitative PCR. Differential gene expression at the clonal level was determined between a functional CD8αα+TCRαβ+ Treg (2D11) (14, 22) and OVA-reactive CD8αβ+TCRαβ+ T cells (OT-1), cultured under identical conditions in the presence of their respective antigen and IL-2. The total RNA isolated and then hybridized independently to an Affymetrix MOE 430 2.0 Array that has 45,101 probe-sets roughly corresponding to 35,000 genes. The data were normalized using GCRMA, followed by one-way ANOVA and FDRCI analysis, resulting in 562 differentially expressed probe sets corresponding to 461 genes. Interestingly, 188 genes showed increased (>2 fold) and 273 genes showed decreased (>2 fold) expression in 2D11 in comparison to OT-1. These genes can be classified into functional classes according to their involvement in immune/defense responses, metabolism, signal transduction, transport, transcription, cell-death/growth and cell-adhesion. Hierarchical cluster analysis of these genes (Fig. 1) revealed a unique set of up- or down-regulated genes in CD8αα+ Treg, suggesting a specific molecular signature compared to CD8αβ+ T cells. Notably, several genes that are relatively over-expressed in the CD4+CD25+FoxP3+ Treg population are downregulated in CD8αα+ Treg, including IL-2Rα (CD25) and Lag3. Scatter plots displaying values of normalized signal intensities for these genes are shown as a distance from the diagonal (Fig. 1). The center diagonal indicates no change and the outer lines indicate a 3-fold expression difference. The points in the scatter plot are colored by the normalized signal values of the control cell line.
FIGURE 1.

Scatter plot displays the log of raw intensity values for the genes of interest between CD8αα+TCRαβ+ Treg vs. conventional CD8αβ+TCRαβ+ T cell populations. Genes with a fold change expression greater then 2 are shown on the left and right hand side of the outer diagonals whereas the center diagonal indicates less than 2 fold change. Immunoregulatory genes are shown in red whereas the remaining ones are shown in blue. The complete microarray data has been submitted to the public database GEO: submission number GSE22985.
We then selected a number of differentially expressed genes on the CD8αα+ Treg for further validation by quantitative real-time PCR (qPCR) analysis (Table 1) as well as by flowcytometry analysis (Figure 3). Furthermore, to eliminate possible artifacts resulting from long term in vitro culture of clonal CD8αα+ Tregs, in parallel real-time PCR analysis was performed on freshly generated short-term antigen-reactive CD8αα+ Treg cell lines (XT-14, and PL1) (Figure 2). For most of the enriched genes, profiles among both Treg lines as well as another clone (1C9) were found to be similar to Treg clone 2D11. Furthermore, expression profiles of the differentially expressed genes among Ova-reactive T cells derived from H-2b mice vs. MBP-reactive T cells derived from the wild type or Vβ8.2-TCR transgenic B10.PL (H-2u) mice were quite similar (data not shown).
TABLE 1. Genes of immunological interest differentially expressed by CD8αα+TCRαβ+ Treg.
| CD8αα+ vs. CD8αβ+ |
Gene Name |
Gene Alias | Annotation | Entrez Gene ID |
|---|---|---|---|---|
| 574.94 | H2-D1 | H-2D | histocompatibility 2, D region locus 1 | 14964 |
| 114.25 | Xist | inactive X specific transcripts | 213742 | |
| 62.75 | H2-Q1 | Q1b; Q1d; Q1k; Qa-1 |
histocompatibility 2, Q region locus 1 | 15006 |
| 56.42 | Gpr15 | G protein-coupled receptor 15 | 71223 | |
| 33.55 | Tgfbr3 | TBRIII | transforming growth factor, beta receptor III | 21814 |
| 27.8 | Ctse | CE, CatE | cathepsin E | 13034 |
| 19.5 | St6galnac2 | Siat7, Siat7b | ST6 (alpha-N-acetyl-neuraminyl-2,3- beta- galactosyl-1,3)-N- acetylgalactosaminide alpha-2,6- sialyltransferase 2 |
20446 |
| 16.5 | B3gnt1 | iGAT, iGNT | UDP-GlcNAc:betaGal beta-1,3-N- acetyl- glucosaminyltransferase 1 |
108902 |
| 8.39 | Arhgap1 | Cdc42GAP | Rho GTPase activating protein 1 | 228359 |
| 8.06 | Sgne1 | 7B2 | secretogranin V | 20394 |
| 4.44 | Zfp537 | Tsh3, teashirt3 |
teashirt zinc finger family member 3 | 243931 |
| 4.33 | Ptger2 | EP2 | prostaglandin E receptor 2 | 19217 |
| 4.28 | Nr1d2 | RVR | nuclear receptor subfamily 1, group D, member 2 | 353187 |
| 4.24 | Itga6 | Cd49f | integrin alpha 6 | 16403 |
| 3.44 | Igf1r | CD221, | insulin-like growth factor I receptor | 16001 |
| 2.22 | CD80 | B7.1, Cd28l, Ly53, MIC17 |
CD80 antigen | 12519 |
| 2.10 | IL7r | CD127 | interleukin 7 receptor | 16197 |
| 0.43 | CD69 | AIM, VEA | CD69 antigen | 12515 |
| 0.41 | CD44 | HERMES, Ly- 24, Pgp-1 |
CD44 antigen | 12505 |
| 0.40 | Ccr5 | CD195, Cmkbr5 |
chemokine (C-C motif) receptor 5 | 12774 |
| 0.35 | Ahnak | DY6 | AHNAK nucleoprotein (desmoyokin) | 66395 |
| 0.30 | IL-10ra | mIL-10R | interleukin 10 receptor, alpha | 16154 |
| 0.19 | Fcgrt | FcRn | Fc receptor, IgG, alpha chain transporter | 14132 |
| 0.19 | Ly6c | Ly-6C, Ly6c | lymphocyte antigen 6 complex, locus C1 | 17067 |
| 0.19 | Lat2 | LAB, NTAL, Wbscr5 |
linker for activation of T cells family, member 2 | 56743 |
| 0.17 | Fut4 | CD15, FAL, LeX, |
fucosyltransferase 4 | 14345 |
| 0.13 | CD25 | Il2ra, Ly43, | interleukin 2 receptor, alpha chain | 16184 |
| 0.09 | Ifi30 | GILT, IP30 | interferon gamma inducible protein 30 | 65972 |
| 0.04 | Xdh | XO, Xor | xanthine dehydrogenase | 22436 |
| 0.04 | CD72 | Ly19, Ly32 | CD72 antigen | 12517 |
| 0.021 | Tm6sf1 | transmembrane 6 superfamily member 1 | 107769 | |
| 0.015 | Ifitm3 | Cd225, Fgls, | interferon induced transmembrane protein 3 | 66141 |
| 0.012 | Anxa2 | Cal1h | annexin A2 | 12306 |
| 0.004 | Plac8 | C15 | placenta-specific 8 | 231507 |
| 0.003 | Camk2b | calcium/calmodulin-dependent protein kinase II, beta |
12323 |
Values are expressed as normalized mRNA fold expression between CD8αα+ Treg clone 2D11 and CD8αβ+TCRαβ+ T cell clone OT-1 (CD8α vs. ). Data are sorted based on gene expression preference in CD8αα+ Treg populations.
FIGURE 3.
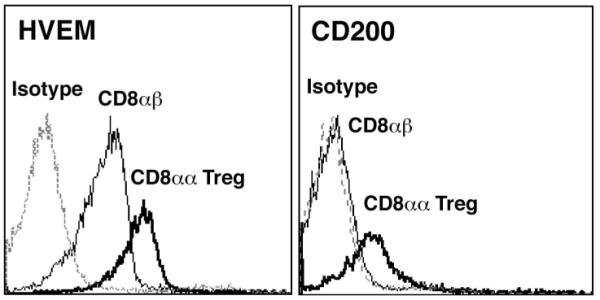

CD8αα+TCRαβ+ Treg showed elevated cell surface expression of immunoregulatory molecules CD200, HVEM (A) and Ly49 (B) cell surface molecules. CD8αα+TCRαβ+ Treg (2D11) and OVA-reactive CD8αβ+TCRαβ+T cells are stained with the indicated antibodies or relevant isotype controls and analyzed by flow cytometry. The thick line represents staining of CD8αα+TCRαβ+ Treg and the thin line represents staining of CD8αβ+TCRαβ+ T cells. An isotype control is also included and is represented by the dotted line. While y-axis denotes the % max fluorescence, x-axis shows fluorescence intensity relative to staining with anti-HVEM or anti-CD200 antibodies (3A) and several anti-Ly-49 markers as indicated on the top (3B). Data are representative of three independent experiments.
FIGURE 2.

Relative expression of some characteristic genes enriched among clonal as well as polyclonal populations of CD8αα+TCRαβ+ Treg cells. mRNAs were isolated from respective CD8αα+ Treg clone (2D11) and lines (XT14 and PL1), and expression of > 50 genes was analyzed by real-time PCR and only expression of some of the most relevant genes is shown. Gene expression from the OVA-reactive CD8αβ+TCRαβ+ OT−1 T cells was used as control. The data were representative of one of two independent experiments and are presented as relative fold change after normalization against internal control gene L32.
Enrichment of ligands and receptors of the tumor necrosis factor superfamily in CD8+ Tregs
To further determine genes involved in immunoregulatory pathways preferentially expressed in CD8αα+ Treg, real-time PCR analysis of genes belonging to the tumor necrosis factor superfamily (Tnfsf) was carried out. Among the 10 Tnfsf genes identified we have found preferential expression of 8 of these genes (see Table 3). Transcripts for receptors Tnfrsf14 (HVEM) and Tnfrsf11b showed 4.9-fold and 4.5-fold enrichment, respectively, while receptor Tnfrsf4 (OX-40) showed a smaller 2.2-fold increase. Five ligands from the Tnf superfamily, including Tnf, Tnfaip1, Tnfsf8 (CD30-L), Tnfsf11 (Rank-L), and Tnfsf14 (Light), were also upregulated (>2.4 fold) in the CD8αα+ Treg population. As shown in Figure 3, Tnf receptor HVEM is expressed at higher levels on the surface of CD8αα+ Treg and has been shown to associated with immune regulatory pathways (30, 31). Interestingly, another potential regulatory molecule the TNF-related apoptosis-inducing ligand (TRAIL), produced by CD8+ T cells to mediate suppression of inflammatory responses (32), is not enriched in CD8αα+ Treg population.
TABLE 3. Differential expression of genes in the Tnf superfamily in CD8αα+ Treg.
| CD8αα vs. CD8αβ |
Gene Name |
Gene Alias | Annotation | Entrez Gene ID |
|---|---|---|---|---|
| 4.89 | Tnfrsf14 | Atar, Hvem, | tumor necrosis factor receptor superfamily, member 14 (herpesvirus entry mediator) |
230979 |
| 4.47 | Tnfrsf11b | Opg, TR1 | tumor necrosis factor receptor superfamily, member 11b (osteoprotegerin) |
18383 |
| 3.28 | Tnfsf14 | HVEML, LIGHT, | tumor necrosis factor (ligand) superfamily, member 14 |
50930 |
| 3.1 | Tnfsf11 | ODF, OPGL, RANKL, |
tumor necrosis factor (ligand) superfamily, member 11 |
21943 |
| 2.87 | Tnfsf8 | CD153, d30l | tumor necrosis factor (ligand) superfamily, member 8 |
21949 |
| 2.46 | Tnf | DIF, Tnfa, | tumor necrosis factor | 21926 |
| 2.36 | Tnfaip1 | Edp1, Tnfip1 | tumor necrosis factor, alpha-induced protein 1 |
21927 |
| 2.21 | Tnfrsf4 | CD134, Ox40 | tumor necrosis factor receptor superfamily, member 4 |
22163 |
| 0.38 | Tnfsf10 | Trail | tumor necrosis factor (ligand) superfamily, member 10 |
22035 |
| 0.21 | Tnfrsf9 | 4-1BB, Cd137 | tumor necrosis factor receptor superfamily, member 9 |
21942 |
Values are expressed as normalized mRNA fold expression between CD8□α+ Treg clone 2D11 and CD8αβ+ T cell clone OT-1 (CD8αα+ vs. CD8αβ+). Data are sorted based on gene expression preference in CD8αα+ Treg populations.
CD8+ Tregs express several NK cell related genes
The microarray gene analysis revealed over expression of several NK cell receptors on CD8αα+ Tregs in comparison to that among conventional CD8αβ+ T cells. We further examined the expression profile of NK cell receptors and molecules acting downstream of these receptors using real-time PCR and flowcytometry. A high enrichment of killer cell activating receptor associated protein DAP12 (Tyrobp) is observed in CD8αα+ Treg when compared to CD8αβ+ Tconv (Figure 4B). CD8αα+ Treg were also enriched with Ly49 family NK receptors as well as CD94. Real-time PCR data revealed a 1.7 to 19-fold increase in Ly49A, Ly49C, Ly49E, Ly49G, Ly49I, Ly49D, CD94, and Ly49F transcripts. Among the preferentially expressed NK receptors, Ly49E showed the greatest degree of enrichment as also shown by flow cytometry analysis (Figure 3B). In contrast with the enrichment of Ly49 family receptors, we have observed diminished mRNA levels for NK1.1 (Klrb1c), Klrb1a, Ly49H, and Nkg2d. The majority of the NK receptors enriched in CD8αα+ Treg are inhibitory receptors, including most of the tested Ly49 family receptors and CD94. In the Ly49 family, all of the enriched receptors are inhibitory, with the exception of Ly49D, which is activating. DAP12 may be either activating or inhibiting depending on the target of regulation (33).
FIGURE 4.


Differential expression profile of some key immune-related transcripts in CD8αα+TCRαβ+ Tregs. mRNAs were isolated from CD8αα+ Treg clone 2D11 and conventional OVA-reactive CD8αβ+ T cell clone OT1. Expression of mRNA for the indicated molecules enriched in CD8αα+ Tregs (A) as well as selected NK-related genes (B) was examined by real-time PCR. The data are representative of one of two independent experiments and are presented as relative fold change after normalization against internal control gene L32.
CD8αα+TCRαβ+ Tregs are enriched in several immunoregulatory molecules/pathways
Both the microarray and real-time PCR data indicate significant enrichment of several regulatory molecules, including CD200 in the CD8αα+ Treg. As shown in figures 2 and 3, real-time PCR and flow cytometry data respectively revealed a considerable increase of up to 198-fold in the transcript levels of the immunosuppressive CD200 molecule (34). In agreement with our earlier observations (14), CD8αα+ Treg were enriched in CD28 transcripts, as shown by real-time PCR. We have also observed an increased transcript level of the CTLA-4 ligand, CD80. The CD8αα+ Treg population also displayed a unique expression pattern of granzymes, with a preferential expression of granzymes D (CTLA-5), E (CTLA-6), and G (CTLA-7). As shown in table 2, granzyme transcripts are increased at least 3.1-fold, with granzyme G showing the greatest degree of enrichment (>10 fold) in CD8αα+ Treg. Interestingly, the three granzymes that showed significant down-regulation in CD8αα+ Treg (up to 447-fold), granzyme A, B and K are cytotoxic effector molecules (35, 36), in agreement with our previous finding of perforin being the principle pathway in CD8αα+ Treg-mediated cytotoxicity (24).
TABLE 2. Differential expression of granzymes in the CTLA (cytotoxic T-lymphocyte-associated protein) family in CD8αα+ Treg.
| CD8αα+ vs. CD8αβ+ |
Gene Name | Gene Alias | Annotation | Entrez Gene ID |
|---|---|---|---|---|
| 9.95 | Gzmg | Ctla7 | granzyme G | 14944 |
| 5.54 | Gzmd | CCP5; Ctla5 | granzyme D | 14941 |
| 3.12 | Gzme | CCP3; Ctla6 | granzyme E | 14942 |
| 0.47 | Gzmb | CCP1, Ctla1 | granzyme B | 14939 |
| 0.007 | Gzmk | granzyme K | 14945 | |
| 0.002 | Gzma | Ctla3, Hf, SE1, TSP1 |
granzyme A | 14938 |
Values are expressed as normalized mRNA fold expression between CD8αα+ Treg clone 2D11 and CD8αβ+ T cell clone OT-1 (CD8αα+ vs. CD8αβ+). Data are sorted based on gene expression preference in CD8αα+ Treg populations.
Differentially expressed transcription factors involved in key pathways
To better understand CD8αα+ Treg usage of cellular and molecular pathways involved in their development and function, we were able to identify 15 transcription factors from microarray gene analysis that are differentially expressed (>5-fold difference) in CD8αα+ Treg. Out of the 15 identified transcription factors, 6 were preferentially upregulated in CD8αα+ Treg, and the rest were down-regulated (Table 4). The transcription factor Rora is a positive regulator of transcription and showed the greatest enrichment (17.7-fold) in CD8αα+ Treg. As opposed to Rora, Mycn is a negative regulator of transcription and showed the most down-regulation in CD8αα+ Treg (57.5-fold). Notably, a protein tyrosine phosphatase encoding gene PTPN22 gene is strikingly downregulated in CD8 αα+ Treg in comparion to conventional T cells. The PTPN22 gene encodes the lymphoid tyrosine phosphatase (LYP), an important negative modulator of TCR-signaling (37, 38). One important regulatory element that was not up-regulated in CD8αα+ Treg was the forkhead transcription factor Fox P3, considered to be the master regulator of the development and function of naturally occurring CD4+CD25+ Treg. This is consistent with our earlier flow cytometry data indicating basal level of FoxP3 expression in TCR-peptide-reactive CD8αα+ and CD4+ Treg cells (4, 14, 21-23, 39).
TABLE 4. Transcription factors differentially expressed in CD8αα+ Treg.
| CD8αα+ vs. CD8αβ+ |
Gene Name |
Gene Alias | Annotation | Entrez Gene ID |
|---|---|---|---|---|
| 17.7 | Rora | Nr1f1 | RAR-related orphan receptor alpha | 19883 |
| 8.4 | Pgr | NR3C3, PR | progesterone receptor | 18667 |
| 8.4 | EST | RIKEN cDNA 2610305D13 gene | 112422 | |
| 6.6 | EST | RIKEN cDNA 4930422I07 gene | 71640 | |
| 5.9 | Onecut2 | Oc2 | one cut domain, family member 2 | 225631 |
| 5.7 | Hmgn1 | Hmg14 | high mobility group nucleosomal binding domain 1 |
15312 |
| 0.12 | Zfp422 | Krox25, Krox26 |
zinc finger protein 422 | 67255 |
| 0.12 | Zfp429 | Rsl2 | zinc finger protein 429 | 72807 |
| 0.09 | Rai14 | Ankycorbin, Norpeg |
retinoic acid induced 14 | 75646 |
| 0.06 | EST | Zfp874 | zinc finger protein 874 | 238692 |
| 0.04 | Tanc2 | tetratricopeptide repeat, ankyrin repeat and coiled-coil containing 2 |
77097 | |
| 0.02 | Ctnnd2 | GT24, NPRAP |
catenin (cadherin-associated protein), delta 2 (neural plakophilin-related arm- repeat protein) |
1501 |
| 0.12 | Basp1 | CAP23, AP22 | brain abundant, membrane attached signal protein 1 |
10409 |
| 0.12 | EST | cDNA sequence BC094916 | 545384 | |
| 0.09 | Mycn | N-myc | v-myc myelocytomatosis viral related oncogene, neuroblastoma derived (avian) |
18109 |
Values are expressed as normalized mRNA fold expression between CD8□α+ Treg clone 2D11 and CD8αβ+ T cell clone OT-1 (CD8αα+ vs. CD8αβ+). Data are sorted based on gene expression preference in CD8αα+ Treg populations.
Discussion
The phenotypic markers as well as potential immunoregulatory molecules expressed by CD8+ Treg populations are poorly understood. Here we have attempted to characterize the phenotype and other potential regulatory features of a recently identified novel population of peripheral, Qa-1-restricted CD8αα+TCRαβ+ regulatory T cells that are involved in controlling autoimmune disease. In this study for the first time we have performed a global gene expression analysis of functional Treg clones and polyclonal lines to analyze differentially expressed markers on CD8αα+ Treg compared to the conventional CD8αβ+ T cells. Our data suggest a unique phenotype of CD8ααTCRαβ+ Tregs in that they are enriched in a number of molecules expressed by NK cells, members of TNF-super family as well as in negative signaling molecules, including CD200.
As mentioned earlier, owing to their low abundance in periphery and to avoid contamination from other non-regulatory T cells, we have used antigen-specific, functional T cell lines and clones of CD8αα+ Tregs and analyzed the microarray and real-time PCR data with a special emphasis on the differentially expressed genes of immunological interest. Treg preferentially express several surface receptors and ligands from the tumor necrosis factor (Tnf) super family. The Tnf receptor HVEM has been shown to exert regulatory effects by interacting with BTLA, which leads to the activation of inhibitory signaling cascade in effector T cells (30). Consistent with its regulatory role, HVEM−/− mice are more susceptibility to MOG-peptide induced EAE (31). Our preliminary data showing a significant inhibition of the suppression in the presence of anti-HVEM antibodies suggest that HVEM may be involved in immune regulation mediated by CD8αα+ Treg. These in vitro findings, along with our previous data showing the ability of CD8αα+ Treg to inhibit pathogenic T cells in vivo during EAE (14, 23) further suggest regulatory role of HVEM+ CD8αα+ Treg. We are currently backcrossing gene-deficient mice to H-2u background to further investigate the role of the HVEM/BTLA pathway in CD8αα+ Treg-mediated immune regulation. It is noteworthy that though several TNFsf members are enriched in the CD8αα+ Treg, Fas (CD95)-Fas-ligand (CD95L) or TRAIL do not appear to be involved in the apoptotic killing mediated by CD8αα+ Treg (40).
Consistent with their role in controlling EAE, CD8αα+ Tregs showed significant enrichment of another important inhibitory cell surface molecule, CD200 (Figure 1 and 4). The CD200/CD200R pathway is known to be capable of delivering a crucial intracellular signal leading to immunosuppression (41). Earlier study showed that antibody-mediated blockade of CD200R leads to an aggravated clinical course of EAE (42). Another study also found significant down-regulation of CD200 in human multiple sclerosis (MS) lesions (43). Collectively these data suggest that CD200 expression on CD8αα+ Treg may play an important role in downregulation of the anti-MBP response in the CNS: for example CD200R-expressing activated microglia can be down-regulated (44). Therefore CD8+ Treg not only will be able to suppress antigen-presenting cells in lymphoid organs but will also be able to suppress microglia activation locally in the CNS for an effective regulation. We are breeding CD200−/− mice onto H-2u background to examine this hypothesis. Interestingly, CD28 and CD80 are also elevated in CD8αα+ Treg population. CD28 and its co-stimulatory molecule CD80 have been shown to be important in maintaining peripheral tolerance in CD8 T cells. In the periphery, a CD28 signal enhances T cell activation and expansion when paired with alloantigens of intermediate avidity. However when TCR ligation exceeds a threshold, a CD28 signal can down-regulate peripheral T cell response by reducing T cell expansion and increasing apoptosis (45). Moreover a CD28 signal was shown to be critical for tolerance induction in CD8+ T cells in the periphery (46).
Another notable feature we have identified here is the enrichment of a unique repertoire of NK receptors by CD8αα+ Treg populations. Interestingly, the most highly enriched NK receptor is an orphan receptor from the Ly49 family, Ly49E. It is known that Ly49E is incapable of reacting with polymorphic MHC class I molecules (47). However, CD8α+ Treg are restricted by the non-classical MHC class Ib molecule Qa-1, so it remains possible that a non-classical class I molecule could be a potential ligand for Ly49E. Also consistent with immunoregulatory properties of CD8αα+ Treg the preferentially expressed NK receptors are predominantly inhibitory, Ly49A, Ly49C, Ly49F and Ly49G (Fig. 4b). However, it is interesting that activating receptor Ly49D is also expressed on Treg population. Since Ly49D is also expressed on T cells in general following activation. Collectively our data suggest that CD8αα+ Treg preferentially express a unique repertoire of inhibitory NK receptors. Notably, a CD8+ regulatory T cell subset expressing the heterodimeric CD8αβ chain has also recently been shown to express inhibitory Ly49 receptors (48, 49). Consistent with their regulatory role, a defect in CD8+ Treg activity in B6-Yaa mutant mice that develops SLE-like disease has been reported (49).
It is notable that similar to the CD8αα+ Treg population described here, a polyclonal population of CD8αα+TCRαβ+ IEL (17) and in vitro generated Thymic CD8αα+TCRαβ+ T cell populations (18) also preferentially express a set of innate-like genes. For example, several members of the inhibitory NK receptors were detected to be preferentially over expressed among a polyclonal CD8αα+ IEL population (17). These genes included Ly49A, Ly49C, Ly49D, Ly49E, Ly49G, Ly49I, 2B4 and CD94. Notably, several genes enriched in thymic cells are also preferentially expressed in CD8αα+ Treg populations, for example, FcEr1g, Keg2, and Kit (18). It has been reported that the TCR repertoire of CD8αα+ IELs is nonrandom and that there is a predominant expression of the TCR Vβ6 and Vβ11 gene segments. Notably, we have found a preferential use of the Vβ6 TCR in our CD8αα+ Treg populations in H-2u mice (14, 23). Furthermore it appears that a subset of IEL may recognize antigens in the context of non-classical MHC molecules and may even possess immune-regulatory ability similar to the peripheral Qa-1-restricted CD8αα+ Treg population (50, 51).
It is also noteworthy that several key differences in gene expression profile exist between CD8αα+ Treg and IEL counterparts: for example genes upregulated in IEL CD8αα+ populations but did not show enrichment in CD8αα+ Treg, include LAG-3, NK1.1, and Nkg2d. Similarly expression of Ccr5, Cxcr3, Ccl5, Lat2, Fgl2, Klrb1a, Xdh, and 2B4 also differed among CD8αα+ Treg vs. in vitro thymic culture-derived CD8αα+TCRαβ+ T cells. Additionally, CD8αα+ Treg showed a unique expression profile for members of the tumor necrosis factor super family, which has yet to be described in CD8αα IEL counterparts. Also several of the granzymes associated with cytotoxic lymphocytes showed significant differential expression in CD8αα+ Treg, which were not illustrated in CD8αα IEL. CD8αα+ Treg use different immune regulatory mechanisms for controlling autoimmunity. CD8αα+ IEL regulate immune responses using cytokines such as IL-10 and TGF-β (17, 51). We have failed to detect significant levels of IL-10 or TGF-β secretion among CD8αα Tregs, but confirmed that IFN-γ was required for their immune control (14, 22, 24). It will be intersting to investigate whether these differences are due to polyclonal nature of the IEL or thymic populations that comprise of both regulatory as well as non-regulatory T cells or whether CD8αα+ Treg represent a unique population of peripheral regulatory lymphocytes.
Protein tyrosine phosphatases have been shown to be able to either upregulate or suppress signaling via the T cell receptor and accordingly have been shown to be involved in autoimmune diseases (37, 38). It is noteworthy that transcripts for one of the important lymphoid tyrosine phosphatase, PTPN22 a potent negative modulator of TCR signaling, are drastically reduced in CD8αα+TCRαβ+ Tregs in comparison to the conventional CD8αβ+TCRαβ+ T cells. In fact a missense single nucleotide polymorphism in PTPN22 has been shown to be associated with a number of autoimmune diseases in humans, icluding type 1 diabetes and lupus (37, 38). Although reduced levels of PTPN22 in CD8αα+ Tregs could either influence their thymic development or their ability to proliferate, it will be interesting to investigate whether there exists any relation to autoimmunity. It is also possible that while negative TCR signaling associated with PTPN22 is required in pathogenic CD8αβ+TCRαβ+ T cells and not in CD8αα+ Tregs whose role is to control autoreactivity.
Notably, the signature transcription factor, FoxP3, a forkhead transcriptional respressor, important for the development and function of CD4+CD25+ Treg cells, is not overexpressed in CD8αα+ Treg populations. These data are consistent with our earlier data showing only low level of expression for FoxP3 among functional CD4+ as well as CD8αα+ Treg cells (4, 14, 21-23). However an important retinoid-related orphan nuclear receptor ROR alpha or NR1F1 is significantly over expressed in CD8αα+ Treg. Interestingly, RORa has been shown to be a negative regulator of the inflammatory response (52). It is interesting that FoxP3 also interacts with Rora leading to inhbition of transcriptional activation mediated by Rora (53).
It is clear from several studies that CD8+ Treg plays immunoregulatory role in EAE and in multiple sclerosis. In addition to the potential negative signaling via CD200/CD200R pathway, it has been shown that CD8+ Treg are able to kill or induce apoptosis in activated target pathogenic T cells (11, 12, 14, 29, 54, 55). We and others have recently shown that the mechanism of killing is dependent upon IFN-γ and perforin molecules (24, 56-61). Collectively, our data suggest that the regulation mediated by CD8αα+TCRαβ+ Treg is efficient as it may not only kill the activated encephalitogenic T cells but also down-regulate antigen-presentation by negatively signaling dendritic cells or microglia populations. These studies are not only important for getting crucial insights into the phenotype of these cells but will form the basis of future investigations into the development and details of molecular mechanism of immune regulation mediated by the CD8+ Treg population.
Acknowledgments
Authors would like to thank Dr. Randle Ware for a critical reading of the manuscript and other members of the Laboratory of Autoimmunity for their kind help.
This work was supported by funding from the National Institutes of Health (R01AI05227), MSNRI, and DNRG to VK.
Footnotes
Publisher's Disclaimer: This is a PDF file of an unedited manuscript that has been accepted for publication. As a service to our customers we are providing this early version of the manuscript. The manuscript will undergo copyediting, typesetting, and review of the resulting proof before it is published in its final citable form. Please note that during the production process errors may be discovered which could affect the content, and all legal disclaimers that apply to the journal pertain.
References
- 1.Powrie F, Mauze S, Coffman RL. CD4+ T-cells in the regulation of inflammatory responses in the intestine. Res Immunol. 1997;148:576–81. doi: 10.1016/s0923-2494(98)80152-1. [In Process Citation] [DOI] [PubMed] [Google Scholar]
- 2.Sakaguchi S. Regulatory T cells: key controllers of immunologic self-tolerance. Cell. 2000;101:455–8. doi: 10.1016/s0092-8674(00)80856-9. [DOI] [PubMed] [Google Scholar]
- 3.Filaci G, Fenoglio D, Indiveri F. CD8(+) T regulatory/suppressor cells and their relationships with autoreactivity and autoimmunity. Autoimmunity. 2011;44:51–7. doi: 10.3109/08916931003782171. [DOI] [PubMed] [Google Scholar]
- 4.Smith TR, Kumar V. Revival of CD8(+) Treg-mediated suppression. Trends Immunol. 2008 doi: 10.1016/j.it.2008.04.002. [DOI] [PubMed] [Google Scholar]
- 5.Braud VM, Allan DS, McMichael AJ. Functions of nonclassical MHC and non-MHC-encoded class I molecules. Curr Opin Immunol. 1999;11:100–8. doi: 10.1016/s0952-7915(99)80018-1. [DOI] [PubMed] [Google Scholar]
- 6.Lindahl KF, Byers DE, Dabhi VM, Hovik R, Jones EP, Smith GP, Wang CR, Xiao H, Yoshino M. H2-M3, a full-service class Ib histocompatibility antigen. Annu Rev Immunol. 1997;15:851–79. doi: 10.1146/annurev.immunol.15.1.851. [DOI] [PubMed] [Google Scholar]
- 7.Pamer EG, Wang CR, Flaherty L, Lindahl KF, Bevan MJ. H-2M3 presents a Listeria monocytogenes peptide to cytotoxic T lymphocytes. Cell. 1992;70:215–23. doi: 10.1016/0092-8674(92)90097-v. [DOI] [PubMed] [Google Scholar]
- 8.Seliger B, Abken H, Ferrone S. HLA-G and MIC expression in tumors and their role in anti-tumor immunity. Trends Immunol. 2003;24:82–7. doi: 10.1016/s1471-4906(02)00039-x. [DOI] [PubMed] [Google Scholar]
- 9.van Hall T, Laban S, Koppers-Lalic D, Koch J, Precup C, Asmawidjaja P, Offringa R, Wiertz EJ. The varicellovirus-encoded TAP inhibitor UL49.5 regulates the presentation of CTL epitopes by Qa-1b1. J Immunol. 2007;178:657–62. doi: 10.4049/jimmunol.178.2.657. [DOI] [PubMed] [Google Scholar]
- 10.Goyos A, Guselnikov S, Chida AS, Sniderhan LF, Maggirwar SB, Nedelkovska H, Robert J. Involvement of nonclassical MHC class Ib molecules in heat shock protein-mediated anti-tumor responses. Eur J Immunol. 2007;37:1494–501. doi: 10.1002/eji.200636570. [DOI] [PubMed] [Google Scholar]
- 11.Correale J, Villa A. Isolation and characterization of CD8+ regulatory T cells in multiple sclerosis. J Neuroimmunol. 2008;195:121–34. doi: 10.1016/j.jneuroim.2007.12.004. [DOI] [PubMed] [Google Scholar]
- 12.Hu D, Ikizawa K, Lu L, Sanchirico ME, Shinohara ML, Cantor H. Analysis of regulatory CD8 T cells in Qa-1-deficient mice. Nat Immunol. 2004;5:516–23. doi: 10.1038/ni1063. [DOI] [PubMed] [Google Scholar]
- 13.Jiang H, Chess L. The specific regulation of immune responses by CD8+ T cells restricted by the MHC class Ib molecule, Qa-1. Annu Rev Immunol. 2000;18:185–216. doi: 10.1146/annurev.immunol.18.1.185. [DOI] [PubMed] [Google Scholar]
- 14.Tang X, Maricic I, Purohit N, Bakamjian B, Reed-Loisel LM, Beeston T, Jensen P, Kumar V. Regulation of immunity by a novel population of Qa-1-restricted CD8alphaalpha+TCRalphabeta+ T cells. J Immunol. 2006;177:7645–55. doi: 10.4049/jimmunol.177.11.7645. [DOI] [PubMed] [Google Scholar]
- 15.Urdahl KB, Sun JC, Bevan MJ. Positive selection of MHC class Ib-restricted CD8(+) T cells on hematopoietic cells. Nat Immunol. 2002;3:772–9. doi: 10.1038/ni814. [DOI] [PMC free article] [PubMed] [Google Scholar]
- 16.Kronenberg M, Gapin L. The unconventional lifestyle of NKT cells. Nat Rev Immunol. 2002;2:557–68. doi: 10.1038/nri854. [DOI] [PubMed] [Google Scholar]
- 17.Denning TL, Granger SW, Mucida D, Graddy R, Leclercq G, Zhang W, Honey K, Rasmussen JP, Cheroutre H, Rudensky AY, Kronenberg M. Mouse TCRalphabeta+CD8alphaalpha intraepithelial lymphocytes express genes that down-regulate their antigen reactivity and suppress immune responses. J Immunol. 2007;178:4230–9. doi: 10.4049/jimmunol.178.7.4230. [DOI] [PubMed] [Google Scholar]
- 18.Yamagata T, Benoist C, Mathis D. A shared gene-expression signature in innate-like lymphocytes. Immunol Rev. 2006;210:52–66. doi: 10.1111/j.0105-2896.2006.00371.x. [DOI] [PubMed] [Google Scholar]
- 19.Jiang H, Chess L. An integrated view of suppressor T cell subsets in immunoregulation. J Clin Invest. 2004;114:1198–208. doi: 10.1172/JCI23411. [DOI] [PMC free article] [PubMed] [Google Scholar]
- 20.Kumar V. Homeostatic control of immunity by TCR peptide-specific Tregs. J Clin Invest. 2004;114:1222–6. doi: 10.1172/JCI23166. [DOI] [PMC free article] [PubMed] [Google Scholar]
- 21.Smith TR, Maricic I, Ria F, Schneider S, Kumar V. CD8alpha(+) dendritic cells prime TCR-peptide-reactive regulatory CD4(+)FOXP3(−) T cells. Eur J Immunol. 40:1906–15. doi: 10.1002/eji.200939608. [DOI] [PMC free article] [PubMed] [Google Scholar]
- 22.Smith TR, Tang X, Maricic I, Garcia Z, Fanchiang S, Kumar V. Dendritic cells use endocytic pathway for cross-priming class Ib MHC-restricted CD8alphaalpha+TCRalphabeta+ T cells with regulatory properties. J Immunol. 2009;182:6959–68. doi: 10.4049/jimmunol.0900316. [DOI] [PubMed] [Google Scholar]
- 23.Tang X, Maricic I, Kumar V. Anti-TCR antibody treatment activates a novel population of nonintestinal CD8 alpha alpha+ TCR alpha beta+ regulatory T cells and prevents experimental autoimmune encephalomyelitis. J Immunol. 2007;178:6043–50. doi: 10.4049/jimmunol.178.10.6043. [DOI] [PubMed] [Google Scholar]
- 24.Beeston T, Smith TR, Maricic I, Tang X, Kumar V. Involvement of IFN-gamma and perforin, but not Fas/FasL interactions in regulatory T cell-mediated suppression of experimental autoimmune encephalomyelitis. J Neuroimmunol. 2010 doi: 10.1016/j.jneuroim.2010.07.007. [DOI] [PMC free article] [PubMed] [Google Scholar]
- 25.Hogquist KA, Jameson SC, Heath WR, Howard JL, Bevan MJ, Carbone FR. T cell receptor antagonist peptides induce positive selection. Cell. 1994;76:17–27. doi: 10.1016/0092-8674(94)90169-4. [DOI] [PubMed] [Google Scholar]
- 26.Bhardwaj V, Kumar V, Geysen HM, Sercarz EE. Degenerate recognition of a dissimilar antigenic peptide by myelin basic protein-reactive T cells. Implications for thymic education and autoimmunity. J Immunol. 1993;151:5000–10. [PubMed] [Google Scholar]
- 27.Kumar V, Bhardwaj V, Soares L, Alexander J, Sette A, Sercarz E. Major histocompatibility complex binding affinity of an antigenic determinant is crucial for the differential secretion of interleukin 4/5 or interferon gamma by T cells. Proc Natl Acad Sci U S A. 1995;92:9510–4. doi: 10.1073/pnas.92.21.9510. [DOI] [PMC free article] [PubMed] [Google Scholar]
- 28.Akimoto M, Cheng H, Zhu D, Brzezinski JA, Khanna R, Filippova E, Oh EC, Jing Y, Linares JL, Brooks M, Zareparsi S, Mears AJ, Hero A, Glaser T, Swaroop A. Targeting of GFP to newborn rods by Nrl promoter and temporal expression profiling of flow-sorted photoreceptors. Proc Natl Acad Sci U S A. 2006;103:3890–5. doi: 10.1073/pnas.0508214103. [DOI] [PMC free article] [PubMed] [Google Scholar]
- 29.Madakamutil LT, Maricic I, Sercarz E, Kumar V. Regulatory T cells control autoimmunity in vivo by inducing apoptotic depletion of activated pathogenic lymphocytes. J Immunol. 2003;170:2985–92. doi: 10.4049/jimmunol.170.6.2985. [DOI] [PubMed] [Google Scholar]
- 30.Tao R, Wang L, Murphy KM, Fraser CC, Hancock WW. Regulatory T cell expression of herpesvirus entry mediator suppresses the function of B and T lymphocyte attenuator-positive effector T cells. J Immunol. 2008;180:6649–55. doi: 10.4049/jimmunol.180.10.6649. [DOI] [PubMed] [Google Scholar]
- 31.Wang Y, Subudhi SK, Anders RA, Lo J, Sun Y, Blink S, Wang J, Liu X, Mink K, Degrandi D, Pfeffer K, Fu YX. The role of herpesvirus entry mediator as a negative regulator of T cell-mediated responses. J Clin Invest. 2005;115:711–7. doi: 10.1172/JCI200522982. [DOI] [PMC free article] [PubMed] [Google Scholar]
- 32.Griffith TS, Kazama H, VanOosten RL, Earle JK, Jr., Herndon JM, Green DR, Ferguson TA. Apoptotic cells induce tolerance by generating helpless CD8+ T cells that produce TRAIL. J Immunol. 2007;178:2679–87. doi: 10.4049/jimmunol.178.5.2679. [DOI] [PubMed] [Google Scholar]
- 33.Turnbull IR, Colonna M. Activating and inhibitory functions of DAP12. Nat Rev Immunol. 2007;7:155–61. doi: 10.1038/nri2014. [DOI] [PubMed] [Google Scholar]
- 34.Shalev I, Wong KM, Foerster K, Zhu Y, Chan C, Maknojia A, Zhang J, Ma XZ, Yang XC, Gao JF, Liu H, Selzner N, Clark DA, Adeyi O, Phillips MJ, Gorczynski RR, Grant D, McGilvray I, Levy G. The novel CD4+CD25+ regulatory T cell effector molecule fibrinogen-like protein 2 contributes to the outcome of murine fulminant viral hepatitis. Hepatology. 2009;49:387–97. doi: 10.1002/hep.22684. [DOI] [PubMed] [Google Scholar]
- 35.Cullen SP, Brunet M, Martin SJ. Granzymes in cancer and immunity. Cell Death Differ. 2010;17:616–23. doi: 10.1038/cdd.2009.206. [DOI] [PubMed] [Google Scholar]
- 36.Jenkins MR, Mintern J, La Gruta NL, Kedzierska K, Doherty PC, Turner SJ. Cell cycle-related acquisition of cytotoxic mediators defines the progressive differentiation to effector status for virus-specific CD8+ T cells. J Immunol. 2008;181:3818–22. doi: 10.4049/jimmunol.181.6.3818. [DOI] [PubMed] [Google Scholar]
- 37.Stanford SM, Mustelin TM, Bottini N. Lymphoid tyrosine phosphatase and autoimmunity: human genetics rediscovers tyrosine phosphatases. Semin Immunopathol. 2010;32:127–36. doi: 10.1007/s00281-010-0201-4. [DOI] [PMC free article] [PubMed] [Google Scholar]
- 38.Bottini N, Musumeci L, Alonso A, Rahmouni S, Nika K, Rostamkhani M, MacMurray J, Meloni GF, Lucarelli P, Pellecchia M, Eisenbarth GS, Comings D, Mustelin T. A functional variant of lymphoid tyrosine phosphatase is associated with type I diabetes. Nat Genet. 2004;36:337–8. doi: 10.1038/ng1323. [DOI] [PubMed] [Google Scholar]
- 39.Tang XL, Smith TR, Kumar V. Specific control of immunity by regulatory CD8 T cells. Cell Mol Immunol. 2005;2:11–9. [PubMed] [Google Scholar]
- 40.Beeston T, Smith TR, Maricic I, Tang X, Kumar V. Involvement of IFN-gamma and perforin, but not Fas/FasL interactions in regulatory T cell-mediated suppression of experimental autoimmune encephalomyelitis. J Neuroimmunol. 2010;229:91–7. doi: 10.1016/j.jneuroim.2010.07.007. [DOI] [PMC free article] [PubMed] [Google Scholar]
- 41.Gorczynski RM. CD200 and its receptors as targets for immunoregulation. Curr Opin Investig Drugs. 2005;6:483–8. [PubMed] [Google Scholar]
- 42.Meuth SG, Simon OJ, Grimm A, Melzer N, Herrmann AM, Spitzer P, Landgraf P, Wiendl H. CNS inflammation and neuronal degeneration is aggravated by impaired CD200-CD200R-mediated macrophage silencing. J Neuroimmunol. 2008;194:62–9. doi: 10.1016/j.jneuroim.2007.11.013. [DOI] [PubMed] [Google Scholar]
- 43.Koning N, Swaab DF, Hoek RM, Huitinga I. Distribution of the immune inhibitory molecules CD200 and CD200R in the normal central nervous system and multiple sclerosis lesions suggests neuron-glia and glia-glia interactions. J Neuropathol Exp Neurol. 2009;68:159–67. doi: 10.1097/NEN.0b013e3181964113. [DOI] [PubMed] [Google Scholar]
- 44.Hoek RM, Ruuls SR, Murphy CA, Wright GJ, Goddard R, Zurawski SM, Blom B, Homola ME, Streit WJ, Brown MH, Barclay AN, Sedgwick JD. Down-regulation of the macrophage lineage through interaction with OX2 (CD200) Science. 2000;290:1768–71. doi: 10.1126/science.290.5497.1768. [DOI] [PubMed] [Google Scholar]
- 45.Yu XZ, Martin PJ, Anasetti C. CD28 signal enhances apoptosis of CD8 T cells after strong TCR ligation. J Immunol. 2003;170:3002–6. doi: 10.4049/jimmunol.170.6.3002. [DOI] [PubMed] [Google Scholar]
- 46.Vacchio MS, Hodes RJ. CD28 costimulation is required for in vivo induction of peripheral tolerance in CD8 T cells. J Exp Med. 2003;197:19–26. doi: 10.1084/jem.20021429. [DOI] [PMC free article] [PubMed] [Google Scholar]
- 47.Natarajan K, Dimasi N, Wang J, Mariuzza RA, Margulies DH. Structure and function of natural killer cell receptors: multiple molecular solutions to self, nonself discrimination. Annu Rev Immunol. 2002;20:853–85. doi: 10.1146/annurev.immunol.20.100301.064812. [DOI] [PubMed] [Google Scholar]
- 48.Kim HJ, Verbinnen B, Tang X, Lu L, Cantor H. Inhibition of follicular T-helper cells by CD8(+) regulatory T cells is essential for self tolerance. Nature. 2010;467:328–32. doi: 10.1038/nature09370. [DOI] [PMC free article] [PubMed] [Google Scholar]
- 49.Kim HJ, Wang X, Radfar S, Sproule TJ, Roopenian DC, Cantor H. CD8+ T regulatory cells express the Ly49 Class I MHC receptor and are defective in autoimmune prone B6-Yaa mice. Proc Natl Acad Sci U S A. 2011;108:2010–5. doi: 10.1073/pnas.1018974108. [DOI] [PMC free article] [PubMed] [Google Scholar]
- 50.Das G, Janeway CA., Jr. Development of CD8alpha/alpha and CD8alpha/beta T cells in major histocompatibility complex class I-deficient mice. J Exp Med. 1999;190:881–4. doi: 10.1084/jem.190.6.881. [DOI] [PMC free article] [PubMed] [Google Scholar]
- 51.Poussier P, Ning T, Banerjee D, Julius M. A unique subset of self-specific intraintestinal T cells maintains gut integrity. J Exp Med. 2002;195:1491–7. doi: 10.1084/jem.20011793. [DOI] [PMC free article] [PubMed] [Google Scholar]
- 52.Delerive P, Monte D, Dubois G, Trottein F, Fruchart-Najib J, Mariani J, Fruchart JC, Staels B. The orphan nuclear receptor ROR alpha is a negative regulator of the inflammatory response. EMBO Rep. 2001;2:42–8. doi: 10.1093/embo-reports/kve007. [DOI] [PMC free article] [PubMed] [Google Scholar]
- 53.Du J, Huang C, Zhou B, Ziegler SF. Isoform-specific inhibition of ROR alpha-mediated transcriptional activation by human FOXP3. J Immunol. 2008;180:4785–92. doi: 10.4049/jimmunol.180.7.4785. [DOI] [PubMed] [Google Scholar]
- 54.Jiang H, Braunstein NS, Yu B, Winchester R, Chess L. CD8+ T cells control the TH phenotype of MBP-reactive CD4+ T cells in EAE mice. Proc Natl Acad Sci U S A. 2001;98:6301–6. doi: 10.1073/pnas.101123098. [DOI] [PMC free article] [PubMed] [Google Scholar]
- 55.Sun D, Qin Y, Chluba J, Epplen JT, Wekerle H. Suppression of experimentally induced autoimmune encephalomyelitis by cytolytic T-T cell interactions. Nature. 1988;332:843–5. doi: 10.1038/332843a0. [DOI] [PubMed] [Google Scholar]
- 56.Braciak TA, Pedersen B, Chin J, Hsiao C, Ward ES, Maricic I, Jahng A, Graham FL, Gauldie J, Sercarz EE, Kumar V. Protection against experimental autoimmune encephalomyelitis generated by a recombinant adenovirus vector expressing the V beta 8.2 TCR is disrupted by coadministration with vectors expressing either IL-4 or -10. J Immunol. 2003;170:765–74. doi: 10.4049/jimmunol.170.2.765. [DOI] [PubMed] [Google Scholar]
- 57.Kumar V, Maglione J, Thatte J, Pederson B, Sercarz E, Ward ES. Induction of a type 1 regulatory CD4 T cell response following V(beta)8.2 DNA vaccination results in immune deviation and protection from experimental autoimmune encephalomyelitis. Int Immunol. 2001;13:835–41. doi: 10.1093/intimm/13.6.835. [DOI] [PubMed] [Google Scholar]
- 58.Kumar V, Sercarz E. Genetic vaccination: the advantages of going naked. Nat Med. 1996;2:857–9. doi: 10.1038/nm0896-857. comment. [DOI] [PubMed] [Google Scholar]
- 59.Kumar V, Sercarz E. Induction or protection from experimental autoimmune encephalomyelitis depends on the cytokine secretion profile of TCR peptide-specific regulatory CD4 T cells. J Immunol. 1998;161:6585–91. [PubMed] [Google Scholar]
- 60.Kumar V, Sercarz E. An integrative model of regulation centered on recognition of TCR peptide/MHC complexes. Immunol Rev. 2001;182:113–21. doi: 10.1034/j.1600-065x.2001.1820109.x. [DOI] [PubMed] [Google Scholar]
- 61.Lu L, Kim HJ, Werneck MB, Cantor H. Regulation of CD8+ regulatory T cells: Interruption of the NKG2A-Qa-1 interaction allows robust suppressive activity and resolution of autoimmune disease. Proc Natl Acad Sci U S A. 2008;105:19420–5. doi: 10.1073/pnas.0810383105. [DOI] [PMC free article] [PubMed] [Google Scholar]