

Summary
Inhibitory projection neurons in the deep cerebellar nuclei (DCN) provide GABAergic input to neurons of the inferior olive (IO) that in turn produce climbing fiber synapses onto Purkinje cells. Anatomical evidence suggests that DCN to IO synapses control electrical coupling between IO neurons. In vivo studies suggest that they also control the synchrony of IO neurons and play an important role in cerebellar learning. Here we provide the first electrophysiological description of the DCN to IO synapse. Remarkably, GABA release was almost exclusively asynchronous, with little conventional synchronous release. Synaptic transmission was extremely frequency dependent, with low-frequency stimulation being largely ineffective. However, due to the prominence of asynchronous release, stimulation at frequencies above 10 Hz evoked steady-state inhibitory currents. These properties seem ideally suited to transform the firing rate of DCN neurons into sustained inhibition that both suppresses the firing of IO cells and regulates the effective coupling between IO neurons.
Keywords: inferior olive, delayed release, GABA, facilitation, inhibition
Introduction
Inhibitory synapses between the deep cerebellar nuclei (DCN) and cells in the inferior olive (IO) regulate the firing of IO neurons that play a central role in motor learning. IO neurons provide an instructive signal for long-term depression of granule cell to Purkinje cell synapses that is thought to be necessary for correcting inappropriate motor output (Ito, 2001; Raymond et al., 1996; Thompson, 2005). Gap-junction coupling between IO neurons promotes synchronous firing in a manner that is thought to allow coordination of cerebellar learning across muscle groups. Inhibition from the DCN regulates the activity of IO neurons and controls the extent of synchronous firing of IO cells (Lang et al., 1996). Despite the importance of this synapse to motor control, nothing was known about the properties of the DCN to IO synapse.
Here we provide the first description of the DCN to IO synapse and find that the properties of this synapse are highly unusual. Most synapses provide rapid and transient currents as a result of the highly synchronous release of neurotransmitter that lasts for just a few milliseconds after action potential invasion (Sudhof and Rizo, 1996). Usually, there is also a small asynchronous component of release (Atluri and Regehr, 1998; Geppert et al., 1994; Goda and Stevens, 1994) that persists for tens to hundreds of milliseconds (Atluri and Regehr, 1998; Barrett and Stevens, 1972; Cohen and Van der Kloot, 1986; Goda and Stevens, 1994; Hefft and Jonas, 2005; Lu and Trussell, 2000; Rahamimoff and Yaari, 1973; Van der Kloot and Molgo, 1994; Zengel and Magleby, 1981; Zucker and Lara-Estrella, 1983), and during low-frequency stimulation asynchronous rates are usually about 1% of synchronous rates (Atluri and Regehr, 1998; Barrett and Stevens, 1972; Chen and Regehr, 1999; Erazo-Fischer et al., 2007; Goda and Stevens, 1994). At some synapses phasic release dominates at low frequencies and asynchronous release becomes important at high frequencies (Hefft and Jonas, 2005; Lu and Trussell, 2000), whereas in one case phasic release is accompanied by sufficient asynchronous glutamate release to evoke prolonged spiking in the postsynaptic target (Iremonger and Bains, 2007). Here we show that the DCN to IO synapse is remarkable in that it lacks a prominent component of phasic release at all frequencies. This is in sharp contrast to most inhibitory synapses in the brain that mediate rapid feedback and feedforward inhibition (Blitz and Regehr, 2005; Gabernet et al., 2005; Lawrence and McBain, 2003; Luna and Schoppa, 2008; Mittmann et al., 2005; Pouille and Scanziani, 2001; Tepper et al., 2008).
At the DCN to IO synapse we find that low-frequency stimulation evokes extremely small, unreliable responses that lack a synchronous component. However, at stimulus frequencies corresponding to firing rates of DCN neurons seen in vivo (20 to 100 Hz) (Gardner and Fuchs, 1975; LeDoux et al., 1998; McDevitt et al., 1987; Rowland and Jaeger, 2005; Thach, 1970), inhibition is powerful as a result of both facilitation and a highly prolonged time course of release. What distinguishes the DCN to IO synapses described here is the extreme domination of asynchronous release at all frequencies. The slowly developing, sustained DCN to IO inhibition appears to be specialized to provide a strong, continuous suppression of the instructive signal provided by climbing fibers and regulate the synchronous firing of IO neurons.
Results
Inhibitory Synapses onto IO Neurons Exhibit Regional Diversity
We compared the synaptic properties of GABAergic synapses onto neurons in three regions of the IO. The IO is divided into the dorsal and ventral principal olives (DPO and VPO), the dorsal and medial accessory olives (DAO and MAO) and various smaller subnuclei including the dorsal cap of Kooy (DCK) (De Zeeuw et al., 1998). The DCK, DAO and DPO have been implicated in the vestibulo-ocular reflex (Alley et al., 1975), eye-blink conditioning (Thompson et al., 1997) and limb and posture movements (Thach et al., 1992), respectively. GABAergic projection neurons within the deep cerebellar and vestibular nuclei appear to provide all of the inhibitory input to the IO. Lesion of these regions rapidly depletes GAD immunoreactivity in the IO (Fredette and Mugnaini, 1991) and it does not appear that GABAergic interneurons are common within the IO (De Zeeuw et al., 1998; Fredette et al., 1992; Nelson and Mugnaini, 1988). Inhibitory projections from a vestibular nucleus to the DCK have been shown to give rise to conventional synaptic currents (Balaban and Beryozkin, 1994; De Zeeuw et al., 1993; Gerrits et al., 1985; Urbano et al., 2006), whereas projections from the DCN to the IO that provide inhibition within the DAO and the DPO have not previously been characterized.
Inhibitory postsynaptic currents (IPSCs) were recorded from excitatory projection neurons within the DCK, DAO and DPO and inhibitory synapses were activated by stimulating with glass pipettes placed in the neuropil (Figure 1A-C). Because subthreshold membrane potential oscillations make it difficult to record synaptic currents from neurons in the IO of older animals, and it is difficult to record from DCK neurons at all in older animals, we initially performed experiments using brain slices from young rats (P12). Synaptic currents were evoked in the presence of glutamate receptor antagonists. Although the chloride reversal potential in unperturbed IO cells is -80 mV (Figure S1), in our experiments we used a high chloride internal solution and the chloride reversal potential was either -20 or 0 mV. All of the synaptic currents recorded in the various regions of the IO were blocked by picrotoxin (50 μM), indicating that they were mediated by GABAA receptors.
Figure 1. Inferior olive (IO) neurons receive GABAergic synapses with unusual slow properties.

A-C, Schematics of slice preparations illustrate recording and stimulation sites within the dorsal cap of Kooy (DCK; A, gray), dorsal accessory olive (DAO; B, gray) and dorsal principal olive (DPO; C, gray) of the IO. D-F, Images of neurons within the DCK (D), DAO (E) and DPO (F). G-H, Representative averaged picrotoxin-sensitive inhibitory synaptic currents (IPSCs) recorded from DCK (G), DAO (H) and DPO (I) neurons evoked by 1 (top, left), 20 (middle) or 50 (bottom) Hz trains of 20 stimuli. Average currents for 1 Hz stimulation are shown (G-I, top, right). J-L, Summary plots of the peak (closed circles) and baseline (open circles) currents for each stimulus for cells collected as in G-I (n = 5 cells per region). Data are normalized to the average peak of the currents during 1 Hz stimulation for each region. Data are means ± SEM.
The appearance of neurons and the synaptic properties differ markedly in different regions of the IO. DCK neurons have a bipolar appearance that differs substantially from the highly branched dendrites of DAO and DPO neurons that tend to curve back toward the soma (Figure 1D-F) (Foster and Peterson, 1986; Urbano et al., 2006). As shown previously, (Urbano et al., 2006) neurons in the DCK receive conventional fast GABAergic synapses (Figure 1G). Trains consisting of 20 stimuli at 1, 20 or 50 Hz evoked synaptic responses that exhibited small stochastic variability in their amplitudes, but inhibitory synapses onto DCK cells neither facilitated nor depressed strongly (Figure 1G). In contrast, IPSCs recorded from DAO and DPO neurons were strongly frequency-dependent. Stimulation at 1 Hz produced very little current (Figure 1H and I, top) while stimulation with 20 or 50 Hz trains produced much larger currents. Responses evoked by high-frequency stimulation had a prominent slow component and did not return to baseline between stimulation (Figure 1H and I). Traces have been aligned by stimulation time resulting in different timescales for each trace. Scale bars are provided for comparison of the time course of responses. The properties of inhibitory responses evoked by trains are summarized by plotting the peak amplitudes of the IPSC following each stimulus in the train (Figure 1J-L, closed circles), and the amplitudes of the synaptic current just prior to stimulation (Figure 1J-L, open circles). The amplitudes are normalized to the IPSC amplitude evoked by 1 Hz stimulation. The lack of use-dependent plasticity in the DCK was apparent (Figure 1J). The prominence of facilitation and the large sustained DC component of the synaptic current during high-frequency stimulation were apparent in both the DAO and the DPO (Figure 1K-L). Previous work has shown that DCK cells lack many of the defining characteristics of IO neurons including low-threshold calcium currents, Ih currents and subthreshold membrane potential oscillations (Urbano et al., 2006). Given the differences in the intrinsic properties of DCK versus DAO and DPO neurons, it is therefore particularly interesting that the GABAergic inputs onto DCK cells also differ greatly from those onto DAO and DPO cells.
Thus, GABAergic synapses in the IO have heterogeneous release characteristics. Most notably DAO and DPO neurons receive unusual strongly facilitating synapses with synaptic currents evoked by high-frequency trains having an exceptionally large sustained component, in contrast to DCK neurons that receive conventional inhibitory synapses.
Inhibitory Synapses in the DPO have Unusual Properties
We went on to determine whether the properties of inhibitory synapses in the DAO and DPO shown in Figure 1 reflect an immature developmental state, or whether they are also present in older animals (P23-25) where forms of learning dependent upon the inferior olive, such as eye-blink conditioning, can be observed (Nicholson and Freeman, 2003). One of the difficulties in studying synapses in the DAO and DPO is that the membrane potential of these cells oscillates and this property becomes more prominent with age (Bleasel and Pettigrew, 1992). Previous work has shown that the low-threshold calcium and Ih currents contribute to this phenomenon (Bal and McCormick, 1997; Llinas and Yarom, 1981a; Llinas and Yarom, 1981b; Llinas and Yarom, 1986). We found that blocking T-type calcium channels (50 μM NiCl) and HCN channels (2 mM CsCl) did not affect inhibitory synaptic currents recorded from young animals, reversibly suppressed subthreshold membrane potential oscillations and thereby allowed us to examine the properties of inhibitory synapses in more mature animals (Figure S2).
Inhibitory synapses onto DPO cells from P23-25 animals were similar to those in young animals. IPSCs onto DPO cells were evoked with 20 stimuli at 1, 2, 5, 10, 20, 50 and 100 Hz (Figure 2A-D). The synapses showed strong facilitation and IPSCs were greatly enhanced as the stimulus frequency was increased. In addition, as the stimulus frequency was increased beyond 5 Hz the transient peak currents evoked by each stimulus were accompanied by a DC shift in the baseline current. Stimulation at 50 and 100 Hz produced currents that were dominated by summation of the responses to individual stimuli (Figure 2). As shown in Figure 2C, when the time courses of the traces between the stimuli are compared the contribution of phasic release is exceedingly small. Thus, although current traces shown in Figure 2A appear to have a phasic component at stimulation frequencies from 1 to 20 Hz, this is an artifact of the compression of the timescale. Thus, as in younger animals, more mature DPO cells receive inhibitory inputs with pronounced facilitation that have an exceptionally large shift in the DC baseline when stimulated at high-frequency. Furthermore, we found that synapses onto cells in the DAO (P23-25) exhibited IPSCs that were similar to those observed in the DPO (n = 4 cells, data not shown).
Figure 2. GABA release onto DPO neurons is unusually frequency-dependent and this characteristic is not developmentally restricted.
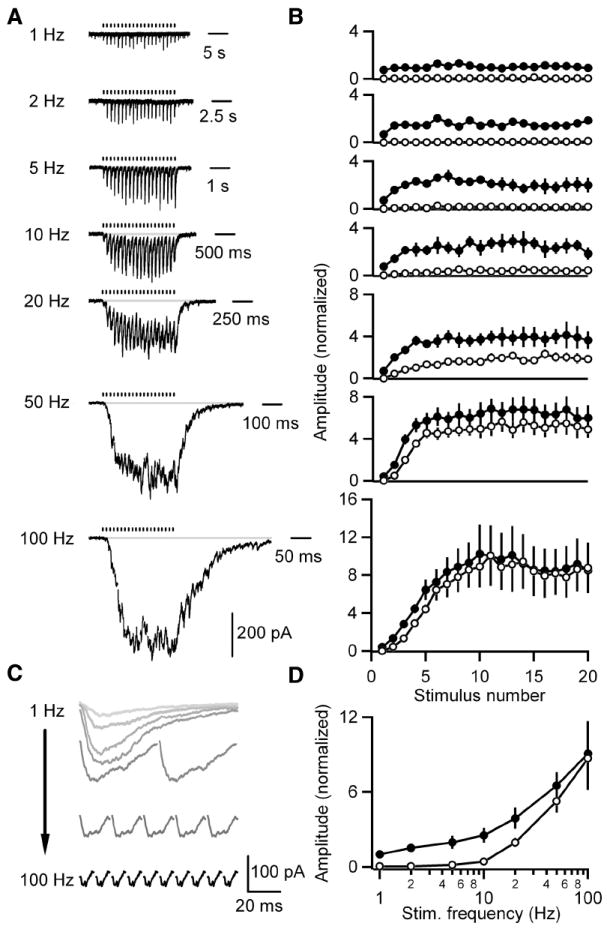
A-D, IPSCs evoked by 1, 2, 5, 10, 20, 50 or 100 Hz trains of 20 stimuli were recorded from DPO neurons in slices from P23-25 rats. T-type calcium and Ih currents were pharmacologically blocked to prevent subthreshold membrane potential oscillations from obscuring IPSCs. A, Representative averaged traces of currents recorded from a DPO cell are shown. Tick marks indicate stimulation times. B, Summary plots of the peak (closed circles) and baseline (open circles) currents for each stimulus normalized to the average peak for 1 Hz stimulation (n = 5 cells) are shown. C, Representative traces of the average evoked IPSC following each of the last ten stimuli from the cell in A are shown. D, A summary plot of the average peak (closed circles) and average baseline (open circles) of the last ten stimuli in the train at each frequency for cells in B. Data are means ± SEM.
Release at Inhibitory Synapses in the DPO is Asynchronous
Several mechanisms could contribute to the properties of the recorded IPSCs. One possibility is that the prominent gap-junction coupling between cells in the IO alters the apparent properties of release. We tested this possibility by examining inhibition in mice without connexin 36, which are known to lack electrical coupling in the IO (Deans et al., 2002; Long et al., 2002). Inhibitory synaptic currents recorded from connexin 36 deficient DPO cells are similar to those recorded in rats (Figure S3), indicating that the slow properties of IPSCs recorded from IO cells do not result from filtering through gap junctions.
Another concern is that the properties of the evoked synaptic currents might arise somehow from stimulation within the IO. We therefore performed experiments in which DCN inputs were activated with a stimulus electrode placed outside of the IO (Figure S4). In these experiments it was necessary to use horizontal slices, which were better suited to preserving the DCN fibers within the slice. We found that IPSCs activated by stimulating outside of the IO have similar properties to those recorded with local stimulation (Figure S4).
It is also possible that prominent asynchronous release might contribute to the observed properties of evoked synaptic currents. Examination of the time course of the average response to many trials of 1 Hz stimulation (Figure 3A, left) suggested that release was not time locked to stimulation. This was even more apparent when the decay τ was compared between these evoked responses (τdecay = 38 ms) and spontaneous IPSCs (τdecay = 6 ms; Figure3A, right). We therefore examined transmission under conditions that allowed us to detect the timing of each evoked quanta. IPSCs were evoked with low-intensity stimulation at 1 Hz for 3 minutes. Individual unitary events had conventional characteristics with fast rise times and fast decay time constants (time to peak = 1.6 ms, τdecay = 6 ms) (Figure 3D, right). Individual quantal events were observed for tens of milliseconds after stimulation (Figure 3B-C). Such asynchronous release has been observed at many other synapses. It is highly unusual, however, that a phasic component of release is not apparent (Figure 3E-G). At most conventional synapses, even those where asynchronous release has been studied, release rates are approximately 100 times higher in the first few milliseconds than they are 10 milliseconds later (Atluri and Regehr, 1998; Barrett and Stevens, 1972; Chen and Regehr, 1999; Erazo-Fischer et al., 2007; Goda and Stevens, 1994). The histogram of the number of events detected as a function of time could be approximated with an exponential decay with a time constant of 32 ms (Figure 3G). Moreover, even when external calcium concentration was increased to 3 mM, the time course of GABA release was unaltered and phasic release was not apparent (Figure S5). Thus, release of GABA onto DPO cells during low-frequency stimulation occurs asynchronously without a phasic component.
Figure 3. GABA release onto DPO neurons is asynchronous.
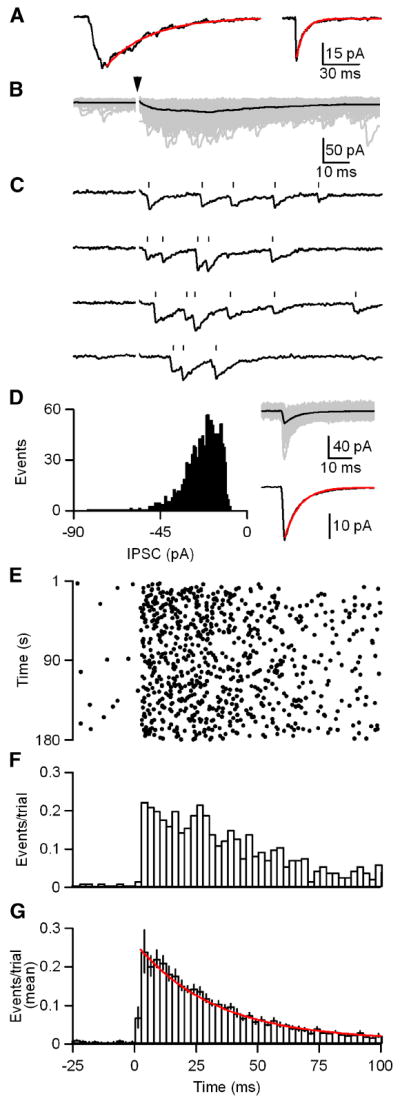
A, Averaged traces from a representative cell in which IPSCs were evoked with 1 Hz stimulation (left) and spontaneous IPSCs (sIPSC; right) were recorded prior to each stimulation trial. 1 Hz stimulation resulted in an IPSC with a τ decay of 38 ms (red; left). The average sIPSC had a τ decay of 6 ms (red; right). B-G, IPSCs were evoked with trains of 180 stimuli at 1 Hz. Stimulus intensity was adjusted to allow identification of unitary events which is possible because events are not time-locked to stimulation. B, Raw traces from a representative cell are shown (gray) with their average (black). Arrowhead indicates stimulation time. C, Consecutive individual trials from B are shown. Tick marks indicate the event times as determined by our analysis routine. D, A histogram (left) of the event amplitudes from B is shown. Raw traces of non-overlapping events from B are shown (gray; D, right, top) with their average (black). The average event is shown (black; D, right, bottom) with an exponential fit to the decay (red; τ decay = 6 ms). E, A raster of the event times for the data in B. F, A histogram of the events per trial for the data in B (bin width = 2.5 ms). G, A summary histogram of experiments (n = 10 cells) as performed in B-F with an exponential fit to the decay (red; τdecay = 32 ms). Data are means ± SEM.
Factors Contributing to Enhancement During Trains
We also examined the mechanism underlying the prominent steady-state component of synaptic current observed during high-frequency trains. IPSCs were stimulated with trains of 20 stimuli at 1, 5, 10, 20, 50 and 100 Hz and the time constant of decay of the IPSC was determined using exponential fits (Figure 4A). The time constant was significantly different at 1 and 5 Hz from 10, 20, 50 and 100 Hz (one factor ANOVA, p<0.05; Figure 4B). The time constant went from from 37 ± 1 ms at 1 and 5 Hz to 68 ± 8 ms at 10, 20, 50 and 100 Hz. This prolongation of the time course of the IPSC contributes to the strong frequency-dependence of this synapse.
Figure 4. GABA release is further slowed during >5 Hz trains.
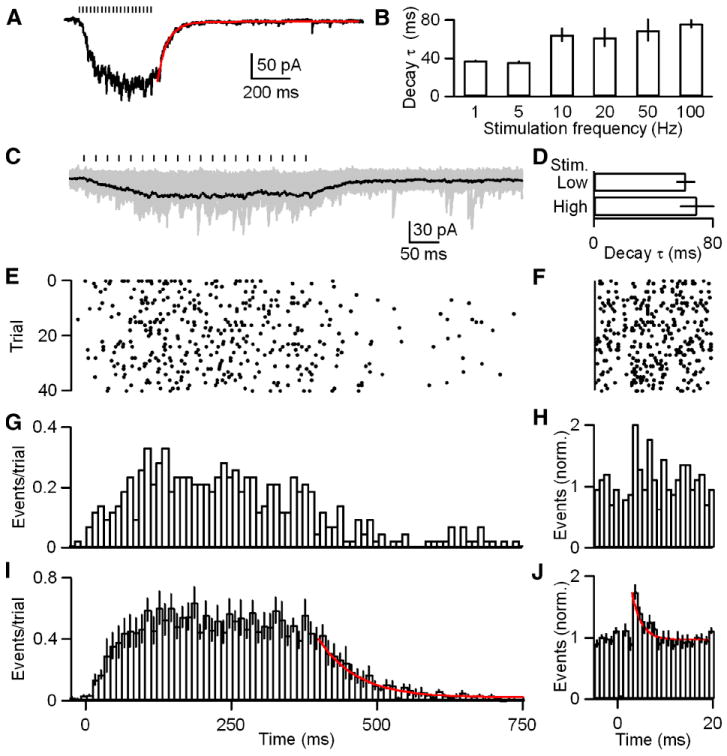
A-B, IPSCs were evoked with trains of 20 stimuli at 1, 5, 10, 20, 50 and 100 Hz. A, Representative averaged trace of 50 Hz trials is provided with an exponential fit to the decay (red; τ decay = 53 ms). B, A bar plot of the decay τ for 1, 5, 10, 20, 50 and 100 Hz trains is shown (n = 5 cells). C-J, IPSCs were evoked with trains of 20 stimuli at 50 Hz. C, Raw traces from a representative cell are shown (gray) with their average (black). Stimulus intensity was adjusted to allow identification of unitary events. Tick marks indicate stimulation times. D, A bar plot of the decay τ for low- and high-intensity stimulation with 50 Hz trains. E, A raster of the event times for the data in C. F, A raster of event times for quanta released during the interstimulus interval for the last ten stimuli during each trial in E (bin widths = 1 ms). G, A histogram of the events per trial for the data in E (bin width = 10 ms). H, A histogram of the event times for F. I, A summary histogram of experiments (n = 6 cells) as performed in C with an exponential fit to the decay (red; τ decay = 65 ms). J, A summary histogram of event times during the interstimulus interval for the last ten stimuli during each trial as in H for the data in I. An exponential fit to the decay (red; τ decay = 2 ms) is provided. Data are means ± SEM.
Two different mechanisms could account for the prolongation of the IPSC decay: (1) GABA could pool and lead to a prolonged extracellular GABA signal or (2) asynchronous release could be further prolonged. Previous studies at other synapses have shown that neurotransmitter pooling can occur during high-frequency, high-intensity stimulation resulting in extracellular spillover and prolongation of synaptic currents (Bergles et al., 1999; Carter and Regehr, 2000; Tzingounis and Wadiche, 2007). This predicts that the prolongation of the time course of IPSC decay following high-frequency trains will be dependent upon the stimulus intensity. Conversely, if the time course of asynchronous release is further prolonged during high-frequency trains, this should be apparent in the timing of individual release events observed following high-frequency stimulation. We distinguished between these two possibilities by examining GABA release during 50 Hz trains. IPSCs were evoked with 20 stimuli and low stimulus intensities were used to allow detection of unitary events (Figure 4C). Representative individual trials are shown in Figure S6. The mean synaptic charge evoked with low-intensity stimulation was 11.3 ± 1.9 pC versus 110.1 ± 21.7 pC for currents evoked with high-intensity stimulation. The decay time course of the average of the low stimulus intensity trains (τdecay = 62 ± 7) was similar to that for high-intensity stimulation (τdecay = 70 ± 12) at this frequency (Figure 4D). Interestingly, similar to events evoked with 1 Hz trains, event times compiled over many trials did not indicate obvious primary phasic release events time-locked to stimulation (Figure 4E, G and I). To more carefully examine whether a phasic release event could be resolved, we compiled the event times immediately following each of the last ten stimuli of each train (Figure 4F, H and J). Interestingly, a very small phasic component (6% of total events) could be resolved (Figure 4J). To determine if a prolongation of the release rate could account for the slowing of currents during 50 Hz trains we fit the decay of the average event time histogram with an exponential fit. We found that the decay of release was roughly double that for 1 Hz stimulation (τdecay = 65 ms versus 32 ms) (Figure 3G and 4I). Thus, stimulation with trains with a frequency of >5 Hz results in IPSCs with a prolonged decay. Furthermore, this prolonged decay results from a further slowing of release at this inhibitory synapse.
Another important property of these synapses is that they exhibit paired-pulse facilitation, consistent with the initial probability of release being low. We examined the time course of facilitation at this synapse using pairs of stimuli with time intervals ranging from 10 ms to 2 seconds (Figure 5A-B). Maximum facilitation (paired-pulse ratio, PPR of 2.6 ± 0.2) occurred for stimuli separated by 100 milliseconds, and considerable facilitation was present even for intervals of 1 second. Even though the magnitude of facilitation was not exceptionally large, facilitation at this synapse was unusually slow to develop and long lasting.
Figure 5. Slow IPSCs show prolonged residual calcium-dependent facilitation.
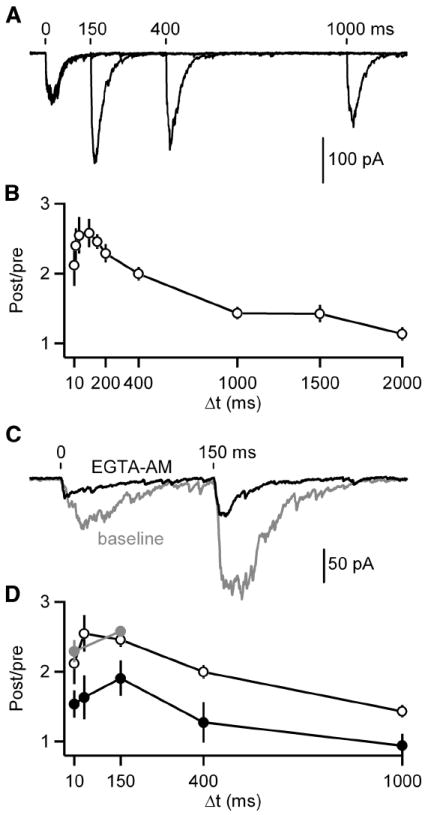
A-B, Pairs of IPSCs were evoked (Δt = 10, 20, 40, 100, 150, 200, 400, 1000, 1500 and 2000 ms). A, Representative averaged traces of paired pulses given with a Δt of 150, 400 and 1000 ms are shown. Tick marks indicate stimulation times. B, A summary plot of paired-pulse ratios (PPR) is provided (n = 5-10 cells per point). C-D, Baseline responses were recorded with a Δt of 10 and 150 ms before application of EGTA-AM (100 μM) after which responses were recorded with a Δt of 10, 40, 150, 400 and 1000 ms. C, Representative averaged traces are shown before (gray) and after (black) EGTA-AM application. Tick marks indicate stimulation times. D, A summary plot of PPRs in control (black open circles; data from B), baseline prior to EGTA-AM (gray) and EGTA-AM (black closed circles; n = 5 cells) conditions. Data are means ± SEM.
Residual calcium is known to play an important role in facilitation at other synapses (Zucker and Regehr, 2002). We examined the role of residual calcium in facilitation at DPO synapses by introducing EGTA into presynaptic boutons. EGTA buffers calcium and limits the duration and amplitude of residual calcium, but because it binds calcium slowly it has little effect on the high local calcium signal near open calcium channels that is responsible for the rapid neurotransmitter release that occurs at most synapses. Bath application of the membrane-permeant form of EGTA (EGTA-AM) led to EGTA accumulation, thereby strongly affecting the properties of transmitter release. As shown for a representative experiment, EGTA (Figure 5C) reduced the magnitude of the initial evoked IPSCs by approximately 50%, while reducing the time to peak. EGTA had an even larger effect on the second IPSC. EGTA greatly attenuated the magnitude of facilitation (Figure 5D). Because our internal recording solution contained the high affinity fast binding calcium chelator BAPTA (20 mM), these effects resulted from changes in presynaptic calcium buffering. Thus, the magnitude of facilitation is dependent upon residual calcium signaling.
The effect of EGTA on the time course of the evoked IPSC (Figure 5C) suggests that residual calcium plays an important role in the asynchronous release of neurotransmitter at this synapse. We examined the time course of evoked transmitter release by examining the effect of EGTA on the timing of unitary events evoked by low-frequency stimulation. IPSCs were evoked at 1 Hz for 3 minutes prior to EGTA-AM application (t = -3 to 0 min). We then applied EGTA-AM and repeated the 1 Hz, 3 minute stimulation 1 minute (t = 1 to 4 min) and 5 minutes (t = 5 to 8 min) after commencing EGTA-AM application. Responses with this timing, but in control conditions were stable (Figure 6A). EGTA did not affect the peak release observed shortly after stimulation (0.27 ± 0.09 events/bin/trial compared to 0.28 ± 0.09 events/bin/trial). In contrast, EGTA decreased the number of late events following stimulation (Figure 6B-D) and the time constant of decay of the averaged histogram of timing of unitary events decreased from 31 to 6 ms (Figure 6D). Thus, the prolonged GABA release during low-frequency trains of presynaptic action potentials is dependent upon residual calcium signaling.
Figure 6. Slow release of GABA results from presynaptic residual calcium signaling.
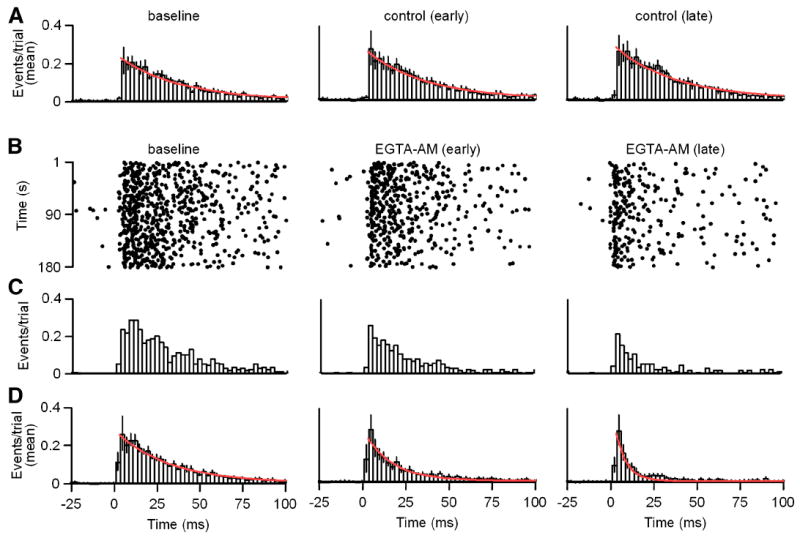
A-D Unitary IPSCs were evoked in response to 1 Hz stimulus trains as in Figure 3. A, Histogram plots of mean event times per trial with exponential fits to the decay (red) are shown in control conditions from Δt = -3-0 minutes (left; τdecay = 35 ms), Δt = 1-4 minutes (middle; τdecay = 34 ms) and Δt = 5-8 minutes (right; τdecay = 35 ms). B-D, Recordings were preformed as in A with EGTA-AM (100 μM) application begun at Δt = 0 minutes. B, Raster plots of event times are shown for a representative example. C, Histogram plots of event times per trial for the data shown in B are provided. D, Histogram plots of mean event times per trial with exponential fits to the decay (red) are shown in baseline conditions from Δt = -3-0 minutes (left; τdecay = 31 ms), and at Δt = 1-4 minutes (middle; τdecay = 16 ms) and Δt = 5-8 minutes (right; τdecay = 6 ms) during EGTA-AM application begun at Δt = 0 minutes as in B-C. Histogram bin widths = 2.5 ms. Data are means ± SEM.
Discussion
Here for the first time we describe the properties of the DCN to IO synapse. The most remarkable aspect of this synapse is that it consists almost exclusively of asynchronous release. As a result of this slow release combined with a low initial probability of release synaptic currents evoked at low-frequency are extremely small. However, at high frequencies summation of quantal events occurs resulting in a prominent current that carries little information regarding the timing of presynaptic activity. These properties seem ideally suited to transform the firing rate of DCN neurons into steady-state synaptic inhibition within the IO.
Release at the DCN to IO Synapse is Almost Exclusively Asynchronous
At all synapses the quantal events have a more rapid rise and decay time than averaged evoked responses largely as a result of asynchrony in the release of neurotransmitter (Chen and Regehr, 1999; Diamond and Jahr, 1995; Isaacson and Walmsley, 1995; Katz and Miledi, 1965). In some circumstances additional prolongation of evoked responses can result from pooling of neurotransmitter (Bergles et al., 1999; Carter and Regehr, 2000; Tzingounis and Wadiche, 2007). Here we see an extreme mismatch between the time course of quantal events and the time course of average evoked responses that can be entirely accounted for by the timing of transmitter release.
In contrast to other synapses, there appears to be no component of synchronous release at stimulus frequencies of 20Hz and below. Furthermore, even when extracellular calcium was elevated to 3 mM, which is expected to provide higher local presynaptic calcium levels that might promote rapid vesicle fusion, there seems to be no contribution from synchronous release for 1 Hz stimulation (Figure S5). This stands in marked contrast to other synapses that have been studied, where both synchronous and asynchronous release are present. The contributions of asynchronous and synchronous release can be characterized by determining for each component either the fractional contribution to overall synaptic charge or the peak release rate. Asynchronous release typically contributes less than 10% of the overall synaptic charge for low-frequency stimulation (Atluri and Regehr, 1998; Chen and Regehr, 1999; Goda and Stevens, 1994), and in one case it has been shown to contribute half of all synaptic charge (Iremonger and Bains, 2007). But because synchronous release is so brief, the differences in the peak release rates are much more pronounced, and the peak rates of synchronous release are typically about 100 times that of asynchronous release (Atluri and Regehr, 1998; Barrett and Stevens, 1972; Chen and Regehr, 1999; Erazo-Fischer et al., 2007; Goda and Stevens, 1994). Thus, the DCN to IO synapse is extraordinary in the lack of a prominent synchronous component of release.
The lack of a prominent synchronous release component is equally as unusual as the exaggerated asynchronous release at this synapse. The molecular mechanisms underlying synchronous and asynchronous release are distinct (Geppert et al., 1994; Nishiki and Augustine, 2004; Saraswati et al., 2007; Xu et al., 2007; Yoshihara and Littleton, 2002). In addition the calcium signals that trigger these phases of release differ: high calcium near open voltage-gated calcium channels triggers synchronous release (Chad and Eckert, 1984; Fogelson and Zucker, 1985; Matthews, 1996; Roberts et al., 1990; Simon and Llinas, 1985), whereas residual calcium signals of tens to hundreds of nanomolar trigger asynchronous release (Zucker and Regehr, 2002). Thus, there are two possible mechanisms for the lack of a prominent synchronous component. One possible reason is that this synapse may lack the calcium sensors involved in synchronous release (Xu et al., 2007). The properties of this synapse are similar to those of synapses in which fast synaptotagmins have been deleted through genetic manipulations (Geppert et al., 1994; Xu et al., 2007). The second possibility is that the molecular machinery is similar to that present at other synapses but that the local calcium signals that drive synchronous release are absent because of strong calcium buffering or because calcium channels and release sites are separated by relatively large distances. The sensitivity of the late synaptic release to slow calcium buffering with EGTA suggests that residual calcium signaling dominates release dynamics at this synapse.
Factors that Contribute to the Frequency-Dependence of Release
Several aspects of this synapse make it particularly well suited to conveying inhibitory responses when DCN neurons fire at frequencies observed in vivo (Gardner and Fuchs, 1975; LeDoux et al., 1998; McDevitt et al., 1987; Rowland and Jaeger, 2005; Thach, 1970). One aspect is the delayed release of neurotransmitter. For 1 Hz stimulation release rates decay with a time constant of 32 ms, and there is no sign of a rapid component of synchronous release. We have shown that when DCN neurons fire with an interspike interval close to this time constant the synaptic currents summate resulting in a DC-like current. This occurs at relatively low frequencies compared to neurons in the auditory system, where neurons fire hundreds of times a second (Lu and Trussell, 2000). This is consistent with the time course of delayed release and summation being matched to each cells firing rate. Another important point is that for high-frequency stimulation the time course of delayed release is further prolonged (Figure 4). Finally, these synapses exhibit robust and long-lasting facilitation that allows synaptic responses to build during trains. Together these factors allow DCN to IO synapses to encode high-frequency stimulation above 20 Hz as relatively steady currents whereas frequencies below 5 Hz produce relatively modest responses.
Although the asynchronous release is dominant at all frequencies at this synapse, during 50 Hz stimulation there is a very small but rapid component of short latency (2 ms), short-lived (3 ms) release (Figure 4J). This is very different behavior than has been described at other synapses where asynchronous release is less prominent at low-frequency and high-frequency stimulation desynchronizes release (Atluri and Regehr, 1998; Hefft and Jonas, 2005; Lu and Trussell, 2000; Scheuss et al., 2007). However, even for 50 Hz stimulation this rapid component of release accounts for only 6% of total release and as a result contributes to only minor fluctuations in current amplitude.
Functional Consequences of Asynchronous Release at Other Synapses
Previous studies have suggested two main functional roles for asynchronous release. First, asynchronous release can prolong the influence of a presynaptic neuron, as in the dentate gyrus where high-frequency stimulation evokes release with an asynchronous component that leads to long-lasting inhibition (Hefft and Jonas, 2005). For excitatory synapses in the hypothalamus, prolonged glutamate release allows brief high-frequency bursts of activity in neurons to trigger prolonged spiking in their targets (Iremonger and Bains, 2007), which may promote peptide release from the target cell. Second, asynchronous release can allow some synapses to function in two distinct ways, where timing matters at low frequency, but where precise timing is unimportant at high frequencies. This is illustrated by an auditory synapse where phasic release is prominent at stimulus frequencies of 50 Hz and below, while asynchronous release dominates above 100 Hz (Lu and Trussell, 2000). This can lead to a relatively smooth inhibitory tone with minimal influence of the precise timing of individual action potentials at high frequencies. Here we describe a synapse where desynchronization of release also appears to be important. However, in contrast to the emergence of asynchrony at high frequencies, at the DCN to IO synapse asynchrony is preserved throughout all activation frequencies and the synapse does not make a transition from phasic to asynchronous release.
Functional Consequences of the DCN to IO Synapse
The properties of the DCN to IO synapses we describe here have important implications for cerebellar processing. Activity in the IO leads to activation of climbing fiber synapses between IO neurons and Purkinje cells in the cerebellar cortex that provides an instructive signal for long-term depression of granule cell to Purkinje cell synapses that is necessary for adaptation of incorrect motor output (Ito, 2001; Raymond et al., 1996; Thompson, 2005). The slowly developing, sustained DCN to IO inhibition appears to be specialized to provide a strong, continuous suppression of climbing fiber activity. This sort of suppression is important in eye-blink conditioning, where DCN to IO inhibition mediates a crucial feedback mechanism by actively suppressing the instructive signal provided by IO activity after learning has occurred (Bengtsson and Hesslow, 2006; Hesslow and Ivarsson, 1996; Kim et al., 1998).
Neurons within the IO fire at very low-frequency and the timing of their firing must be regulated in order to produce appropriate motor learning. DCN synapses influence when IO neurons fire, but several properties of IO neurons and DCN synapses suggest that they must do this in a very different way than conventional fast inhibitory synapses. First, IO neurons have intrinsic properties that suppress burst firing (Urbano et al., 2006), so that there is no need for rapid inhibition. Second, intrinsic interneurons are exceedingly rare within the IO (De Zeeuw et al., 1998; Fredette et al., 1992; Nelson and Mugnaini, 1988) suggesting that rapid feedback and feedforward inhibition do not play an important role in controlling the firing of IO neurons. Finally, as we show here, inhibitory input from the DCN lacks phasic release and is well adapted to controlling IO output in a sustained manner.
Another defining feature of IO neurons is that they are strongly electrically coupled by gap junctions (Llinas et al., 1974; Sotelo et al., 1974). Consequently populations of IO neurons tend to fire synchronously (Bell and Kawasaki, 1972; Sasaki et al., 1989; Welsh et al., 1995), which is thought to allow coordination of cerebellar learning across muscle groups. The observation that the genetic disruption of gap-junction coupling results in deficits in locomotion as well as eye-blink conditioning (Van Der Giessen et al., 2008) suggests that synchronous firing mediated by electrical coupling of IO neurons is crucial to many aspects of cerebellar function. Anatomical and systems-level studies suggest that the DCN to IO synapse plays an important role in regulating the synchronous firing of cells within the IO. The observation that GABAA receptor blockade within the IO promotes synchronous firing of IO neurons in vivo suggests that GABAA receptors normally tend to reduce the extent of gap-junction coupling (Lang, 2002; Lang et al., 1996). The highly unusual ultrastructural arrangement of inhibitory synapses onto IO neurons, in which half of the inhibitory synapses within the IO occur within glomerular structures containing multiple gap-junction-connected dendritic spines (de Zeeuw et al., 1989; de Zeeuw et al., 1990; De Zeeuw et al., 1998), is consistent with inhibitory synapses regulating gap-junction coupling.
The unusual properties of the DCN to IO synapses are therefore important not only for direct inhibition of individual IO cells, it is also likely that they regulate the degree of coupling between IO neurons, thereby regulating their tendency to fire synchronously. The properties of DCN to IO synapses described here suggest that low rates of DCN firing would result in very little inhibition, strong electrical coupling and a high degree of synchronous firing. As the firing rate of neurons in the DCN increases, the inhibition onto IO cells also increases. This would tend to both suppress firing within IO cells and decrease coupling. The slow, sustained inhibition provided by the DCN to IO synapse is well suited to providing a more stable decoupling of IO neurons than transient shunting provided by conventional phasic release. Thus, ironically, it is the prominent asynchronous release at the DCN to IO synapses that may regulate the degree of synchronous firing in IO neurons.
Experimental Procedures
Tissue preparation
Sprague Dawley rats were either transcardially perfused under ketamine/xylazine with an ice cold sucrose solution consisting of (in mM): 82.7 NaCl, 23.8 NaHCO3, 71.2 sucrose, 23.7 glucose, 2.4 KCl, 1.4 NaH2PO4, 6.8 MgCl2 and 0.5 CaCl2 or decapitated under isoflurane anesthesia. Brains were quickly removed and placed in ice cold sucrose solution. The brainstem was isolated and placed on its dorsal surface on an agar block. The agar block was cut so that the brainstem would lean forward ~30 degrees toward the blade when placed upright on the slicing pedestal. 250 μm thick sections containing the IO were cut and transferred to the recording solution that consisted of (in mM): 125 NaCl, 26 NaHCO3, 25 glucose, 2.5 KCl, 1.25 NaH2PO4, 1 MgCl2 and 2 CaCl2. Slices were incubated for 45 minutes at 32°C and then allowed to cool to room temperature. All solutions were bubbled with 95% O2/5% CO2. Experiments were performed at 34-35 °C using an in-line heater (Warner, Hamden, CT). Recording solution flow rates were 3.5-4 ml/minute. P12 rats were used for experiments in Figure 1. IPSCs in Figure 1 represent GABAA receptor mediated currents as a similar trace recorded in picrotoxin (50 μM) was subtracted from each current trace. P23-25 rats were used for all other experiments unless noted. Images of neurons in Figure 1 were collected on a two-photon microscope using Alexa 594 (50 μM) added to an internal recording solution that consisted of (in mM): 135 K methane sulfonate, 10 HEPES, 2 Mg-ATP, 0.4 Na-GTP and 14 phosphocreatine (tris) and was adjusted to ~310 mOsm and pH = 7.3. All procedures involving animals were approved by the Harvard Medical Area Standing Committee on Animals.
Electrophysiology
Whole cell voltage-clamp recordings were obtained from neurons using a Multiclamp 700A (Molecular Devices, Union City, CA). Recording pipettes had a resistance of 1.9-3.2 MΩ when filled with internal recording solution. Cells were held at -70 mV. The internal recording solution for voltage-clamp experiments in Figure 1 consisted of (in mM): 66 Cs methane sulfonate, 38 CsCl, 20 CsBAPTA, 4 CaCl2, 15 HEPES, 0.2 EGTA, 1 MgCl2, 15 TEA-Cl, 2 Mg-ATP, 0.3 Na-GTP, 10 phosphocreatine (tris) and 2 QX-314 and was adjusted to ~315 mOsm and pH = 7.3. The internal recording solution for all other voltage-clamp experiments consisted of (in mM): 110 CsCl, 20 CsBAPTA, 4 CaCl2, 15 HEPES, 0.2 EGTA, 1 MgCl2, 15 TEA-Cl, 2 Mg-ATP, 0.3 Na-GTP, 10 phosphocreatine (tris) and 2 QX-314 and was adjusted to ~315 mOsm and pH = 7.3. IPSCs were evoked in the presence of NBQX (5-10 μM) to block AMPA receptors, R-CPP (5 μM) to block NMDA receptors, CGP 55845 (2 μM) to block GABAB receptors, strychnine (1 μM) to block glycine receptors and AM251 (2 μM) to block CB1 receptors.
Vehicles were balanced across solutions during bath application of pharmacology. DMSO concentrations were below 0.001%. CGP 55845, NBQX, R-CPP, AM251 and picrotoxin were purchased form Tocris Cookson (Ellisville, MO). EGTA-AM, Alexa 488, Alexa 594 and CsBAPTA were purchased from Invitrogen (Carlsbad, CA). All other chemicals were purchased from Sigma (St. Louis, MO). Connexin 36 knock-out mice were kindly provided by Dr. David Paul of Harvard Medical School.
Data Acquisition and Analysis
Recordings were filtered at 3 kHz and sampled at 20 kHz with a 16-bit A/D converter (ITC-18, Instrutech Corp., Port Washington, NY). All analysis was performed using custom macros written in Igor Pro (Wavemetrics, Lake Oswego, OR). Stimulus artifacts were blanked for clarity within all figures. Statistical significance was determined with t-tests and ANOVAs. Student Newman-Keuls tests were used for post-hoc analysis. Statistical significance was defined as p<0.05. All data are expressed as means ± SEM.
Supplementary Material
Acknowledgments
This work was supported by National Institutes of Health Grants R37NS032405 to WGR and T32NS007484 to ARB. We thank M. Antal, M. Carey, J. Crowley, D. Fioravante, C. Hull, M. Myoga and T. Pressler for comments on this manuscript. We thank M. Myoga for help with collection of two-photon images. We thank David Paul for providing connexin 36 knock-out mice.
Footnotes
Publisher's Disclaimer: This is a PDF file of an unedited manuscript that has been accepted for publication. As a service to our customers we are providing this early version of the manuscript. The manuscript will undergo copyediting, typesetting, and review of the resulting proof before it is published in its final citable form. Please note that during the production process errors may be discovered which could affect the content, and all legal disclaimers that apply to the journal pertain.
References
- Alley K, Baker R, Simpson JI. Afferents to the vestibulo-cerebellum and the origin of the visual climbing fibers in the rabbit. Brain Res. 1975;98:582–589. doi: 10.1016/0006-8993(75)90375-3. [DOI] [PubMed] [Google Scholar]
- Atluri PP, Regehr WG. Delayed release of neurotransmitter from cerebellar granule cells. J Neurosci. 1998;18:8214–8227. doi: 10.1523/JNEUROSCI.18-20-08214.1998. [DOI] [PMC free article] [PubMed] [Google Scholar]
- Bal T, McCormick DA. Synchronized oscillations in the inferior olive are controlled by the hyperpolarization-activated cation current I(h) J Neurophysiol. 1997;77:3145–3156. doi: 10.1152/jn.1997.77.6.3145. [DOI] [PubMed] [Google Scholar]
- Balaban CD, Beryozkin G. Organization of vestibular nucleus projections to the caudal dorsal cap of kooy in rabbits. Neuroscience. 1994;62:1217–1236. doi: 10.1016/0306-4522(94)90354-9. [DOI] [PubMed] [Google Scholar]
- Barrett EF, Stevens CF. The kinetics of transmitter release at the frog neuromuscular junction. J Physiol. 1972;227:691–708. doi: 10.1113/jphysiol.1972.sp010054. [DOI] [PMC free article] [PubMed] [Google Scholar]
- Bell CC, Kawasaki T. Relations among climbing fiber responses of nearby Purkinje Cells. J Neurophysiol. 1972;35:155–169. doi: 10.1152/jn.1972.35.2.155. [DOI] [PubMed] [Google Scholar]
- Bengtsson F, Hesslow G. Cerebellar control of the inferior olive. Cerebellum. 2006;5:7–14. doi: 10.1080/14734220500462757. [DOI] [PubMed] [Google Scholar]
- Bergles DE, Diamond JS, Jahr CE. Clearance of glutamate inside the synapse and beyond. Curr Opin Neurobiol. 1999;9:293–298. doi: 10.1016/s0959-4388(99)80043-9. [DOI] [PubMed] [Google Scholar]
- Bleasel AF, Pettigrew AG. Development and properties of spontaneous oscillations of the membrane potential in inferior olivary neurons in the rat. Brain Res Dev Brain Res. 1992;65:43–50. doi: 10.1016/0165-3806(92)90006-i. [DOI] [PubMed] [Google Scholar]
- Blitz DM, Regehr WG. Timing and specificity of feed-forward inhibition within the LGN. Neuron. 2005;45:917–928. doi: 10.1016/j.neuron.2005.01.033. [DOI] [PubMed] [Google Scholar]
- Carter AG, Regehr WG. Prolonged synaptic currents and glutamate spillover at the parallel fiber to stellate cell synapse. J Neurosci. 2000;20:4423–4434. doi: 10.1523/JNEUROSCI.20-12-04423.2000. [DOI] [PMC free article] [PubMed] [Google Scholar]
- Chad JE, Eckert R. Calcium domains associated with individual channels can account for anomalous voltage relations of CA-dependent responses. Biophys J. 1984;45:993–999. doi: 10.1016/S0006-3495(84)84244-7. [DOI] [PMC free article] [PubMed] [Google Scholar]
- Chen C, Regehr WG. Contributions of residual calcium to fast synaptic transmission. J Neurosci. 1999;19:6257–6266. doi: 10.1523/JNEUROSCI.19-15-06257.1999. [DOI] [PMC free article] [PubMed] [Google Scholar]
- Cohen IS, Van der Kloot W. Facilitation and delayed release at single frog neuromuscular junctions. J Neurosci. 1986;6:2366–2370. doi: 10.1523/JNEUROSCI.06-08-02366.1986. [DOI] [PMC free article] [PubMed] [Google Scholar]
- de Zeeuw CI, Holstege JC, Ruigrok TJ, Voogd J. Ultrastructural study of the GABAergic, cerebellar, and mesodiencephalic innervation of the cat medial accessory olive: anterograde tracing combined with immunocytochemistry. J Comp Neurol. 1989;284:12–35. doi: 10.1002/cne.902840103. [DOI] [PubMed] [Google Scholar]
- de Zeeuw CI, Ruigrok TJ, Holstege JC, Jansen HG, Voogd J. Intracellular labeling of neurons in the medial accessory olive of the cat: II. Ultrastructure of dendritic spines and their GABAergic innervation. J Comp Neurol. 1990;300:478–494. doi: 10.1002/cne.903000404. [DOI] [PubMed] [Google Scholar]
- De Zeeuw CI, Simpson JI, Hoogenraad CC, Galjart N, Koekkoek SK, Ruigrok TJ. Microcircuitry and function of the inferior olive. Trends Neurosci. 1998;21:391–400. doi: 10.1016/s0166-2236(98)01310-1. [DOI] [PubMed] [Google Scholar]
- De Zeeuw CI, Wentzel P, Mugnaini E. Fine structure of the dorsal cap of the inferior olive and its GABAergic and non-GABAergic input from the nucleus prepositus hypoglossi in rat and rabbit. J Comp Neurol. 1993;327:63–82. doi: 10.1002/cne.903270106. [DOI] [PubMed] [Google Scholar]
- Deans MR, Volgyi B, Goodenough DA, Bloomfield SA, Paul DL. Connexin36 is essential for transmission of rod-mediated visual signals in the mammalian retina. Neuron. 2002;36:703–712. doi: 10.1016/s0896-6273(02)01046-2. [DOI] [PMC free article] [PubMed] [Google Scholar]
- Diamond JS, Jahr CE. Asynchronous release of synaptic vesicles determines the time course of the AMPA receptor-mediated EPSC. Neuron. 1995;15:1097–1107. doi: 10.1016/0896-6273(95)90098-5. [DOI] [PubMed] [Google Scholar]
- Erazo-Fischer E, Striessnig J, Taschenberger H. The role of physiological afferent nerve activity during in vivo maturation of the calyx of Held synapse. J Neurosci. 2007;27:1725–1737. doi: 10.1523/JNEUROSCI.4116-06.2007. [DOI] [PMC free article] [PubMed] [Google Scholar]
- Fogelson AL, Zucker RS. Presynaptic calcium diffusion from various arrays of single channels. Implications for transmitter release and synaptic facilitation. Biophys J. 1985;48:1003–1017. doi: 10.1016/S0006-3495(85)83863-7. [DOI] [PMC free article] [PubMed] [Google Scholar]
- Foster RE, Peterson BE. The inferior olivary complex of guinea pig: cytoarchitecture and cellular morphology. Brain Res Bull. 1986;17:785–800. doi: 10.1016/0361-9230(86)90090-0. [DOI] [PubMed] [Google Scholar]
- Fredette BJ, Adams JC, Mugnaini E. GABAergic neurons in the mammalian inferior olive and ventral medulla detected by glutamate decarboxylase immunocytochemistry. J Comp Neurol. 1992;321:501–514. doi: 10.1002/cne.903210402. [DOI] [PubMed] [Google Scholar]
- Fredette BJ, Mugnaini E. The GABAergic cerebello-olivary projection in the rat. Anat Embryol (Berl) 1991;184:225–243. doi: 10.1007/BF01673258. [DOI] [PubMed] [Google Scholar]
- Gabernet L, Jadhav SP, Feldman DE, Carandini M, Scanziani M. Somatosensory integration controlled by dynamic thalamocortical feed-forward inhibition. Neuron. 2005;48:315–327. doi: 10.1016/j.neuron.2005.09.022. [DOI] [PubMed] [Google Scholar]
- Gardner EP, Fuchs AF. Single-unit responses to natural vestibular stimuli and eye movements in deep cerebellar nuclei of the alert rhesus monkey. J Neurophysiol. 1975;38:627–649. doi: 10.1152/jn.1975.38.3.627. [DOI] [PubMed] [Google Scholar]
- Geppert M, Goda Y, Hammer RE, Li C, Rosahl TW, Stevens CF, Sudhof TC. Synaptotagmin I: a major Ca2+ sensor for transmitter release at a central synapse. Cell. 1994;79:717–727. doi: 10.1016/0092-8674(94)90556-8. [DOI] [PubMed] [Google Scholar]
- Gerrits NM, Voogd J, Magras IN. Vestibular afferents of the inferior olive and the vestibulo-olivo-cerebellar climbing fiber pathway to the flocculus in the cat. Brain Res. 1985;332:325–336. doi: 10.1016/0006-8993(85)90601-8. [DOI] [PubMed] [Google Scholar]
- Goda Y, Stevens CF. Two components of transmitter release at a central synapse. Proc Natl Acad Sci U S A. 1994;91:12942–12946. doi: 10.1073/pnas.91.26.12942. [DOI] [PMC free article] [PubMed] [Google Scholar]
- Hefft S, Jonas P. Asynchronous GABA release generates long-lasting inhibition at a hippocampal interneuron-principal neuron synapse. Nat Neurosci. 2005;8:1319–1328. doi: 10.1038/nn1542. [DOI] [PubMed] [Google Scholar]
- Hesslow G, Ivarsson M. Inhibition of the inferior olive during conditioned responses in the decerebrate ferret. Exp Brain Res. 1996;110:36–46. doi: 10.1007/BF00241372. [DOI] [PubMed] [Google Scholar]
- Iremonger KJ, Bains JS. Integration of asynchronously released quanta prolongs the postsynaptic spike window. J Neurosci. 2007;27:6684–6691. doi: 10.1523/JNEUROSCI.0934-07.2007. [DOI] [PMC free article] [PubMed] [Google Scholar]
- Isaacson JS, Walmsley B. Counting quanta: direct measurements of transmitter release at a central synapse. Neuron. 1995;15:875–884. doi: 10.1016/0896-6273(95)90178-7. [DOI] [PubMed] [Google Scholar]
- Ito M. Cerebellar long-term depression: characterization, signal transduction, and functional roles. Physiol Rev. 2001;81:1143–1195. doi: 10.1152/physrev.2001.81.3.1143. [DOI] [PubMed] [Google Scholar]
- Katz B, Miledi R. The Measurement Of Synaptic Delay, And The Time Course Of Acetylcholine Release At The Neuromuscular Junction. Proc R Soc Lond B Biol Sci. 1965;161:483–495. doi: 10.1098/rspb.1965.0016. [DOI] [PubMed] [Google Scholar]
- Kim JJ, Krupa DJ, Thompson RF. Inhibitory cerebello-olivary projections and blocking effect in classical conditioning. Science. 1998;279:570–573. doi: 10.1126/science.279.5350.570. [DOI] [PubMed] [Google Scholar]
- Lang EJ. GABAergic and glutamatergic modulation of spontaneous and motor-cortex-evoked complex spike activity. J Neurophysiol. 2002;87:1993–2008. doi: 10.1152/jn.00477.2001. [DOI] [PubMed] [Google Scholar]
- Lang EJ, Sugihara I, Llinas R. GABAergic modulation of complex spike activity by the cerebellar nucleoolivary pathway in rat. J Neurophysiol. 1996;76:255–275. doi: 10.1152/jn.1996.76.1.255. [DOI] [PubMed] [Google Scholar]
- Lawrence JJ, McBain CJ. Interneuron diversity series: containing the detonation--feedforward inhibition in the CA3 hippocampus. Trends Neurosci. 2003;26:631–640. doi: 10.1016/j.tins.2003.09.007. [DOI] [PubMed] [Google Scholar]
- LeDoux MS, Hurst DC, Lorden JF. Single-unit activity of cerebellar nuclear cells in the awake genetically dystonic rat. Neuroscience. 1998;86:533–545. doi: 10.1016/s0306-4522(98)00007-4. [DOI] [PubMed] [Google Scholar]
- Llinas R, Baker R, Sotelo C. Electrotonic coupling between neurons in cat inferior olive. J Neurophysiol. 1974;37:560–571. doi: 10.1152/jn.1974.37.3.560. [DOI] [PubMed] [Google Scholar]
- Llinas R, Yarom Y. Electrophysiology of mammalian inferior olivary neurones in vitro. Different types of voltage-dependent ionic conductances. J Physiol. 1981a;315:549–567. doi: 10.1113/jphysiol.1981.sp013763. [DOI] [PMC free article] [PubMed] [Google Scholar]
- Llinas R, Yarom Y. Properties and distribution of ionic conductances generating electroresponsiveness of mammalian inferior olivary neurones in vitro. J Physiol. 1981b;315:569–584. doi: 10.1113/jphysiol.1981.sp013764. [DOI] [PMC free article] [PubMed] [Google Scholar]
- Llinas R, Yarom Y. Oscillatory properties of guinea-pig inferior olivary neurones and their pharmacological modulation: an in vitro study. J Physiol. 1986;376:163–182. doi: 10.1113/jphysiol.1986.sp016147. [DOI] [PMC free article] [PubMed] [Google Scholar]
- Long MA, Deans MR, Paul DL, Connors BW. Rhythmicity without synchrony in the electrically uncoupled inferior olive. J Neurosci. 2002;22:10898–10905. doi: 10.1523/JNEUROSCI.22-24-10898.2002. [DOI] [PMC free article] [PubMed] [Google Scholar]
- Lu T, Trussell LO. Inhibitory transmission mediated by asynchronous transmitter release. Neuron. 2000;26:683–694. doi: 10.1016/s0896-6273(00)81204-0. [DOI] [PubMed] [Google Scholar]
- Luna VM, Schoppa NE. GABAergic circuits control input-spike coupling in the piriform cortex. J Neurosci. 2008;28:8851–8859. doi: 10.1523/JNEUROSCI.2385-08.2008. [DOI] [PMC free article] [PubMed] [Google Scholar]
- Matthews G. Neurotransmitter release. Annu Rev Neurosci. 1996;19:219–233. doi: 10.1146/annurev.ne.19.030196.001251. [DOI] [PubMed] [Google Scholar]
- McDevitt CJ, Ebner TJ, Bloedel JR. Relationships between simultaneously recorded Purkinje cells and nuclear neurons. Brain Res. 1987;425:1–13. doi: 10.1016/0006-8993(87)90477-x. [DOI] [PubMed] [Google Scholar]
- Mittmann W, Koch U, Hausser M. Feed-forward inhibition shapes the spike output of cerebellar Purkinje cells. J Physiol. 2005;563:369–378. doi: 10.1113/jphysiol.2004.075028. [DOI] [PMC free article] [PubMed] [Google Scholar]
- Nelson BJ, Mugnaini E. The rat inferior olive as seen with immunostaining for glutamate decarboxylase. Anat Embryol (Berl) 1988;179:109–127. doi: 10.1007/BF00304693. [DOI] [PubMed] [Google Scholar]
- Nicholson DA, Freeman JH., Jr Addition of inhibition in the olivocerebellar system and the ontogeny of a motor memory. Nat Neurosci. 2003;6:532–537. doi: 10.1038/nn1042. [DOI] [PMC free article] [PubMed] [Google Scholar]
- Nishiki T, Augustine GJ. Synaptotagmin I synchronizes transmitter release in mouse hippocampal neurons. J Neurosci. 2004;24:6127–6132. doi: 10.1523/JNEUROSCI.1563-04.2004. [DOI] [PMC free article] [PubMed] [Google Scholar]
- Pouille F, Scanziani M. Enforcement of temporal fidelity in pyramidal cells by somatic feed-forward inhibition. Science. 2001;293:1159–1163. doi: 10.1126/science.1060342. [DOI] [PubMed] [Google Scholar]
- Rahamimoff R, Yaari Y. Delayed release of transmitter at the frog neuromuscular junction. J Physiol. 1973;228:241–257. doi: 10.1113/jphysiol.1973.sp010084. [DOI] [PMC free article] [PubMed] [Google Scholar]
- Raymond JL, Lisberger SG, Mauk MD. The cerebellum: a neuronal learning machine? Science. 1996;272:1126–1131. doi: 10.1126/science.272.5265.1126. [DOI] [PubMed] [Google Scholar]
- Roberts WM, Jacobs RA, Hudspeth AJ. Colocalization of ion channels involved in frequency selectivity and synaptic transmission at presynaptic active zones of hair cells. J Neurosci. 1990;10:3664–3684. doi: 10.1523/JNEUROSCI.10-11-03664.1990. [DOI] [PMC free article] [PubMed] [Google Scholar]
- Rowland NC, Jaeger D. Coding of tactile response properties in the rat deep cerebellar nuclei. J Neurophysiol. 2005;94:1236–1251. doi: 10.1152/jn.00285.2005. [DOI] [PubMed] [Google Scholar]
- Saraswati S, Adolfsen B, Littleton JT. Characterization of the role of the Synaptotagmin family as calcium sensors in facilitation and asynchronous neurotransmitter release. Proc Natl Acad Sci U S A. 2007;104:14122–14127. doi: 10.1073/pnas.0706711104. [DOI] [PMC free article] [PubMed] [Google Scholar]
- Sasaki K, Bower JM, Llinas R. Multiple Purkinje Cell Recording in Rodent Cerebellar Cortex. Eur J Neurosci. 1989;1:572–586. doi: 10.1111/j.1460-9568.1989.tb00364.x. [DOI] [PubMed] [Google Scholar]
- Scheuss V, Taschenberger H, Neher E. Kinetics of both synchronous and asynchronous quantal release during trains of action potential-evoked EPSCs at the rat calyx of Held. J Physiol. 2007;585:361–381. doi: 10.1113/jphysiol.2007.140988. [DOI] [PMC free article] [PubMed] [Google Scholar]
- Simon SM, Llinas RR. Compartmentalization of the submembrane calcium activity during calcium influx and its significance in transmitter release. Biophys J. 1985;48:485–498. doi: 10.1016/S0006-3495(85)83804-2. [DOI] [PMC free article] [PubMed] [Google Scholar]
- Sotelo C, Llinas R, Baker R. Structural study of inferior olivary nucleus of the cat: morphological correlates of electrotonic coupling. J Neurophysiol. 1974;37:541–559. doi: 10.1152/jn.1974.37.3.541. [DOI] [PubMed] [Google Scholar]
- Sudhof TC, Rizo J. Synaptotagmins: C2-domain proteins that regulate membrane traffic. Neuron. 1996;17:379–388. doi: 10.1016/s0896-6273(00)80171-3. [DOI] [PubMed] [Google Scholar]
- Tepper JM, Wilson CJ, Koos T. Feedforward and feedback inhibition in neostriatal GABAergic spiny neurons. Brain Res Rev. 2008;58:272–281. doi: 10.1016/j.brainresrev.2007.10.008. [DOI] [PMC free article] [PubMed] [Google Scholar]
- Thach WT. Discharge of cerebellar neurons related to two maintained postures and two prompt movements. I. Nuclear cell output. J Neurophysiol. 1970;33:527–536. doi: 10.1152/jn.1970.33.4.527. [DOI] [PubMed] [Google Scholar]
- Thach WT, Goodkin HP, Keating JG. The cerebellum and the adaptive coordination of movement. Annu Rev Neurosci. 1992;15:403–442. doi: 10.1146/annurev.ne.15.030192.002155. [DOI] [PubMed] [Google Scholar]
- Thompson RF. In search of memory traces. Annu Rev Psychol. 2005;56:1–23. doi: 10.1146/annurev.psych.56.091103.070239. [DOI] [PubMed] [Google Scholar]
- Thompson RF, Bao S, Chen L, Cipriano BD, Grethe JS, Kim JJ, Thompson JK, Tracy JA, Weninger MS, Krupa DJ. Associative learning. Int Rev Neurobiol. 1997;41:151–189. doi: 10.1016/s0074-7742(08)60351-7. [DOI] [PubMed] [Google Scholar]
- Tzingounis AV, Wadiche JI. Glutamate transporters: confining runaway excitation by shaping synaptic transmission. Nat Rev Neurosci. 2007;8:935–947. doi: 10.1038/nrn2274. [DOI] [PubMed] [Google Scholar]
- Urbano FJ, Simpson JI, Llinas RR. Somatomotor and oculomotor inferior olivary neurons have distinct electrophysiological phenotypes. Proc Natl Acad Sci U S A. 2006;103:16550–16555. doi: 10.1073/pnas.0607888103. [DOI] [PMC free article] [PubMed] [Google Scholar]
- Van Der Giessen RS, Koekkoek SK, van Dorp S, De Gruijl JR, Cupido A, Khosrovani S, Dortland B, Wellershaus K, Degen J, Deuchars J, et al. Role of olivary electrical coupling in cerebellar motor learning. Neuron. 2008;58:599–612. doi: 10.1016/j.neuron.2008.03.016. [DOI] [PubMed] [Google Scholar]
- Van der Kloot W, Molgo J. Quantal acetylcholine release at the vertebrate neuromuscular junction. Physiol Rev. 1994;74:899–991. doi: 10.1152/physrev.1994.74.4.899. [DOI] [PubMed] [Google Scholar]
- Welsh JP, Lang EJ, Suglhara I, Llinas R. Dynamic organization of motor control within the olivocerebellar system. Nature. 1995;374:453–457. doi: 10.1038/374453a0. [DOI] [PubMed] [Google Scholar]
- Xu J, Mashimo T, Sudhof TC. Synaptotagmin-1, -2, and -9: Ca(2+) sensors for fast release that specify distinct presynaptic properties in subsets of neurons. Neuron. 2007;54:567–581. doi: 10.1016/j.neuron.2007.05.004. [DOI] [PubMed] [Google Scholar]
- Yoshihara M, Littleton JT. Synaptotagmin I functions as a calcium sensor to synchronize neurotransmitter release. Neuron. 2002;36:897–908. doi: 10.1016/s0896-6273(02)01065-6. [DOI] [PubMed] [Google Scholar]
- Zengel JE, Magleby KL. Changes in miniature endplate potential frequency during repetitive nerve stimulation in the presence of Ca2+, Ba2+, and Sr2+ at the frog neuromuscular junction. J Gen Physiol. 1981;77:503–529. doi: 10.1085/jgp.77.5.503. [DOI] [PMC free article] [PubMed] [Google Scholar]
- Zucker RS, Lara-Estrella LO. Post-tetanic decay of evoked and spontaneous transmitter release and a residual-calcium model of synaptic facilitation at crayfish neuromuscular junctions. J Gen Physiol. 1983;81:355–372. doi: 10.1085/jgp.81.3.355. [DOI] [PMC free article] [PubMed] [Google Scholar]
- Zucker RS, Regehr WG. Short-term synaptic plasticity. Annu Rev Physiol. 2002;64:355–405. doi: 10.1146/annurev.physiol.64.092501.114547. [DOI] [PubMed] [Google Scholar]
Associated Data
This section collects any data citations, data availability statements, or supplementary materials included in this article.